Abstract
Tin dioxide (SnO2) has recently been recognized as an excellent electron transport layer (ETL) for perovskite solar cells (PSCs) due to its advantageous properties, such as its high electron mobility, suitable energy band alignment, simple low-temperature process, and good chemical stability. In this work, nitrogen-doped graphene quantum dots (N-GQDs) were prepared using a hydrothermal method and then used to fabricate N-GQD:SnO2 nanocomposite ultrathin films. N-GQD:SnO2 nanocomposite ultrathin films were investigated and applied as electron transport layers in planar PSCs. The presence of N-GQDs with an average size of 6.2 nm in the nanocomposite improved its morphology and reduced surface defects. The excitation–emission contour map indicated that the N-GQDs exhibited a remarkably enhanced light-harvesting capability due to the possibility of absorbing UV light and producing emissions in the visible range. The quenching of photoluminescence spectra showed that the N-GQDs in nanocomposite ultrathin films improved electron extraction and reduced charge recombination. As a result, the power conversion efficiency (PCE) of our planar PSCs fabricated with the optimized N-GQD:SnO2 nanocomposite electron transport layer was improved by 20.4% over pristine SnO2-based devices.
1. Introduction
Perovskite solar cells (PSCs) have rapidly become a leading next-generation photovoltaic technology because of their excellent photovoltaic properties, high efficiency, cost-effective manufacturing process via solution processing, light weight, flexibility, and integration with architecture [1,2,3,4,5,6,7]. To improve power conversion efficiency (PCE), various strategies, including compositional optimization, dopant engineering, and chemical interfacial passivation treatment, have been developed to reduce the charge recombination in PSCs [8,9,10]. For example, Zhu et al. added 2,5-thiophenedicarboxylic acid (TDCA) to perovskite films to passivate unsaturated Pb2+ defects and promote perovskite crystal orientation growth, thus enhancing the efficiency of the modified PSCs to 22.85% [11]. In another reported work, Gong et al. used the synergistic effect of fluorine (F) and sulfonyl (S=O) functional groups to stabilize chemical interaction between potassium bis (fluorosulfonyl) imide (KFSI) molecules and perovskite to achieve highly efficient PSCs of 24.17% [12]. In addition, current advancements in perovskite solar cells have concentrated on materials and device structure design development [13,14,15]. Among potential device structures, planar perovskite solar cells (p-PSCs) have attracted considerable attention due to their simple device architecture and straightforward manufacturing process [16,17]. The first planar-type perovskite solar cell with a PCE of 15.4% was discovered by Snaith and co-workers in 2013 [18].
In a typical p-PSC structure, the perovskite layer is stacked between planar thin films of the electron transport layer (ETL) and the hole transport layer (HTL) [19,20]. Various strategies have been utilized to increase the photovoltaic properties of planar PSCs, including high-quality perovskite crystal growth, efficient charge transport layers, and interfacial passivation for charge transfer enhancement at the heterojunction [21]. The electron transport layer (ETL), which facilitates electron extraction from the perovskite active layer to the transparent conductive oxide electrode, plays an essential role in planar PSCs [22].
Many electron transport materials have been studied for application in perovskite solar cells, such as TiO2, ZnO, SnO2, WO3, BaSnO3, SrTiO3, Zn2SnO4, CdS, TiS2, SnS2, and so on [23,24,25,26,27,28]. Among these, TiO2 is the most used in perovskite solar cells, due to developments inherited from research on dye-sensitized solar cells (DSSCs) [29]. However, TiO2 has slow electron mobility (about 0.1–4 cm2 V−1 s−1), requires high-temperature processing (annealing temperatures at 400–450 °C), and has strong photocatalytic activity in the ultraviolet region, which impacts device performance and stability [21,30]. Thus, TiO2 needs to be replaced by another, more suitable n-type metal oxide layer as an ETL to allow further development for commercial applications [31,32].
Recently, a SnO2 ETL has been considered a wonderful alternative choice to replace conventional TiO2 ETLs, thanks to its superior electron mobility, very high transmittance, suitable energy level, and ease of fabrication at low temperatures [33,34]. In addition, SnO2 exhibits excellent chemical stability and less photocatalytic activity in comparison with TiO2, allowing it to improve the stability of PSCs [34]. Thin, compact SnO2 films have been demonstrated to be especially good candidates for planar PSCs, which can be easily fabricated using a solution-processed method at low temperatures [17,21,34]. Planar PSCs using a SnO2 ETL have achieved a power conversion efficiency of 25.8%, which is a state-of-the-art PCE for planar single-junction PSCs [35]. However, SnO2 ETLs made using a low-temperature solution-processed approach still have the large densities of trap states, leading to inefficient charge transfer and unfavorable recombination at the defective interface between ETLs and perovskite layers [26]. Therefore, significant efforts have been made to improve the optoelectronic properties of SnO2, thus enhancing device performance [36,37,38]. The properties of ETLs have been modified by doping them with carbon-based nanomaterials such as carbon nanodots, graphene, or graphene quantum dots (GQDs), providing an effective strategy for adjusting the optical and electron transfer properties of ETLs [39,40,41]. Nitrogen-doped graphene quantum dots (N-GQDs) are derivatives of graphene quantum dots, which have a unique quantum confinement and size effect and have thus attracted increasing interest as a promising candidate in photoelectric sensing and various photovoltaic application prospects [42,43,44].
In this work, we synthesized nitrogen-doped graphene quantum dots (N-GQDs) using a hydrothermal method. N-GQD:SnO2 nanocomposite ultrathin films were prepared via spin-coating a SnCl2 precursor solution mixed with N-GQDs and then annealing it in air to complete the SnO2 oxidation. The as-prepared N-GQD:SnO2 nanocomposite ultrathin films were characterized and applied as electron transport layers in planar PSCs. The results indicate that N-GQDs can play a critical role in increasing light-harvesting capability and facilitating electron separation from the perovskite halide layer to the conductive electrode, leading to improved power conversion efficiency (PCE) in planar perovskite solar cells (p-PSCs).
2. Materials and Methods
2.1. Preparation of Nitrogen-Doped Graphene Quantum Dots
N-GQDs were synthesized from pyrene via a hydrothermal method, using urea as the source of doping nitrogen following a previous report [42]. Firstly, a mixture of 2 g pyrene (98%, HPLC) in 160 mL of HNO3 (68%) was refluxed at 80 °C and stirred for 12 h. Then, the mixture was cooled to room temperature, diluted in deionized water, and filtered through a 0.22 mm microporous membrane to remove the acid. Yellow 1,3,6-trinitropyrene was dispersed in a 0.8 wt.% NaOH solution and 0.2 M of urea was added. The suspension was transferred to a Teflon-lined autoclave and heated at 200 °C for 10 h. The product was then filtered through a 0.22 mm membrane to remove insoluble carbon products. The N-GQD powder was collected by adding ethanol to the solution and centrifuged three times at 5000 rpm for 5 min. The powder was then dried for further use.
2.2. Preparation of Nitrogen-Doped Graphene Quantum Dots Incorporated into SnO2 Ultrathin Films
SnCl2•H2O was dissolved in absolute ethanol to produce 1 M precursor solution. Next, we mixed N-GQDs into the precursor solution at mass ratios of 0%, 1%, 2%, and 3% and magnetically stirred for at least 2 h. Then, the solutions were ultra-sonicated for 1 h to achieve homogeneity. To prepare the N-GQD:SnO2 nanocomposite ultrathin films, we dropped the precursor solution onto the cleaned FTO or glass substrates, which were then spin-coated at 4000 rpm for 30 s and heated on a hot plate at 180 °C for 1 h. The samples were labeled as S0, S1, S2, or S3 according to the N-GQD ratios of 0%, 1%, 2%, and 3% by weight, respectively.
2.3. Device Fabrication
The FTO substrates were etched using a laser fiber Elip-Platium-RE-30 and cleaned with deionized water, ethanol, and acetone. Before use, the substrates were treated with plasma cleaner for 10 min. The SnO2 and N-GQD:SnO2 nanocomposite precursor solutions were spin-coated at 4000 rpm for 30 s and heated on a hot plate at 180 °C for 1 h to form the ETLs. A mixed-cation lead halide perovskite precursor solution was prepared by dissolving FAI (1 M), PbI2 (1.1 M), MABr (0.2 M), and PbBr2 (0.2 M) in an anhydrous DMF:DMSO mixture at a volume ratio of 4:1. Then, appropriate amounts of stock solution comprising 1.5 M of CsI in DMSO were added to the mixed solution to obtain the desired triple-cation Cs/FA/MA perovskite precursor solution. To prepare the perovskite layer, 70 μL of precursor solution was dropped on the ETL/FTO substrate and spin-coated according to an anti-solvent dripping technique with the following steps: the precursor solutions were allowed to rest on substrates for 8 s; then, they were spin-coated at 1200 rpm for 17 s, followed by acceleration up to 6000 rpm for 20 s. Finally, 100 mL of chlorobenzene as an anti-solvent was quickly added dropwise onto the center of the substrate 10 s before the end of the spinning process. After spin-coating the precursor solution, the substrates were transferred to hot plates and heated at 100 °C for 60 min. After cooling to room temperature, a solution of spiro-OMeTAD containing additives of lithium bis(trifluoromethylsulphonyl)imide/acetonitrile and 4-tert-butyl pyridine was spin-coated on top of the perovskite film following a two-step spincoating process (1000 rpm for 10 s and 4000 rpm for 30 s) to form the HTLs. Finally, a gold electrode was thermally evaporated onto the HTM layer to obtain the planar PSCs, with a device configuration of glass/FTO/N-GQD:SnO2/perovskite/Spiro-OMeTAD/Au. The active area of the cell was 1 × 1 cm2. All device processing except for the vacuum deposition of gold electrodes was carried out under ambient air conditions and did not require an inert gas atmosphere.
2.4. Characterization
The morphology and structure of the samples were investigated using field-emission scanning electron microscopy (FESEM, Hitachi S-4800, Japan) and a high-resolution transmission electron microscope (HRTEM, JEOL JEM-2100, Japan). The crystalline phase was identified using an X-ray diffractometer with CuKα as the radiation source: λ = 1.5406 Å (XRD, Bruker D8-Advance, Germany). Transmittance spectra were measured using a UV1800 spectrophotometer in the wavelength range from 300 to 850 nm at room temperature. The steady-state photoluminescence (PL) spectra were measured using a Fluorolog 322 system (Horiba Jobin–Yvon, Japan). The PL mapping measurement was carried out from 300 to 750 nm, corresponding to the excitation wavelengths from 240 to 300 nm, using a fluorescence spectrometer (Horiba Duetta, Japan). Fourier transform infrared spectroscopy (FTIR) measurements were taken using a Fourier transform infrared spectroscope (FTIR Nicolet iS10, Thermo Scientific, USA) with wavenumbers ranging from 4000 to 500 cm−1. The electrical properties of the N-GQD:SnO2 nanocomposite films and devices were recorded with a Keithley 2400 source. Perovskite solar cells were investigated with a light intensity of 1 sun using AM1.5 G solar simulator (Newport Oriel, USA). The electrochemical impedance (EIS) of the devices was measured using an Autolab PGSTAT302N instrument, and the EIS spectra were fitted with the Nova 2.1.6 software. External quantum efficiency (EQE) measurements were tested with IQE-200B system (Newport Oriel, USA).
3. Results and Discussion
High-resolution transmission electron microscopy (HRTEM) was used to investigate the shape and size of the synthesized N-GQDs. Figure 1 shows HRTEM micrographs of the N-GQDs synthesized from pyrene at different magnifications, confirming the monodisperse and spherical shape, with an average diameter of 6.2 nm. As can be seen from highest-resolution HRTEM micrograph in Figure 1c, the N-GQDs were highly crystallized with a lattice spacing of 0.23 nm, corresponding to the (1 1 0) plane of these N-GQDs, which was slightly larger than that of bulk graphite (0.21 nm). This was probably due to the insertion of N atoms into the hexagonal carbon matrix [42,45].
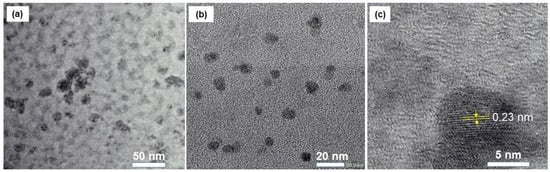
Figure 1.
HR-TEM images of synthesized nitrogen-doped graphene quantum dots at different magnifications. From left to right, the scale bars are 50 nm (a), 20 nm (b), and 5 nm (c).
The top-view and cross-sectional FE-SEM images of the N-GQD:SnO2 nanocomposite ultrathin films with N-GQD ratios of 0% (S0), 1% (S1), 2% (S2), and 3% (S3) are shown in Figure 2, respectively. From the surface images of the samples shown in Figure 2, the films were observed to be uniform, condensed, and fully covered on the FTO substrates. The cross-sectional SEM image of the film samples in the inset show that these films had good contact with the substrate and that the thickness of the N-GQD-doped films slightly increased from 41 nm to 50 nm. The introduction of 2% optimized N-GQDs into SnO2 ultrathin films led to homogeneousness, reducing the roughness of the surface and suppressing the appearance of pinholes. When the N-GQD content in SnO2 films exceeded 3%, the film thickness increased and the morphology of the N-GQD-doped SnO2 film showed aggregation and inhomogeneity.
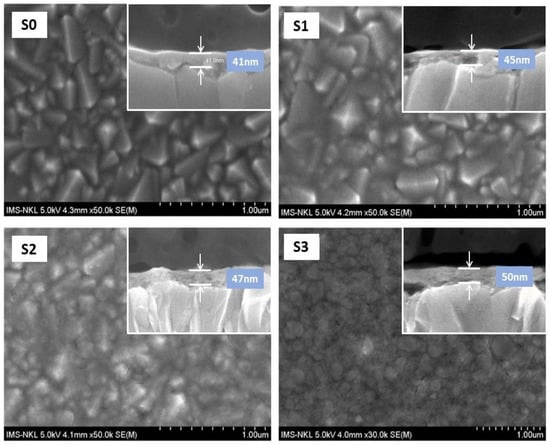
Figure 2.
Top-view and cross-sectional view (inset) FESEM images of N-GQD:SnO2 nanocomposite ultrathin films coated on FTO substrates. (S0–S3) samples had N-GQD ratios of 0%, 1%, 2%, and 3%, respectively.
Figure 3 shows the X-ray diffraction patterns of N-GQDs and N-GQD:SnO2 nanocomposite ultrathin films with N-GQD ratios of 0% (S0), 1% (S1), 2% (S2), and 3% (S3) coated on glass substrates. From the diagram, a wide peak around 25° was observed in the XRD pattern of N-GQDs, which coincided with the (0 0 2) plane of graphitic carbon [46]. Additionally, a weak peak at around 28.9° was observed, which may have been the result of a few layers of graphene dots [47]. It can be seen that the XRD patterns of N-GQD:SnO2 nanocomposite ultrathin films had the same shape, and no new peaks appeared after doping them with N-GQDs. In all samples, a broad diffraction peak of about 26.7° was observed, while the small peak at 55° corresponds to the (1 1 0) and (2 2 0) planes, which are indexed to the tetragonal structure of SnO2 nanoparticles according to JCPDS card no. 41-1445 [48]. When N-GQDs were doped with SnO2, the samples also had no new peaks, likely due to the low content and relatively low diffraction intensity of N-GQDs [49]. The absence of sharp peaks in the XRD patterns of all samples could be related to the small crystallite size of SnO2 nanoparticles and the disordered structure of N-GQDs.
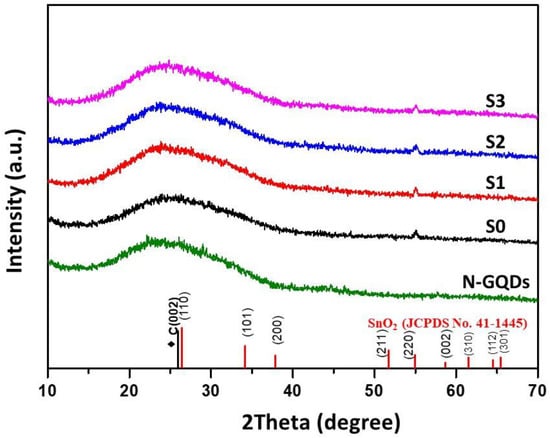
Figure 3.
XRD patterns of N-GQDs and N-GQD:SnO2 nanocomposite ultrathin films with N-GQD ratios of 0% (S0), 1% (S1), 2% (S2), and 3% (S3) coated on glass substrates. The lines at the bottom of the figure denote the standard diffraction patterns of SnO2 (JCPDS card No.41-1445) and graphitic carbon (marked in black color) as references.
The surface state of the N-GQD:SnO2 nanocomposite layer was further studied using Fourier transform infrared spectroscopy (FTIR). The FTIR spectra of pristine SnO2 and N-GQD:SnO2 nanocomposite ultrathin films are shown in Figure 4. For the pristine SnO2 sample (S0), the characteristic peaks of 940 and 581 cm−1 were assigned to the Sn–O and O–Sn–O stretching and bending modes of SnO2, respectively [50]. For the N-GQD:SnO2 nanocomposite samples, apart from the absorption peaks of SnO2, the absorption peaks for N-GQDs at ~3400 cm−1, 1561 cm−1, and 1396 cm−1 were assigned to the O–H stretching and C=C and C–N vibrations [51]. It is notable that the characteristic peak of Sn–O in the N-GQD:SnO2 nanocomposite samples was clearly smaller than that of the pristine SnO2 sample. It is clear that N-GQDs can act as oxidizing agents for SnO2, oxidizing the Sn in SnO2 from Sn2+ to Sn4+ and allowing oxygen vacancies in SnO2 films to be reduced. Based on FTIR analysis, N-GQDs filled the intrinsic defect traps of SnO2 ultrathin films and passivated the surface defects with hydroxyl (O–H) and nitrogenous (C–N and N–H) functional groups, thus helping to increase interfacial charge transfer from perovskite to the electron transport layer. These findings agree with a previous study by Yifang Wang and colleagues showing that the hydroxyl and nitrogenous functional groups of nitrogen-doped carbon dots can promote the formation of hydrogen bonds with the under-coordinated iodine ions on perovskite grains. Consequently, an improvement in power conversion efficiency in PSCs is achieved [52].
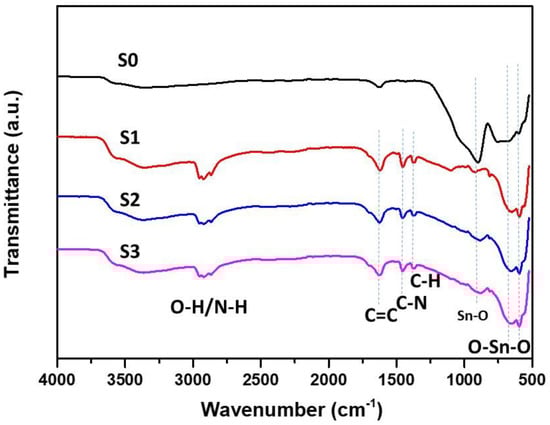
Figure 4.
FTIR spectra of N-GQD:SnO2 nanocomposite ultrathin films with N-GQD ratios of 0% (S0), 1% (S1), 2% (S2), and 3% (S3).
The optical transmittance spectra of pristine SnO2 and N-GQD:SnO2 nanocomposite ultrathin films with different N-GQD ratios are shown in Figure 5. With the increase in the N-GQD ratio, the transmittance of N-GQD:SnO2 nanocomposite ultrathin films decreased over the entire wavelength region. The transmittance strongly decreased in the UV region under the wavelength of 300 nm due to the presence of N-GQDs. The decreased transmittance of N-GQD:SnO2 nanocomposite ultrathin films over the entire wavelength region was attributed to the increase in the film thickness from 41 nm to 50 nm and the improved absorption and scattering effects of N-GQDs. The decreased transmittance results reconfirm the increased thickness of the N-GQD:SnO2 nanocomposite films seen in the cross-sectional SEM image in Figure 2.
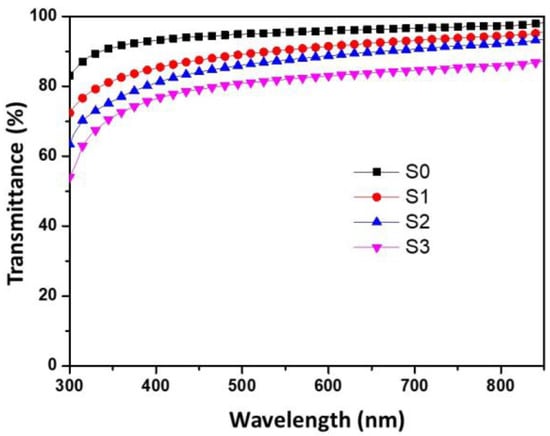
Figure 5.
Transmittance spectra of N-GQD:SnO2 nanocomposite ultrathin films with N-GQDs ratios of 0% (S0), 1% (S1), 2% (S2), and 3% (S3).
Figure 6 shows the excitation and emission contour maps of PL intensity for the N-GQD sample under normalized excitation power and that normalized to the spectrometer response. This figure shows measurements of N-GQD samples from 300 to 750 nm obtained by changing the excitation wavelength from 240 to 300 nm. The results show that N-GQDs can absorb UV light and that the maximum emission peak of N-GQDs is around 550 nm. The prepared N-GQDs are well suited as light-harvesting enhancers with extended emissions in the visible range.
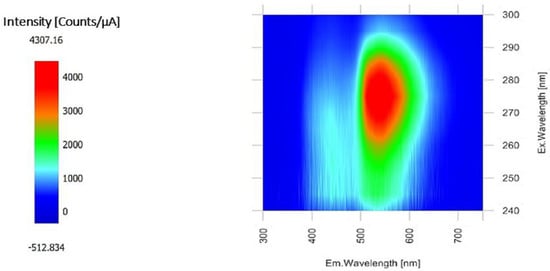
Figure 6.
2D excitation and emission contour map of N-GQDs samples measured from 300 to 750 nm, corresponding to excitation wavelengths from 240 to 300 nm. The color indicates the intensity of the emission.
Steady-state PL measurements were taken to study the charge transfer kinetics between perovskite and N-GQD:SnO2 nanocomposite ultrathin films. Figure 7 shows the steady-state PL spectra of FTO/SnO2/perovskite (S0) and FTO/N-GQD:SnO2/perovskite with different N-GQD percentages. Evidently, the presence of N-GQDs incorporated into SnO2 ultrathin films induced clear quenching of PL for the S1, S2, and S3 samples compared to the pristine FTO/perovskite (S0) sample. The obtained results indicate that N-GQD:SnO2 nanocomposite ultrathin films promoted charge transfer from the perovskite layer and suppressed charge recombination. As the N-GQD percentage increased, stronger quenching of PL was observed, which indicates the faster transfer of photogenerated electrons. Here, the N-GQDs with distributed π orbitals could play an important role as a superfast electron funnel for the electron transfer from the perovskite to SnO2 ETL. This phenomenon confirmed the role of N-GQDs as an effective electron acceptor in N-GQD:SnO2 nanocomposite ultrathin films. Our findings are in agreement with the ultrafast hot electron extraction phenomenon transferred from GQDs to TiO2 reported previously in the literature [53]. However, the reduction of PL quenching in the S3 sample, where the percentage of N-GQDs in SnO2 films exceeded 3%, was due to the increase in resistance from increased film thickness and the inhomogeneous morphology of the N-GQD-doped SnO2 film at this higher mass ratio. The obtained results indicate that N-GQDs can serve as electron-trapping and transport agents; thus, photogenerated electrons in the perovskite layer can easily be transferred from perovskite to SnO2, contributing to more effective separation efficiency [52].
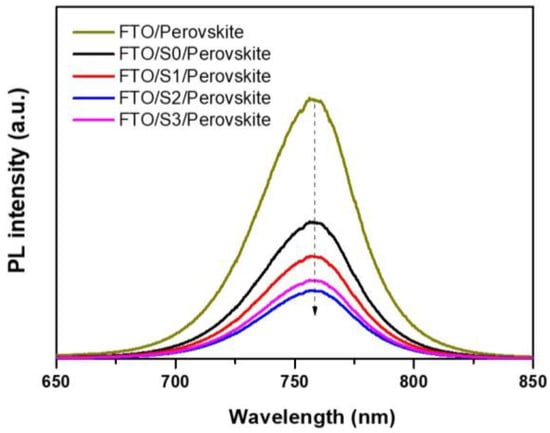
Figure 7.
Photoluminescence (PL) spectra of perovskite films deposited on FTO/N-GQD:SnO2 with N-GQD ratios of 0% (S0), 1% (S1), 2% (S2), and 3% (S3). The dashed arrow represents the photoluminescence quenching phenomenon.
The current density versus voltage (J–V) curves of the FTO/SnO2/Au and FTO/N-GQD:SnO2/Au devices were measured under dark conditions to analyze their conductivity, as shown in Figure 8. The higher conductivity of the N-GQD:SnO2 nanocomposite film is beneficial for improving the electronic properties of SnO2 ETLs. We concluded that the increase in the conductivity of the N-GQD:SnO2 nanocomposite ultrathin films was derived from the high electrical conductivity of N-GQDs, thus resulting in fast electron transport. The highest conductivity of the S2 sample with N-GQD ratios 2% is in agreement with the highest photoluminescence quenching phenomenon of S2 sample observed in Figure 7.
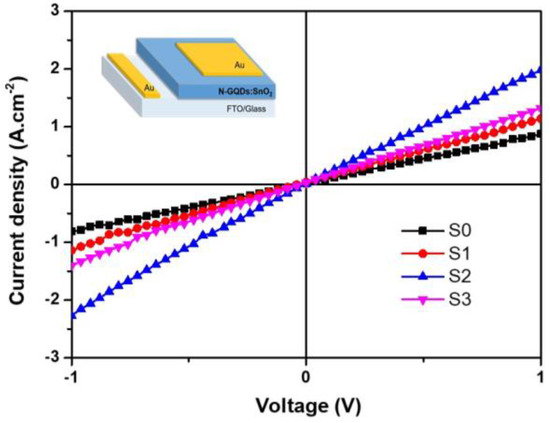
Figure 8.
J–V curves of the FTO/N-GQD:SnO2/Au devices measured under dark conditions. The S0, S1, S2, and S3 samples had N-GQD ratios of 0%, 1%, 2%, and 3%, respectively.
To investigate the influence of N-GQDs on the performance of planar PSCs, we fabricated devices with a structure of glass/FTO/N-GQD:SnO2/perovskite/Spiro-OMeTAD/Au using either pristine SnO2 or N-GQD:SnO2 nanocomposite ultrathin films as ETLs. A schematic illustration of the devices is provided in Figure 9a. A cross-sectional scanning electron microscopy (SEM) image of our device is shown in Figure 9b. The N-GQD:SnO2 nanocomposite ultrathin layer (~50 nm) sandwiched between the FTO and perovskite layers can clearly be observed. Figure 9c illustrates the energy band diagram of the prepared PSC.
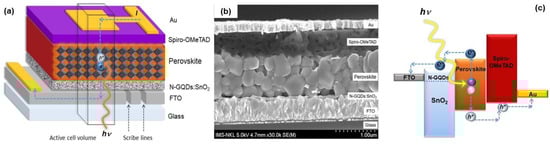
Figure 9.
(a) Schematic illustration of the planar PSC with a structure of glass/FTO/N-GQD:SnO2/perovskite/Spiro-OMeTAD/Au. (b) Cross-sectional view of an FESEM image of a PSC based on a N-GQD:SnO2 nanocomposite ultrathin film. (c) Working principle and energy band diagram of the PSC.
Figure 10 shows the current density–voltage characteristics of the planar PSCs with N-GQD:SnO2 nanocomposite electron transport layers, with N-GQD proportions of 0% (D0), 1% (D1), 2% (D2), and 3% (D3). The photovoltaic parameters of the devices prepared using N-GQD:SnO2 nanocomposite ultrathin films as electron transport layers with different N-GQD proportions are presented in Table 1. We found that the N-GQDs remarkably influenced device performance. The devices using N-GQD:SnO2 nanocomposite ultrathin films as ETLs exhibited better performances than those using pristine SnO2 ETLs. The D2 device with an N-GQD concentration of 2% achieved the best performance, with the following photovoltaic parameters: an open-circuit voltage (Voc) of 1044 mV, short-circuit current density (Jsc) of 23.37 mA/cm2, fill factor (FF) of 77.1%, and power conversion efficiency (PCE) of 18.81%. The results show that the best device—D2, based on the 2% N-GQD:SnO2 nanocomposite ultrathin film—exhibited a 20.4% higher PCE than those for the pristine SnO2. In comparison with results reported in other related published papers, this enhanced value is higher than that achieved by Shangzheng Pang et al. using a SnO2-GQDs ETL (13.4%) [40] and Jia Hong et al. using a SnO2:NGO ETL (7.68%) [54]. When the N-GQD ratio increased to above 2% (sample D3), the N-GQD:SnO2 nanocomposite ultrathin film showed aggregation and inhomogeneity, which resulted in lower PCE, with a short-circuit current density (Jsc) of 22.98 mA/cm2, open-circuit voltage (Voc) of 1036 mV, fill factor (FF) of 76.2%, and PCE of 18.14%. Sample D3 shows that the photoconversion efficiency of the solar cell decreased after the number of N-GQDs in the electron transporter layer was increased, corresponding with the decreased transmittance of the N-GQD:SnO2 nanocomposite ultrathin film of sample S3, as seen in Figure 5. In addition, when the ratio of N-GQDs in SnO2 films increased, an increase in the excessive accumulation of N-GQDs and inhomogeneous morphology of SnO2 films were observed. As a result, the excess N-GQDs caused a reduction in the conductivity of the SnO2 film, thereby reducing the efficiency of the solar cell. This result agrees with a previous report on the incorporation of graphene quantum dots doped with SnO2 to improve carrier transport of perovskite solar cells by Chaoqun Lu et al. [55].
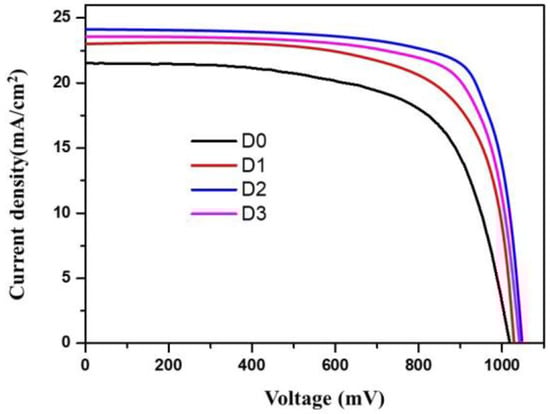
Figure 10.
J–V curves of the planar PSCs based on N-GQD:SnO2 electron transport layers with N-GQD ratios of 0% (D0), 1% (D1), 2% (D2), and 3% (D3) with AM1.5 G simulated solar illumination.

Table 1.
Photovoltaic parameters of the planar PSCs based on N-GQD:SnO2 nanocomposite electron transport layers with different N-GQD ratios.
Figure 11 shows the dark J–V curves of the planar PSCs. The higher current values at 0.5 V reverse bias of the devices D1, D2, and D3 compared with the device D0 indicate that doping N-GQDs increased leakage current. This was likely due to the presence of low-resistivity N-GQDs. However, it should be noted that leakage current only seems to have a significant effect on solar cell performance under low-light conditions [56]. Given the measurements taken in this paper with strong light intensity, increasing leakage current may not have much effect on the performance of planar PSCs. In order to further verify the effect of the doped N-GQD concentrations on the performance of the solar cells, electrochemical impedance measurements under dark conditions were performed. Figure 12 shows the Nyquist spectra of the devices and equivalent circuit models used to fit the data where RS and RREC denote series resistance and recombination resistance, respectively [57]. The fitted results presented in Table 2 show that doping N-GQDs increases the recombination resistance while decreasing the series resistance. This result is consistent with the result of J–V measurement that shows the improvement in the performance of the device in the presence of N-GQDs.
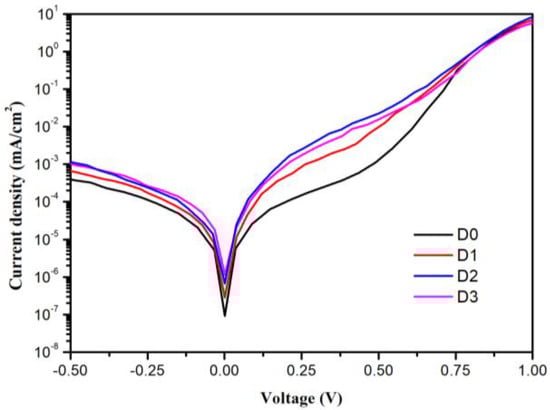
Figure 11.
Dark J–V curves of the planar PSCs based on N-GQD:SnO2 nanocomposite electron transport layers with different N-GQD ratios.
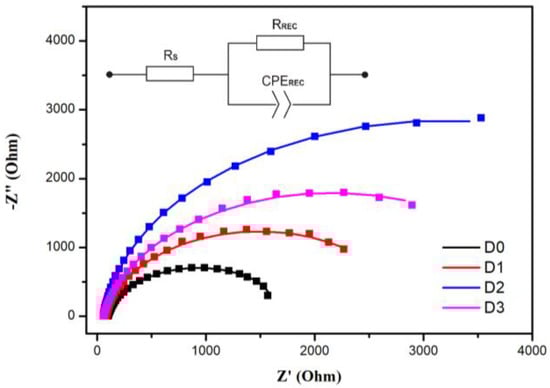
Figure 12.
Electrochemical impedance spectra of the planar PSCs based on N-GQD:SnO2 nanocomposite electron transport layers with different N-GQD ratios in dark condition at Voc bias.
Table 2.
The fitted parameters of the electrochemical impedance spectra.
Figure 13 shows the EQE spectra of the planar PSCs based on SnO2 (D0) and N-GQD:SnO2 nanocomposite champion device (D2) in the 300–850 nm range. The EQE spectrum of the perovskite solar cells based on the N-GQD:SnO2 nanocomposite had a stronger spectral response in the visible range than the EQE spectrum of the pristine SnO2 device. From the results, it is clear that the presence of N-GQDs in ultrathin SnO2 ETLs can lead to better use of a visible-light response as well as improved charge separation efficiency, and reduce unfavorable recombination at the ETL–perovskite interface. The mechanism of the enhanced performance achieved by doping N-GQDs in ultrathin SnO2 ETLs is schematically presented in Figure 14, as follows.
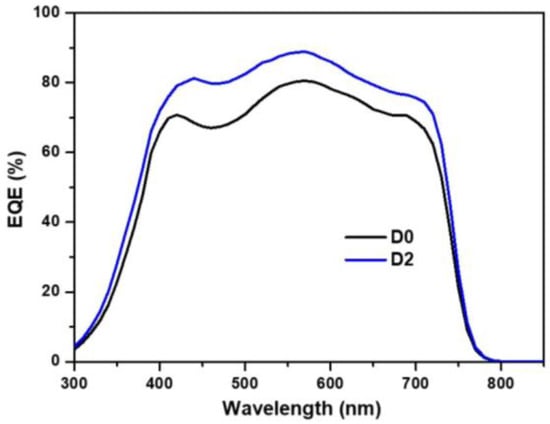
Figure 13.
EQE spectra of the planar PSCs based on SnO2 (D0) and N-GQD:SnO2 nanocomposite champion device (D2).
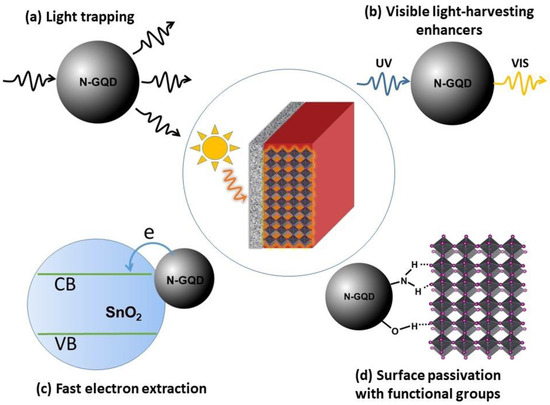
Figure 14.
The roles of N-GQDs in the nanocomposite N-GQD:SnO2 ETLs in enhancing PSC efficiency.
The following roles of N-GQDs in nanocomposite N-GQD:SnO2 ETLs in improving the device performances can be proposed:
- (a)
- Light trapping increased light harvesting in the perovskite layer through the improved absorption and scattering effects of N-GQDs.
- (b)
- Light-harvesting enhancers because of their ability to produce visible emissions of N-GQDs.
- (c)
- Fast electron extraction from perovskite to SnO2 ETLs due to reducing the defect traps and improving the electrical conductivity of SnO2 thin films.
- (d)
- Passivation of the surface defects with hydroxyl (O–H) and nitrogenous (C–N and N–H) functional groups, thus increasing interfacial charge transfer from perovskite to the SnO2 ETLs and reducing the recombination at the ETLs–perovskite interface.
This work provides an effective approach to improving the performance of planar perovskite solar cells by doping SnO2 electron transport layers with a small number of N-GQDs.
4. Conclusions
In conclusion, we modified the optoelectronic properties of a SnO2 film by adding a small number of nitrogen-doped graphene quantum dots (N-GQDs). The N-GQDs effectively filled the defect traps of SnO2, improving electron extraction efficiency and reducing the electron–hole recombination at the ETL–perovskite interface. The device fabricated with a 2% N-GQD ratio reached the highest power conversion efficiency of 18.81%, which was 20.4% higher than that of the pristine SnO2-based device. Our study contributes to the comprehensive understanding of the use of N-GQDs in SnO2 ultrathin films as efficient electron transport layers that enhance the performance of planar PSCs by enhancing incident light and improving carrier transport.
Author Contributions
Conceptualization, H.C.L. and N.T.P.; Data curation, T.T.O.N.; Formal analysis, H.C.L.; Funding acquisition, H.C.L.; Investigation, N.T.P. and C.D.N.; Methodology, H.C.L. and D.C.V.; Project administration, H.C.L.; Validation, S.H.N. and T.T.O.N.; Visualization, D.L.P., S.H.N. and C.D.N.; Writing—original draft, H.C.L.; Writing—review and editing, H.C.L. and N.T.P. All authors have read and agreed to the published version of the manuscript.
Funding
This work was supported by the Institute of Materials Science, Vietnam Academy of Science and Technology under grant number CS.07/20-21.
Data Availability Statement
The data presented in this study are available on request from the corresponding author.
Conflicts of Interest
The authors declare no conflict of interest.
References
- Troeger, A. Solar for Future. Sol. RRL 2020, 4, 1900545. [Google Scholar] [CrossRef]
- Correa-Baena, J.-P.; Abate, A.; Saliba, M.; Tress, W.; Jacobsson, T.J.; Gratzel, M.; Hagfeldt, A. The rapid evolution of highly efficient perovskite solar cells. Energy Environ. Sci. 2017, 10, 710. [Google Scholar] [CrossRef]
- Bing, J.; Caro, L.G.; Talathi, H.P.; Chang, N.L.; Mckenzie, D.R.; Ho-Baillie, A.W.Y. Perovskite solar cells for building integrated photovoltaics—Glazing applications. Joule 2022, 6, 1446. [Google Scholar] [CrossRef]
- Saianand, G.; Sonar, P.; Wilson, G.J.; Gopalan, A.I. Current advancements on charge selective contact interfacial layers and electrodes in flexible hybrid perovskite photovoltaics. J. Energy Chem. 2021, 54, 151. [Google Scholar] [CrossRef]
- Srivishnu, K.S.; Markapudi, P.R.; Sundaram, S.; Giribabu, L. Semitransparent Perovskite Solar Cells for Building Integrated Photovoltaics: Recent Advances. Energies 2023, 16, 889. [Google Scholar] [CrossRef]
- Roy, A.; Ghosh, A.; Bhandari, S.; Sundaram, S.; Mallick, T.K. Perovskite Solar Cells for BIPV Application: A Review. Buildings 2020, 10, 129. [Google Scholar] [CrossRef]
- Li, Z.; Wu, X.; Wu, S.; Gao, D.; Dong, H.; Huang, F.; Hu, X.; Jen, A.K.Y.; Zhu, Z. An effective and economical encapsulation method for trapping lead leakage in rigid and flexible perovskite photovoltaics. Nano Energy 2022, 93, 106853. [Google Scholar] [CrossRef]
- Kim, J.Y.; Lee, J.W.; Jung, H.S.; Shin, H.; Park, N.G. High-Efficiency Perovskite Solar Cells. Chem. Rev. 2020, 120, 7867. [Google Scholar] [CrossRef]
- Lien, T.T.D.; Phuc, P.V.; Oanh, N.T.T.; Hieu, N.S.; Bach, T.N.; Long, P.D.; Hoi, P.V.; Chi, L.H. Using Solvent Vapor Annealing for the Enhancement of the Stability and Efficiency of Monolithic Hole-conductor-free Perovskite Solar Cells. Commun. Phys. 2020, 30, 133. [Google Scholar]
- Qiu, C.; Wagner, L.; Liu, J.; Zhang, W.; Du, J.; Wang, Q.; Hu, Y.; Han, H. Probing charge carrier dynamics in metal halide perovskite solar cells. EcoMat 2023, 5, e12268. [Google Scholar] [CrossRef]
- Zhu, L.; Zhao, R.; Zhuang, R.; Wu, T.; Xie, L.; Hua, Y. Slowing the hot-carrier cooling by an organic small molecule in perovskite solar cells. EcoMat 2023, 5, e12313. [Google Scholar] [CrossRef]
- Gong, C.; Zhang, C.; Zhuang, Q.; Li, H.; Yang, H.; Chen, J.; Zang, Z. Stabilizing Buried Interface via Synergistic Effect of Fluorine and Sulfonyl Functional Groups Toward Efficient and Stable Perovskite Solar Cells. Nano-Micro Lett. 2023, 15, 17. [Google Scholar] [CrossRef] [PubMed]
- Nguyen, D.C.; Ishikawa, Y. Artificial neural network for predicting annual output energy of building-integrated photovoltaics based on the 2-terminal perovskite/silicon tandem cells under realistic conditions. Energy Rep. 2022, 8, 10819. [Google Scholar] [CrossRef]
- Roy, P.; Ghosh, A.; Barclay, F.; Khare, A.; Cuce, E. Perovskite Solar Cells: A Review of the Recent Advances. Coatings 2022, 12, 1089. [Google Scholar] [CrossRef]
- Suo, J.; Yang, B.; Hagfeldt, A. Passivation Strategies through Surface Reconstruction toward Highly Efficient and Stable Perovskite Solar Cells on n-i-p Architecture. Energies 2021, 14, 4836. [Google Scholar] [CrossRef]
- Zhao, Y.; Ye, Q.; Chu, Z.; Gao, F.; Zhang, X.; You, J. Recent Progress in High-efficiency Planar-structure Perovskite Solar Cells. Energy Environ. Mater. 2019, 2, 93. [Google Scholar] [CrossRef]
- Jiang, Q.; Chu, Z.; Wang, P.; Yang, X.; Liu, H.; Wang, Y.; Yin, Z.; Wu, J.; Zhang, X.; You, J. Planar-Structure Perovskite Solar Cells with Efficiency beyond 21%. Adv. Mater. 2017, 29, 1703852. [Google Scholar] [CrossRef]
- Liu, M.; Johnston, M.B.; Snaith, H.J. Efficient planar heterojunction perovskite solar cells by vapour deposition. Nature 2013, 501, 395. [Google Scholar] [CrossRef]
- Yang, D.; Yang, R.; Wang, K.; Wu, C.; Zhu, X.; Feng, J.; Ren, X.; Fang, G.; Priya, S.; Liu, S.F. High efficiency planar-type perovskite solar cells with negligible hysteresis using EDTA-complexed SnO2. Nat. Commun. 2018, 9, 3239. [Google Scholar] [CrossRef]
- Ren, X.; Yang, D.; Yang, Z.; Feng, J.; Zhu, X.; Niu, J.; Liu, Y.; Zhao, W.; Liu, S.F. Solution-Processed Nb:SnO2 Electron Transport Layer for Efficient Planar Perovskite Solar Cells. ACS Appl. Mater. Interfaces 2017, 9, 2421. [Google Scholar] [CrossRef]
- Anaraki, E.H.; Kermanpur, A.; Steier, L.; Domanski, K.; Matsui, T.; Tress, W.; Saliba, M.; Abate, A.; Gratzel, M.; Hagfeldt, A.; et al. Highly Efficient and Stable Planar Perovskite Solar Cells by Solution-Processed Tin Oxide. Energ. Environ. Sci. 2016, 9, 3128. [Google Scholar] [CrossRef]
- Zhang, T.; He, Q.; Yu, J.; Chen, A.; Zhang, Z.; Pan, J. Recent progress in improving strategies of inorganic electron transport layers for perovskite solar cells. Nano Energy 2022, 104, 107918. [Google Scholar] [CrossRef]
- Lu, H.; Tian, W.; Gu, B.; Zhu, Y.; Li, L. TiO2 Electron Transport Bilayer for Highly Efficient Planar Perovskite Solar Cell. Small 2017, 13, 1. [Google Scholar] [CrossRef]
- Mahmud, M.A.; Elumalai, N.K.; Upama, M.B.; Wang, D.; Chan, K.H.; Wright, M.; Xu, C.; Haque, F.; Uddin, A. Low temperature processed ZnO thin film as electron transport layer for efficient perovskite solar cells. Sol. Energy Mater. Sol. Cells 2017, 159, 251. [Google Scholar] [CrossRef]
- Zhang, P.; Wu, J.; Zhang, T.; Wang, Y.; Liu, D.; Chen, H.; Ji, L.; Liu, C.; Ahmad, W.; Chen, Z.D.; et al. Perovskite Solar Cells with ZnO Electron-Transporting Materials. Adv. Mater. 2017, 30, 1703737. [Google Scholar] [CrossRef]
- Chen, Y.; Meng, Q.; Zhang, L.; Han, C.; Gao, H.; Zhang, Y.; Yan, H. SnO2 -based electron transporting layer materials for perovskite solar cells: A review of recent progress. J. Energy Chem. 2019, 35, 144. [Google Scholar] [CrossRef]
- Wang, K.; Olthof, S.; Subhani, W.S.; Jiang, X.; Cao, Y.; Duan, L.; Wang, H.; Du, M.; Liu, S.F. Novel Inorganic Electron Transport Layers for Planar Perovskite Solar Cells: Progress and Prospective. Nano Energy 2020, 68, 104289. [Google Scholar] [CrossRef]
- Nowsherwan, G.A.; Zaib, A.; Shah, A.A.; Khan, M.; Shakoor, A.; Bukhari, S.N.S.; Riaz, M.; Hussain, S.S.; Shar, M.A.; Alhazaa, A. Preparation and Numerical Optimization of TiO2:CdS Thin Films in Double Perovskite Solar Cell. Energies 2023, 16, 900. [Google Scholar] [CrossRef]
- Sun, S.; Buonassisi, T.; Correa-Baena, J.P. State-of-the-Art Electron-Selective Contacts in Perovskite Solar Cells. Adv. Mater. Interfaces 2018, 5, 1800408. [Google Scholar] [CrossRef]
- Mahapatra, A.D.; Lee, J.W. Metal oxide charge transporting layers for stable high-performance perovskite solar cells. Cryst. Eng. Comm. 2022, 29, 7229. [Google Scholar] [CrossRef]
- Zhou, Y.; Li, X.; Lin, H. To Be Higher and Stronger—Metal Oxide Electron Transport Materials for Perovskite Solar Cells. Small 2019, 16, 1902579. [Google Scholar] [CrossRef]
- Cao, Z.; Li, C.; Deng, X.; Wang, S.; Yuan, Y.; Chen, Y.; Wang, Z.; Liu, Y.; Ding, L.; Hao, F. Metal oxide alternatives for efficient electron transport in perovskite solar cells: Beyond TiO2 and SnO2. J. Mater. Chem. A 2020, 8, 19768. [Google Scholar] [CrossRef]
- Xiong, L.; Guo, Y.; Wen, J.; Liu, H.; Yang, G.; Qin, P.; Fang, G. Review on the Application of SnO2 in Perovskite Solar Cells. Adv. Funct. Mater. 2018, 28, 1802757. [Google Scholar] [CrossRef]
- Jiang, Q.; Zhang, X.; You, J. SnO2: A Wonderful Electron Transport Layer for Perovskite Solar Cells. Small 2018, 14, 1801154. [Google Scholar] [CrossRef] [PubMed]
- Min, H.; Lee, D.Y.; Kim, J.; Kim, G.; Lee, K.S.; Kim, J.; Paik, M.J.; Kim, Y.K.; Kim, K.S.; Kim, M.G.; et al. Perovskite solar cells with atomically coherent interlayers on SnO2 electrodes. Nature 2021, 598, 444. [Google Scholar] [CrossRef]
- Luo, T.; Ye, G.; Chen, X.; Wu, H.; Zhang, W.; Chang, H. F-doping-Enhanced Carrier Transport in the SnO2/Perovskite Interface for High-Performance Perovskite Solar Cells. ACS Appl. Mater. Interfaces 2022, 14, 42093. [Google Scholar] [CrossRef] [PubMed]
- Guo, X.; Huang, X.; Su, J.; Lin, Z.; Ma, J.; Chang, J.; Hao, Y. Reducing the interfacial energy loss via oxide/perovskite heterojunction engineering for high efficient and stable perovskite solar cells. Chem. Eng. J. 2021, 417, 129184. [Google Scholar] [CrossRef]
- Shi, X.; Chen, R.; Jiang, T.; Ma, S.; Liu, X.; Ding, Y.; Cai, M.; Wu, J.; Dai, S. Regulation of Interfacial Charge Transfer and Recombination for Efficient Planar Perovskite Solar Cells. Sol. RRL 2020, 4, 1900198. [Google Scholar] [CrossRef]
- Wang, S.; Zhu, Y.; Liu, B.; Wang, C.; Ma, R. Introduction of carbon nanodots into SnO2 electron transport layer for efficient and UV stable planar perovskite solar cells. J. Mater. Chem. A 2019, 7, 5353. [Google Scholar] [CrossRef]
- Pang, S.; Zhang, C.; Zhang, H.; Dong, H.; Chen, D.; Zhu, W.; Xi, H.; Chang, J.; Lin, Z.; Zhang, J.; et al. Boosting Performance of Perovskite Solar Cells with Graphene quantum dots decorated SnO2. Appl. Surf. Sci. 2020, 507, 145099. [Google Scholar] [CrossRef]
- Xiaojuan, Z.; Tao, L.; Li, H.; Huang, W.; Sun, P.; Liu, J.; Liu, S.; Sun, Q.; Cui, Z.; Sun, L.; et al. Efficient Planar Perovskite Solar Cells with Improved Fill Factor via Interface Engineering with Graphene. Nano Lett. 2018, 18, 2442. [Google Scholar]
- Thang, P.N.; Hung, L.X.; Thuan, D.N.; Yen, N.H.; Hien, N.T.T.; Hanh, V.T.H.; Khang, N.C.; Laverdant, J.; Nga, P.T. Temperature-dependent Raman investigation and photoluminescence of graphene quantum dots with and without nitrogen-doping. J. Mater. Sci. 2021, 56, 4979. [Google Scholar] [CrossRef]
- Tiwari, S.K.; Sahoo, S.; Wang, N.; Huczko, A. Graphene research and their outputs: Status and prospect. J. Sci. Adv. Mater. Devices 2020, 5, 10. [Google Scholar] [CrossRef]
- Xie, J.; Huang, K.; Yu, X.; Yang, Z.; Xiao, K.; Qiang, Y.; Zhu, X.; Xu, L.; Wang, P.; Cui, C.; et al. Enhanced Electronic Properties of SnO2 via Electron Transfer from Graphene Quantum Dots for Efficient Perovskite Solar Cells. ACS Nano 2017, 11, 9176. [Google Scholar] [CrossRef] [PubMed]
- Tang, L.; Ji, R.; Li, X.; Teng, K.S.; Lau, S.P. Energy-level structure of nitrogen-doped graphene quantum dots. J Mater. Chem. C 2013, 1, 4908. [Google Scholar] [CrossRef]
- Shi, B.; Zhang, L.; Lan, C.; Zhao, J.; Su, Y.; Zhao, S. One-pot green synthesis of oxygen-rich nitrogen-doped graphene quantum dots and their potential application in pH-sensitive photoluminescence and detection of mercury(II) ions. Talanta 2015, 142, 131. [Google Scholar] [CrossRef]
- Yan, R.; Wu, H.; Zheng, Q.; Wang, J.; Huang, J.; Ding, K.; Guo, Q.; Wang, J. Graphene quantum dots cut from graphene flakes: High electrocatalytic activity for oxygen reduction and low cytotoxicity. RSC Adv. 2014, 4, 23097. [Google Scholar] [CrossRef]
- Mendes, P.G.; Moreira, M.L.; Tebcherani, S.M.; Orlandi, M.O.; Andrés, J.; Li, M.S.; Diaz-Mora, N.; Varela, J.A.; Longo, E. SnO2 nanocrystals synthesized by microwave-assisted hydrothermal method: Towards a relationship between structural and optical properties. J. Nanopart. Res. 2012, 14, 750. [Google Scholar] [CrossRef]
- Chu, X.; Wang, J.; Zhang, J.; Dong, Y.; Sun, W.; Zhang, W.; Bai, L. Preparation and gas-sensing properties of SnO2/graphene quantum dots composites via solvothermal method. J. Mater. Sci. 2017, 52, 9441. [Google Scholar] [CrossRef]
- Elci, A.; Demirtas, O.; Ozturk, I.M.; Bek, A.; Esenturk, E.N. Synthesis of tin oxide-coated gold nanostars and evaluation of their surface-enhanced Raman scattering activities. J. Mater. Sci. 2018, 53, 16345. [Google Scholar] [CrossRef]
- Fan, M.; Zhu, C.; Yang, J.; Sun, D. Facile self-assembly N-doped graphene quantum dots/graphene for oxygen reduction reaction. Electrochim. Acta 2016, 216, 102–109. [Google Scholar] [CrossRef]
- Wang, Y.; Zhang, J.; Chen, S.; Zhang, H.; Li, L.; Fu, Z. Surface passivation with nitrogen-doped carbon dots for improved perovskite solar cell performance. J. Mater. Sci. 2018, 53, 9180. [Google Scholar] [CrossRef]
- Zhu, Z.; Ma, J.; Wang, Z.; Mu, C.; Fan, Z.; Du, L.; Bai, Y.; Fan, L.; Yan, H.; Phillips, D.L.; et al. Efficiency Enhancement of Perovskite Solar Cells through Fast Electron Extraction: The Role of Graphene Quantum Dots. J. Am. Chem. Soc. 2014, 136, 3760. [Google Scholar] [CrossRef]
- Hong, J.; Jung, E.D.; Yu, J.C.; Kim, D.W.; Nam, Y.S.; Oh, I.; Lee, E.; Yoo, J.W.; Cho, S.; Song, M.H. Improved Efficiency of Perovskite Solar Cells Using a Nitrogen Doped Graphene Oxide Treated Tin Oxide Layer. ACS Appl. Mater. Interfaces 2020, 12, 2417. [Google Scholar] [CrossRef]
- Lu, C.; Zhang, W.; Jiang, Z.; Zhang, Y.; Ni, C. Graphene quantum dots doping SnO2 for improving carrier transport of perovskite solar cells. Ceram. Int. 2021, 47, 29712. [Google Scholar] [CrossRef]
- Proctor, C.M.; Nguyen, T.Q. Effect of leakage current and shunt resistance on the light intensity dependence of organic solar cells. Appl. Phys. Lett. 2015, 106, 083301. [Google Scholar] [CrossRef]
- Maqsood, A.; Li, Y.; Meng, J.; Song, D.; Qiao, B.; Zhao, S.; Xu, Z. Perovskite Solar Cells Based on Compact, Smooth FA0.1MA0.9PbI3 Film with Efficiency Exceeding 22%. Nanoscale Res. Lett. 2020, 15, 89. [Google Scholar] [CrossRef]


Disclaimer/Publisher’s Note: The statements, opinions and data contained in all publications are solely those of the individual author(s) and contributor(s) and not of MDPI and/or the editor(s). MDPI and/or the editor(s) disclaim responsibility for any injury to people or property resulting from any ideas, methods, instructions or products referred to in the content. |
© 2023 by the authors. Licensee MDPI, Basel, Switzerland. This article is an open access article distributed under the terms and conditions of the Creative Commons Attribution (CC BY) license (https://creativecommons.org/licenses/by/4.0/).