Abstract
Laser boriding is a surface treatment that involves the simultaneous re-melting and mixing of the alloying material, containing amorphous boron blended with diluted polyvinyl alcohol, with the substrate material (Nimonic 80A-alloy). As a result of high cooling rates, the boride layer is formed from a solidifying molten pool. The thickness of the produced layer depends on the laser treatment parameters, e.g., power of the laser beam, scanning rate, and laser beam radius. These parameters influence the temperature distribution on the cross-section of laser tracks and, thus, directly determine the size of the molten pool, from which the boride layer is formed after crystallization. In the present study, laser borided layers were produced on Nimonic 80A alloy using a CO2 molecular laser. Differences in the laser beam power used resulted in the formation of layers of different thicknesses, which resulted directly from the differences in the temperature distribution in the treated material. The amount of boron in the molten pool directly influenced the obtained hardness of the laser borided layer. It was found that the lower laser beam power had an advantageous effect on the hardness due to the higher percentage of nickel borides and chromium borides in the layer. The reasons for this situation are discussed in detail.
1. Introduction
The main purpose of laser surface alloying of nickel-based alloys is to increase their hardness and wear resistance due to the formation of borides in the re-melted zone. In general, laser surface alloying is a process in which alloying material (in the form of paste, powder, or gas) is melted with the substrate material to form an alloyed layer. This process is accompanied by high heating and cooling rates; therefore, the produced alloyed layer is characterized by a fine-grained microstructure also containing metastable and non-equilibrium phases [1,2].
The surface of nickel and its alloys can be successfully modified with laser alloying [3,4,5,6,7,8,9]. One of the successful processes applied to Ni-based alloys may be laser nitriding. Yilbas et al. described the possibility of laser treatment of Hastelloy G alloy under a gaseous nitrogen environment [3]. The presence of nitrides (CrN and Fe4N) was confirmed with XRD analysis. The produced layer was characterized by a uniform microstructure with a thickness of 40 µm. Unfortunately, only a slight increase in hardness from 270 HV for the substrate material to 350 HV for the nitrided layer was observed. Higher hardness was obtained in the case of laser alloying of Nimonic 80 alloy with addition of Si and Al [4]. The alloyed layer consisted of intermetallic phases (Ni2Si, Ni3Si, Ni3Si2, NiSi), increasing the hardness to 550 HV. Moreover, it was proved that the addition of Si and Al improved the high-temperature oxidation resistance of the laser surface alloyed specimens. The influence of laser alloying with aluminum on the oxidation resistance of Nimonic 80A alloy was also reported in [5]. The best results with respect to an increase in hardness and wear resistance were obtained in the case of laser alloying with boron of Inconel 600 alloy [7,8]. The applied parameters of laser treatment influenced the thickness of the produced re-melted layers and their properties. The laser borided layers were characterized by high thickness (346–467 μm, depending on the laser beam power used) and contained nickel borides and chromium borides. A higher maximum hardness of 1740 HV was obtained in the layer produced with lower laser beam power. The increase in laser beam power resulted in an increase in the amount of re-melted substrate material in the alloyed layer. This resulted in a diminished hardness (1430 HV). Moreover, the wear resistance of the laser borided Inconel 600 alloy was about ten times higher than that of the non-borided Inconel 600 alloy [7].
The microstructure, thickness, and properties of laser borided layers strongly depend on the applied laser treatment parameters, e.g., laser beam power, scanning rate, and laser beam radius. For this reason, simulations of the processes of laser treatment are a useful tool for predicting the thickness of the re-melted layer, as well as for designing the mechanical properties of the produced laser alloyed layers. Generally, the mechanism of formation of the re-melted layer is related to two main phenomena: thermal transfer and interdiffusion of the different atomic species by mass transport [10]. Different methods may be used for simulating the laser re-melting processes, e.g., the finite element model [11,12,13] and heat flow models [14,15,16]. Mathematical models make it possible to predict the effects of laser treatment depending on the adopted parameters of the laser operation. Such a model was developed by Ashby et al. [17,18], who solved the problem of a moving finite line source placed at a certain distance above the surface of the workpiece. It has been shown that this model well reflects the experimental results of steel hardening [19], as well as laser hardening of nitrided steel [20]. Based on Ashby et al.’s works [17,18,19], a simple model of temperature distribution in the axis of the laser tracks was also adopted to estimate the depth of laser tracks formed during laser alloying with boron, boron and molybdenum, and boron and niobium [21]. However, these results concern only a maximum depth of the re-melted zone without the geometry and size of the laser track.
Laser boriding is a promising method of surface treatment that can be used in order to produce very thick and hard layers on the surface of Ni-based alloys. Obviously, the obtained microstructure, thickness, and mechanical properties of produced layer are strongly dependent on laser processing parameters such as laser beam radius, laser beam power, or scanning rate. The precise control of laser boriding parameters is important to achieve the desired microstructure, thickness, stress distribution, and properties of the produced layers. The multitude of process variables means that the selection of the appropriate parameters for achieving the desired thickness of the laser borided layer requires many years of research and thousands of experiments. Mathematical modeling of the temperature distribution in the molten pool is an important tool because, thanks to this, the theoretically predicted thickness of the layer can be determined. Therefore, in this study, the model developed by Ashby et al. [17,18,19] was adopted to predict the depth of laser borided layers produced on Nimonic 80A alloy. In order to verify the usefulness of this model for predicting the thickness of the laser borided layer, three experiments were carried out with laser boriding at laser beam power of 1.3 kW, 1.56 kW, and 1.95 kW. The cognitive purpose of this study was to determine the influence of laser beam power on the thickness and hardness of the laser borided layers produced on Nimonic 80A alloy. The practical aim of this study was to prove that by adopting the mathematical model of Ashby et al., it is possible to predict the thickness of the produced layer without carrying out many time-consuming experiments.
2. Materials and Methods
Laser alloying with boron was applied to form surface layers on the Nimonic 80A alloy. This nickel–chromium superalloy contains chromium as the main alloying element (19.52 wt.%). Other elements in this material are as follows: aluminum (1.44 wt.%), titanium (2.55 wt.%), iron (0.25 wt.%), carbon (0.085 wt.%), and silicon (0.09 wt.%).
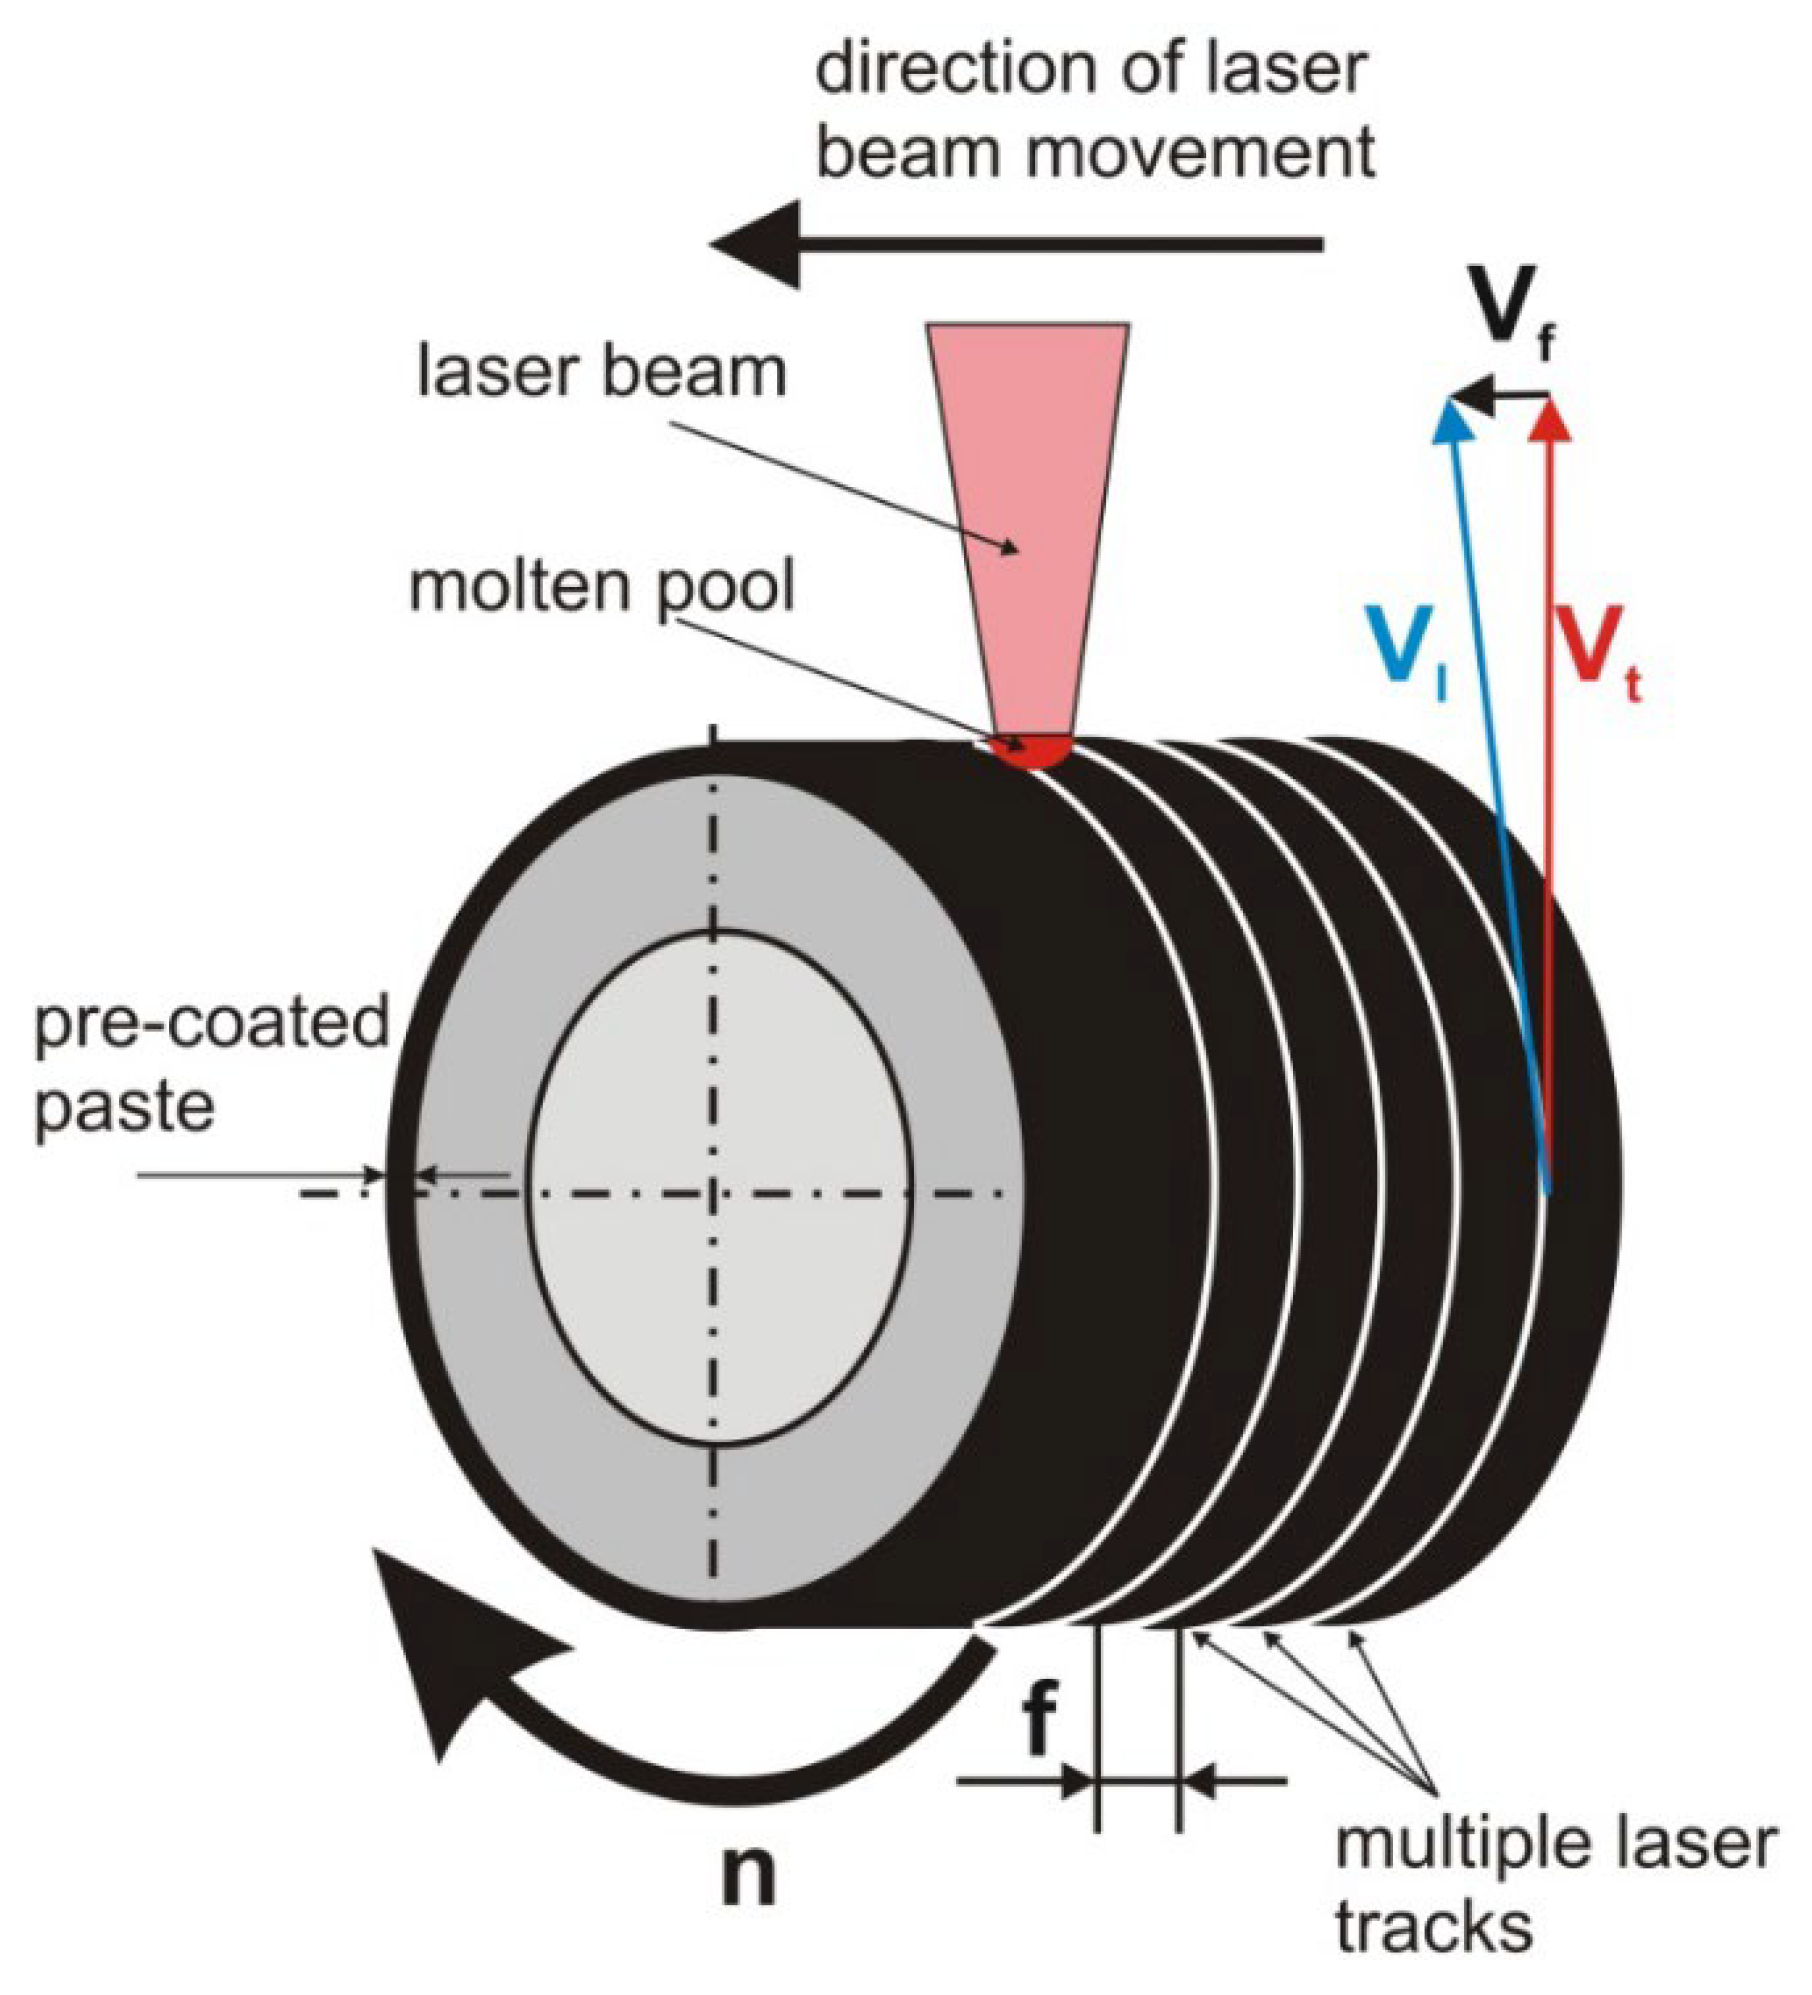
Laser boriding, also called laser alloying with boron, was arranged as a two-step process, as shown in Figure 1.
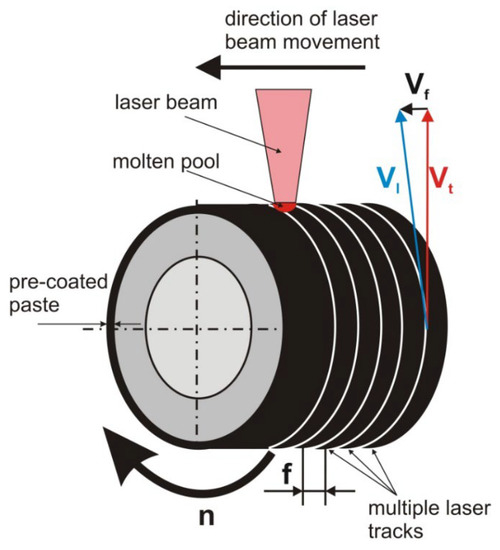
Figure 1.
The scheme of laser boriding with pre-coated paste—the method of multiple laser tracks producing vf—feed rate; vl—scanning rate; vt—tangential speed; n—rotational speed; f—distance between the axes of adjacent tracks.
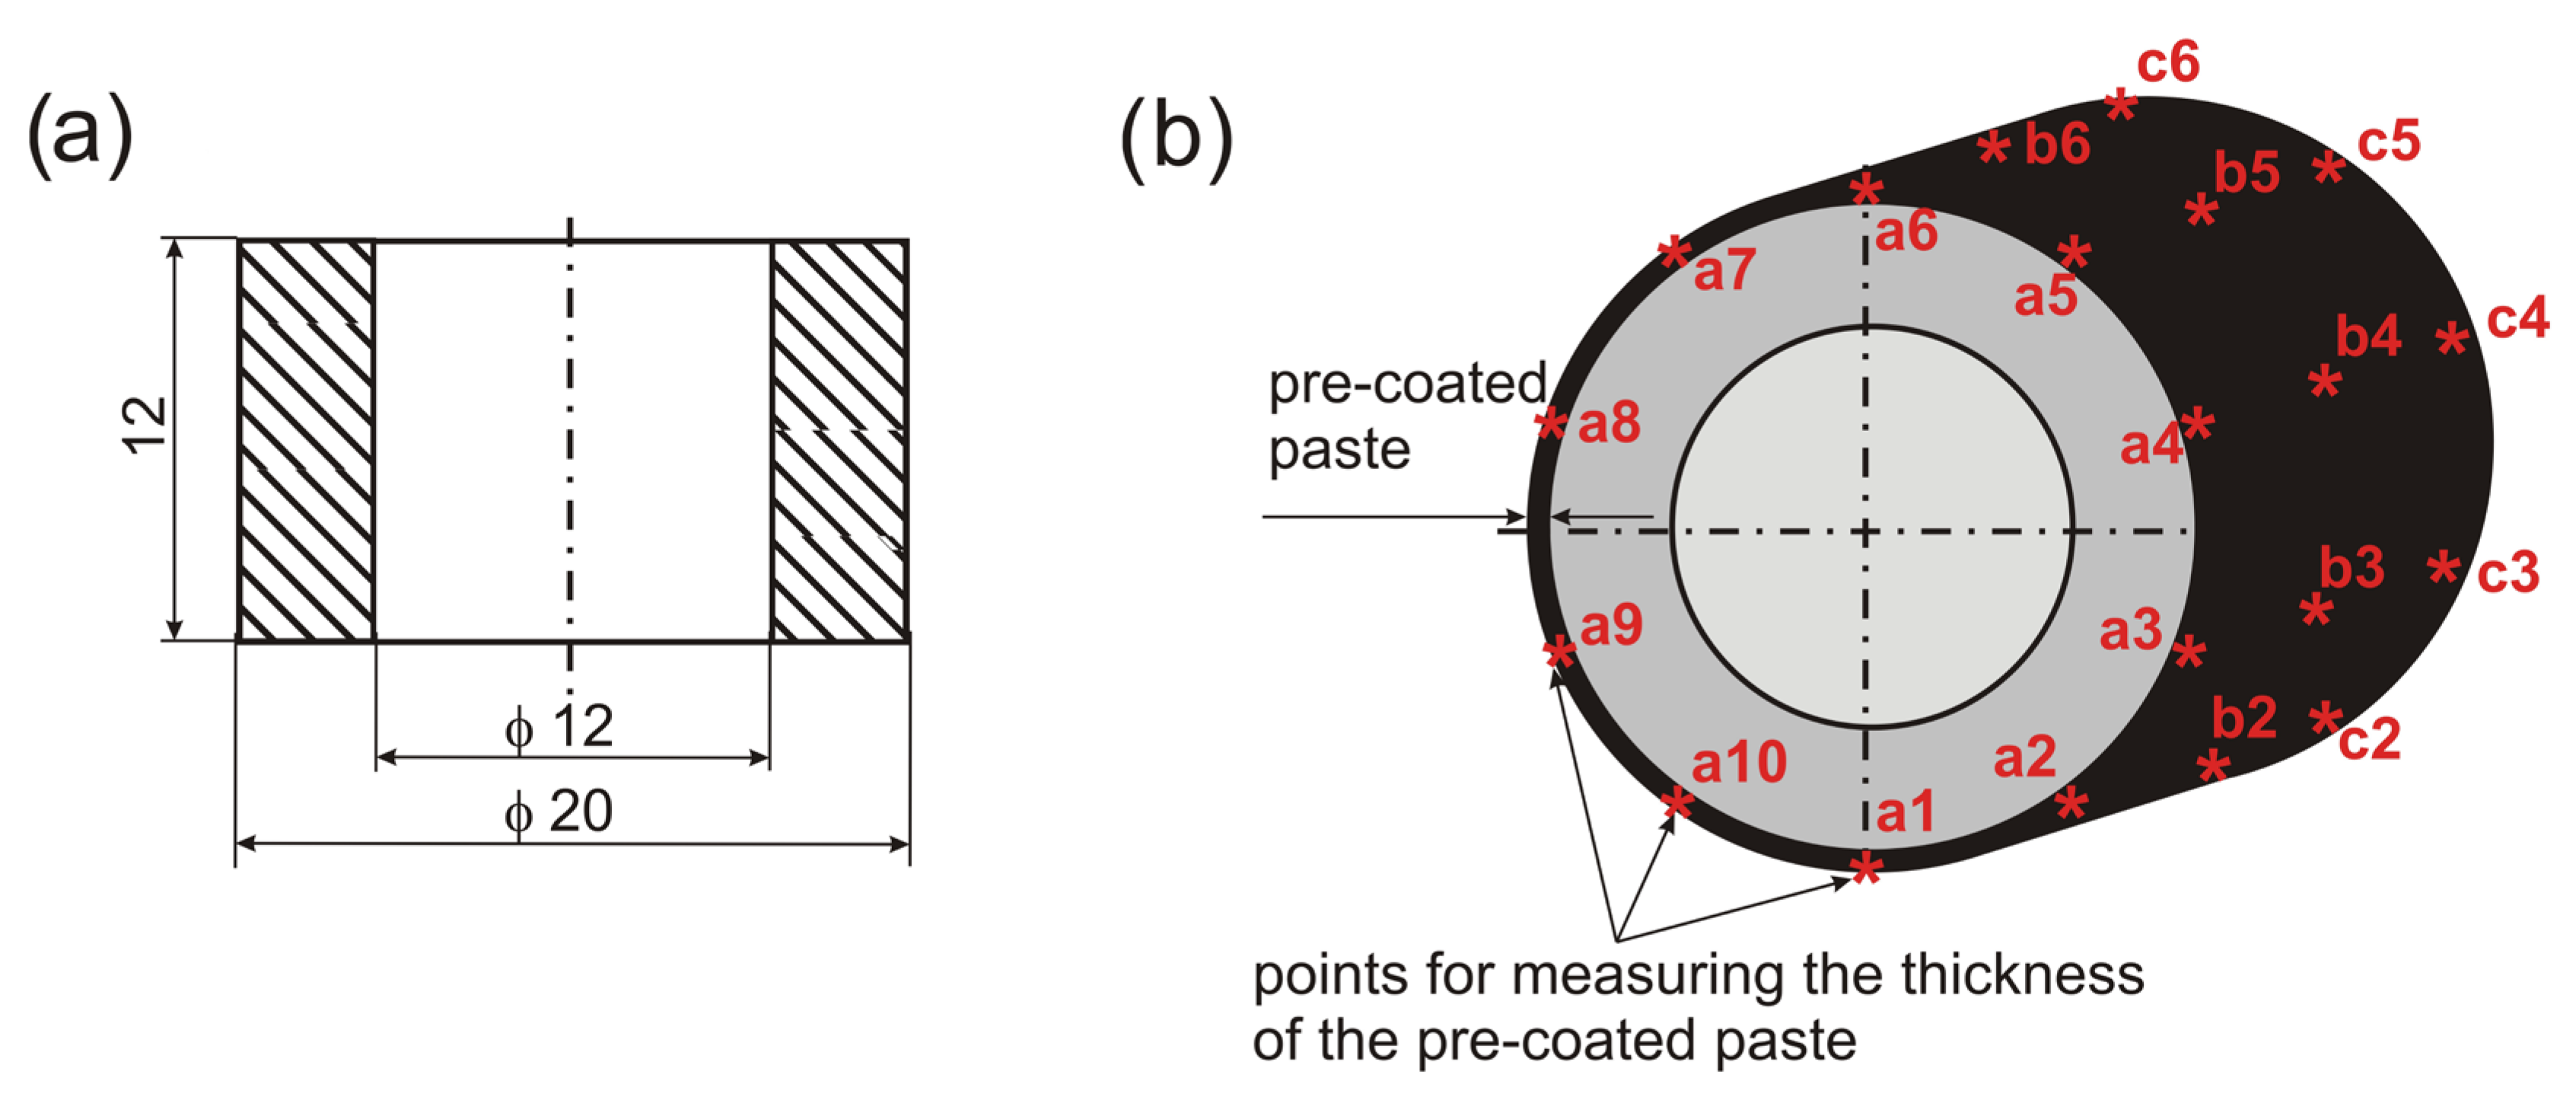
In the first step, the external surface of the specimen in the shape of a ring (Figure 2a) was pre-coated with a paste containing amorphous boron. The paste was prepared using the powder of amorphous boron (Sigma Aldrich, Inc.; Poznan, Poland) with a purity of 95% and particle size lower than 1 µm. The powder was blended with diluted polyvinyl alcohol (Sigma Aldrich, Inc.; Poznan, Poland) solution. The thickness of the paste was measured using a Positector 6000 thickness gauge (DeFelsko, Inc.; Poznan, Poland), which uses the phenomenon of magnetic induction and eddy currents for measurement. Thirty measurements were made: ten in each of the measuring lines located on the cylindrical surface at both faces of the sample (points a1–a10 and c1–c10), as well as in the middle of the sample (points b1–b10) in accordance with Figure 2b. The detailed results of the measurements of the thickness of the pre-coated paste are presented in Table 1. It was found that the pre-coated paste with amorphous boron was uniform regarding their thickness. For all measurement points, the thickness oscillated around 200 µm with approximately 7% standard deviation (±14 µm). The average thickness of paste coated on the sample intended for laser boriding with a laser beam power of 1.3 kW was 200.39 ± 14.23 µm. In the case of the sample intended for laser boriding with a laser beam power of 1.56 kW, the average thickness was 200.78 ± 14.68 µm. The average thickness of paste pre-coated on the surface of the third sample was 200.57 ± 14.48 µm.

Figure 2.
The shape and dimensions of the specimens used for laser boriding (a) and the scheme of the specimen with marked points for measuring the thickness of the pre-coated paste (b).

Table 1.
The results of the measurements of the thickness of the pre-coated paste with amorphous boron applied to the samples intended for laser boriding using a laser beam power of 1.3 kW, 1.56 kW, and 1.95 kW.
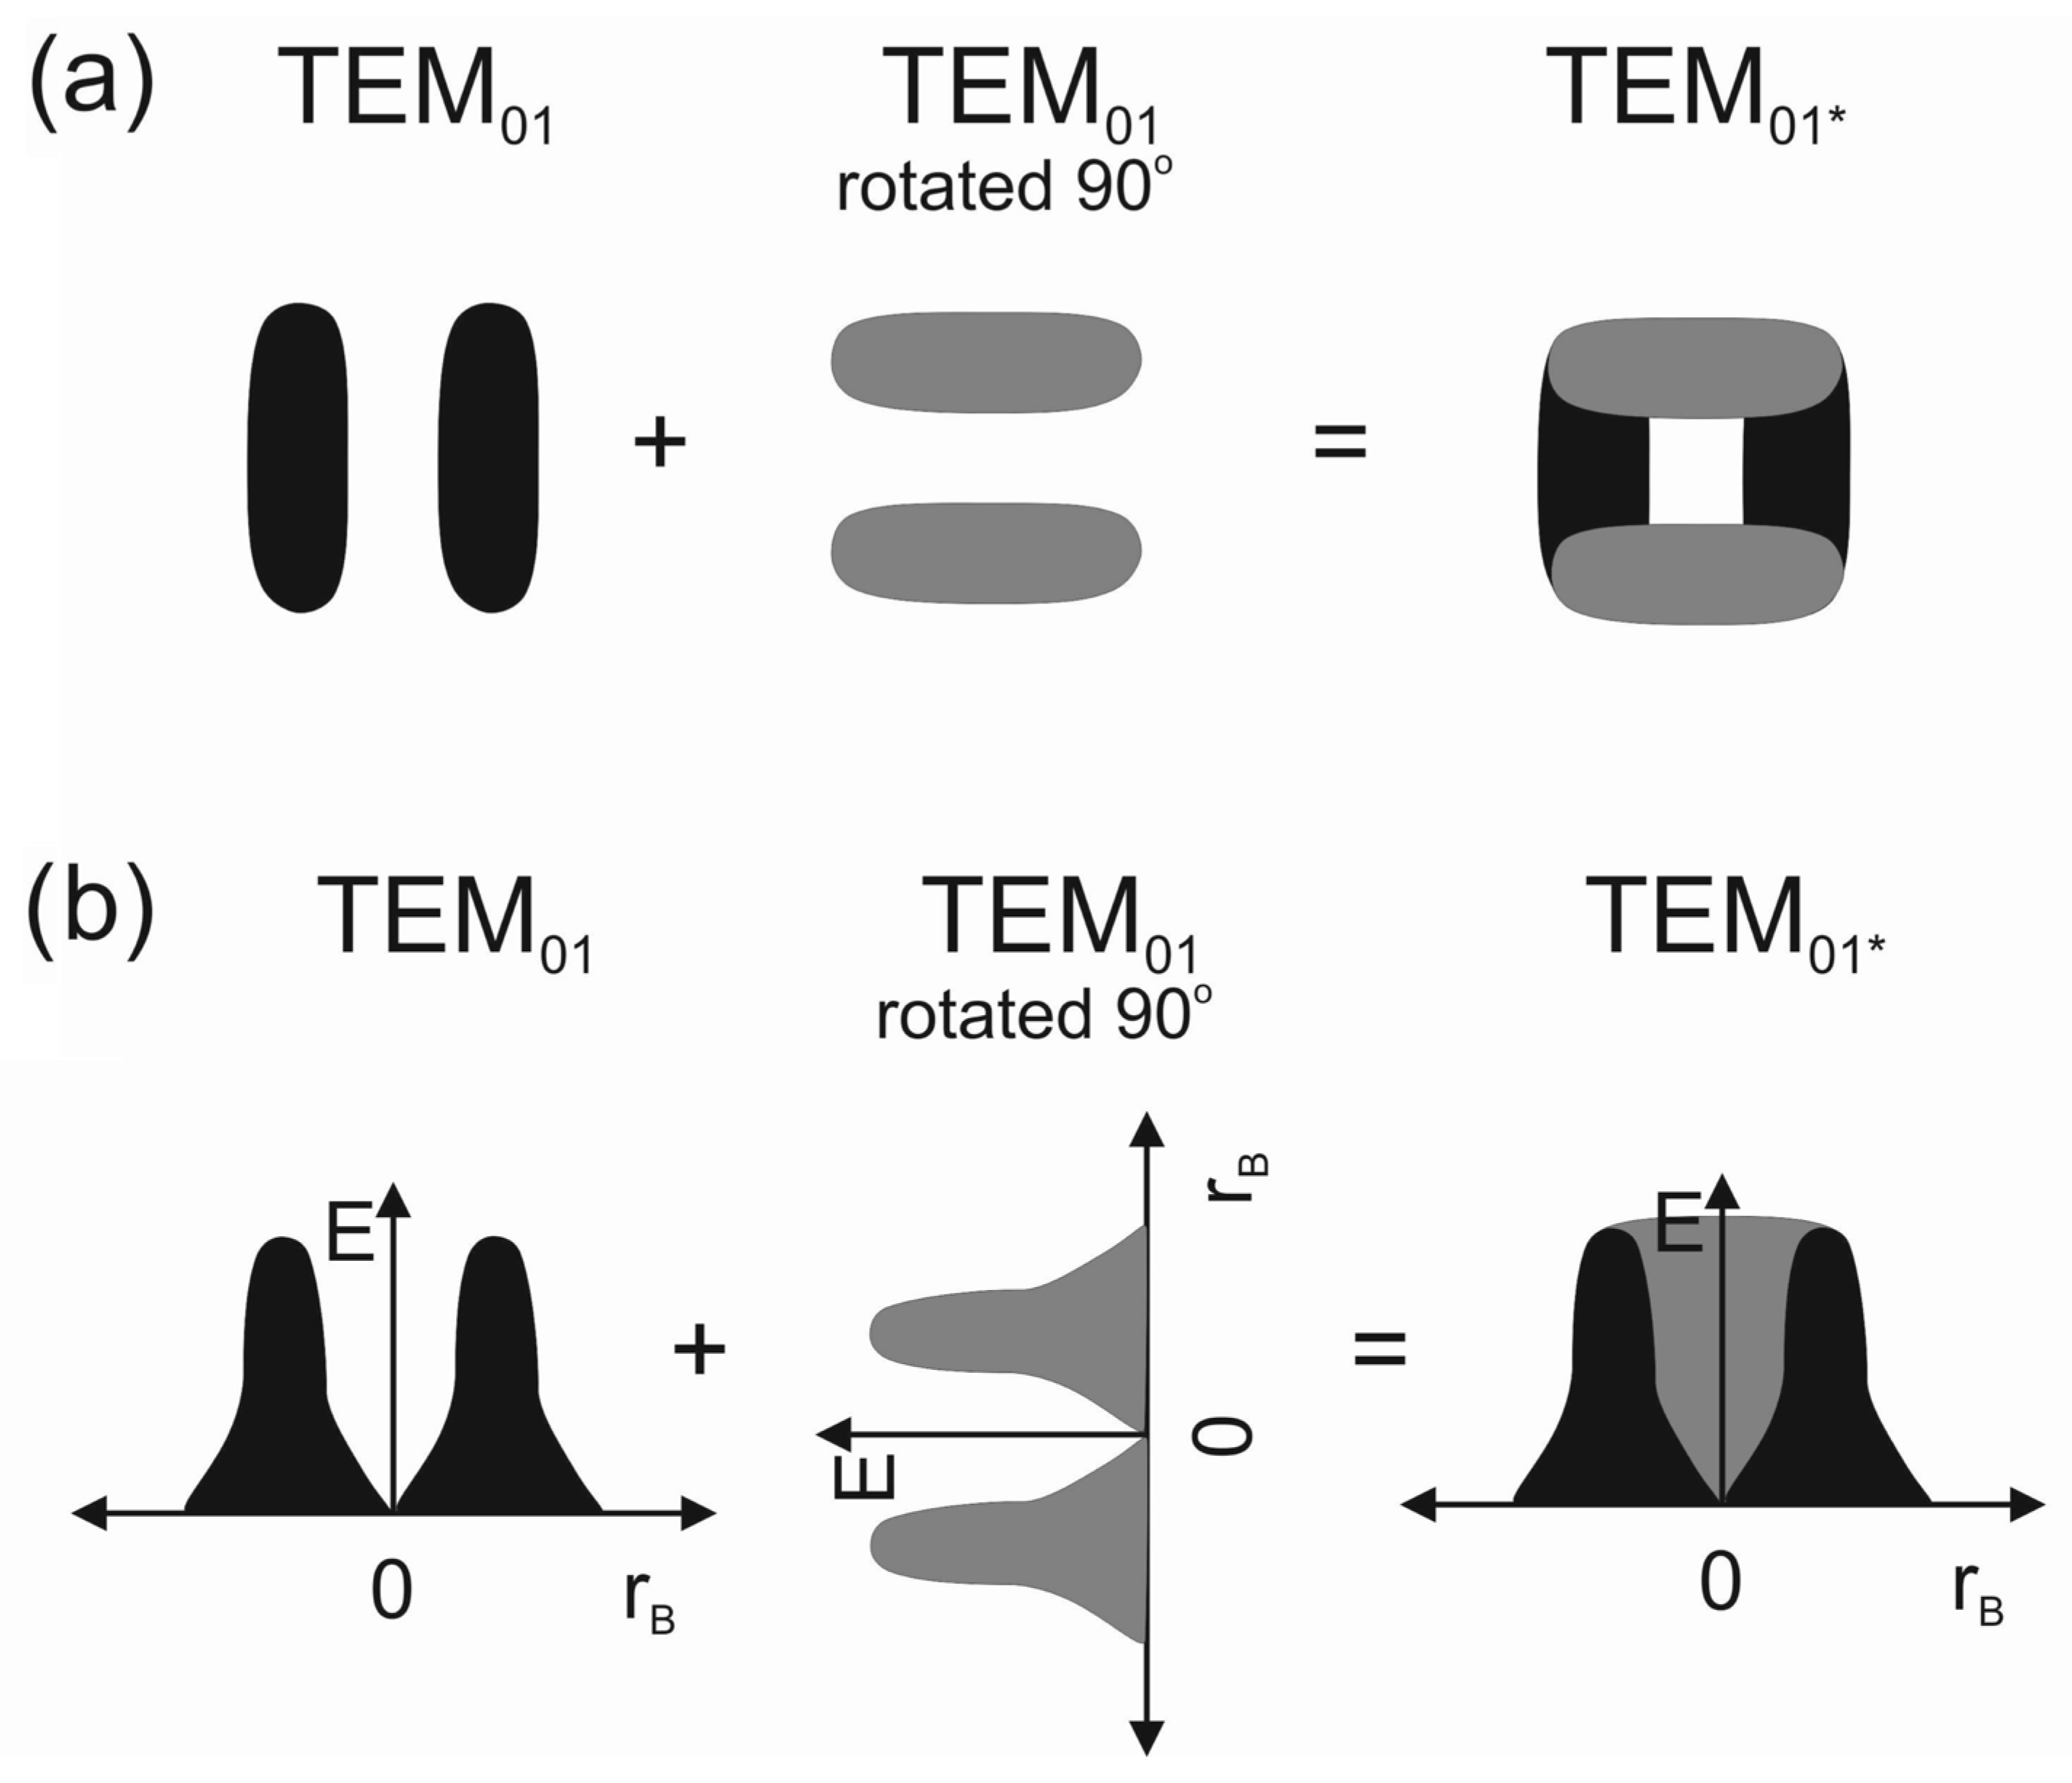
In the second step, the pre-coated paste was re-melted together with the part of the substrate material. The amount of re-melted substrate material (Nimonic 80A alloy) depended on the laser beam power used. Based on the average thickness of the produced layer, it can be concluded that the depth of re-melted substrate material increased with the increase in the laser beam power and was approx. 150 µm for the power of 1.3 kW, approx. 250 µm for the power of 1.56 kW, and approx. 400 µm for the power of 1.95 kW. The interaction between the laser beam and the treated material resulted in intense mixing of the alloying element (boron) and the alloyed material (Nimonic 80A alloy) in the molten pool. After moving the laser beam, due to high cooling rates, the molten pool solidified. Laser boriding was carried out using a continuous wave CO2 laser (TRUMPF TLF 2600 Turbo) of the nominal power 2.6 kW, coupled with a turning lathe that enabled rotation of the specimens and feed motion of the focusing head. A multiple-mode laser beam TEM01* of a circular shape and laser beam radius of 1 mm was applied. The principle of the formation of TEM01* is shown in Figure 3. This type of laser beam mode, also called doughnut mode, is a special mode consisting of a superposition of the two TEM01 modes, rotated 90° with respect to one another. The TEM01 mode is a laser beam mode with a specific irradiance profile characterized by double Gaussian normal distribution. In the case of double Gaussian normal distribution, the highest intensity of laser radiation is observed in the axes of the left and right components of the laser beam (Figure 3b). For this reason, the TEM01* mode, as a superposition of two mutually perpendicular planes of TEM01 modes, ensured obtaining a specific irradiation profile, shown in Figure 3b. This type of E profile provided the effects of the laser beam activity being independent of the direction of movement of the laser beam in relation to the treated surface [7].

Figure 3.
Schematic representation of TEM01* mode: (a) the principle of the formation of TEM01* mode as a superposition of two TEM01 modes; (b) irradiance profiles in a cross-section of a laser beam with TEM01 and TEM01* modes. rB—laser beam radius; E—irradiance.
The laser tracks were arranged as multiple tracks formed along the helical line on the outer cylindrical surface of the specimens (Figure 1). The parameters of relative motion of the focusing laser head with regard to the treated surface were as follows: scanning rate (vl) of 2.88 m·min−1 and the feed rate (vf) of 0.28 mm per revolution. Such parameters ensured the distance between the axes of adjacent tracks (f) of 0.28 mm. The parameter ensured the uniformity of produced layer is the overlapping of laser tracks (O) expressed as follows [22]:
where d—laser beam diameter (mm); f—distance between the axes of adjacent tracks.
In the present study, a high overlapping (86%) of the laser tracks was obtained, which guaranteed high uniformity of the produced layers in respect of their thickness.
The parameter determining the properties of the re-melted layer can be described by the dilution ratio (DR), which can be defined as a ratio between the thickness of the pre-coated paste th to the average thickness of the re-melted layer Th [23]. This ratio is related to the redistribution of the alloying element (boron) in the molten pool. Generally, the high value of the dilution ratio indicates a high percentage of alloying material in the re-melted zone. The laser processing parameters are presented in Table 2.
Table 2.
Parameters used during laser boriding of Nimonic 80A alloy.
Immediately after laser boriding, the specimens were cleaned and subjected to phase analysis. The specimens were not specially prepared before the test, e.g., by grinding. The phase composition of the laser borided layers produced on Nimonic 80A alloy was analyzed using X-ray diffraction, using a PANalytical EMPYREAN diffractometer with Cu Kα radiation. The test was performed on the outer cylindrical surface with a laser borided layer produced. In the present study, the concentration of nickel, chromium, and boron was measured by EDS. Generally, this method is not preferred to measure the concentration of light elements (such as, e.g., carbon, boron, and nitrogen). However, in the present study, it was only intended as a tool to show that an increased concentration of this element was noted in the laser-alloyed layer. It was not about identifying specific phases based on the weight or atomic fraction of boron. Providing the boron content was to be helpful in proving that nickel and chromium borides were formed in the laser-alloyed layer.
The microstructure of laser-alloyed layers was observed using an optical microscope (OM) (Lab 40, OptaTech; Poznan, Poland) and scanning electron microscope (SEM) (Mira3, TESCAN; Poznan, Poland) equipped with an EDS analyzer (ULTIM MAX, Oxford Instruments; Poznan, Poland). After the laser treatment, the samples were cut out perpendicular to the laser borided surface across the multiple tracks produced. The metallographic specimens were prepared by mounting them in a conductive resin and polishing using the SiC abrasive paper of different granularity (grit from 60–2000) and, finally, by applying Al2O3 slurry. In order to reveal the details of the microstructure, the samples were etched with Marble’s reagent. In order to observe the characteristic geometry of the multiple laser tracks and to measure the thickness of the produced layers, microstructure observations were carried out in the axial–radial plane of the cross-section of the samples.
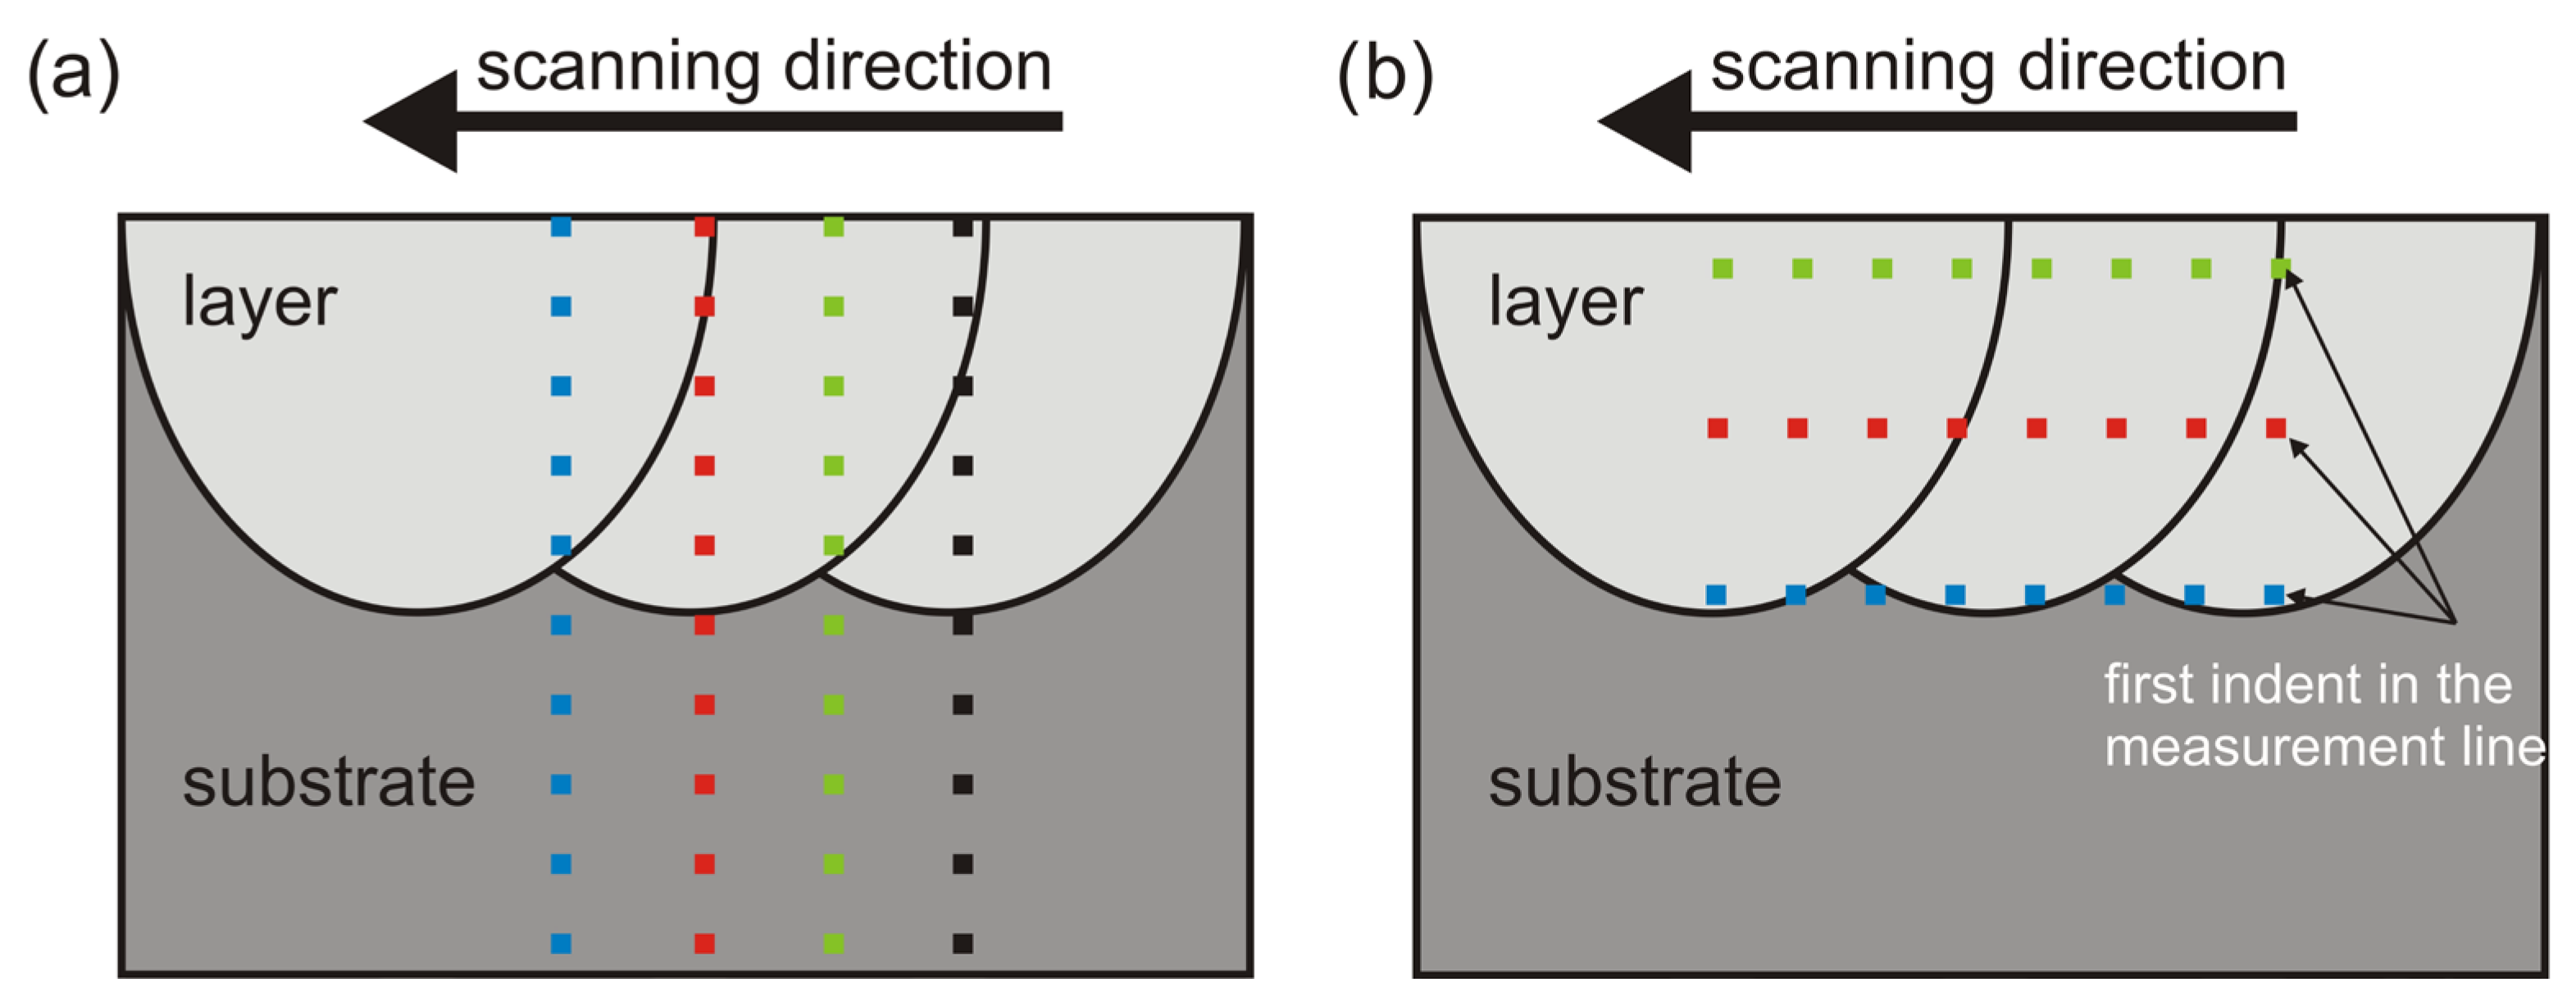
The basic mechanical property of the produced laser borided layers determined in this work was hardness. The measurements were performed using the Vickers method under a load of 0.981 N. The scheme of the location of measurement points is shown in Figure 4. First, the tests were carried out along the straight lines parallel to the top surface (Figure 4a) in the axis of the laser track (two microhardness profiles marked by black and red color) and along the contact of the adjacent tracks (two microhardness profiles marked by blue and green color). Measurements were also performed along the straight lines perpendicular to the top surface (Figure 4b) at three different distances from the top surface: 50 µm from the top surface (microhardness profile marked by green color), 200 µm from the top surface (microhardness profile marked by red color), and along the bottom of the laser tracks (microhardness profile marked by blue color). Moreover, on the basis of 100 measurements, the average microhardness of the re-melted layer alloyed with boron was calculated. The standard deviation was also calculated.
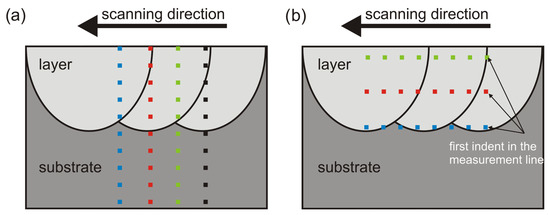
Figure 4.
The scheme of the location of measurement points used to prepare microhardness profiles: (a) measurements along the straight lines perpendicular to the top surface; (b) measurements along the straight lines parallel to the surface.
A mathematical model developed by Ashby et al. [17,18,19] was adopted to predict the shape and geometry of the molten pool. This model describes the temperature profile mathematically at each point in the laser-treated specimen. It gives the possibility to calculate the temperature at every point lying a distance of y from the center line, as well as a distance of z below the center of the laser beam. The model developed by Ashby et al. assumes a circular disc source, of radius rB, tracking with velocity vl in the direction x across the treated surface. During laser re-melting, when a laser beam power P and laser beam radius rB is tracked in the x scanning direction with velocity vl, a point at (y, z) below the surface is subjected to a thermal cycle T(y,z,t). For a laser beam with a Gaussian energy distribution, the temperature field T(y,z,t) is well approximated by the equation:
where T(x,z,t)—temperature (K); z—depth below the center of the laser track (m); y—distance from the axis of the laser beam (m); T0—initial temperature (K); A—absorptivity at the sample surface; P—laser beam power (W); λ—thermal conductivity (W·m−1·K−1); vl—scanning rate (m·s−1); t—interaction time (s); t0—time constant (s); z0—depth constant (m); α—thermal diffusivity (m2·s−1).
Thermal diffusivity α can be calculated as:
where ρ—material density (kg·m3); Cp—material specific heat (J·kg−1·K−1).
The time constant t0 was defined as a time required for heat diffusion over a distance equal to the laser beam radius rB:
where rB—laser beam radius (m); α—thermal diffusivity (m2·s−1).
The depth z0 is a constant corresponding to the distance from the surface over which heat could diffuse during the interaction time of a laser beam rB/vl. Depending on the relation between the interaction time t and the time constant t0, the depth constant z0 can be calculated in two ways.
In the case when t >> t0, z0 should be calculated from the equation:
where rB—laser beam radius (m); α—thermal diffusivity (m2·s−1); vl—scanning rate (m·s−1); e—base of natural logarithms.
When t << t0, the depth constant z0 can be expressed as follows:
where α—thermal diffusivity (m2·s−1); rB—laser beam radius (m); e—base of natural logarithms; vl—scanning rate (m·s−1).
The use of the equation to calculate the depth constant z0 requires justification. In the present study, the constant t0 was equal to 0.02884 s. Whereas, the interaction time t can be calculated as the ratio of the laser beam radius (rB = 0.001 m) to the scanning rate vl (0.048 m/s). The parameters used during laser boriding provided t = 0.02083 s. Therefore, Equation (6) was used to calculate the depth constant z0.
In the case of the present study, the mathematical model developed by Ashby et al. was adopted to model the depth of the laser borided layer. Therefore, it was necessary to understand the phenomena occurring during laser boriding. The two-step re-melting method is a specific type of surface treatment in which an alloying material (amorphous boron) must be first pre-placed on the surface of the treated material. Therefore, when laser beam action starts, the material that first interacts with the laser beam is amorphous boron, not the substrate material. For this reason, as well as due to the high thickness of the pre-coated paste (200 µm), the physical properties of amorphous boron were used for the calculation [24]: ρ = 2450 kg·m−3, λ = 27.4 W·m−1·K−1, Cp = 1290 J·kg−1·K−1, α = 0.867·10−5 m2·s−1.
The results of calculations of the temperature distribution on the cross-section of the molten pool were presented in the form of 2D images using the Matlab program, which allows drawing two- and three-dimensional function graphs.
3. Results and Discussion
3.1. Microstructure and Thickness
OM images of the cross-sections of the microstructure obtained after laser boriding of Nimonic 80A alloy are presented in Figure 5.

Figure 5.
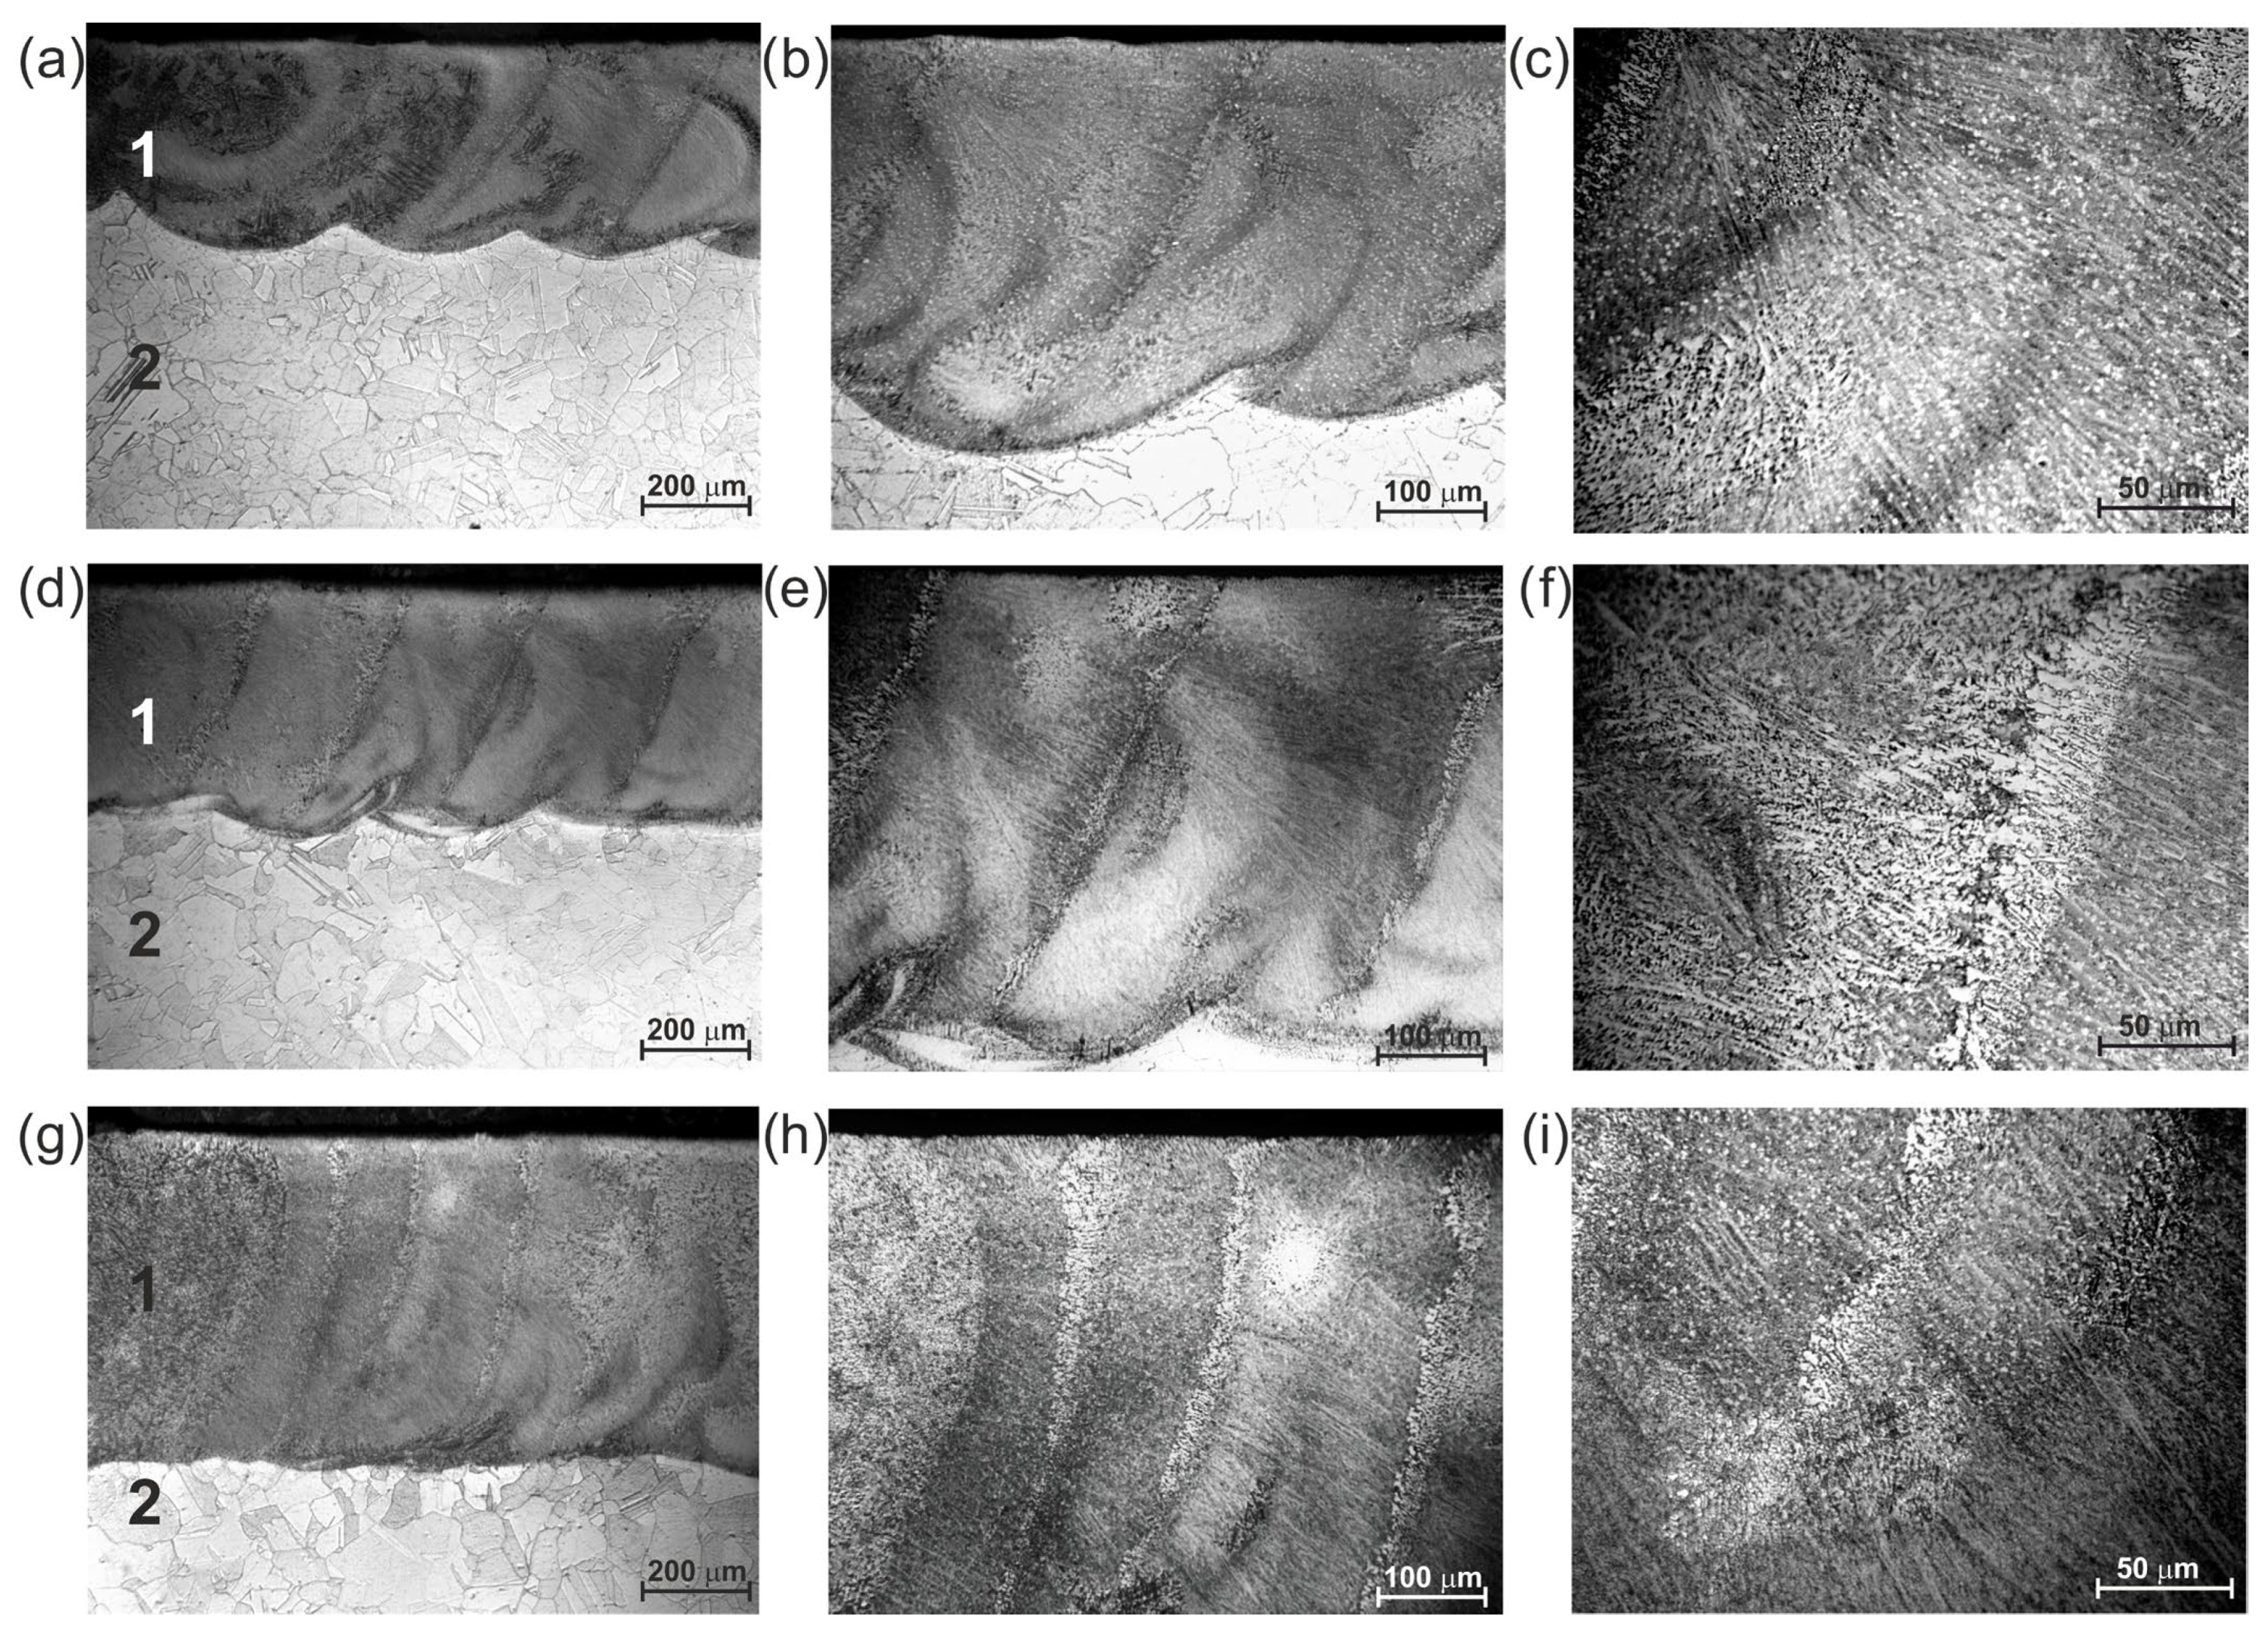
OM image of the cross-sections of the laser borided layers produced on Nimonic 80A alloy arranged as multiple tracks by using different laser beam power: (a–c) 1.3 kW; (d–f) 1.56 kW; (g–i) 1.95 kW. 1—laser re-melted layer; 2—substrate material (Nimonic 80A alloy).
The differences in the laser beam power used during re-melting caused the formation of laser borided layers differing in their thickness and geometry of the laser tracks. All produced layers were characterized by high thickness uniformity; however, some differences occurred. In the case of the laser borided layer produced at the lowest beam power of 1.3 kW (Figure 5a–c), the average thickness was 337 µm. Due to the characteristic toroidal irradiance profile of the laser beam used, the highest irradiance Emax was achieved in the center of the single laser track. Therefore, the maximum depth of the re-melted zone produced at P = 1.3 kW was obtained in the axis of each adjacent track (average 373 µm). Simultaneously, the lowest depth of the re-melted zone was measured in the contact of the adjacent tracks (average depth of 317 µm). Similarly, in the case of the laser borided layer produced using laser beam power of 1.56 kW (Figure 5d–f), the highest depth of the re-melted zone was obtained in the axis of the laser tracks and was equal to about 466 µm. The depth of the re-melted zone measured at the contact of the adjacent tracks was about 45 µm lower. The lowest differences between the depth of the re-melted zone measured in the axis of laser tracks and at the contact of the adjacent tracks were observed in the layer produced using the highest laser beam power of 1.95 kW (Figure 5g–i). The average thickness of the produced laser borided layer was about 594 µm. The observation of the morphology of the re-melted zone using the lowest magnification (Figure 5a,d,g) revealed the specific structure of this zone. It was clearly visible that in the laser tracks, the mass flux and solidification of a molten pool were related to the presence of the convection and vortex motions. The schematic images representing the direction of convection and vortex motions in a molten pool both in the z0y cross-section perpendicular to the direction of the laser beam movement and in the z0x cross-section parallel to the direction of the laser beam movement are presented in Figure 6a,b, respectively. These motions were primarily responsible for mixing, and therefore, they influenced the chemical and phase composition of the laser-alloyed layer. These are the two basic phenomena that occur during laser re-melting, even at low laser beam power values [25]. The use of higher laser beam power or higher power density increases the velocity of convection and vortex motions. The velocity of the liquid material was non-uniform close to the re-melted surface. It corresponded to the vortical nature of the mass flow. The maximal velocity corresponded to the vortex center [1,9]. At the higher laser beam power P, the flow velocity increased and the vortex motions shifted from the center of the laser track to the adjacent areas. The observation of the microstructure of the re-melted zone using higher magnification (Figure 5c,f,i) revealed the details of the morphology of this zone. The characteristic fine-grained dendritic microstructure was observed.
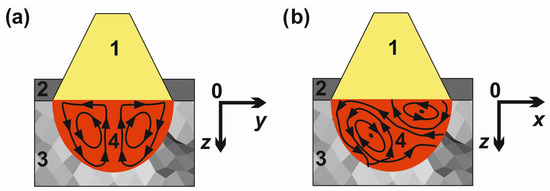
Figure 6.
Schematic representation of the direction of convection and vortex motions in a molten pool: (a) in the z0y cross-section perpendicular to the direction of the laser beam movement, (b) in the z0x cross-section parallel to the direction of the laser beam movement. 1—laser beam, 2—pre-coated paste with amorphous boron, 3—substrate material (Nimonic 80A alloy), 4—molten pool.
XRD patterns of the laser borided Nimonic 80A alloy produced using a laser beam power of 1.3 kW, 1.56 kW, and 1.95 kW are presented in Figure 7. All produced laser re-melted layers contained nickel borides (Ni2B, Ni3B, and Ni4B3) and chromium borides (CrB and Cr2B). Some peaks can be identified as Ni, which is justified because, during laser re-melting, part of the substrate material (Nimonic 80A alloy) is melted and is a part of the molten pool.
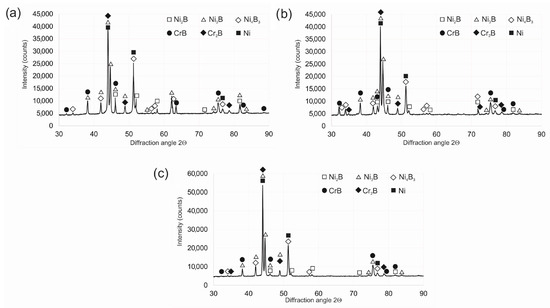
Figure 7.
XRD patterns Nimonic 80 alloy after laser boriding at laser beam power of (a) 1.3 kW, (b) 1.56 kW, and (c) 1.95 kW.
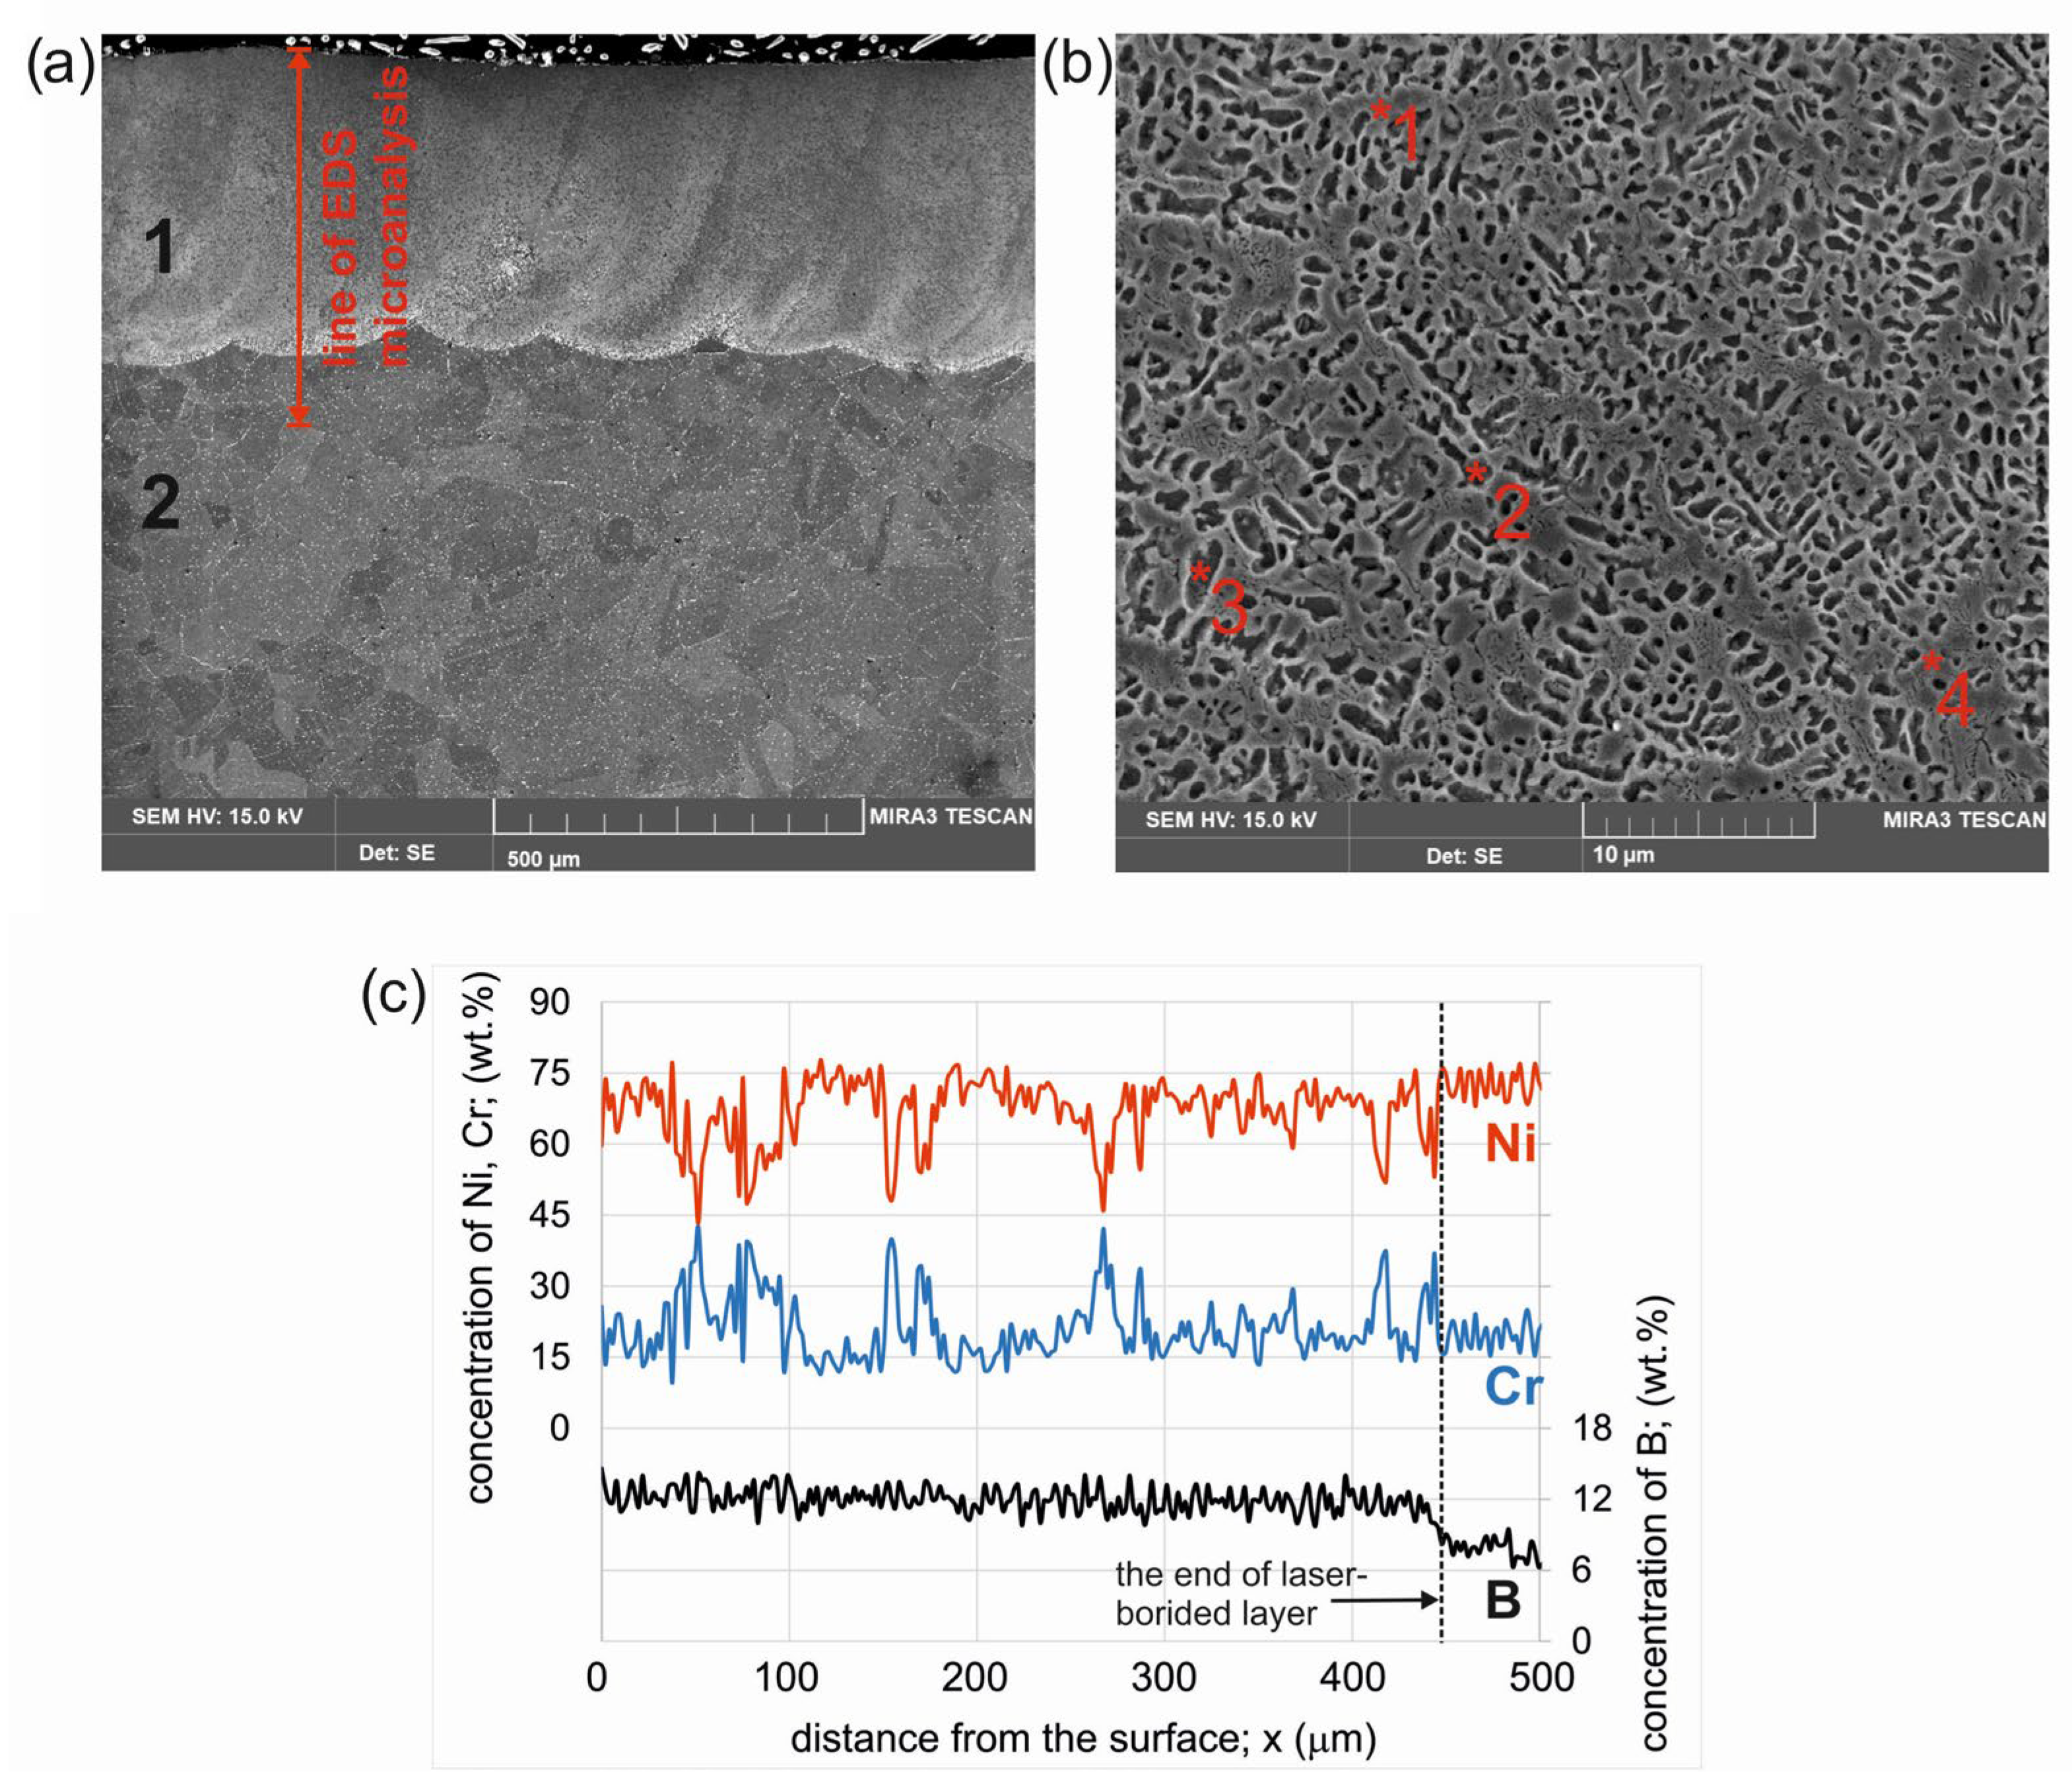
Observation of the microstructure using a scanning electron microscope (Figure 8) ensured the possibility of analyzing the details of the microstructure of the laser borided layer produced with a laser beam power of 1.56 kW. In the laser borided Nimonic 80A alloy, two zones were visible: compact re-melted zone (1) and substrate material (2). The characteristic fine-grained dendritic microstructure contained light gray and dark gray areas was observed. The four selected areas of the laser borided layer were examined using EDS microanalysis (Figure 8b). Two measuring points were selected in the light gray areas (points *1 and *4) and two in the dark gray areas (points *2 and *3). The X-ray microanalysis by EDS from the light gray areas showed increased nickel and boron concentrations, as well as decreased chromium concentration. In the point marked as *1, the following concentrations of elements were measured: 76.14 wt.% Ni, 15.33 wt.% B, and 8.53 wt.% of Cr. Similarly, in the point marked as *4, the increased nickel concentration (78.62 wt.%) and boron concentration (16.47 wt.%), as well as diminished chromium (4.91 wt.%) concentration was measured. These results suggested that the light gray grains could be identified as a mixture of nickel borides (Ni2B, Ni3B, and Ni4B3). The X-ray microanalysis from the dark gray areas showed increased chromium and boron concentrations. In the measuring point marked as *2, the following concentrations of elements were found: 78.62 wt.% Cr, 14.33 wt.% B, and 7.05 wt.% of Ni. Similarly, in the point marked as *3, the increased Cr concentration (77.94 wt.%) and boron concentration (15.05 wt.%), as well as diminished Ni (7.01 wt.%) concentration was measured. These results suggested that the dark gray grains contained a mixture of chromium borides (CrB and Cr2B).
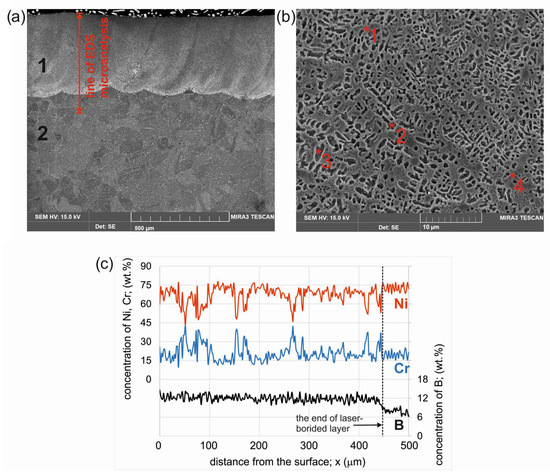
Figure 8.
SE image of the cross-sections of the laser borided layers produced on Nimonic 80A alloy using different laser beam power of 1.56 kW: (a) entire layer and substrate view; (b) details of the microstructure in the re-melted zone with EDS microanalysis points marked; (c) the results of linear EDS microanalysis; 1—re-melted zone (laser borided layer); 2—substrate material (Nimonic 80A alloy); *1, *2, *3, *4 — measuring points for EDS microanalysis.
The fine-grained microstructure formed as a result of laser alloying with boron was characterized by a multiphase composition, in which nickel borides and chromium borides occurred only in the form of a mixture. This situation has been described in many works [7,8,9]. Linear EDS X-ray microanalysis was performed to reveal the concentration-depth profiles of nickel, chromium, and boron in the cross-section of a laser borided layer produced with a laser beam power of 1.56 kW. Figure 8a shows the SE image of the investigated layer with the measurements line marked, whereas the results of the linear X-ray microanalysis are presented in Figure 8c. The increased boron concentration was visible on the cross-section of the laser borided layer, indicating that borides were formed during laser re-melting. Redistribution of the solute during laser boriding was associated with the occurrence of convection and vortex motions in the molten pool. Simultaneously, these motions were responsible for the mixing of components in the molten pool and, thus, influenced the chemical composition of the produced layer. As a result, the concentrations of the analyzed elements (Ni, Cr, B) showed a random distribution on the cross-section of the layer. A very interesting phenomenon was observed for the concentration–depth profiles of nickel and chromium, which were dependent on each other. It was found that a higher chromium concentration was accompanied by a reduced nickel concentration. Simultaneously, when a local decrease in chromium concentration was observed in the profile, a high concentration of nickel was also observed in these areas. The described phenomena proved, firstly, the occurrence of both types of boride only in separate mixtures and, secondly, the random distribution of a mixture of nickel borides and chromium borides in the laser borided layer.
3.2. Modeling the Geometry and Depth of the Re-Melted Layer
The geometry and depth of the re-melted zone depended on two types of process variables: material factors and technological factors. Material factors include the physical properties of the material (density, thermal conductivity, specific heat, and thermal diffusivity). The second type of factors were the parameters of laser boriding: laser beam radius and mode (the energy distribution in the laser beam), laser beam power, scanning rate, surface absorptivity, and thickness of pre-coated paste [14]. The temperature reached in the treated material determines the geometry of the molten pool and the depth of the re-melted zone. The change of state from solid to liquid takes place when the temperature in the treated area exceeds the melting point (for the Nimonic 80A alloy, it is 1593 K). Therefore, the modeling of the depth, width, and geometry of the molten pool and then the solidified laser track could be determined on the basis of the temperature distribution during laser beam action. Obviously, the mathematical model used in the present study, according to Ashby et al. [17,18,19], required some assumptions and simplifications. Firstly, the surface absorptivity A and physical properties of the material (thermal conductivity, thermal diffusivity, specific heat) were constant and temperature independent. Secondly, the initial temperature T0 was constant and was equal to 293 K. Thirdly, it was assumed that the physical properties of amorphous boron would be taken into account for the calculations because of the high thickness of the pre-coated paste.
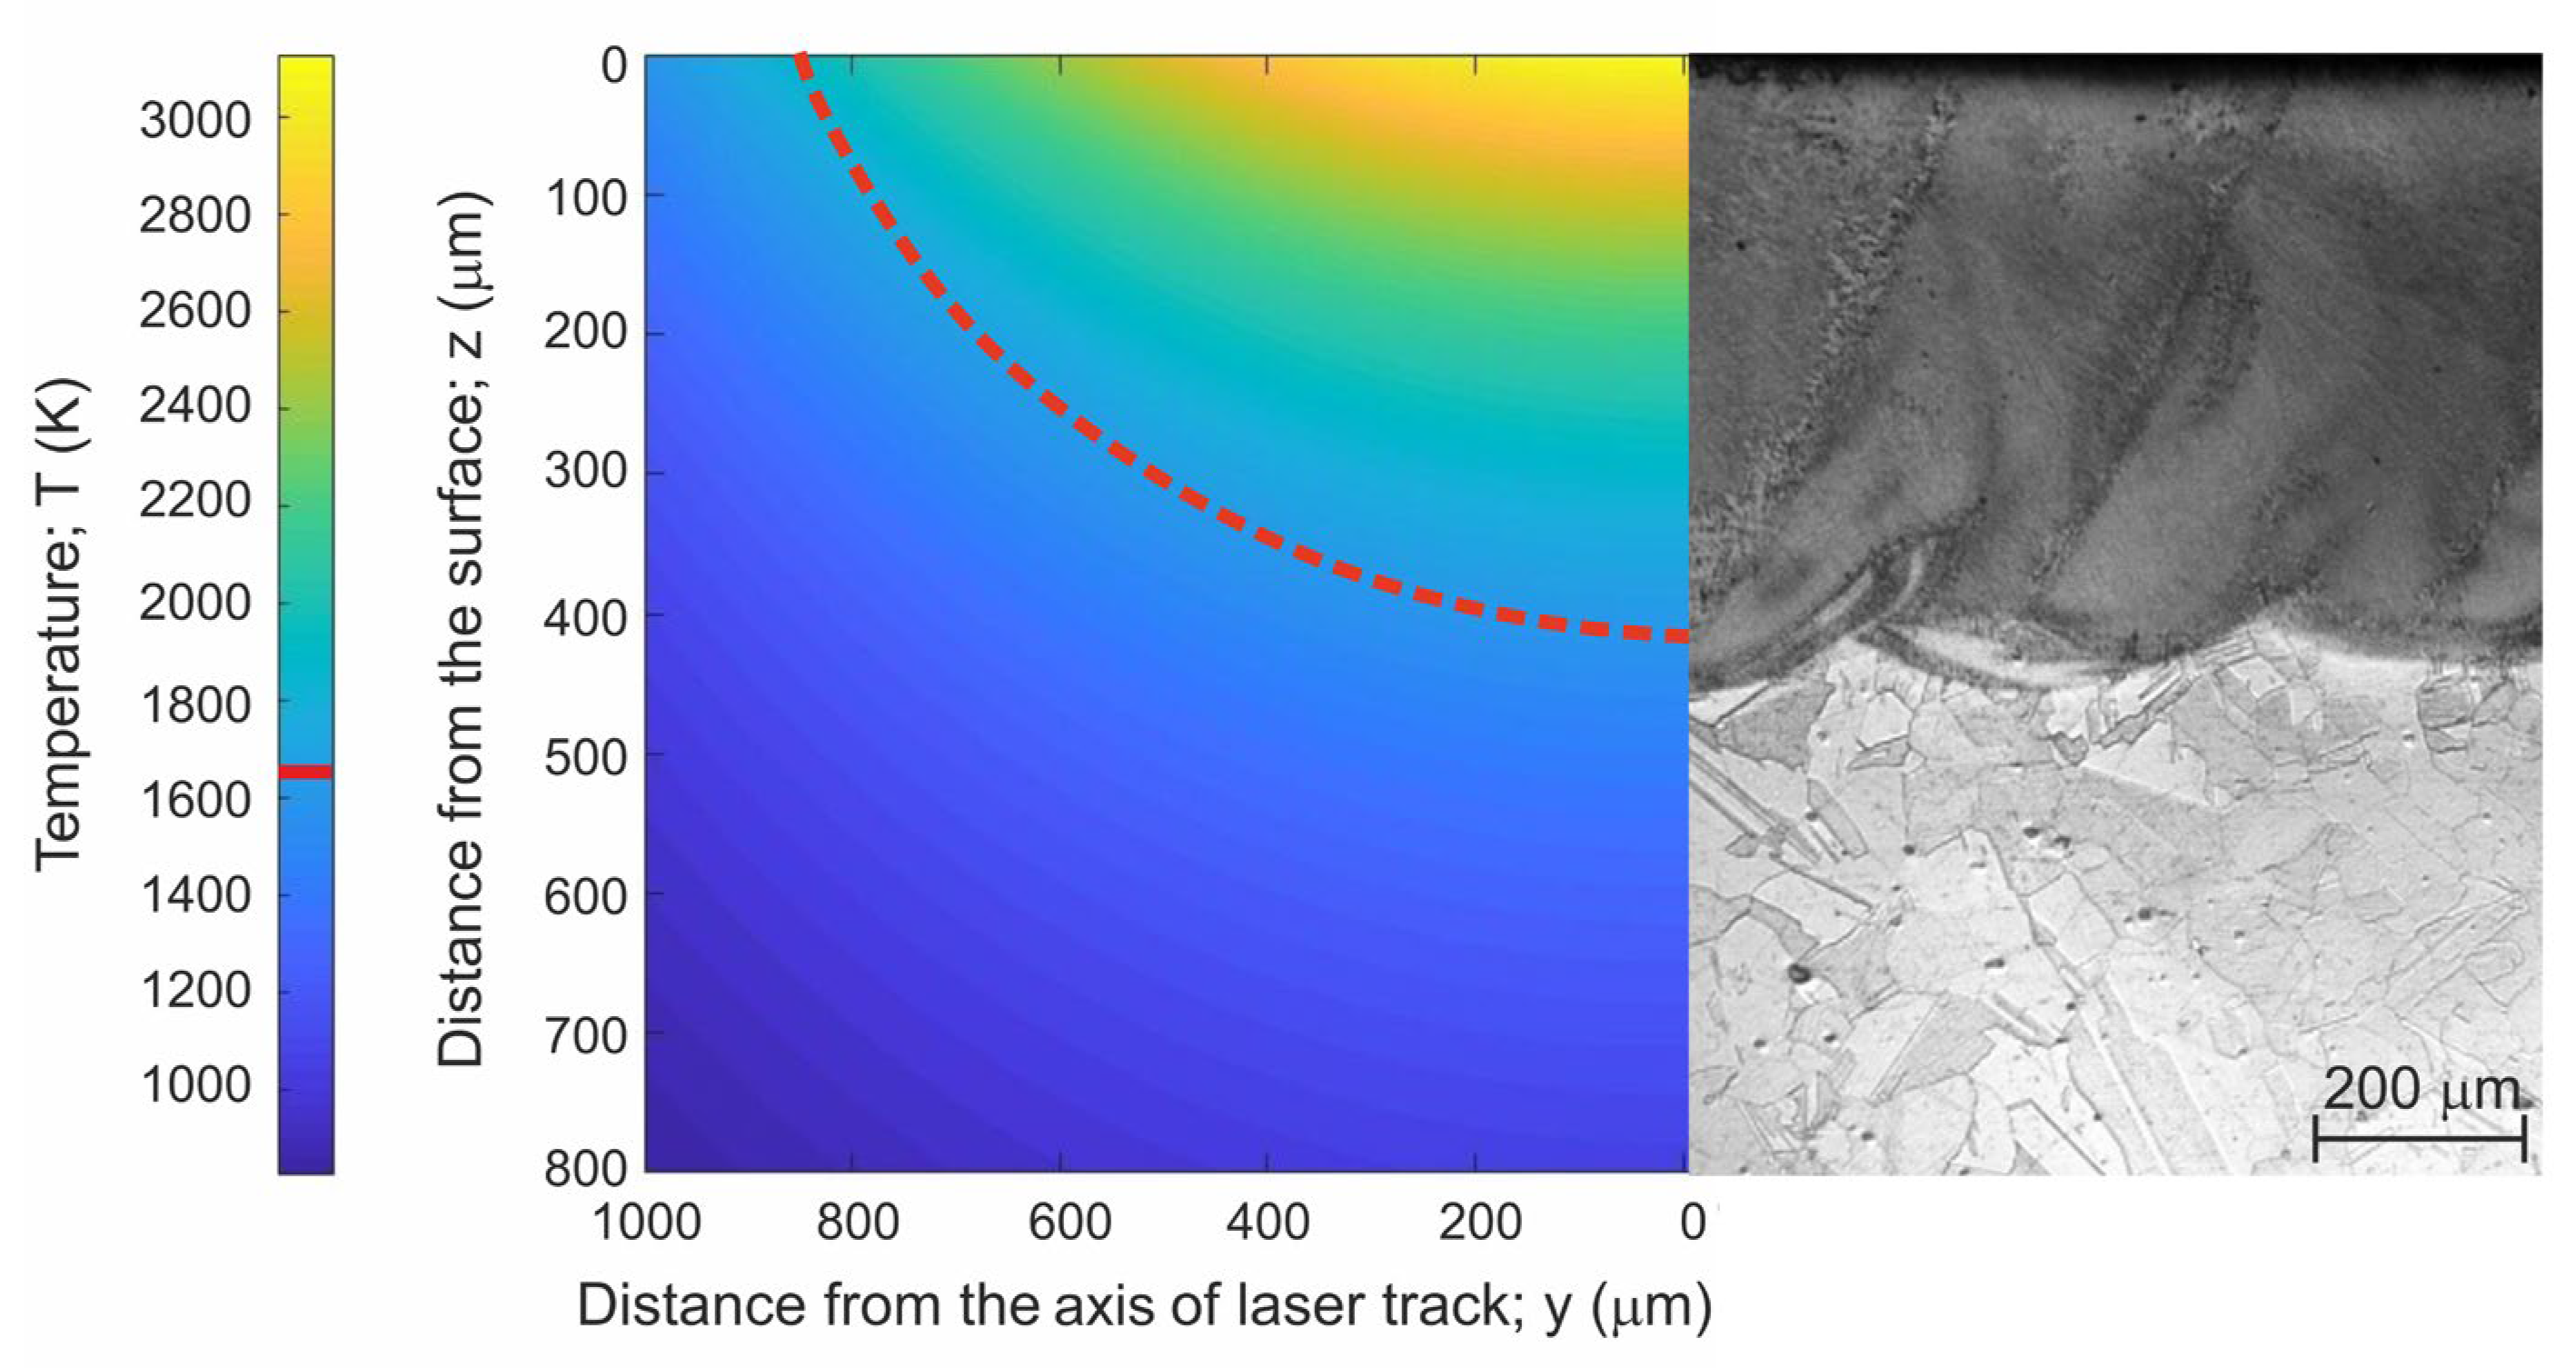
On the basis of Equation (2), a model of a 2D cross-section through a single laser track was prepared. This 2D cross-section presented temperature distribution in the molten pool. The molten pool boundary was determined based on the melting point of Nimonic 80A alloy. The prepared 2D cross-sections were compared with the experimentally obtained laser re-melted layers produced on Nimonic 80A alloy (Figure 9, Figure 10 and Figure 11). The comparison of the modeled depth of the re-melted layer with the experimental results is presented in Table 3.
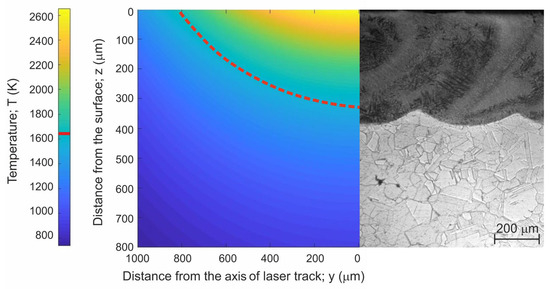
Figure 9.
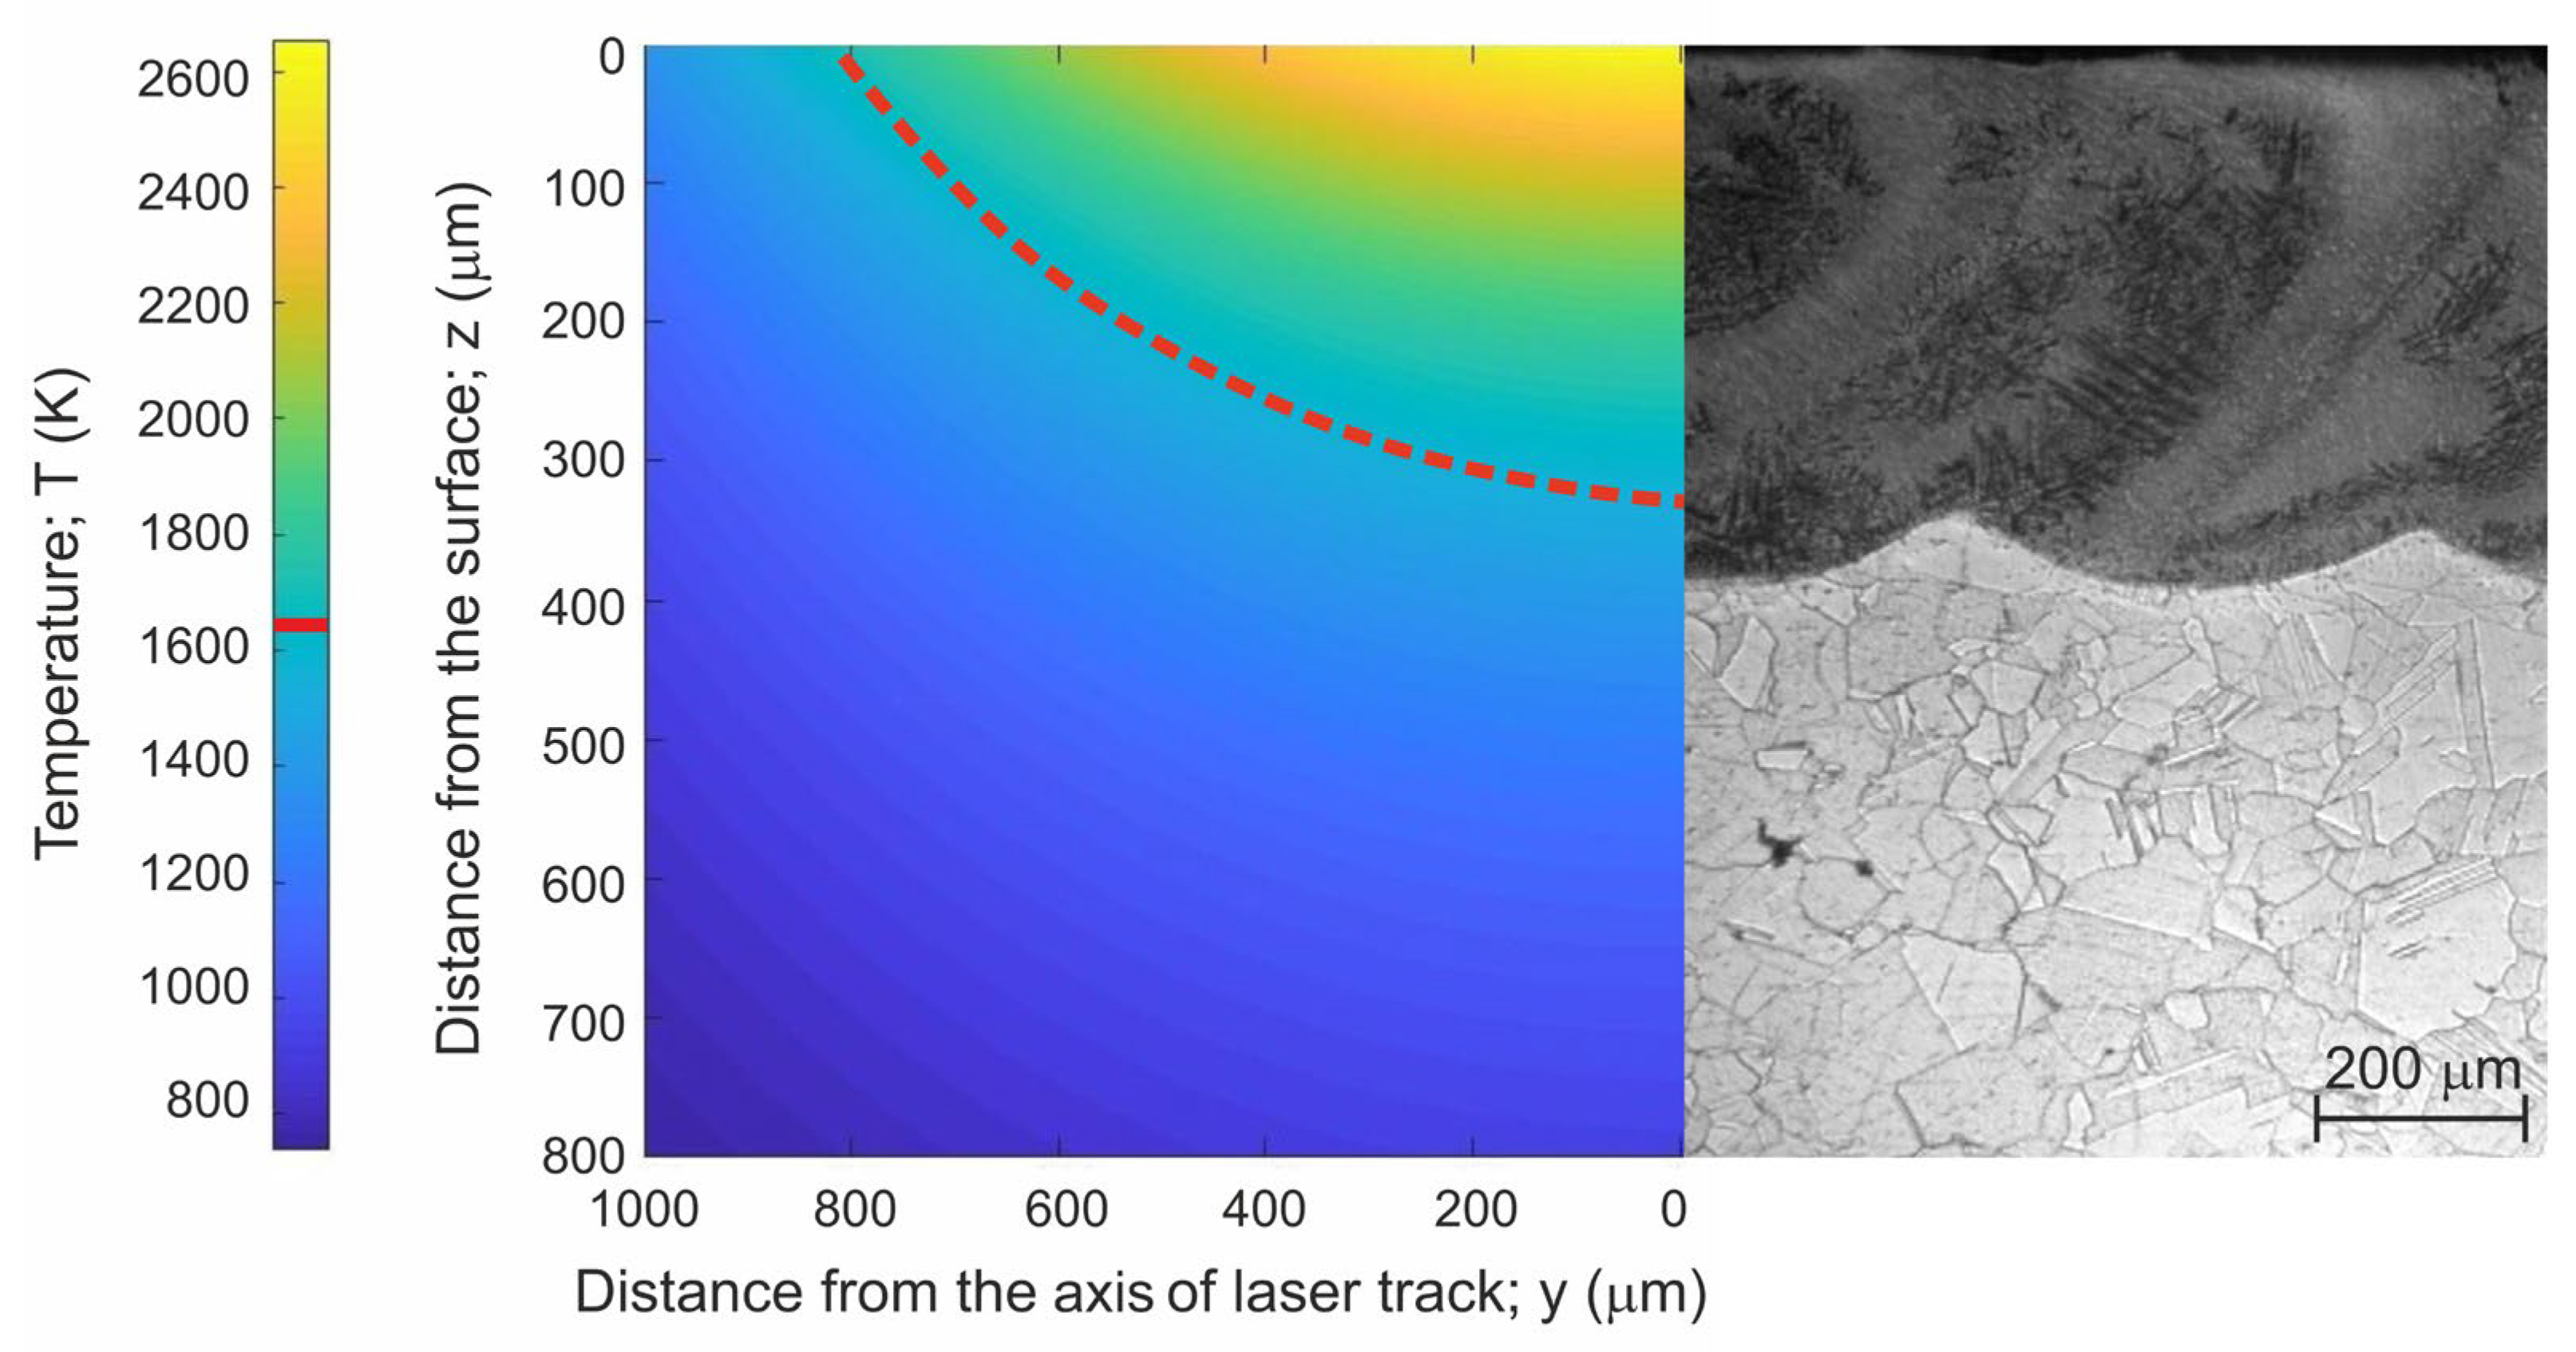
A 2D cross-section of the temperature distribution in the molten pool with marked melting point of Nimonic 80A alloy and the OM microstructure of laser borided layer produced at the laser beam power of 1.3 kW.

Figure 10.
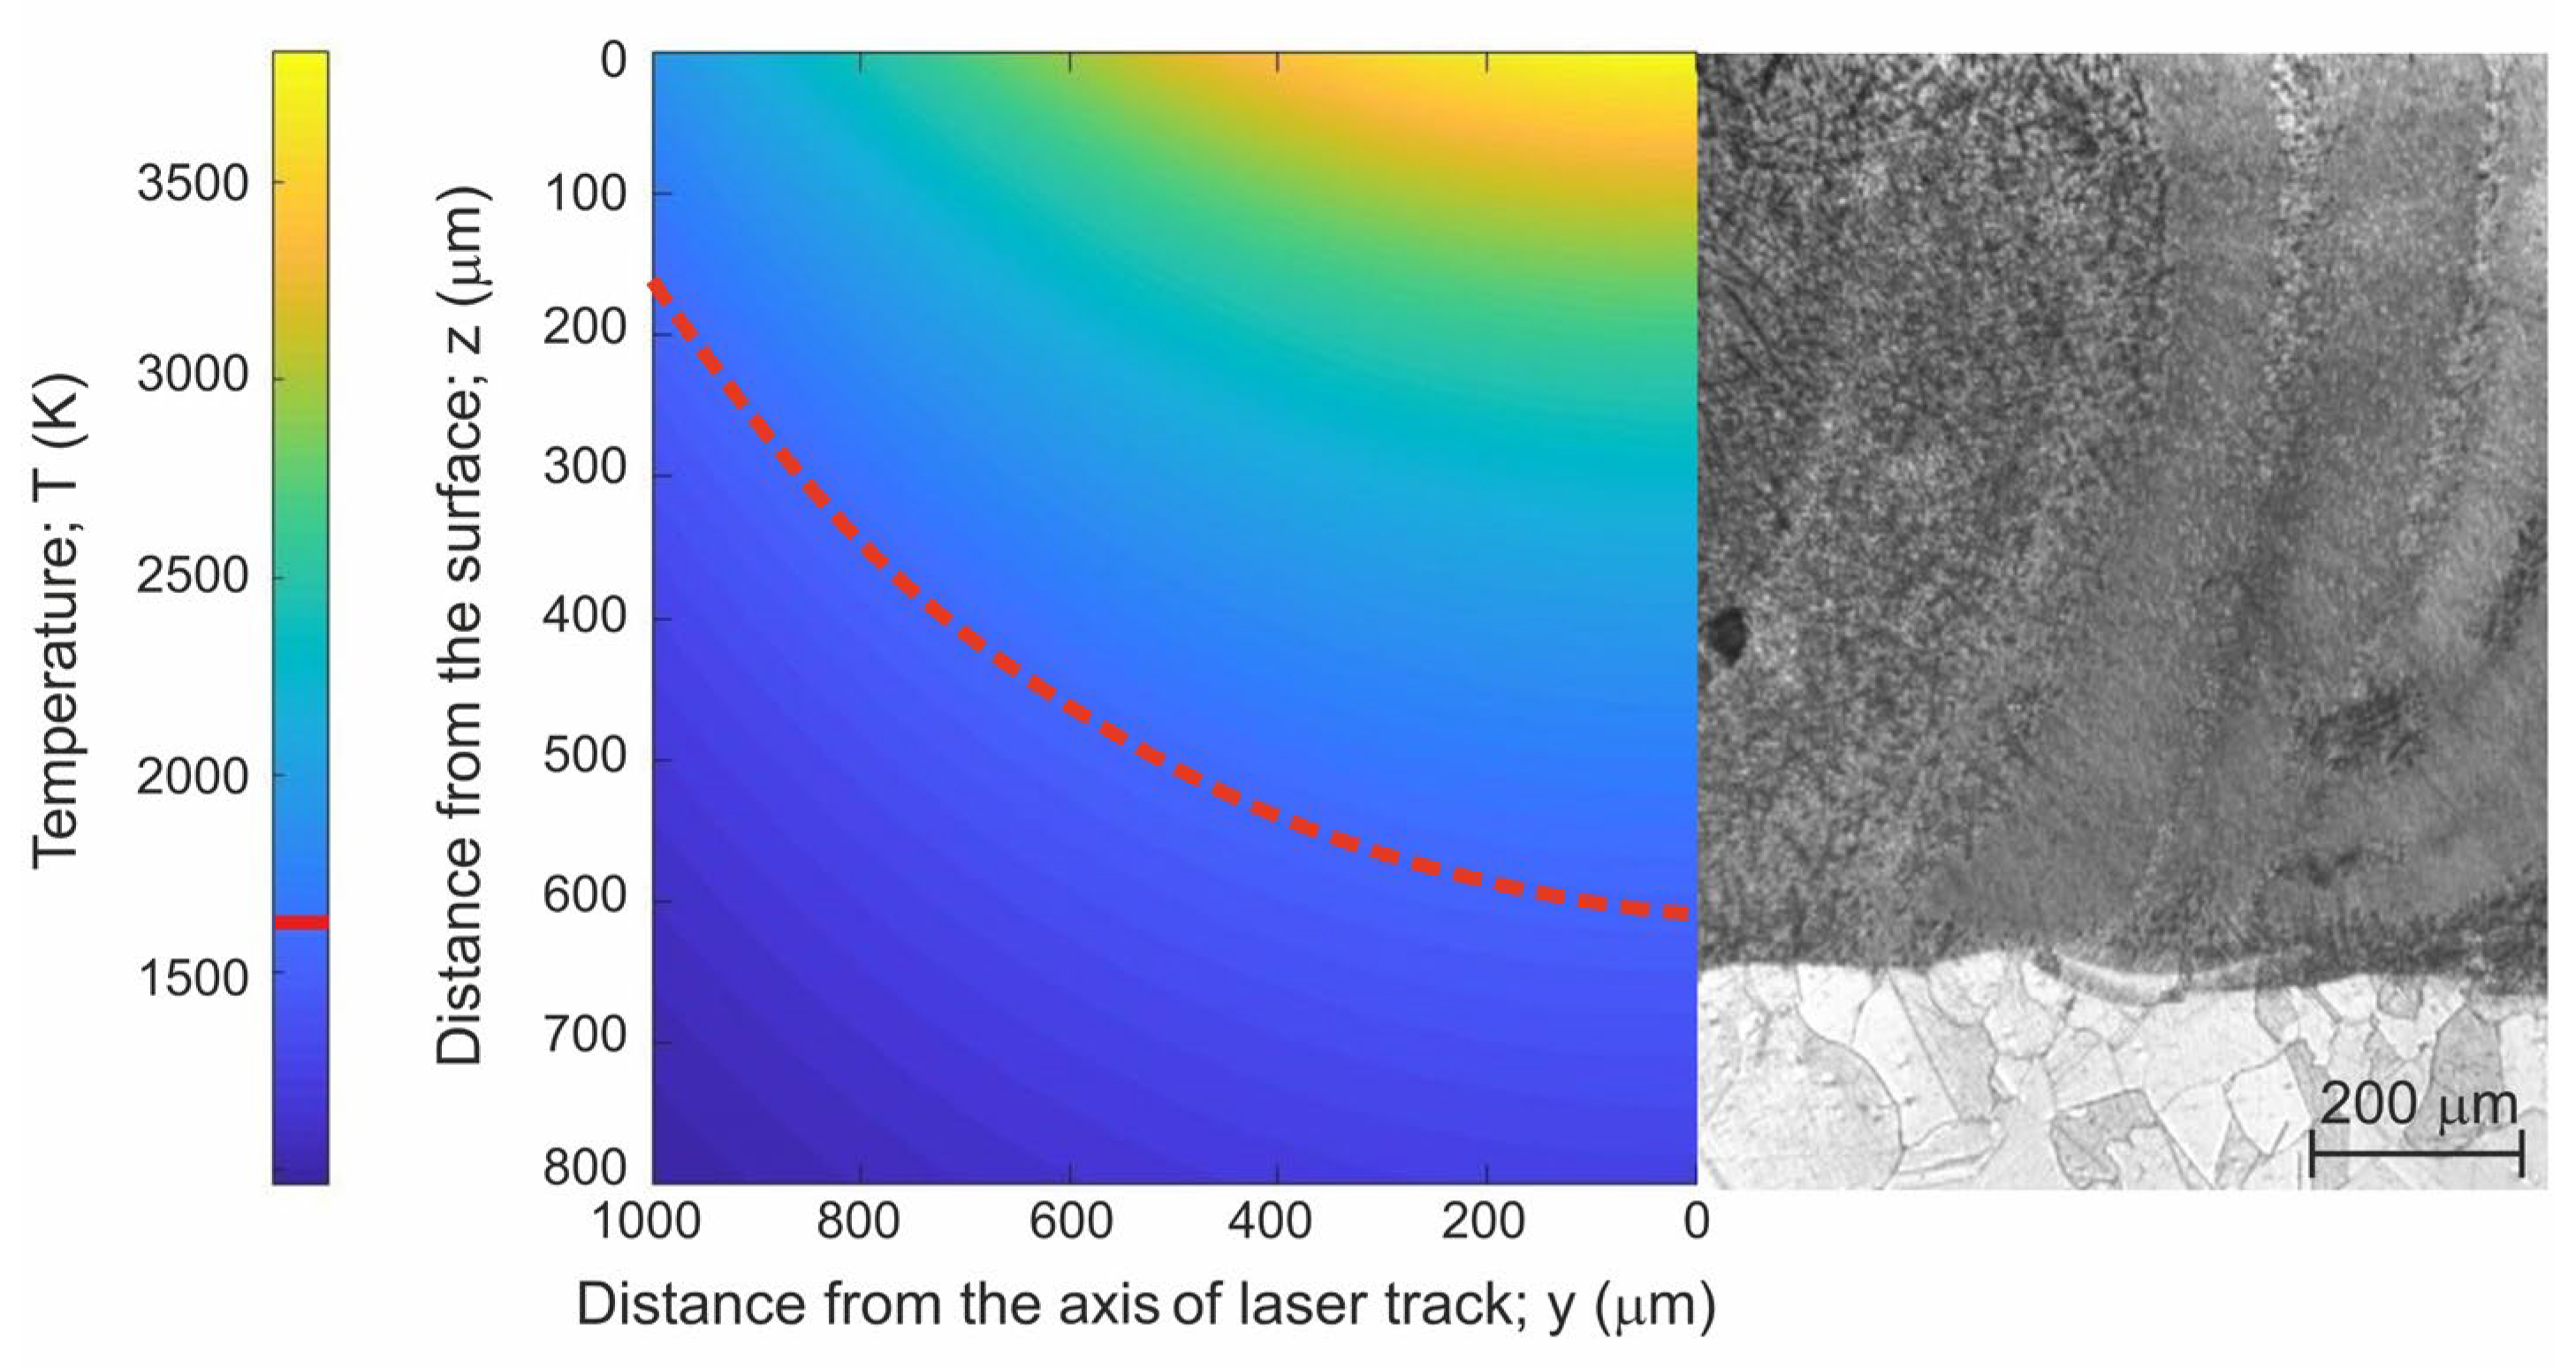
A 2D cross-section of the temperature distribution in the molten pool with marked melting point of Nimonic 80A alloy and the OM microstructure of laser borided layer produced at the laser beam power of 1.56 kW.

Figure 11.
A 2D cross-section of the temperature distribution in the molten pool with marked melting point of Nimonic 80A alloy and the OM microstructure of laser borided layer produced at the laser beam power of 1.95 kW.
Table 3.
Modeled depths and maximum temperatures compared with experimental thickness of laser borided layers produced on Nimonic 80A alloy.
The modeled geometry of the molten pool reflects the toroidal irradiance profile of the laser beam used; therefore, the highest depth of the molten pool was achieved in the center of the single laser track. For each laser beam power used, the maximum temperature was obtained at a surface and was equal to 2663 K for P = 1.3 kW, 3122 K for P = 1.56 kW, and 3829 K for P = 1.95 kW. The increase in laser beam power resulted in an increased volume of the molten pool, as well as its maximum depth. In the case of the lowest laser beam power of 1.3 kW, the modeled maximum depth of the molten pool was 308 μm. The increase in laser beam power to 1.56 kW ensured a higher depth of 417 μm. A further increase in the laser beam power caused re-melting, which reached a depth of 567 μm from the surface in the axis of the molten pool. All modeled maximum depths of the molten pool were lower than the experimentally produced laser borided layers. However, the increase in laser beam power reduced this difference to only 5.7% for the layer formed using a laser beam power of 1.95 kW. In the case of the lowest laser beam power, the modeled maximum depth of the molten pool was about 17.4% lower than the experimentally produced layer. The mathematical model developed by Ashby et al. [17,18,19] was characterized by some simplifications, e.g., the initial temperature T0 was constant and thermal properties were temperature independent. The other important factor which could be the reason for the difference between modeled and experimental layer thickness was the production of multiple laser tracks. However, it should be emphasized that despite the assumed simplifications, the mathematical model adopted in this work to predict the depth of the re-melted zone quite well reflects the melting conditions during the laser treatment.
The mathematical model developed by Ashby et al. [17,18,19] was characterized by some simplifications, e.g., the initial temperature T0 was constant and thermal properties were temperature independent. The other important factor which could be the reason for the difference between modeled and experimental layer thickness was the production of multiple laser tracks.
3.3. Microhardness of the Re-Melted Layer
The laser beam power used during laser boriding directly determined the thickness of the produced layer. However, the increase in the laser beam power also increased the depth of the re-melting zone. It was accompanied by a greater percentage of the substrate material in the molten pool. According to Table 1, the dilution ratio decreased with increased laser beam power, from 0.59 for P = 1.3 kW to 0.34 for P = 1.95 kW. It was, therefore, expected that the power of the laser beam would also affect the hardness of the re-melted layer. The microhardness of the laser borided layers was measured, and the microhardness profiles are presented in Figure 12, Figure 13 and Figure 14.
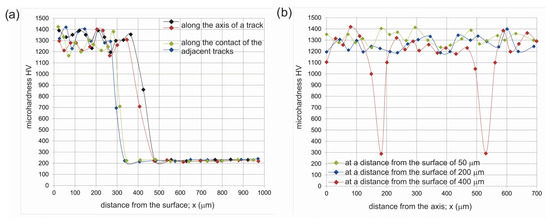
Figure 12.
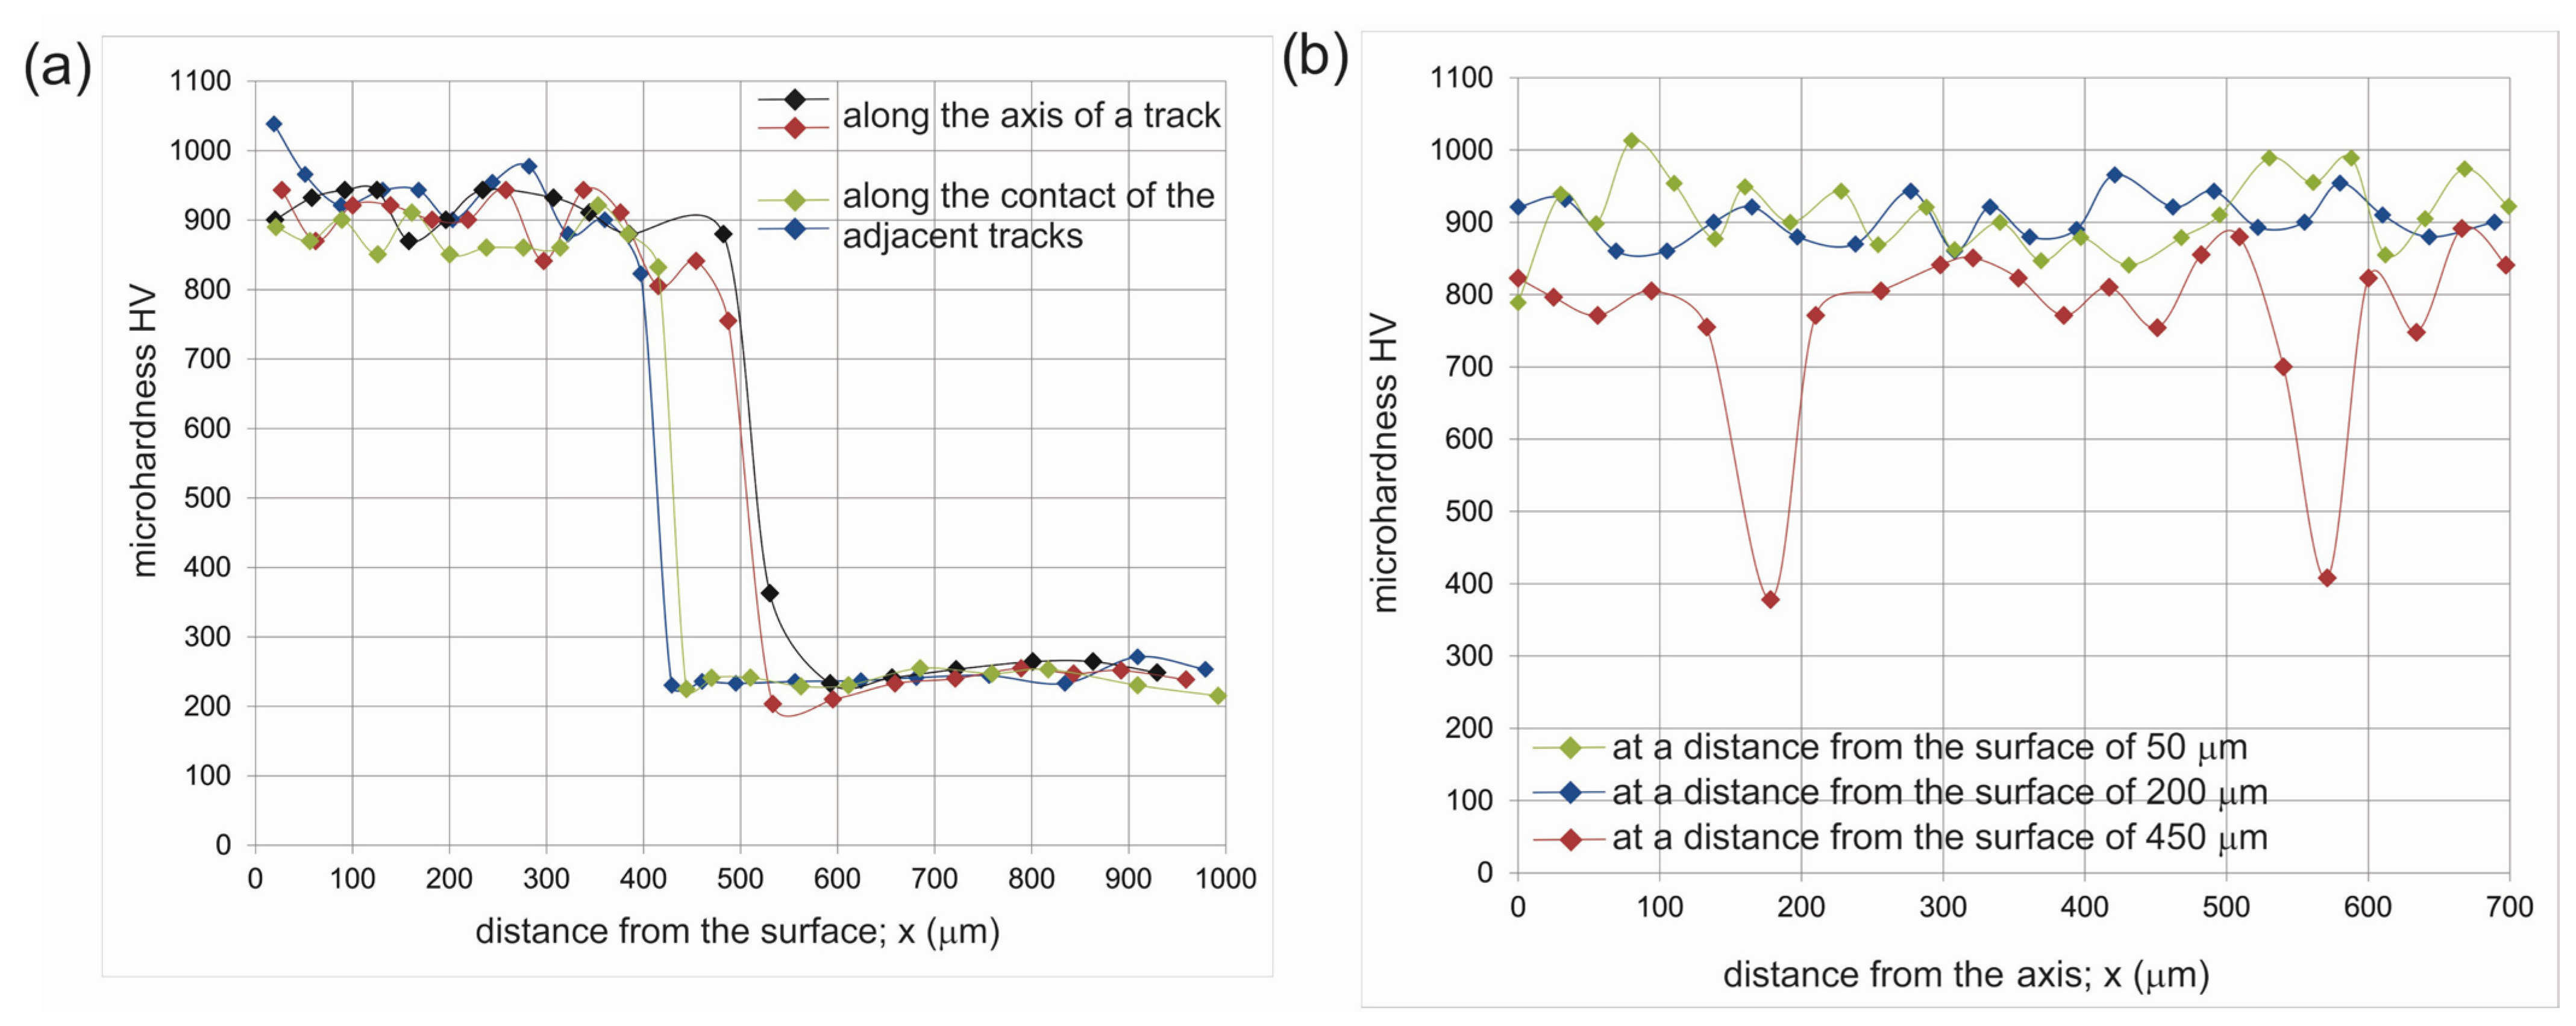
The microhardness profiles of laser borided layer produced on Nimonic 80A alloy at the laser beam power of 1.3 kW: (a) measurements along the axis of a track and along the contact of the adjacent tracks; (b) measurements along the straight line parallel to the surface.
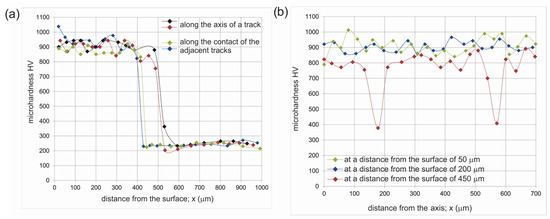
Figure 13.
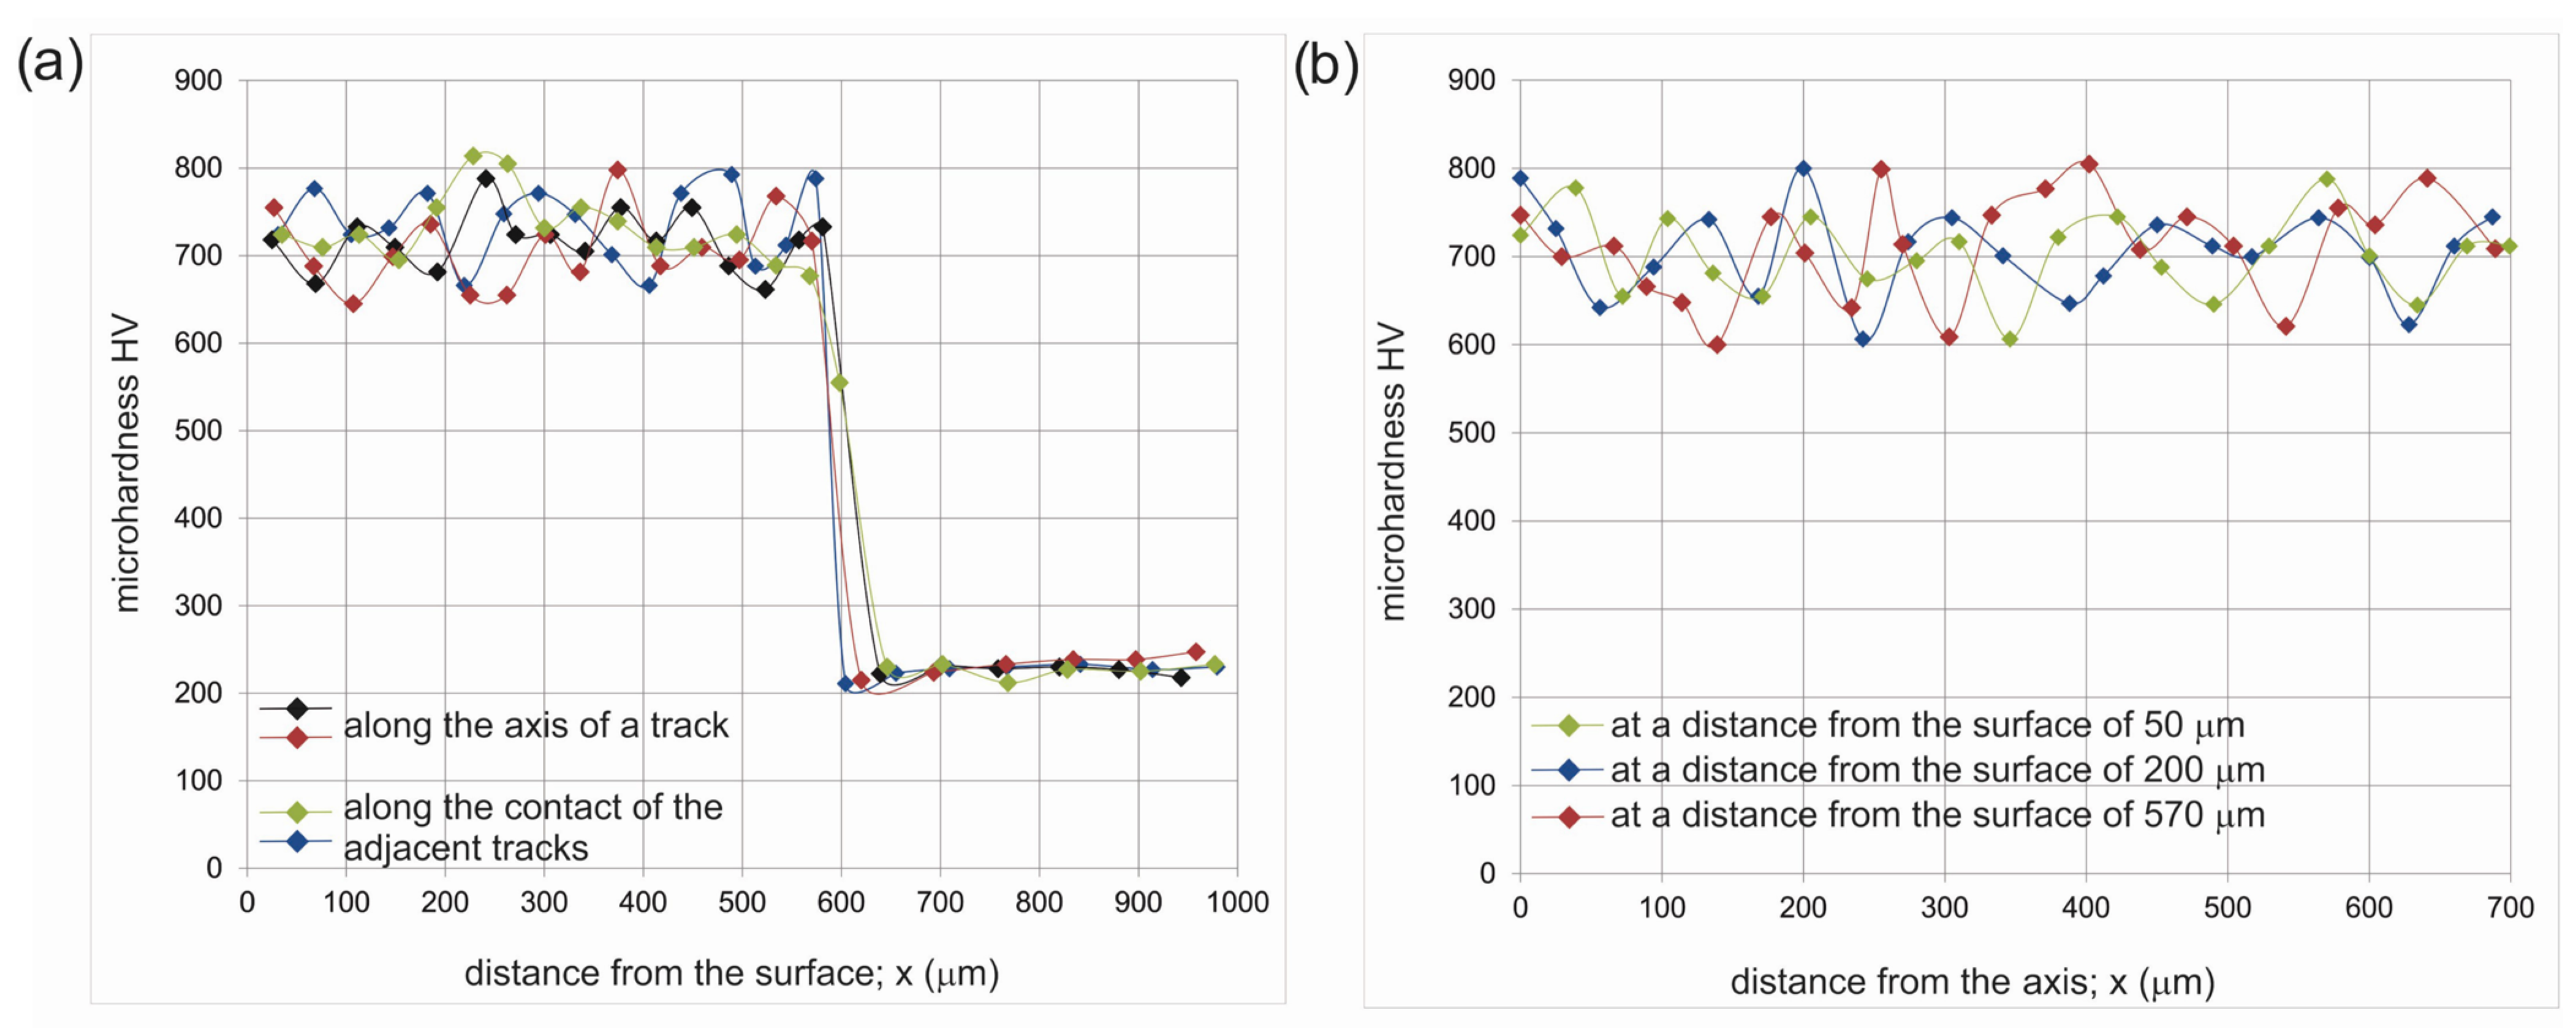
The microhardness profiles of laser borided layer produced on Nimonic 80A alloy at the laser beam power of 1.56 kW: (a) measurements along the axis of a track and along the contact of the adjacent tracks; (b) measurements along the straight line parallel to the surface.
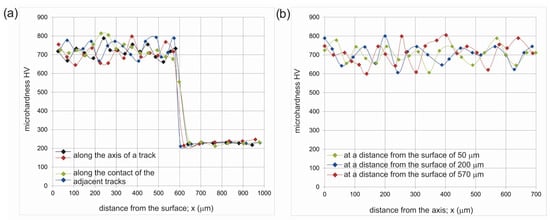
Figure 14.
The microhardness profiles of laser borided layer produced on Nimonic 80A alloy at the laser beam power of 1.95 kW: (a) measurements along the axis of a track and along the contact of the adjacent tracks; (b) measurements along the straight line parallel to the surface.
As expected, the highest microhardness (average value of 1295 ± 67 HV) was measured in the laser borided layer produced at the lowest laser beam power of 1.3 kW. At the bottom of the laser track, lower hardness was measured (700–860 HV). This situation was caused by the increased amount of substrate material in the microstructure in this area. In the case of the measurements performed at the contact of the adjacent tracks, the high hardness reached a lower distance from the surface when compared to the profiles carried out in the axis of laser tracks (Figure 12a). A similar situation was observed in the laser borided layer produced with a laser beam power of 1.56 kW (Figure 13a). This was a result of the characteristic geometry of the laser tracks. The increase in laser beam power was the reason for the diminished average hardness of the re-melted layer: 919 ± 52 HV for the layer produced at P = 1.56 kW and 721 ± 47 HV for the layer produced at P = 1.95 kW. The higher laser beam power caused the re-melting of a greater amount of substrate material, and, therefore, the content of borides in the re-melted zone was lower. This resulted in reduced hardness. The analysis of microhardness profiles performed in the layer produced at a laser beam power of 1.95 kW confirmed that this layer was characterized by the lowest differences between the depth of the re-melted layer measured in the axis of laser tracks and at the contact of adjacent tracks (Figure 14a).
The microhardness profiles performed along the straight lines parallel to the top surface are presented in Figure 12b, Figure 13b and Figure 14b. Three different distances from the top surface were selected for measurements: two in the re-melted layer (at a distance of 50 µm and 200 µm from the top surface) and one at a distance corresponding to the bottom of the laser tracks. In the case of all layers, the measurements performed at a distance of 50 µm and 200 µm from the top surface indicated that the re-melted layer was characterized by considerable uniformity in respect of hardness. The results indicated that intensive mixing occurred during laser boriding. Simultaneously, the alloying element (boron) was well distributed in the molten pool. When the distribution of boron in the re-melted layer was insufficient, the measured microhardness differed significantly.
In the case of measurements carried out at a distance from the top surface corresponding to the bottom of the laser tracks, in the areas of contact of the adjacent tracks, the lower hardness was obtained, but only in the case of laser beam power of 1.3 kW and 1.56 kW. For the layer produced at P = 1.3 kW, the differences between the depth of the re-melted layer measured in the axis of the laser track and at the contact of the adjacent tracks were the highest; therefore, the Vickers indents carried out at the contact of the adjacent tracks were performed entirely in the substrate material. This resulted in a hardness of less than 300 HV (Figure 12b). The increase in laser beam power to 1.56 kW caused the formation of a more uniform laser borided layer with respect to the thickness; therefore, the Vickers indents carried out at the contact of the adjacent tracks were performed partially in the substrate material and partially in the re-melted zone. This resulted in a hardness of 400 HV (Figure 13b). The high uniformity of thickness of the laser borided layer produced at the highest laser beam power of 1.95 kW was the reason for the high hardness measured at a distance corresponding to the bottom of the laser tracks, even at the contact of the adjacent tracks (Figure 14b).
An important feature of the profiles shown in Figure 12, Figure 13 and Figure 14 is the oscillation of the points forming the profiles. Such a situation occurs for all examined layers and requires explanation. First, the profiles show the distribution of microhardness on the cross-section of the laser borided layers. The individual indents were performed in areas that differed in the distance from the surface and, above all, in the content of chromium and nickel. Such a situation was proved by the linear EDS microanalysis (Figure 8c). It was found that the nickel borides (Ni2B, Ni3B, Ni4B3) and chromium borides (CrB, Cr2B) occurred in the borided layer only in the form of a mixture. The distribution of these types of mixtures was random and independent of the distance from the top surface. The characteristic multiphase microstructure of the laser borided layers produced on Nimonic 80A alloy, as well as no zonation of the occurrence of individual borides in the cross-section of the layer, were two main reasons for the differences in microhardness profiles performed in the cross-sections of all investigated layers (Figure 12, Figure 13 and Figure 14). Such a situation was also observed for gas borided layers produced on Ni–Cr alloys [26]. Kulka et al. indicated that the mixture of chromium borides produced by laser boriding of Inconel 600 alloy was characterized by higher hardness (average hardness of 2879.32 HV) compared to nickel borides (average hardness of 1377.05 HV) [8]. The determination of the hardness of both mixtures (nickel borides, chromium borides) was possible because of the low load (50 mN) used during nanoindentation [8]. In the present study, microhardness was measured with a Vickers tester under a load of 0.981 N. For this reason, the obtained value of hardness depended on the area of testing and, specifically, on the percentage of chromium borides in the tested area. This situation was the reason for the oscillations in the microhardness profiles presented in Figure 12, Figure 13 and Figure 14. Generally, a higher percentage of the mixture of chromium borides (CrB, Cr2B) in the tested area was accompanied by an increase in hardness.
4. Conclusions
Laser-alloying with boron (laser boriding) was used in order to produce the thick boride layer on Nimonic 80A alloy. Three values of laser beam power were used: 1.3 kW, 1.56 KW, and 1.95 kW. After analysis of the obtained results, the following conclusions were formulated.
- All produced layers contained nickel borides (Ni2B, Ni3B, Ni4B3) and chromium borides (CrB, Cr2B).
- The increase in laser beam power caused an increase in the maximum depth of the re-melted layer from 373 µm for the layer produced at P = 1.3 kW to 601 µm for the layer produced at P = 1.95 kW.
- The differences between the depth of the re-melted zone measured in the axis of the laser tracks and at the contact of the adjacent tracks were reduced for the lower power of the laser beam.
- The modeled geometry of the molten pool reflects the toroidal irradiance profile of the laser beam used; therefore, the highest depth of the molten pool was achieved in the center of the single laser track.
- For each laser beam power used, the maximum temperature was obtained at the surface and was equal to 2663 K for P = 1.3 kW, 3122 K for P = 1.56 kW, and 3829 K for P = 1.95 kW.
- The temperature distribution in the molten pool strongly depended on the laser beam power. The increase in laser beam power resulted in an increased volume of the molten pool, as well as its maximum depth. In the case of the lowest laser beam power of 1.3 kW, the modeled maximum depth of the molten pool was 308 µm. The increase in laser beam power to 1.56 kW ensured a higher depth of 417 µm. A further increase in the laser beam power caused re-melting, which reached a depth of 567 µm from the surface in the axis of the molten pool.
- The highest microhardness (1295 ± 67 HV) was measured in a laser borided layer produced at the lowest laser beam power of 1.3 kW. The increase in laser beam power was the reason for the diminished average hardness of the re-melted layer: 919 ± 52 HV for the layer produced at P = 1.56 kW and 721 ± 47 HV for the layer produced at P = 1.95 kW. The higher laser beam power caused the re-melting of a greater amount of substrate material, and, therefore, the content of borides in the re-melted zone was lower.
- The mathematical model presented in this study is an important tool; it provided the determination of the theoretically predicted thickness of the laser borided layer. It allows for saving the time required to conduct many experiments.
- It was proved that the model developed by Ashby et al. could be successfully used to predict the dimensions and shape of laser tracks produced by laser boriding.
- Despite the assumed simplifications, the mathematical model adopted in this work to predict the depth of the laser borided layer quite well reflects the melting conditions during the laser treatment. Therefore, this model can be used in preliminary research to select the appropriate laser treatment parameters.
- The precise control of the laser boriding parameters is important to achieve the desired microstructure, thickness, and properties of the produced layers.
Author Contributions
Conceptualization, N.M.; methodology, N.M. and P.D.; software, N.M. and P.D.; validation, N.M. and P.D.; formal analysis, N.M.; investigation, N.M. and P.D.; resources, N.M. and P.D.; data curation, N.M. and P.D.; writing—original draft preparation, N.M. and P.D.; writing—review and editing, N.M.; visualization, N.M. and P.D.; supervision, N.M.; project administration, N.M.; funding acquisition, N.M. All authors have read and agreed to the published version of the manuscript.
Funding
This research was funded by the Ministry of Education and Science in Poland, grant number 0513/SBAD/4770.
Data Availability Statement
Not applicable.
Conflicts of Interest
The authors declare no conflict of interest.
References
- Steen, W.M.; Mazumder, J. Laser Material Processing, 4th ed.; Springer: London, UK, 2010; pp. 318–320. [Google Scholar]
- Im, F.T.; Nian, Y.G.; Han, F.L.; Venkatesh, B. Design of a materials processing technologies. Arch. Mater. Sci. Eng. 2014, 48, 128–136. [Google Scholar]
- Yilbas, B.S.; Akhtara, S.S.; Karatas, C. Laser gas assisted nitriding of Hastelloy G alloy: Thermal stress analysis and characterization. Surf. Interface Anal. 2012, 44, 352–364. [Google Scholar] [CrossRef]
- Majumdar, J.D.; Manna, I. Laser-Surface Alloying of Nimonic 80 with Silicon and Aluminum and its Oxidation Behavior. Metall. Mater. Trans. A 2012, 43, 3786–3796. [Google Scholar] [CrossRef]
- Rodriguez, G.P.; Garcia, I.; Damborenea, J. Effects of laser surface modification of Nimonic with aluminum on oxidation behavior. Oxid. Met. 2002, 58, 235–248. [Google Scholar] [CrossRef]
- Cooper, K.P.; Slebodnick, P.; Thomas, E.D. Seawater corrosion behavior of laser surface modified Inconel 625 alloy. Mater. Sci. Eng. A 1996, 206, 138–149. [Google Scholar] [CrossRef]
- Kulka, M.; Dziarski, P.; Makuch, N.; Piasecki, A.; Miklaszewski, A. Microstructure and properties of laser-borided Inconel 600-alloy. Appl. Surf. Sci. 2013, 284, 757–771. [Google Scholar] [CrossRef]
- Kulka, M.; Makuch, N.; Dziarski, P.; Piasecki, A. A study of nanoindentation for mechanical characterization of chromium and nickel borides’ mixtures formed by laser boriding. Ceram. Int. 2014, 40, 6083–6094. [Google Scholar] [CrossRef]
- Makuch, N.; Piasecki, A.; Dziarski, P.; Kulka, M. Influence of laser alloying with boron and niobium on microstructure and properties of Nimonic 80A-alloy. Opt. Laser Technol. 2015, 75, 229–239. [Google Scholar] [CrossRef]
- Pelletier, J.M.; Jobez, S.; Saif, Q.; Kirat, P.; Vannes, A.B. Laser surface alloying: Mechanism of formation and improvement of surface properties. J. Mater. Eng. 1991, 13, 281–290. [Google Scholar] [CrossRef]
- Safdar, S.; Li, L.; Sheikh, M.A.; Liu, Z. An analysis of the effect of laser beam geometry on laser transformation hardening. J. Manuf. Sci. Eng. 2006, 128, 659–667. [Google Scholar] [CrossRef]
- Safdar, S.; Pinkerton, A.J.; Li, L.; Sheikh, M.A.; Withers, P.J. An anisotropic enhanced thermal conductivity approach for modelling laser melt pools for Ni-base super alloys. Appl. Math. Model. 2013, 37, 1187–1195. [Google Scholar] [CrossRef]
- Li, Y.; Zhou, K.; Tor, S.B.; Chua, C.K.; Leong, K.F. Heat transfer and phase transition in the selective laser melting process. Int. J. Heat Mass Transf. 2017, 108, 2408–2416. [Google Scholar] [CrossRef]
- Shercliff, H.R.; Ashby, M.F. The prediction of case depth in laser transformation hardening. Metall. Trans. A 1991, 22, 2459–2466. [Google Scholar] [CrossRef]
- Steen, P.H.; Ehrhard, P.; Schissler, A. Depth of melt-pool and heat-affected zone in laser surface treatments. Metall. Mater. Trans. A 1994, 25, 427–435. [Google Scholar] [CrossRef]
- Hu, C.; Baker, T.N. Prediction of laser transformation hardening depth using a line source model. Acta Metall. Mater. 1995, 43, 3563–3569. [Google Scholar] [CrossRef]
- Ashby, M.F.; Esterling, K.E. The transformation hardening of steel surfaces by laser beams—I. Hypo-eutectoid steels. Acta Metall. 1984, 32, 1935–1948. [Google Scholar] [CrossRef]
- Ion, J.C.; Esterling, K.E.; Ashby, M.F. A second report on diagrams of microstructure and hardness for heat-affected zones in welds. Acta Metall. 1984, 32, 1949–1962. [Google Scholar] [CrossRef]
- Li, W.B.; Esterling, K.E.; Ashby, M.F. The transformation hardening of steel—II. Hypereutectoid steels. Acta Metall. 1986, 34, 1533–1543. [Google Scholar] [CrossRef]
- Panfil-Pryka, D.; Kulka, M.; Makuch, N.; Michalski, J.; Dziarski, P. The effect of temperature distribution during laser heat treatment of gas-nitrided 42CrMo4 steel on the microstructure and mechanical properties. Coatings 2020, 10, 824. [Google Scholar] [CrossRef]
- Makuch, N.; Dziarski, P.; Kulka, M. The effect of laser treatment parameters on temperature distribution and thickness of laser-alloyed layers produced on Nimonic 80A-alloy. J. Achiev. Mater. Manuf. Eng. 2017, 82, 67–78. [Google Scholar] [CrossRef]
- Kulka, M.; Mikołajczak, D.; Makuch, N.; Dziarski, P.; Przestacki, D.; Panfil-Pryka, D.; Piasecki, A.; Miklaszewski, A. Laser surface alloying of austenitic 316L steel with boron and some metallic elements: Microstructure. Materials 2020, 13, 4852. [Google Scholar] [CrossRef] [PubMed]
- Man, H.C.; Leong, K.H.; Ho, K.L. Process monitoring of powder pre-paste laser surface alloying. Opt. Lasers Eng. 2008, 46, 739–745. [Google Scholar] [CrossRef]
- ASM International Handbook Committee. ASM Handbook Volume 7: Powder Metal Technologies and Applications; Lee, P.W., Ed.; ASM International: Russell Township, OH, USA, 1998. [Google Scholar]
- Gladush, G.G.; Smurov, I. Physics of Laser Materials Processing; Springer: Berlin/Heidelberg, Germany, 2011. [Google Scholar]
- Makuch, N.; Kulka, M.; Piasecki, A. The effects of chemical composition of Nimonic 80A-alloy on the microstructure and properties of gas-borided layer. Surf. Coat. Technol. 2015, 276, 440–455. [Google Scholar] [CrossRef]


Disclaimer/Publisher’s Note: The statements, opinions and data contained in all publications are solely those of the individual author(s) and contributor(s) and not of MDPI and/or the editor(s). MDPI and/or the editor(s) disclaim responsibility for any injury to people or property resulting from any ideas, methods, instructions or products referred to in the content. |
© 2023 by the authors. Licensee MDPI, Basel, Switzerland. This article is an open access article distributed under the terms and conditions of the Creative Commons Attribution (CC BY) license (https://creativecommons.org/licenses/by/4.0/).