Abstract
Lightweight magnesium alloys offer excellent benefits over Al alloys due to their high specific strength and damping properties, but they are more prone to galvanic corrosion. Plasma electrolytic oxidation (PEO) coatings reinforced by nanoparticles have been shown to improve corrosion resistance and possess better mechanical properties. A lot of research has been published that focuses on the effect of nanoparticle concentration in the PEO electrolyte solution, and the type of nanoparticle, on the properties obtained. The aim of paper is to study the effect of processing time on the nanoparticle-reinforced PEO coating on AZ31 magnesium alloy. TiN and SiC nanoparticles were produced using plasma chemical synthesis and added to KOH-based electrolyte to develop PEO coatings. The concentration of nanoparticles was kept constant at 0.5 g/L and the treatment time was varied as follows: 1, 2, 3, 5, and 10 min. The coatings were tested for their microstructure, phase, chemical makeup, nano-mechanical properties, and corrosion resistance. Nanoparticles were found to be clustered in the coating and spread unevenly but led to a decrease in the size and number of pores on the PEO coating surface. The corrosion resistance and nano-mechanical properties of the coating improved with treatment time. The hardness and contact modulus of coatings with TiN particles were 26.7 and 25.2% greater than those with SiC particles. Addition of TiN nanoparticles resulted in improved corrosion resistance of the PEO coatings when the processing time was 5 or 10 min. The lowest corrosion rate of 6.3 × 10⁻⁵ mm/yr was obtained for TiN-added PEO coating processed for 10 min.
1. Introduction
Light weighting is one of the primary methods employed by automobile and aerospace engineers to achieve higher fuel efficiency [1]. To that end, magnesium (Mg) alloys have attracted a lot of attention due to their low density [2], high specific stiffness and strength [3,4,5], and superior damping properties [6]. Mg is 33% and 62% lighter than aluminum (Al) alloys and titanium alloys, respectively [7]. However, Mg and its alloys are highly prone to galvanic corrosion, which has limited their usage in many engineering applications seeking weight reductions. To enable the use of Mg alloys for such lightweight applications, protective oxide coatings achieved through plasma electrolytic oxidation (PEO) have been employed by various researchers [8,9,10,11,12,13,14]. PEO is a more environmentally friendly process for developing an oxide layer than processes such as conversion coating that use harmful carcinogenic hexavalent (VI) chromium compounds. It is an anodizing process with the distinction that it is carried out at a much higher voltage in an electrolyte. For Mg alloys, PEO is normally performed in silicate, phosphate, zirconium, or aluminate containing KOH-based electrolytes. The electrical regime and treatment time also play an important role in affecting the final properties of the coating. PEO coatings have been shown to have higher corrosion resistance than the base alloy in saline environments [10,13,15]. However, these coatings tend to have inferior mechanical properties due to the formation of discharge channels during the PEO process.
To improve the mechanical and corrosion properties of PEO coatings, nanoparticle (NP) incorporation in the electrolyte has been used, which allows for the uptake of these particles in the coating. Yu et al. [16] produced PEO coatings on AZ31 alloy in silicate electrolyte with 2 g/L SiC nanoparticles and found they improved corrosion resistance and lowered the wear rate. However, the microhardness and modulus of the coatings were not measured. Other studies have investigated the effect of WC nanoparticles on properties of PEO coatings of AZ31. Zhang et al. [17] and Vatan et al. [18] found that the nanoparticle-incorporated PEO coatings had smaller pore sizes with better wear and corrosion resistance. Other works highlighted similar improvements with TiC [19], NbC [19], SiC [20,21,22,23], SiO2 [24,25], CeO2 [26], Al2O3 [27], WO3 [12], and graphene oxide [28] particles. TiN nanoparticles [29,30] have also been used with PEO coatings previously, but the concentration of TiN particles was 1–4 g/L of the electrolyte solution [30], the effect of processing time was not reported, and only the concentration was varied. A higher concentration of NP warrants the use of surfactants and is not conducive to industrial applications.
NP-reinforced PEO coatings have been widely developed and studied for their tribological properties, which make them suitable for Mg alloys such as AZ31 and MA8, but there is a lack of studies on nano hardness and corrosion protection. AZ31 is a widely used Mg alloy with excellent ductility, specific strength, and low density. The Al and Zn elements result in the formation of intermetallics, which result in precipitation hardening in the alloy. This paper seeks to fill a gap in literature regarding the effect of the treatment time and use of TiN or SiC nanoparticles on the chemical, mechanical, and corrosion properties of PEO coatings. In this study, PEO coatings with 0.5 g/L SiC or TiN added to the electrolyte are produced on AZ31 alloy. The processing time of the coating is varied to produce various coatings. A lot of studies have focused on the effect of NP concentration, but the processing time has not been properly studied. Moreover, the hardness and modulus from nanoindentation testing have not been properly studied for SiC NP-reinforced PEO coatings. In this study, the corrosion resistance of the coatings is characterized using electrochemical methods.
2. Materials and Methods
2.1. Materials
Magnesium alloy AZ31 (SMW, Latvia) was used as the substrate for nanoparticle-reinforced PEO coatings. It took the form of rectangular samples of size 20 × 20 × 2 mm3. The chemical composition of the alloy is given in Table 1. The samples were mechanically polished using 2000 grit SiC papers before rinsing in distilled water and then cleaning using acetone. The samples were left to dry at room temperature before being further processed.

Table 1.
Chemical composition of AZ31 alloy in wt. %.
The nanoparticles (NPs) used for the coating were produced on a Steremat Electrowarme GJ 100 high-frequency plasma generator by means of a plasma chemical synthesis process. Commercially available powders of SiC and TiN were evaporated and rapidly condensed into nanoparticles from the gaseous phase by a radio-frequency inductively coupled nitrogen plasma. The specific surface areas of the SiC and TiN nano powders were 38 and 32 m2/g, respectively.
2.2. Plasma Electrolytic Oxidation
The PEO coating was performed at 500/300 V for U+/U−, respectively, with 5 and 1 A currents for the positive and negative pulses. The duration of the bipolar pulses and the pause between pulses were both kept at 3000 μs. These parameters were selected by performing trials with various voltages, currents, pulse durations, and pauses. Light orange sparks were observed evenly on the surface with these settings, which were deemed suitable, rather than localized and sporadic arcing. The electrolyte for the coating was a solution of 0.5 g/L KOH and 2.5 g/L Na2HPO4∙12H2O, with 0.5 g/L nanoparticles for each kind. NPs were mechanically mixed and ultrasonically dispersed for 20 min. No agglomeration was observed, and the current processing was deemed sufficient. The concentration of the nanoparticles was kept the same for all coatings, with the PEO processing time was the only variable factor. The processing times used in this study were 1, 2, 3, 5, and 10 min. The sample nomenclature is PEO@XXX-Y, where XXX stands for the nanoparticle used and Y stands for the respective processing time. So, for instance, PEO@TiN-2 refers to the sample with TiN NP containing PEO coating developed with a 2 min processing time. A sample with base electrolyte was produced with 5 min of processing time and was named BE-PEO.
2.3. Chemical, Phase, and Morphological Characterization
A Rigaku SmartLab X-ray diffraction system was used to study the phase composition of the coatings with CuKα radiation at scanning intervals of 2θ = 10°–60° and a speed of 4°/min. XRD data were phase analyzed using Bruker Diffrac. Eva software.
The microstructure and morphology of the coatings were studied using a high-resolution SEM-FIB electron microscope Helios 5 UX (Thermo Scientific) set to 2 kV. The images were captured with ETD and ICE detectors. The microscope was equipped with a gallium (Ga) liquid metal ion source to perform FIB operations at 200 pA and accelerating voltage 30 kV. To study the through-plane structure of the coating, part of the sample was cut and removed using the Ga beam at an angle of 45°. A total of 10 readings of coating thickness were used to calculate the average and standard deviation. The chemical composition was studied using Oxford X-max (Oxford instruments, Abingdon, United Kingdom) EDX with a 50 mm2 detector. The AztecOne software suite was used to analyze the EDX results.
2.4. Electrochemical Corrosion Testing
The corrosion performance of the coatings was studied by performing electrochemical impedance spectroscopy (EIS) on a Potentiostat/Galvanostat PGSTAT302N Autolab (Metrohm AG). A sealable measuring cell (rhd instrument) was used. A coating was used as the working electrode, the reference electrode was a platinum (Pt) wire, and the auxiliary electrode was a glassy carbon electrode. A 3.5% NaCl solution in water was used as the electrolyte. Tafel analysis was applied to each sample in accordance with ASTM G102–89 and the corrosion rate was specified by the electrochemical frequency modulation method. One sample of each type (processing time and NP material) was tested.
2.5. Mechanical Characterization
Nano mechanical characterization of the coatings was performed on a Bruker Hysitron TI 980 Triboindenter. The nanoindenter tip was made of diamond with Berkovich-type geometry, with a half-angle of 65.27 and included angle of 142.30. Young’s modulus and Poisson’s ratio for the diamond provided by the manufacturer were 1140 GPa and 0.07, respectively. The equipment has active feedback load and displacement control. For all the specimens, a peak load of 150 mN was used to create the indentation, and then the load was released while recording the displacement, which was recorded in nm (10−9 m). At least seven indentations were made on each specimen.
Several methods have been proposed for the extraction of contact hardness () and the plane strain modulus (), such as those by Doerner and Nix [31], Oliver and Pharr [32], and Field and Swain [33]. Here, we employed the Oliver–Pharr approach for analyzing and modeling the elastic–plastic deformation of the material to calculate and . In this method, the unloading curve of the load-displacement data is fitted numerically as a power-law function given by,
where and m are fitting parameters, P is the load value, and h is the displacement. Once fitting is complete, stiffness at the peak load is calculated. The stiffness (S) and peak point (Pmax, hmax) can be used to obtain the contact depth and projected contact area using the relations,
where (≤1) is a dimensionless quantity that describes the indenter tip geometry. For a Berkovich-type tip, this value is equal to 0.75 [34]. Knowing these quantities, the other results are calculated using the following relations,
where is the reduced modulus, (= 1.034) is a correction factor for a Berkovich tip due to the lack of axial symmetry, and and are Young’s modulus and Poisson’s ratio for the indenter tip material. Contact hardness and the modulus were obtained using the elastic–plastic deformation theory.
3. Results and Discussion
3.1. Coating Morphology
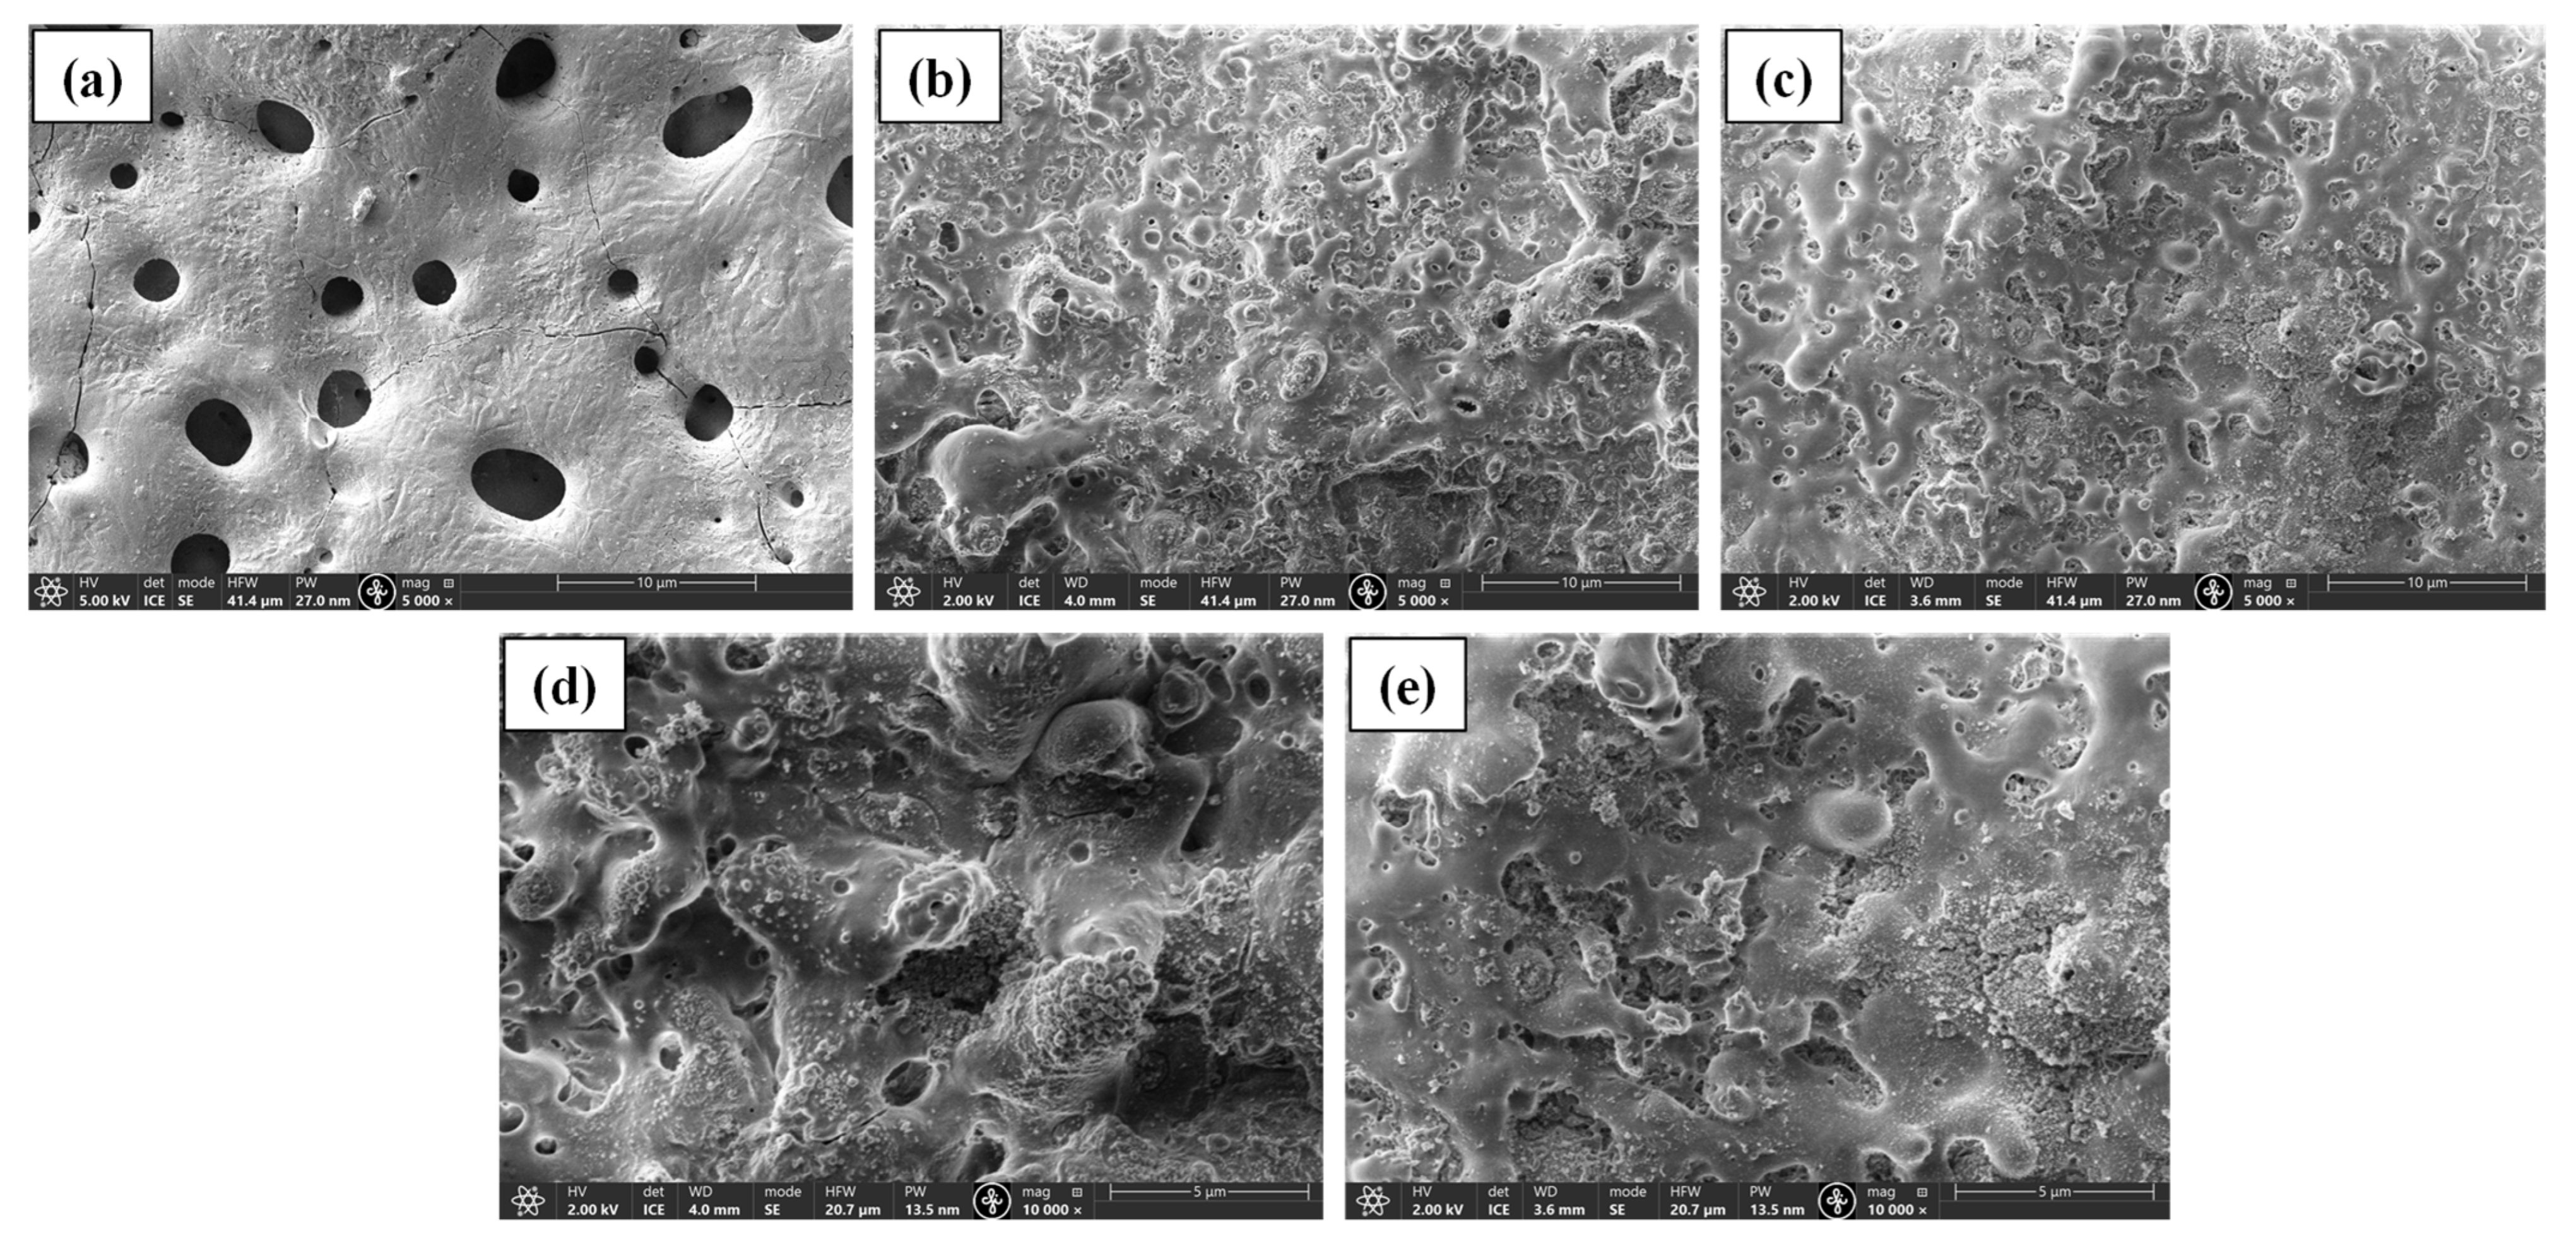
Figure 1 shows the surface morphologies of the PEO coated samples. Specimens of both series processed at 5 min and one specimen with PEO from base electrolyte were used for imaging. The coatings containing nanoparticles of SiC and TiN look very similar to each other in microstructure; however, they are significantly different from the PEO coating obtained from base electrolyte. The pores in the BE-PEO sample are much larger than those in the NP PEO samples due to the presence of nanoparticles. The NP coatings have the typical rough, uneven, and porous structure at the top with globular formations. High-magnification images (Figure 1c,d) show that the NPs are clustered together in some zones and not uniformly distributed across the surface. The morphology arises because the inclusions are nanosized and also present in very small concentrations. In previous works [35,36], the coating structure looked very similar. As PEO commences, the negative ions (such as OH- and HPO42−) in the electrolyte are adsorbed by TiN and SiC, which causes them to migrate toward the anode (Mg alloy). Initially, the discharge channels are small and the negatively charged nanoparticles do not move into the discharge channels, which are formed as the voltage exceeds the critical breakdown voltage. However, with processing time, the particles move into the channel and stop their growth. Some of the particles collect molten oxide and hydroxides from the discharge channels and deposit them on the surface of the substrate, leading to the formation of globules with NPs. A similar effect was observed in other works conducted on NP PEO coatings [18,19,37]. Some microcracks are visible in the coating, as well, which are formed as result of rapid cooling and high temperature differentials in the ceramic material [38].
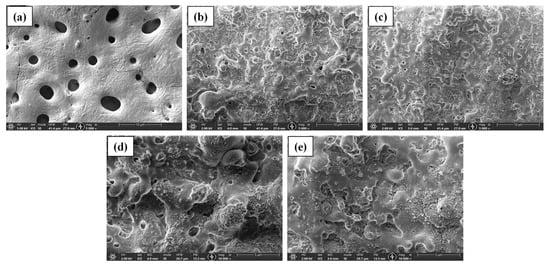
Figure 1.
SEM images of (a) base PEO, (b,d) PEO@SiC-5, and (c,e) PEO@TiN-5.
3.2. Coating Properties
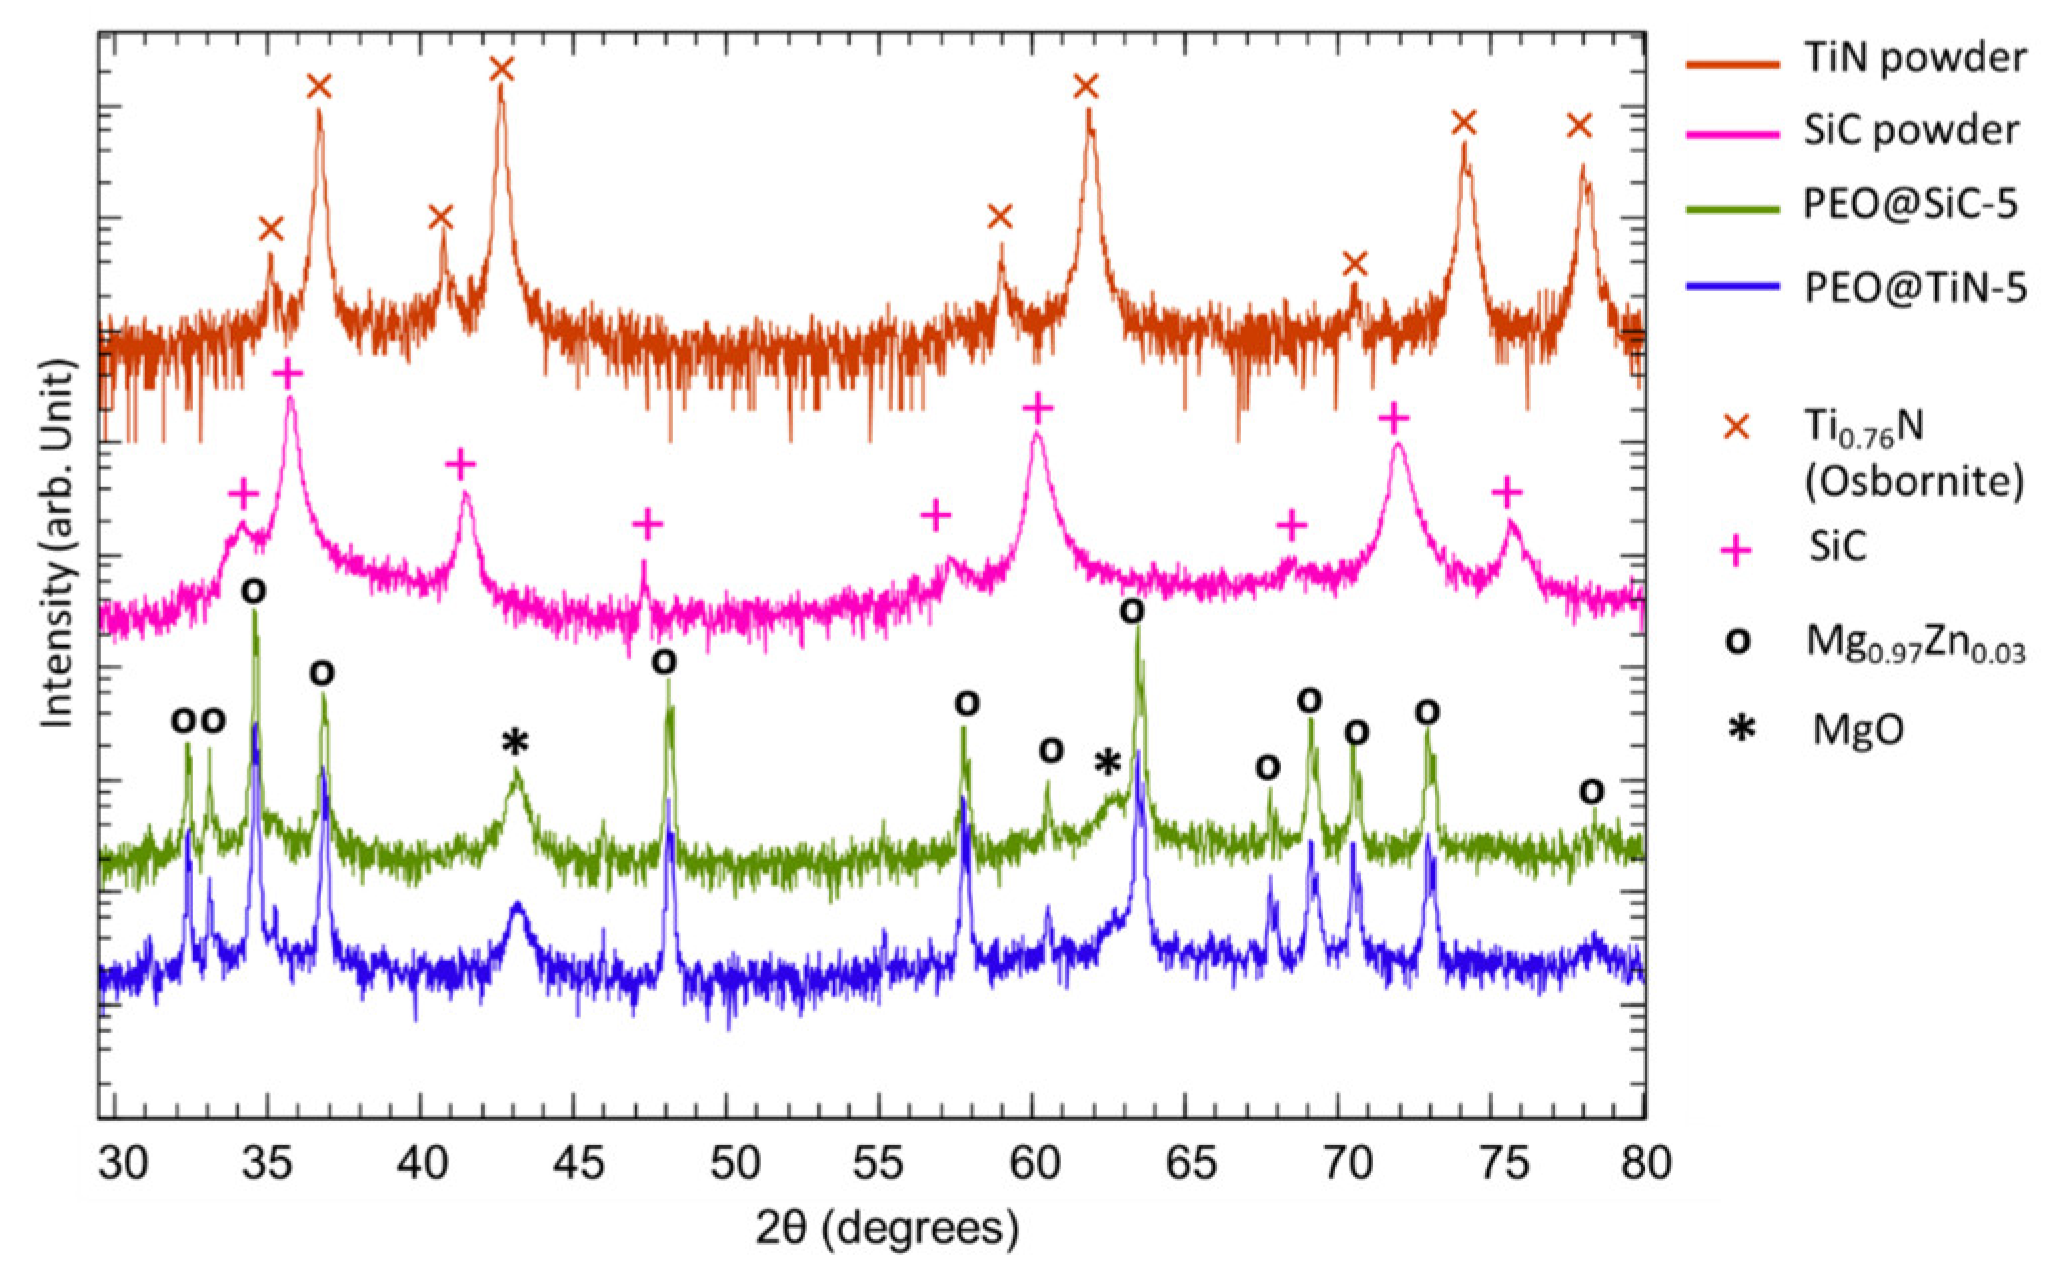
XRD analysis was performed to study the phases present in the coating. The XRD spectrum of TiN and SiC powders that were used for NP fabrication, PEO@TiN-5 and PEO@SiC-5, are shown in Figure 2. Peaks for SiC (PDF 01-073-1708) are visible at 2θ = 34.2, 35.8, 41.5, 47.3, 57.4, 60.1, 68.5, 71.9, and 75.7°. Peaks for TiN (PDF 01-087-0626) are visible at 35.1, 36.7, 40.7, 42.6, 58.9, 61.9, 70.5, 74.1, and 78.0°. In the PEO specimen, peaks corresponding to MgO at 2θ = 43.20 and 62.66° with Miller indices of (2 0 0) and (2 2 0), respectively, are visible. The peaks at 2θ = 32.43, 33.13, 34.63, 36.84, 48.15, 55.20, 57.80, 60.53, 63.50, 67.83, 69.14, 70.53, 72.98, and 78.37° correspond to Mg0.97Zn0.03 (PDF 03-065-4596). However, the peaks for SiC and TiN are not visible in the PEO coated specimen. This shows that they are either XRD amorphous or too low in concentration to be properly captured in XRD, as observed by Mashtalyar et al. [29] for TiN and Yang & Hu [22] for SiC embedded PEO coatings on Mg alloys. A possible explanation for this could be that during PEO, local temperatures reach high enough levels for thermal treatment of the nanoparticles, which changes the crystalline structure to amorphous. PEO coated specimens of both types of NPs were also tested for phases at other processing times, but similar results were obtained, and the graphs are not shown here.
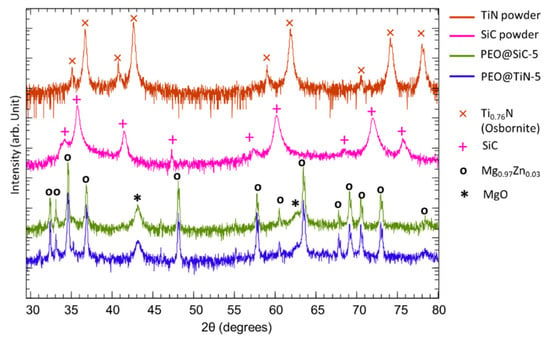
Figure 2.
XRD spectra of the ceramic powders used for NP synthesis and PEO coatings.
3.3. Energy Dispersive Spectroscopy
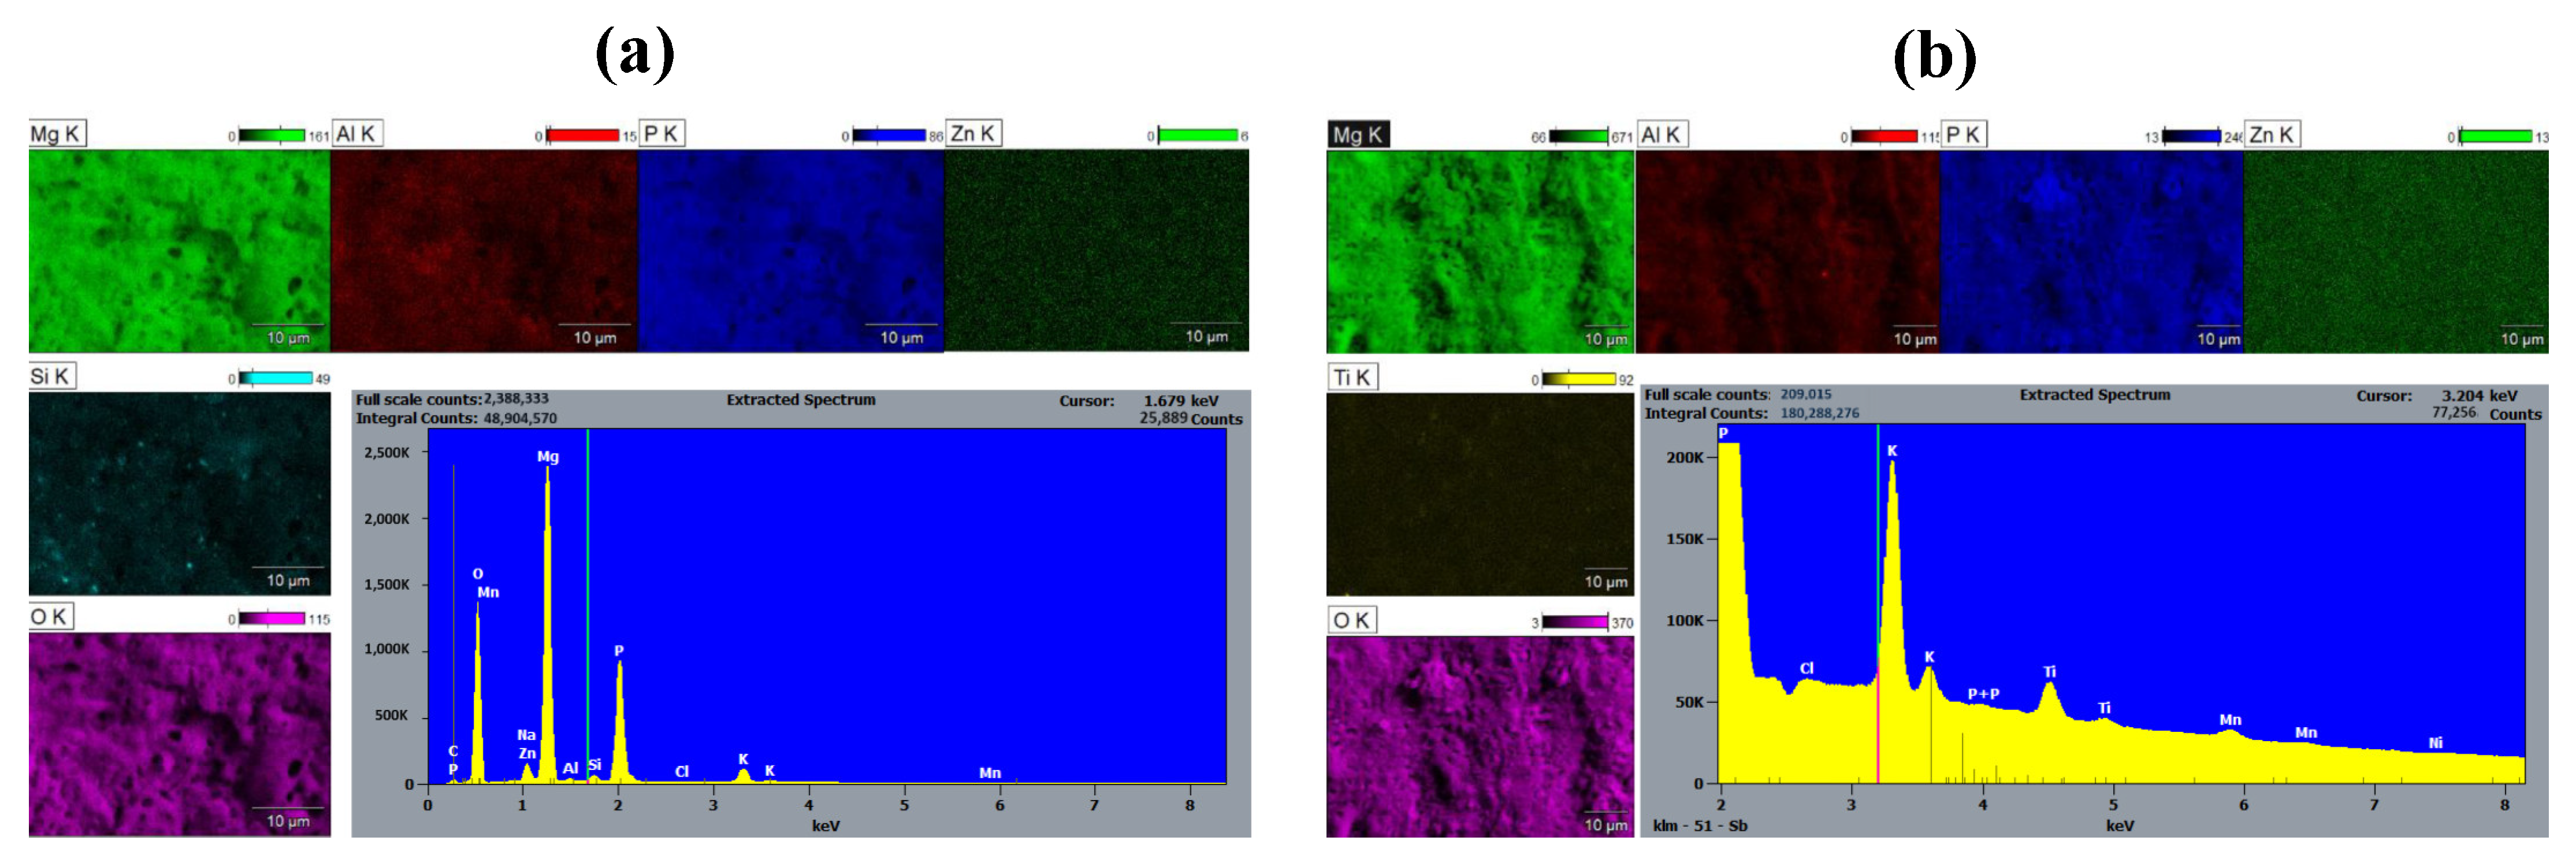
To investigate the presence of the SiC and TiN nanoparticles on the PEO coating surface, SEM-EDS was performed on the specimen. Elemental maps obtained through EDS analysis of the surface of the PEO@SiC-5 sample are shown in Figure 3a. Very high counts of the elements oxygen (O) and phosphorus (P) can be seen on the spectrum due to the formation of oxides and phosphates, which resulted from the Na2HPO4∙12H2O present in the electrolyte. The alloying elements are not present on the composite PEO coating surface in the same concentration as in the alloy. The map for the element silicon (Si) shows that the nanoparticles are not uniformly distributed on the PEO surface and instead form localized concentration points.
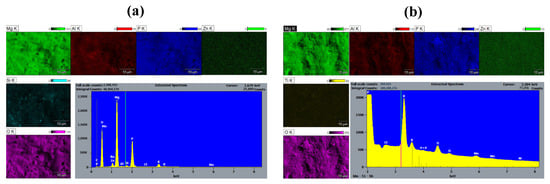
Figure 3.
EDS elemental maps and spectra of the surface of (a) PEO@SiC-5 and (b) PEO@TiN-5.
An elemental map of PEO@TiN-5 is shown in Figure 3b, which is similar to that for PEO@SiC -5. There is a significant presence of P and O on the surface from the PEO electrolyte. Zn, Al, and Ti can be seen in lesser quantities on the surface. The distribution of Ti atoms is not uniform across the surface, as was the case in PEO@SiC-5. This shows that the TiN nanoparticles are clustered together like the SiC nanoparticles.
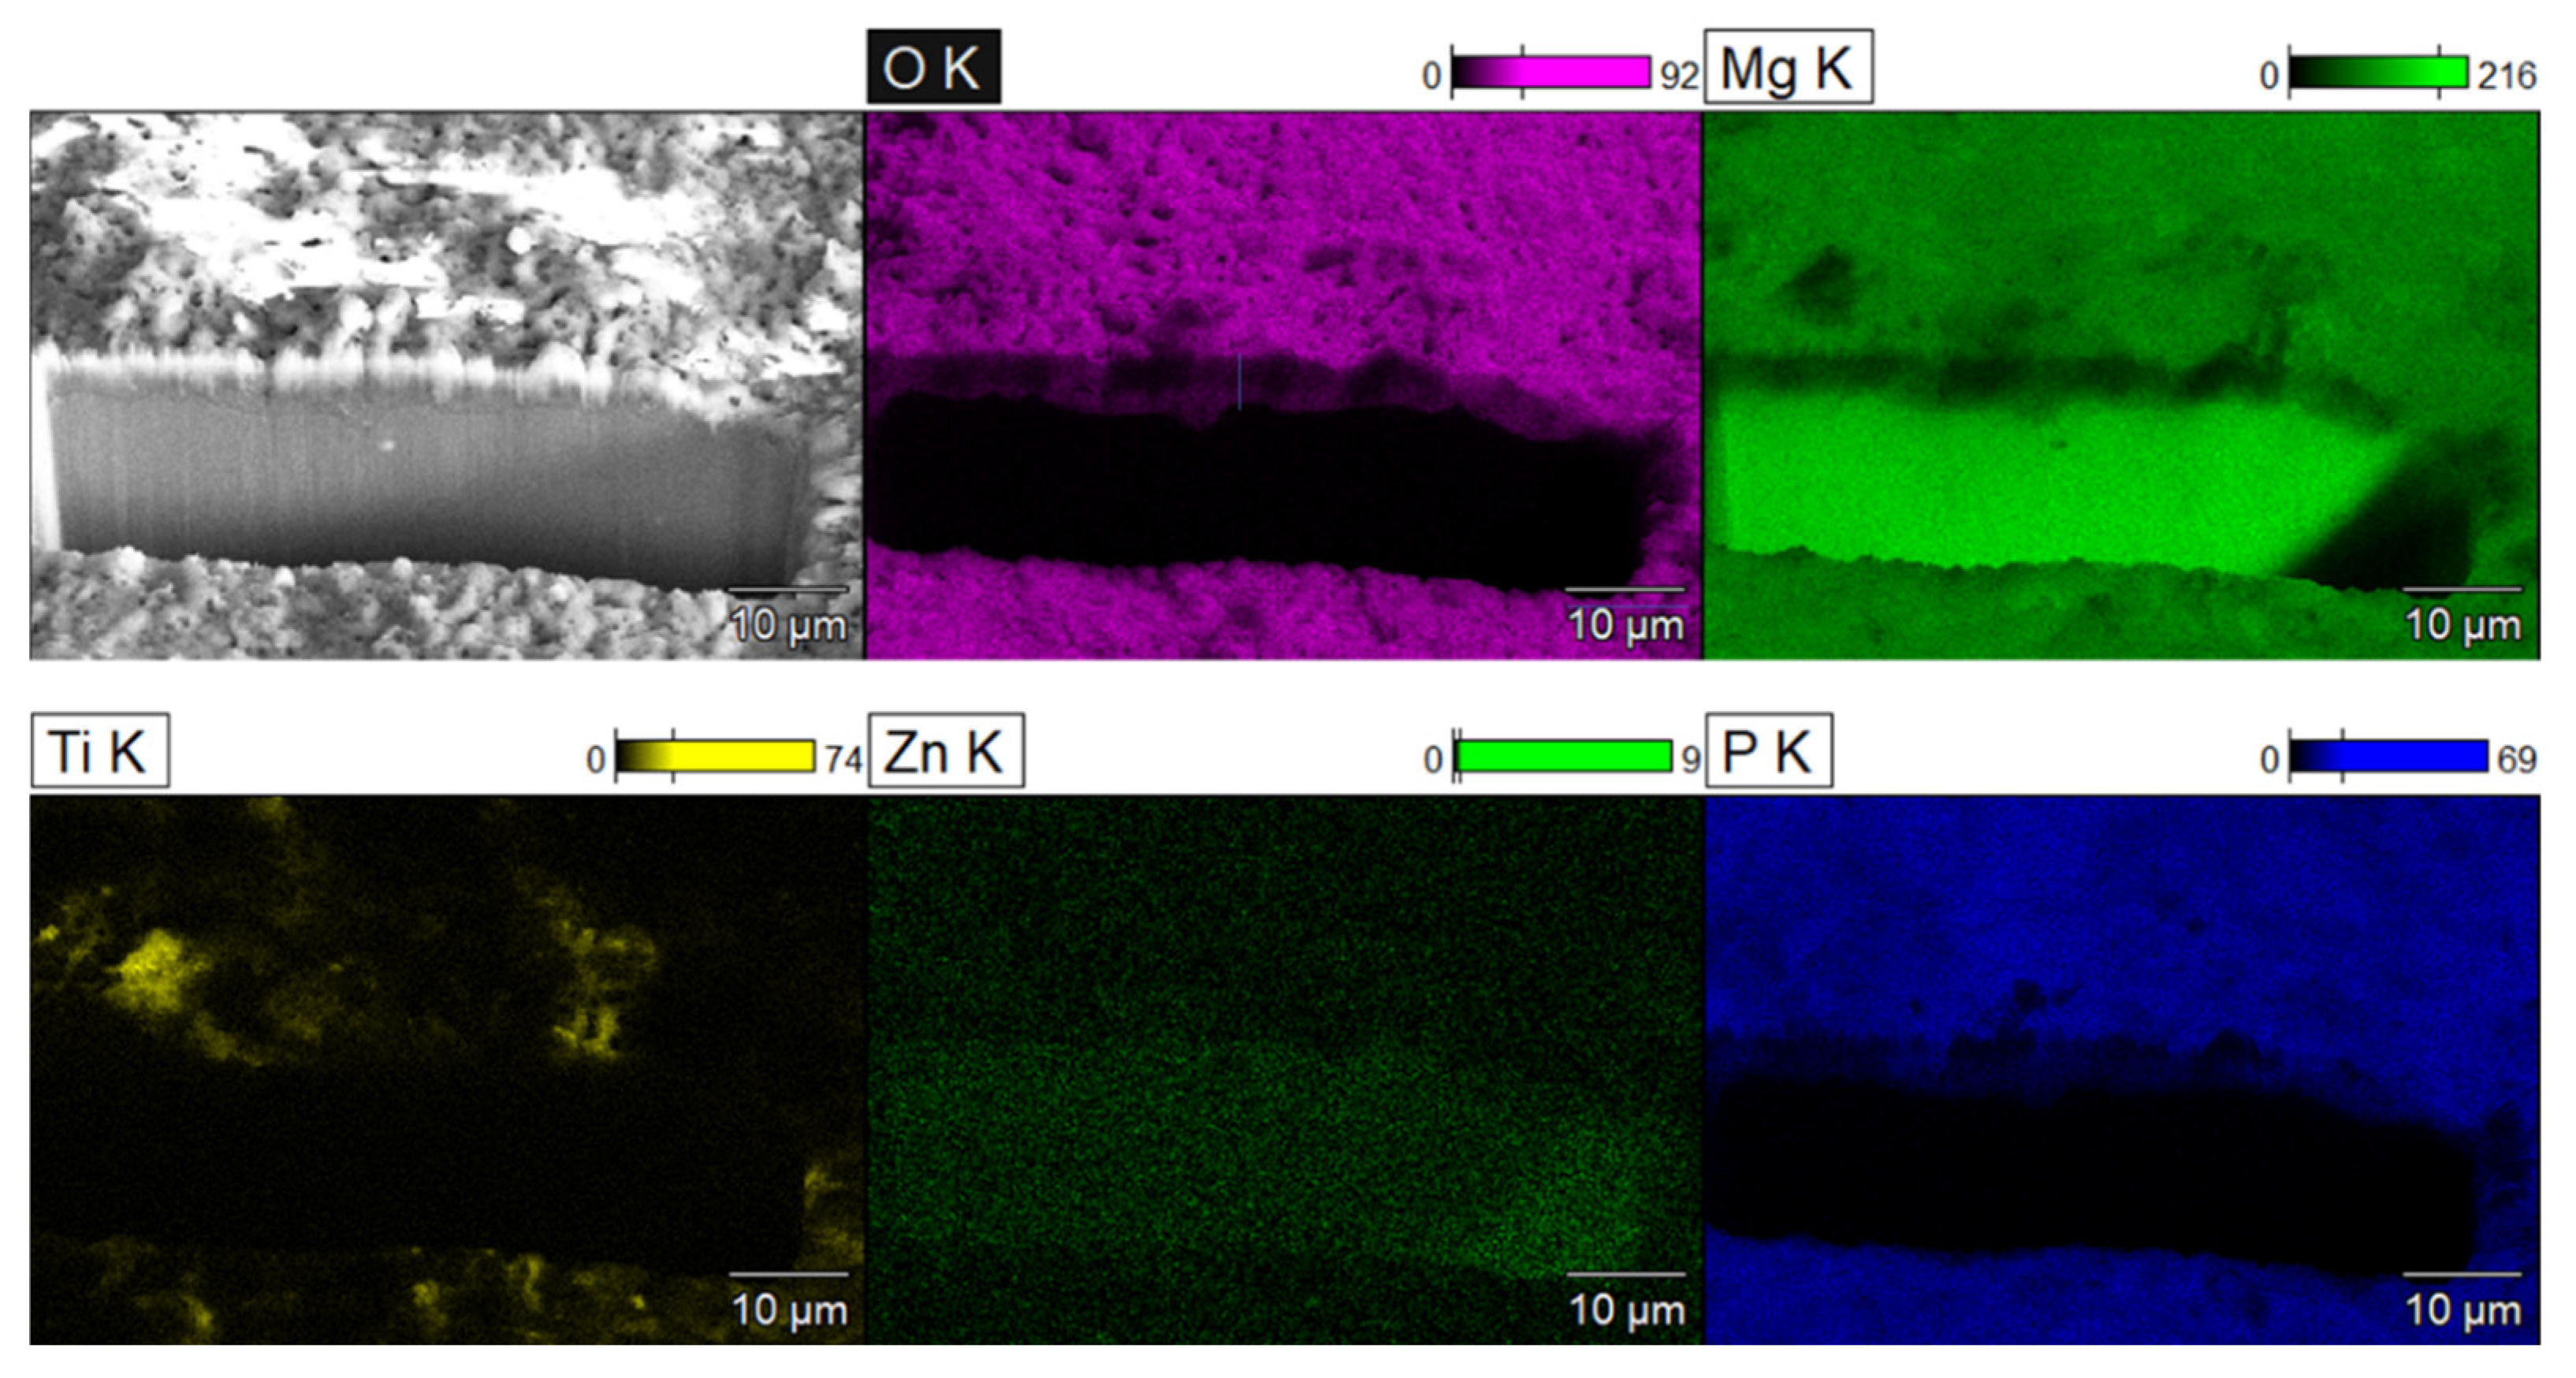
The coating’s cross-section, structure, and elemental maps are shown in Figure 4. The projection of the coating thickness was measured as 4.7 ± 0.5 µm. Since the cut was made at 45°, the coating thickness would be the same as this projection. The elemental maps of O, Mg, Ti, Zn, and P are shown in Figure 4. The oxide layer is distinguishable due to the presence of O, P, and Ti elements since they can only be the products of the PEO process. Mg is present in a high quantity in the substrate and in a lesser quantity in the oxide layer. Ti is present sporadically on the coating surface, which shows that the uptake of NPs in the coating during PEO is not uniform. This can be attributed to the globular formations on the PEO surface. Similar distributions of elements and coating structures were obtained with PEO@SiC coatings, and it was decided to not include them here for the sake of brevity.
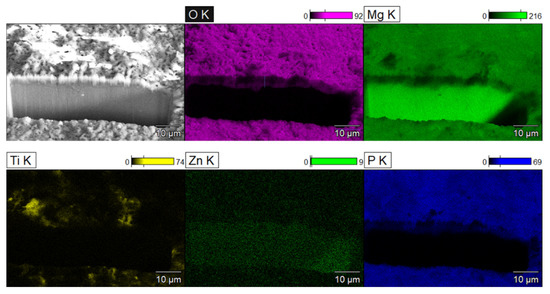
Figure 4.
SEM depicting the SEM-FIB cross-section of PEO coating along with the EDS maps of various elements.
3.4. Electrochemical Corrosion Testing
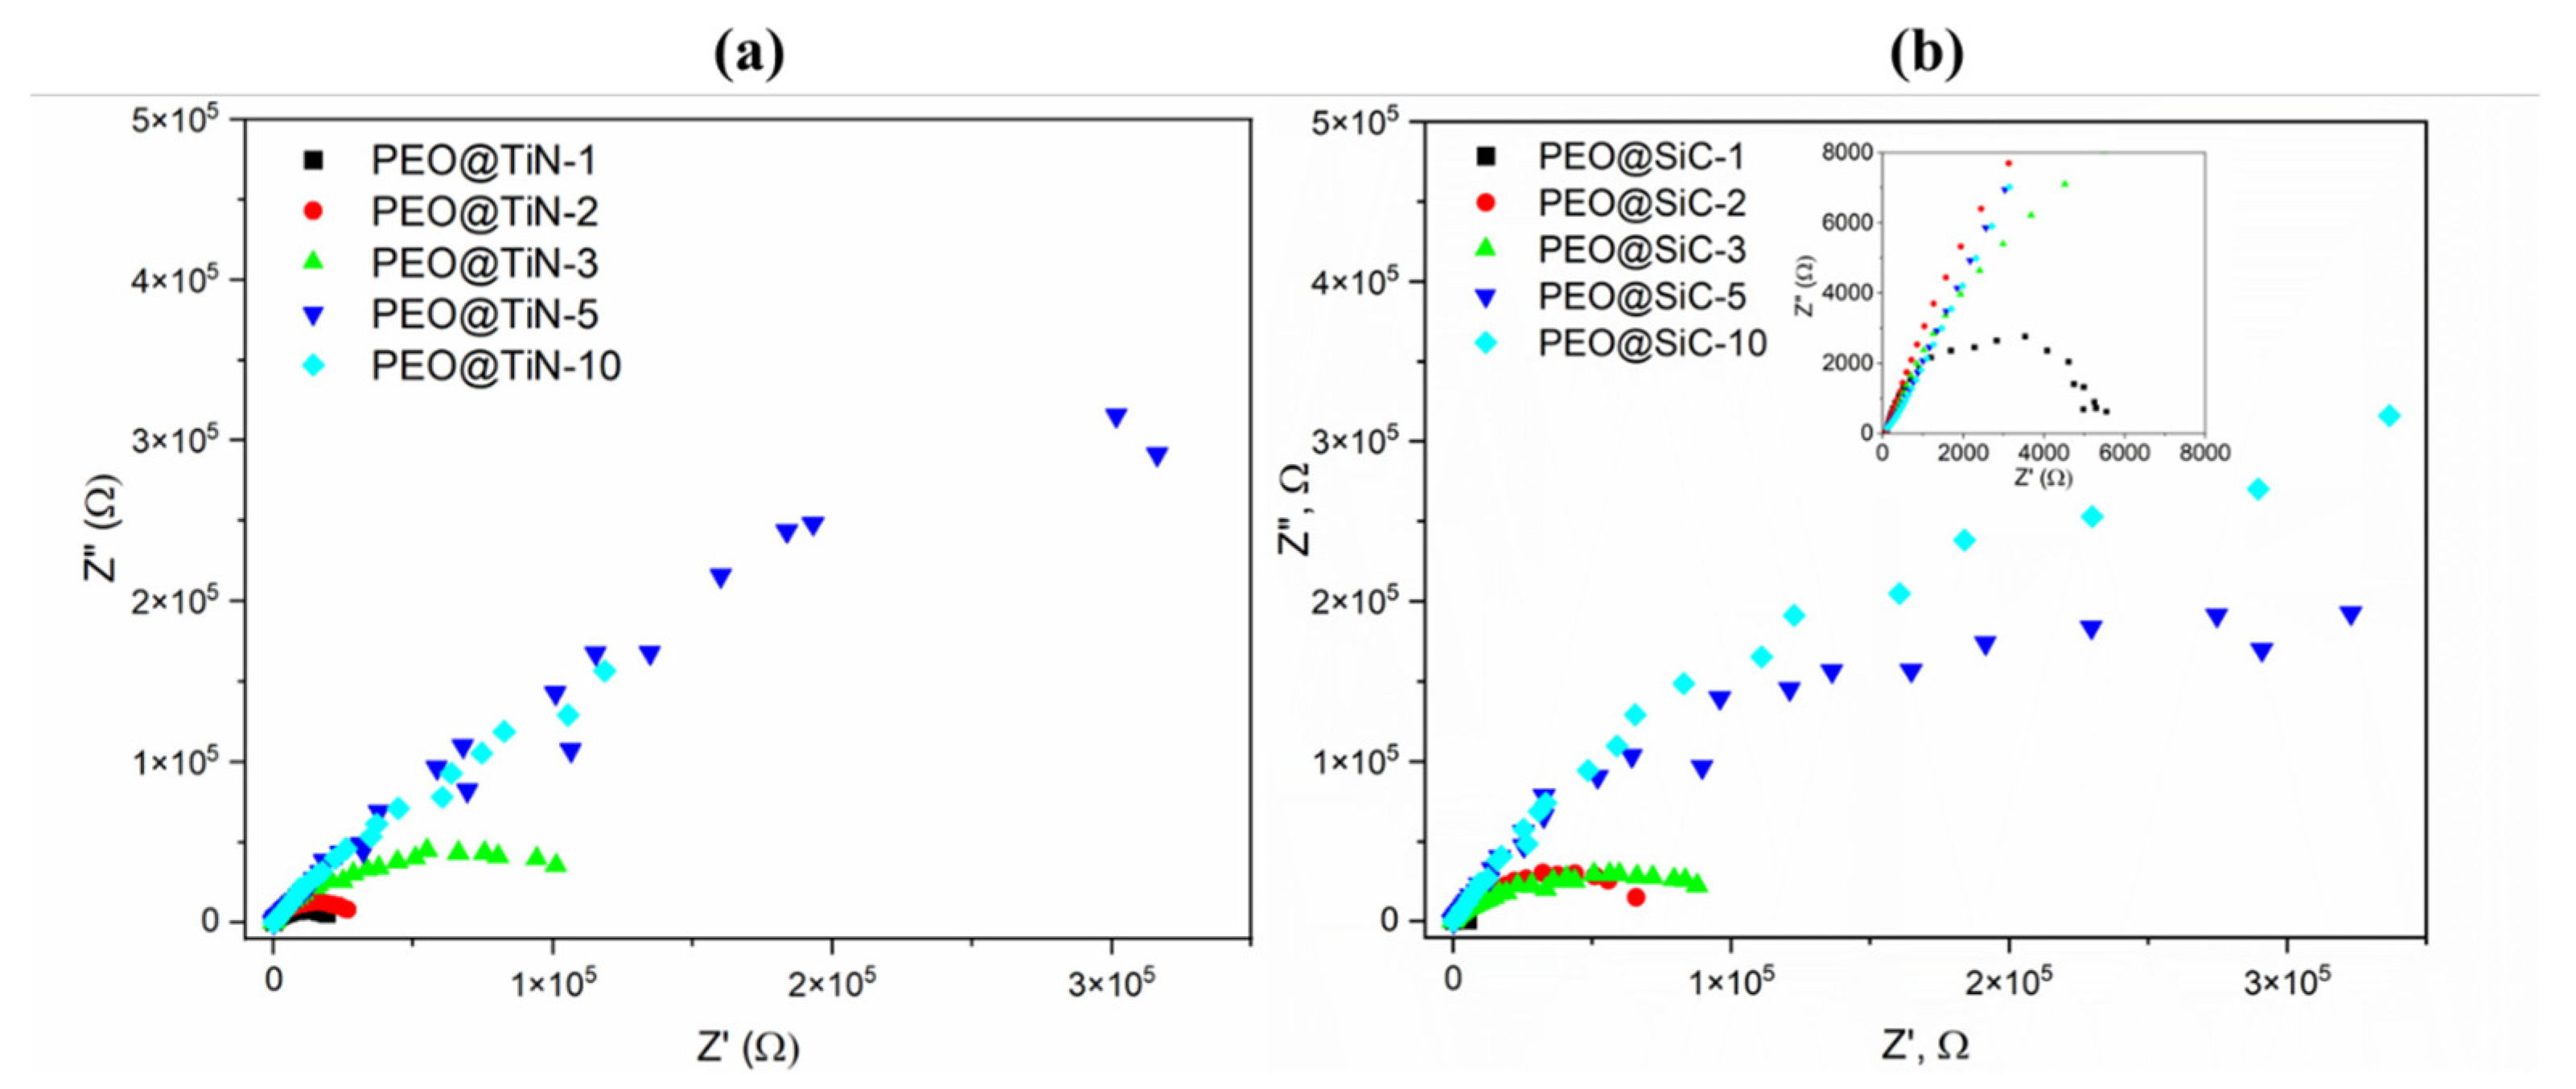
Nyquist plots from EIS analysis of PEO@TiN specimens are shown in Figure 5a. It can be seen that the curves for PEO@TiN-5 and -10 are almost linear, which indicates good corrosion resistance of the coating. Typically, a Nyquist plot for a specimen that is undergoing corrosion under controlled kinetic conditions will show a semi-circular shape, as is evident for specimens with shorter processing times and all specimens with PEO@SiC coatings (Figure 5b). The circular capacitive loop is an indicator of the presence of water and corrosion activity in the coating. The radius of the loop is proportional to the corrosion resistance. In addition, as the processing time increases, the magnitude of the module increases by several orders of magnitude.
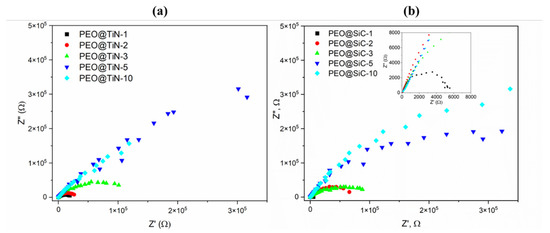
Figure 5.
Nyquist plots for (a) PEO@TiN and (b) PEO@SiC coatings.
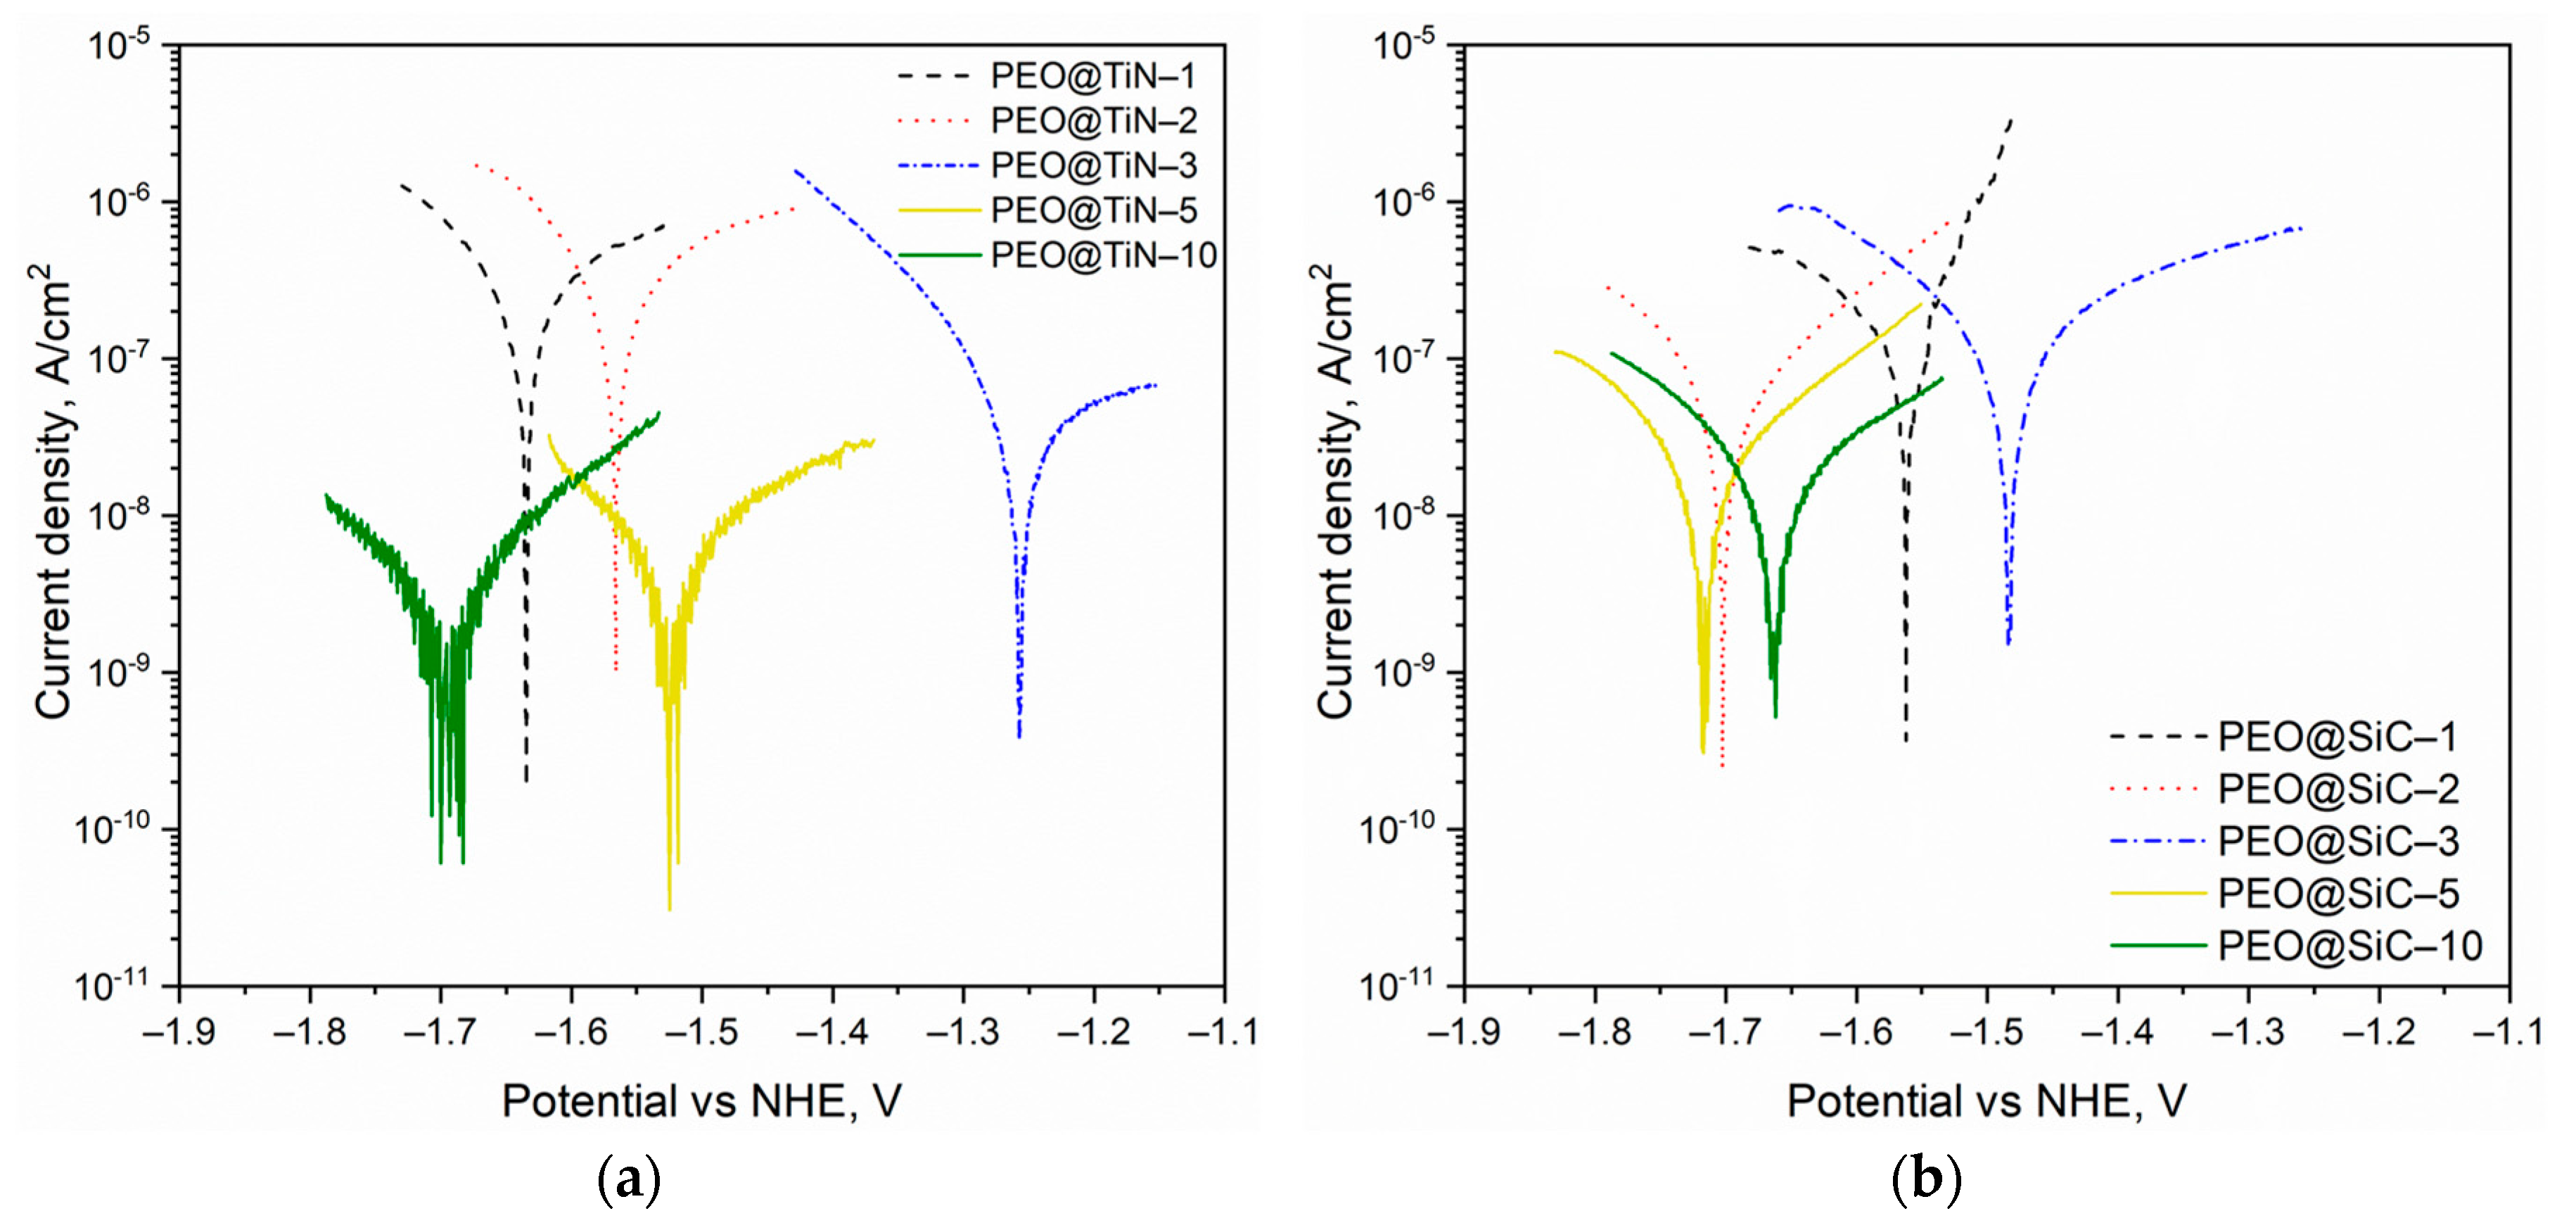
Quantitative analysis of the corrosion rate was conducted via potentiodynamic polarization (PDP) testing and by performing Tafel analysis. The Tafel curves for the specimens are shown in Figure 6. For both series of specimens, it is evident that there is no obvious trend of the corrosion potential Ecorr with the processing time. Theoretically, a higher Ecorr and lower icorr corresponds to high corrosion resistance, but it is the icorr that determines the rate of corrosion and can give a better picture of the corrosion characteristics of a material. The results obtained from Tafel extrapolation analysis are given in Table 2. For both NPs, the coating produced at 10 min shows the best corrosion performance. This can be attributed to the thicker coating, as well as a less porous structure due to the build-up of NPs. In both cases, the coating prepared at 1 min (PEO@TiN-1 and PEO@SiC-1) shows the highest Ecorr but also the highest corrosion current density, which causes corrosion rates 125 and 14 times faster than the respective coating produced at 10 min. The best-performing coating is PEO@TiN-10, but incidentally it also has the least corrosion potential, Ecorr = −1.70 V. The decrease in the corrosion potential is due to the fact that the electrical conductivity of TiN is quite high [39] (electrical resistivity is equal to 2 × 10⁻⁷ Ω m). The results are different from those obtained in another study by Mashtalyar et al. [29], where MA8 was processed with PEO in electrolyte with TiN NP added. The researchers found an overall reduction in corrosion performance due to the inclusion of NPs. In the current study, however, the migration of NPs in the discharge channels was hypothesized to be the primary reason behind the enhanced corrosion performance.
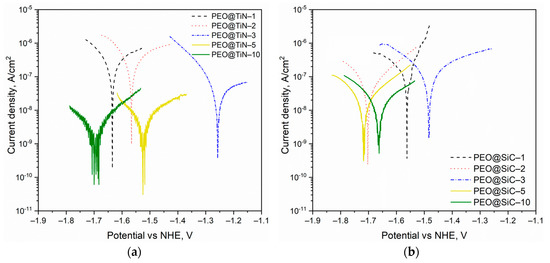
Figure 6.
Tafel curves from potentiodynamic polarization testing of the PEO coatings containing nanoparticles of (a) TiN and (b) SiC.

Table 2.
Results of PDP test on samples with various PEO coatings.
The corrosion rates for PEO@SiC coatings were more than their TiN counterparts for processing times of 5 and 10 min. At shorter processing times, the SiC-containing PEO coatings performed better. The behavior of PEO@TiN coatings was odd since there was a significant improvement in corrosion resistance after more than 5 min of processing, while for PEO@SiC, the trend in corrosion rate with processing time was more uniform. This discrepancy could have been due to the formation of phases such as MgTi2O4 in the oxide layer due to the decomposition of TiN when the processing times were long enough to reach the thermal decomposition temperature of TiN. Thin TiN films are thermally stable under annealing until 1123 K [40], while SiC is stable until 2800 K [41]. At long processing times, the temperature of the oxide layer rises high enough to decompose TiN and form MgTi2O4, which has been linked to improved corrosion resistance in TiO2 modified PEO coatings on AZ91 alloy [42]. This phase could be amorphous and go uncaptured in the XRD analysis.
The uptake of nanoparticles with the molten oxides during PEO and the resulting obstruction/sealing of discharge channels is one of the mechanisms by which particle addition improves corrosion resistance of the PEO coatings [43]. The mechanism of particle uptake has been presented in [44,45]. The particles acquire a negative charge in the alkaline solution and migrate toward the anode during the PEO process; then, they are adsorbed at the corrosion location before the breakdown potential is reached. This happens at the location of intermetallics in the Mg matrix, which form a galvanic couple and act as the main locations for corrosion to occur. However, the migration of the particles toward the anode and negative charge accumulation on the particles is a function of the zeta potential for the particles.
The zeta potential for TiN particles in alkaline solution has a higher magnitude than that of SiC particles [46,47], which causes more TiN nanoparticles to migrate toward the anode. This also causes TiN particles to become more segregated. As the oxide layer starts to form, the size of sparks is small and they do not last long. In this phase, the primary mechanism of NP uptake is though redeposition of molten metal, which shoots from the spark and captures the NPs. Since SiC particles will agglomerate more due to a lower zeta potential, they are more likely to be caught by the molten metal and incorporated into the coating. Once sufficient thickness has been achieved, the electric force increases, and TiN nanoparticles are preferably pulled toward the anode. This leads to blocked discharge channels, which reduce the exposure of the substrate to the corrosive medium. This effect was reflected in the results. For shorter processing times, PEO@SiC coatings had better corrosion resistance than PEO@TiN coatings.
The corrosion rates for AZ31 alloy and silicate electrolyte PEO (15 min processing) from the literature are 1.53 × 10⁻¹ mm/yr and 8.3 × 10⁻³ mm/yr, respectively [28]. This shows that there was significant improvement of the corrosion properties of the PEO coating with the addition of TiN and SiC NPs.
3.5. Nano-Mechanical Characterization
Nanoindentation is a powerful tool to obtain the properties of a material with a length shorter than the dimensions of deformation or the indenter. It can be used to measure the properties of individual grains or phases in a sample, which are very different from the bulk properties. This is important for understanding the micro- and nano-scale mechanisms of deformation. In addition, in the case of composite coatings with multiple phases, it can provide a useful insight into the properties of those phases.
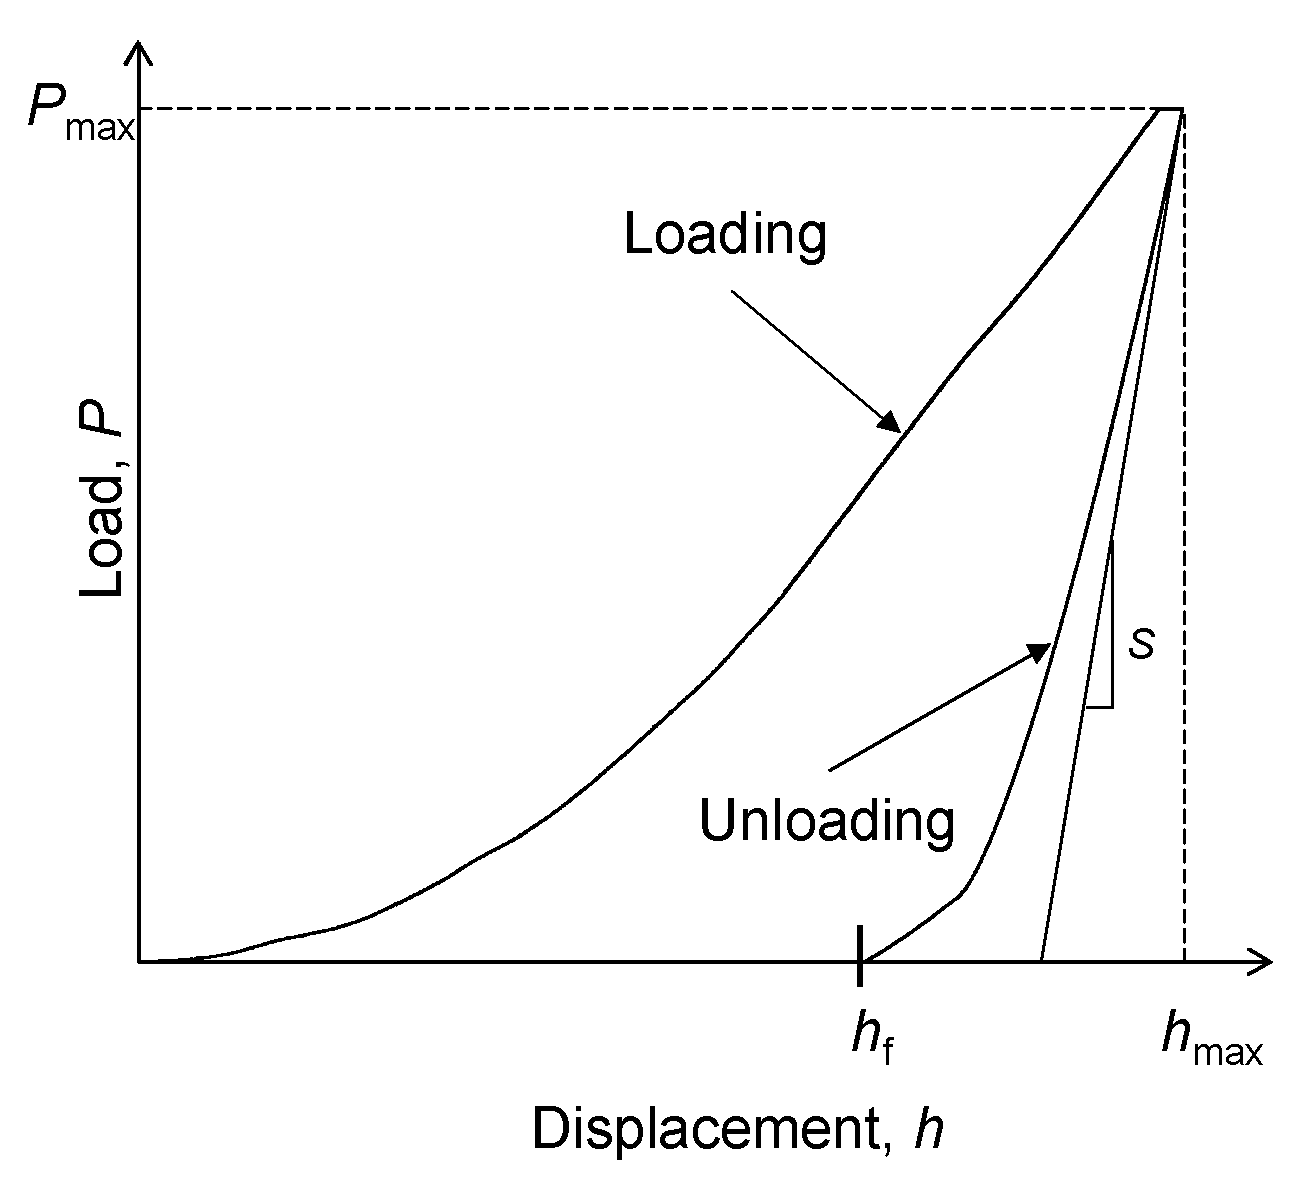
The deformation in indentation follows the elastic–plastic mode, where a part of the deformation is elastic in nature. A typical load-displacement curve obtained in a nanoindentation experiment is shown in Figure 7. The loading and unloading curves do not follow the same path due to the plastic deformation occurring in the sample. The maximum deformation is denoted by hmax, and the final displacement of the indenter after elastic recovery is denoted by hf.
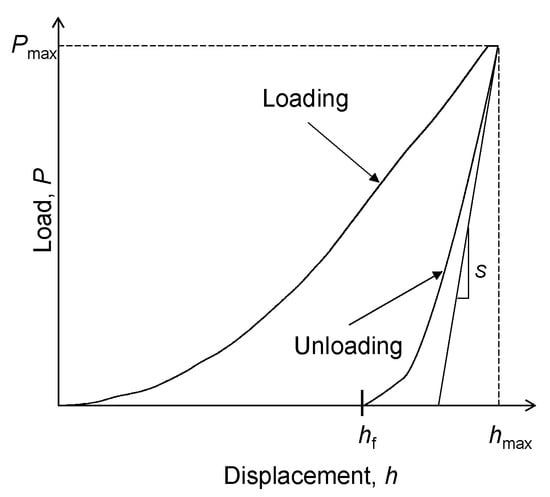
Figure 7.
Schematic load-displacement graph during nanoindentation.
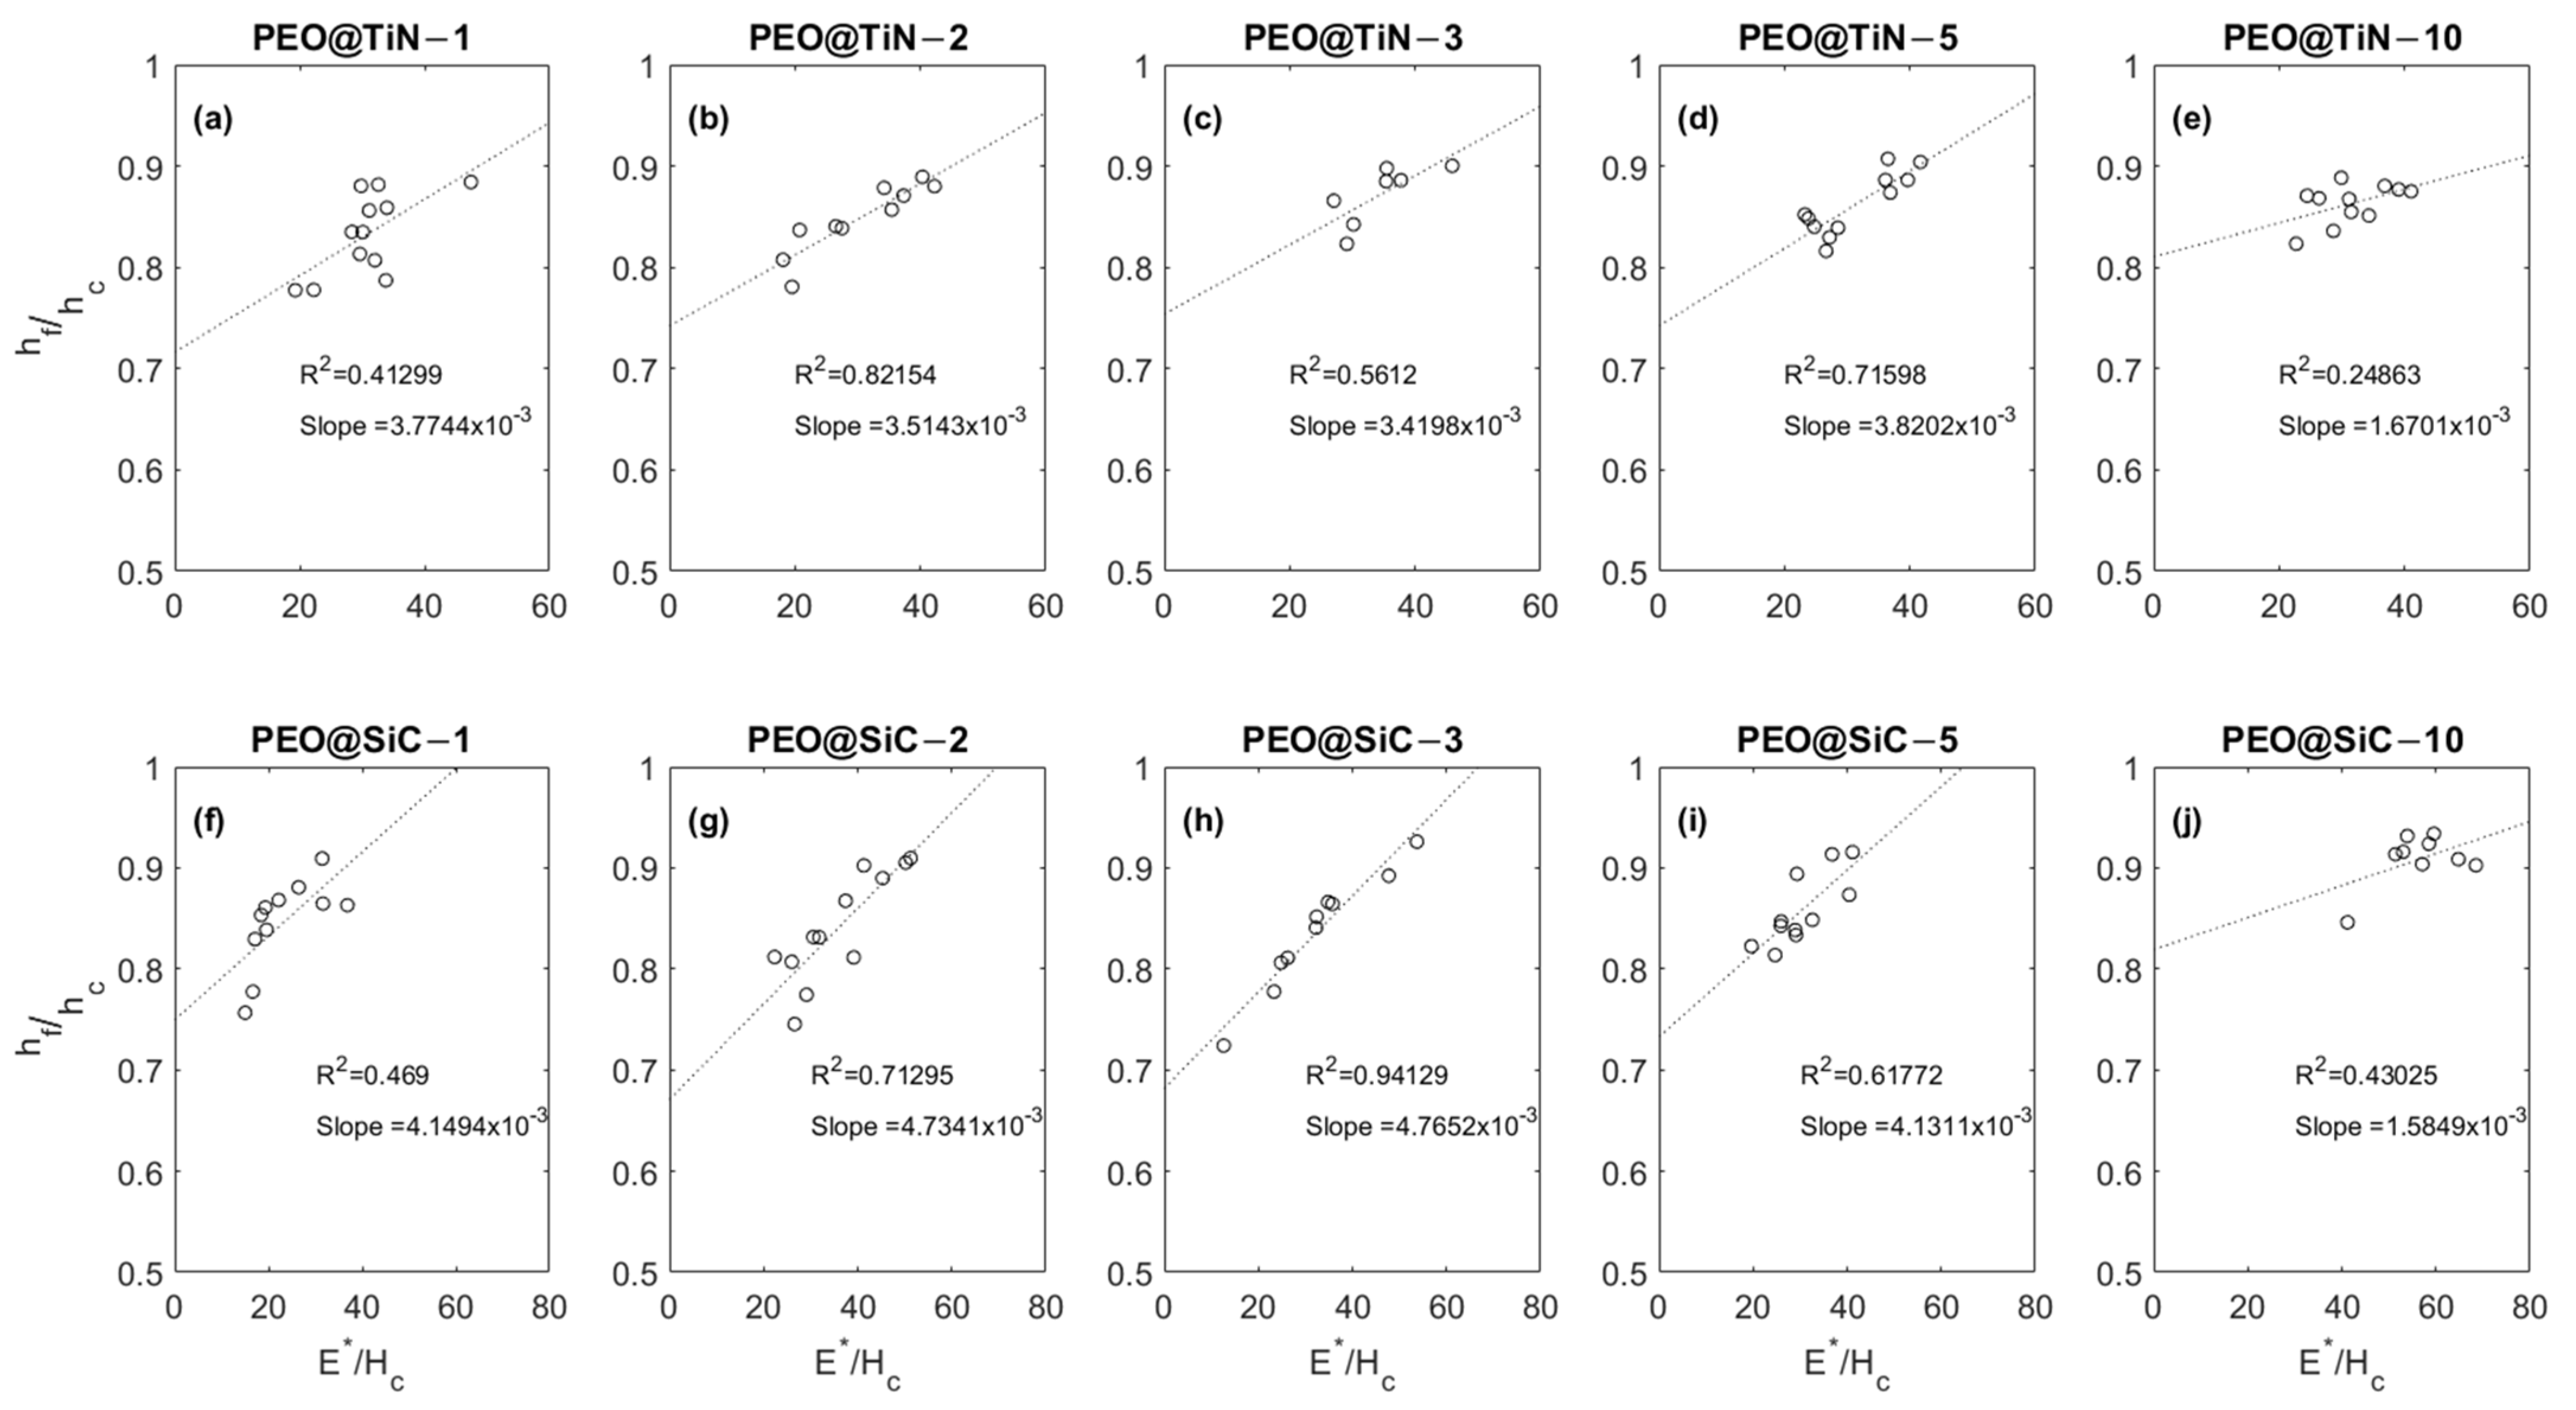
Figure 8 shows the relationship between the dimensionless parameters and for the coatings. The parameter is a measure of the recovery of the material being tested with an inverse relationship. So, higher values of point to less elastic and more plastic behavior; for instance, a value means perfectly elastic, means perfectly plastic, and 0–1 means elastic–plastic behavior. The parameter is the ratio between the modulus and hardness of the material. For all specimens tested, there is an increasing trend in with , which is consistent with results from numerical simulations of nanoindentation performed by Chen et al. [48] and Lawn & Howes [49]. The range of values of and these results show that the tests reflect the local mechanical response rather than the bulk response. It can be inferred from the plots that a longer processing time produces coatings with higher values of the two dimensionless parameters and , which are indications of low elastic recovery and high-stiffness materials. It is interesting to note that the slope of the line fitting the data points is lowest for the coatings produced at 10 min.
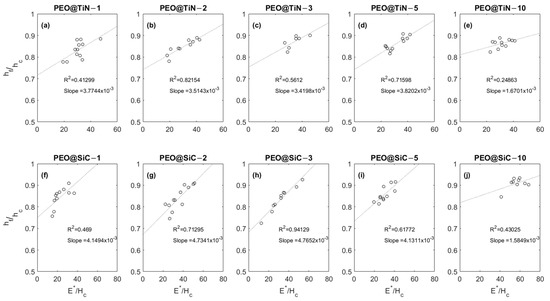
Figure 8.
Plots showing E*/Hc vs. hf/fc relationship for (a–e) PEO@TiN and (f–j) PEO@SiC coatings.
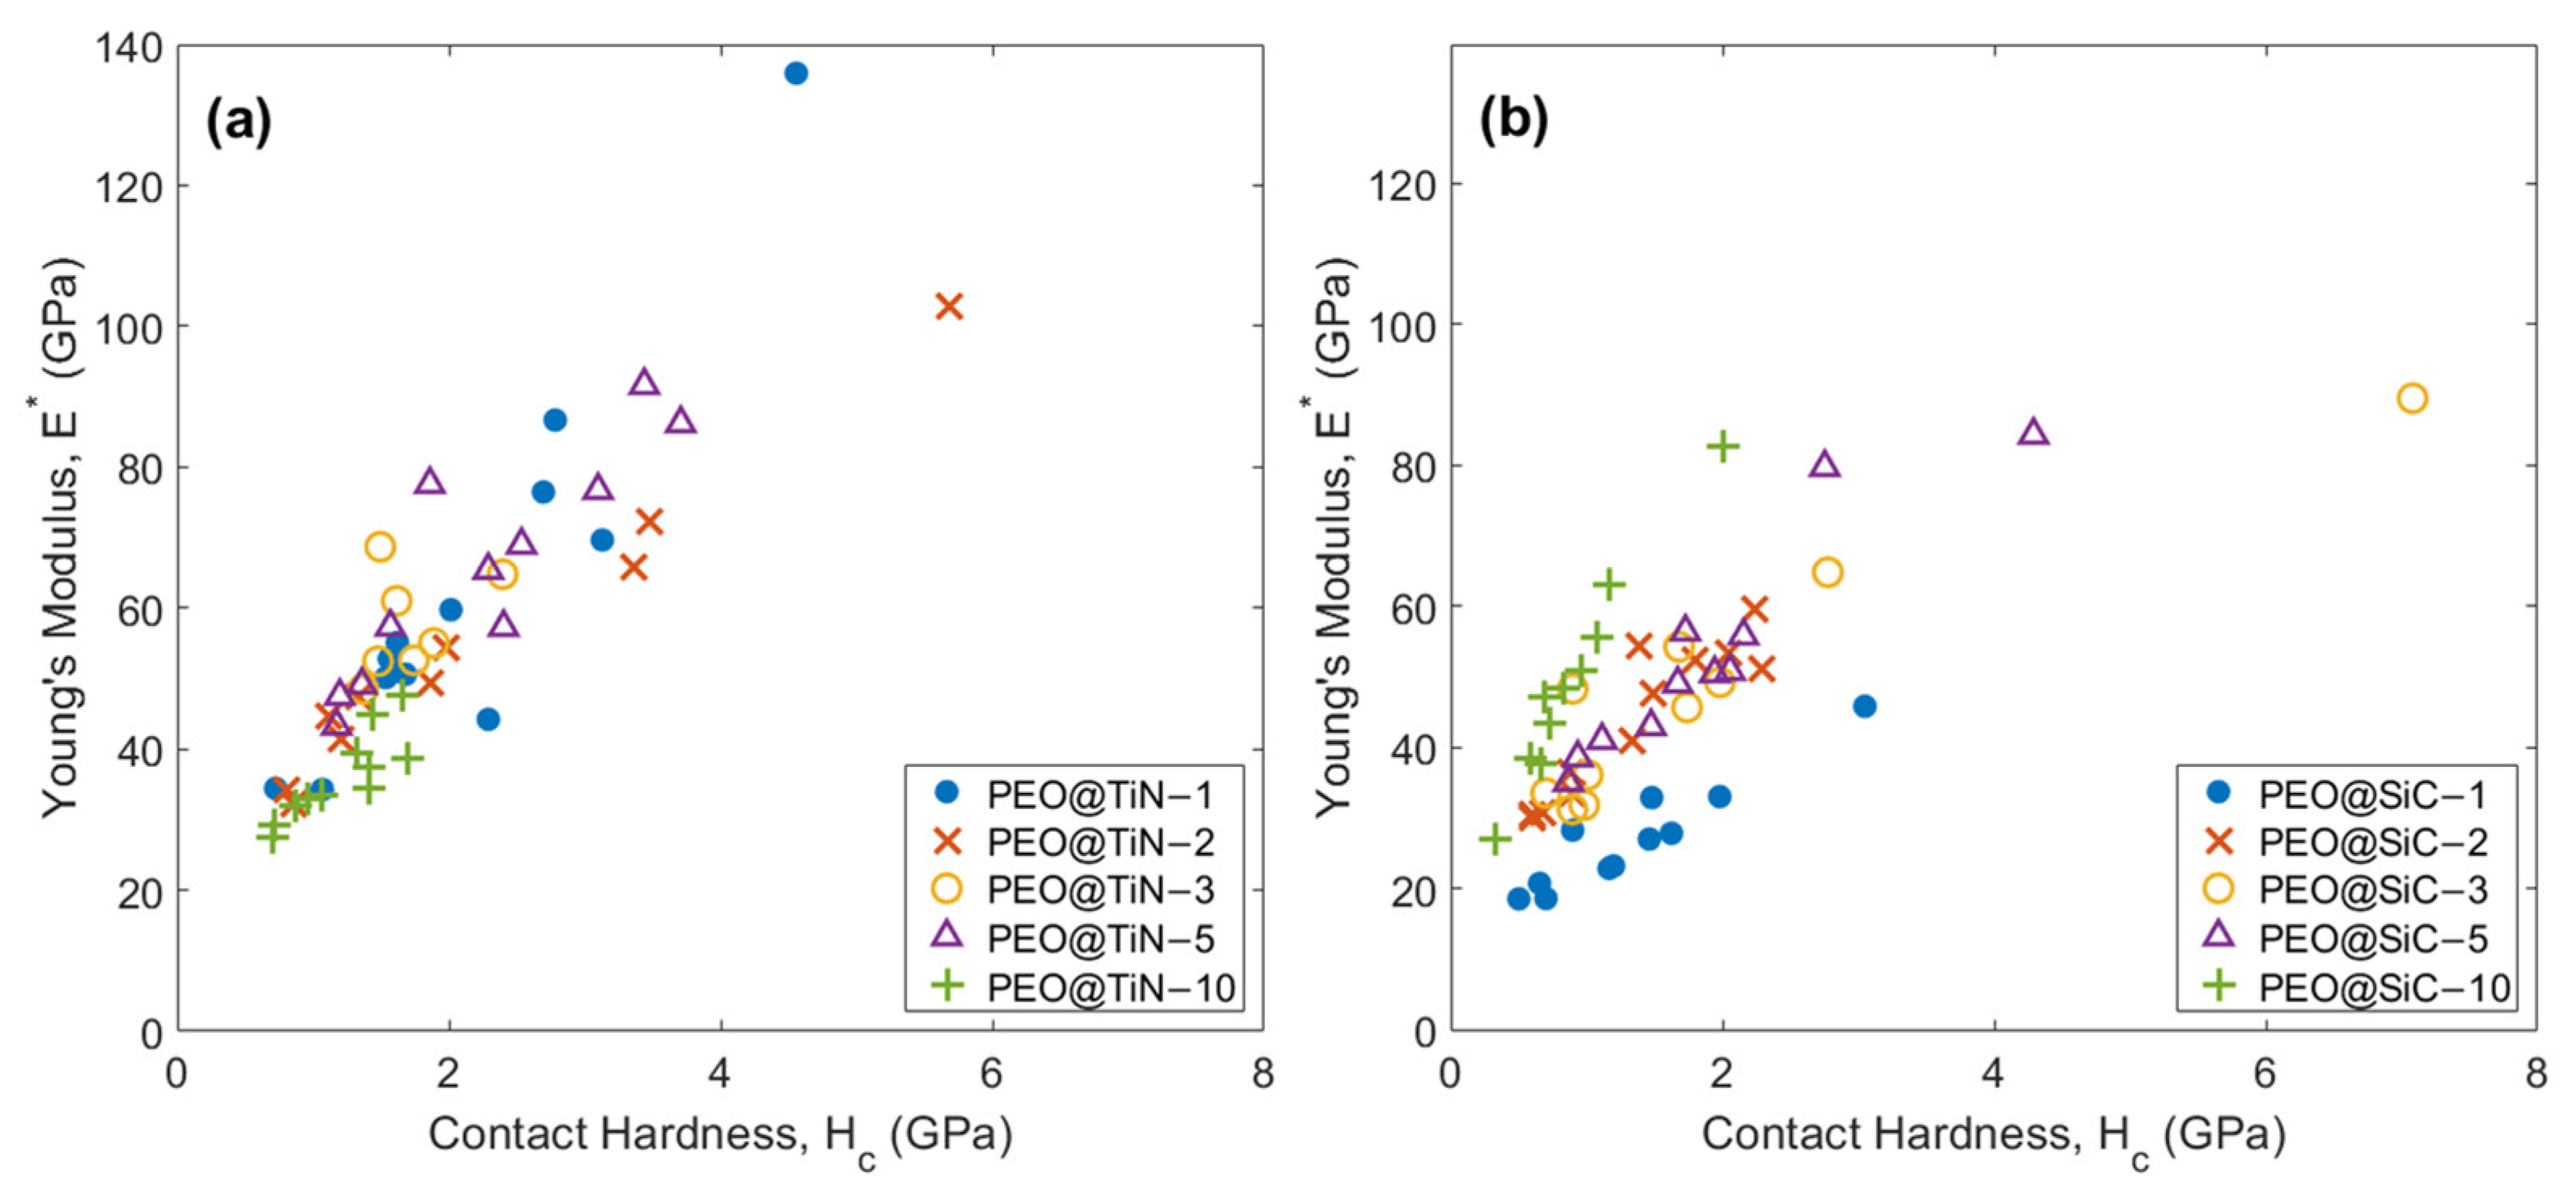
It is important to understand the relationship between coating stiffness (E*) and hardness (Hc). While the parameter is useful in understanding the effect of depth of deformation on mechanical properties, both values can be high or low simultaneously, causing the parameter to be effectively the same. The plots of E * vs. Hc are shown in Figure 9. There is a clear increasing trend in E* with Hc for all specimens. This shows that hardness is directly proportional to the contact stiffness of the phase being indented. The outliers in Figure 9a could be a due to a TiN nanoparticle aligned such that the deformation takes place in the TiN (1 1 1) preferred direction [50].
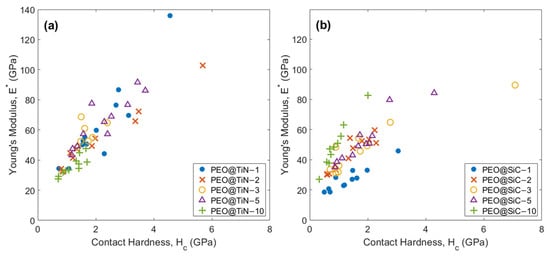
Figure 9.
Young’s modulus E* vs. contact hardness Hc plots for (a) PEO@TiN and (b) PEO@SiC coatings.
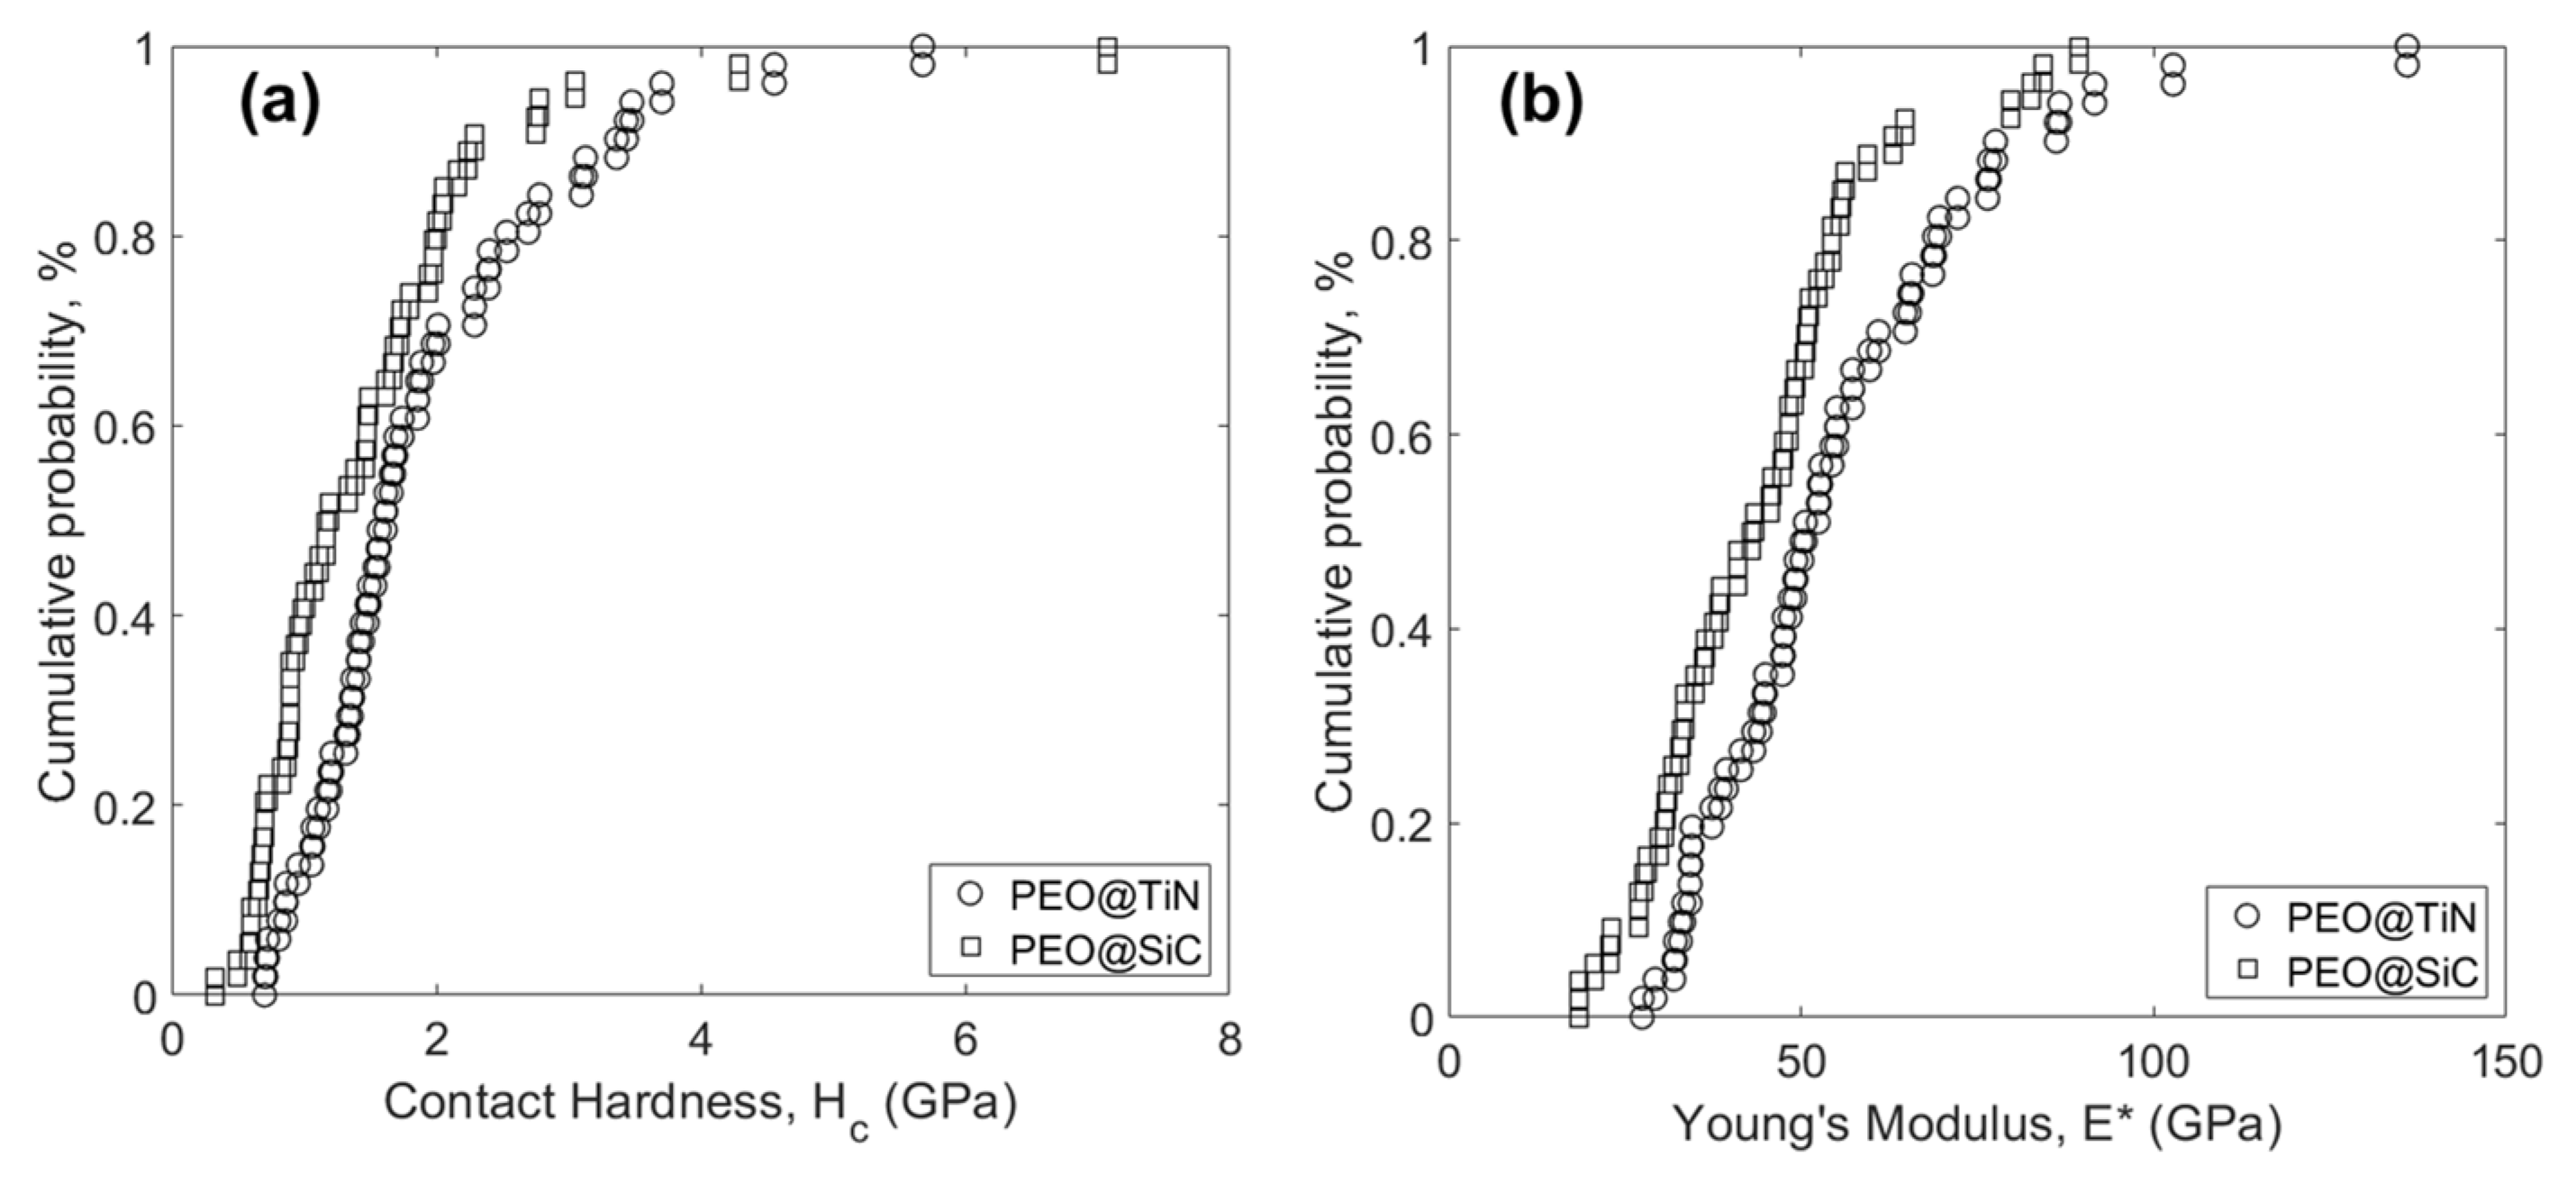
Statistical analysis of the experimental data is shown in Figure 10. The distribution functions of Hc (Figure 10a) and E* (Figure 10b) of PEO@TiN are offset to the right of PEO@SiC, meaning that the average value of those properties for PEO@TiN is larger than for PEO@SiC. The calculated mean and standard deviations are listed in Table 3. The hardness value of TiN-incorporated PEO coating was 1.90 ± 1.02 GPa, which was close to a similar coating on MA8 alloy (2.2 ± 0.3 GPa @ 1 g/L NP), reported elsewhere [30]. The fact that the average values are so close means they reflect the bulk properties, and the standard deviation accounts for the local behavior. The value reported in [30] was obtained by microhardness testing, however, and reflected properties of a larger scale than in this study. For that reason, the standard deviation values listed in Table 3 are high. Similarly, the modulus in the other study was 62 ± 7 GPa, whereas in this study it was 55.2 ± 20.9 GPa.
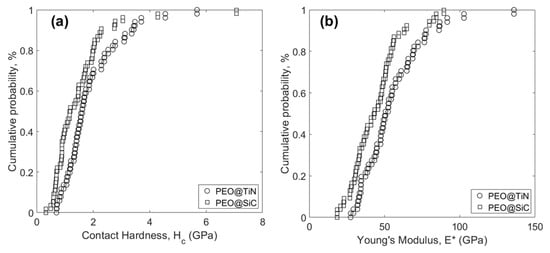
Figure 10.
Cumulative distribution function of (a) contact hardness Hc, and (b) Young’s modulus E* for the two coatings.

Table 3.
Mean value and standard deviation of Hc and E* for the coatings.
The PEO@SiC coatings had a similar trend to PEO@TiN. The standard deviations were very large in comparison with the mean values. The small-scale values and occurrence of NP under the indenter tip caused this fluctuation in this system. However, there was an overall reduction in both hardness and the modulus compared to PEO@TiN. Wang et al. [20] performed a hardness test on PEO coating with SiC nanoparticles on AZ91D alloy and found the hardness was 445.3 HV (=4.36 GPa). However, since there was a different alloy and PEO process, and Vicker’s testing was performed, direct comparison cannot be made. There is a lack of nanoindentation studies on SiC-incorporated PEO coatings on Mg alloys.
4. Conclusions
PEO coatings were developed on AZ31 alloy with TiN and SiC nanoparticle doping in the electrolyte at 0.5 g/L concentration. The processing time was changed to obtain various coatings. Morphological, chemical, and electrical analyses were performed on the coatings to assess their performance. The PEO coatings were 4.5 ± 0.5 µm in thickness and the TiC and SiC NPs were spread non-homogenously in the PEO oxide layer for all processing times. The NPs were either X-ray amorphous or too low in concentration to be picked up in XRD testing, which has been reported by other researchers. The coating PEO@TiN-10 showed the lowest corrosion rate, at 6.3 × 10⁻⁵ mm/yr, of all specimens, which was several magnitudes better than base electrolyte PEO. SiC-containing PEO coating does not perform as well as TiN for 5 and 10 min processing times. However, shorter processing times produce better corrosion resistance for PEO@SiC. Nanoindentation testing revealed that PEO@TiN coatings have a higher average modulus and hardness than PEO@SiC coatings. The high variance in data is due to the difference in local properties and bulk properties of the coating. There is a clear increase trend in the dimensionless parameter and .
The concentration of the NPs used in this study was on the lower end of the spectrum. However, it is clear that processing time has a significant impact on the corrosion and mechanical properties of the coating. TiN is a better candidate than SiC for mechanical performance at all processing times and in terms of corrosion resistance at long processing times (5 and 10 min). It will be interesting to study the effect of a higher NP concentration on the coating performance as a future endeavor.
Author Contributions
Conceptualization, A.K.S., R.D. and I.B.; methodology, R.D. and A.K.S.; software, AK.S.; validation, A.K.S. and R.D.; formal analysis, A.K.S., K.S. and I.S.; investigation, R.D., K.S., M.V., M.I. and A.A.J.; resources, R.D., K.S. and I.B.; data curation, A.K.S., R.D. and M.V.; writing—original draft preparation, A.K.S.; writing—review and editing, A.K.S. and R.D.; visualization, A.K.S.; supervision, R.D.; project administration, I.B. and R.D.; funding acquisition, I.B. All authors have read and agreed to the published version of the manuscript.
Funding
This research was supported by the European Regional Development Fund project titled “Development of an innovative and efficient coating for magnesium components” under grant number 1.1.1.1/19/A/148.
Institutional Review Board Statement
Not applicable.
Data Availability Statement
The data presented in this study are available on request from the corresponding author.
Acknowledgments
The authors acknowledge Riga Technical University for offering their facilities and laboratories for carrying out the experiments.
Conflicts of Interest
The authors declare no conflict of interest. The funders had no role in the design of the study; in the collection, analyses, or interpretation of data; in the writing of the manuscript; or in the decision to publish the results.
References
- Song, J.; Chen, J.; Xiong, X.; Peng, X.; Chen, D.; Pan, F. Research advances of magnesium and magnesium alloys worldwide in 2021. J. Magnes. Alloys 2022, 10, 863–898. [Google Scholar] [CrossRef]
- Jayasathyakawin, S.; Ravichandran, M.; Baskar, N.; Anand Chairman, C.; Balasundaram, R. Mechanical properties and applications of Magnesium alloy—Review. Mater. Today Proc. 2020, 27, 909–913. [Google Scholar] [CrossRef]
- Ji, Q.; Wang, Y.; Wu, R.; Wei, Z.; Ma, X.; Zhang, J.; Hou, L.; Zhang, M. High specific strength Mg-Li-Zn-Er alloy processed by multi deformation processes. Mater. Charact. 2020, 160, 110135. [Google Scholar] [CrossRef]
- Tian, G.; Wang, J.; Wang, S.; Xue, C.; Yang, X.; Su, H. An ultra-light Mg-Li alloy with exceptional elastic modulus, high strength, and corrosion-resistance. Mater. Today Commun. 2023, 35, 105623. [Google Scholar] [CrossRef]
- Kiarasi, F.; Babaei, M.; Omidi Bidgoli, M.; Reza Kashyzadeh, K.; Asemi, K. Mechanical characterization and creep strengthening of AZ91 magnesium alloy by addition of yttrium oxide nanoparticles. Proc. Inst. Mech. Eng. Part L J. Mater. Des. Appl. 2022, 236, 1489–1500. [Google Scholar] [CrossRef]
- Tong, L.B.; Chu, J.H.; Zou, D.N.; Sun, Q.; Kamado, S.; Brokmeier, H.G.; Zheng, M.Y. Simultaneously Enhanced Mechanical Properties and Damping Capacities of ZK60 Mg Alloys Processed by Multi-Directional Forging. Acta Metall. Sin. (Engl. Lett.) 2021, 34, 265–277. [Google Scholar] [CrossRef]
- Wang, G.G.; Weiler, J.P. Recent developments in high-pressure die-cast magnesium alloys for automotive and future applications. J. Magnes. Alloys 2023, 11, 78–87. [Google Scholar] [CrossRef]
- Zahedi Asl, V.; Chini, S.F.; Zhao, J.; Palizdar, Y.; Shaker, M.; Sadeghi, A. Corrosion properties and surface free energy of the Zn Al LDH/rGO coating on MAO pretreated AZ31 magnesium alloy. Surf. Coat. Technol. 2021, 426, 127764. [Google Scholar] [CrossRef]
- Wu, T.; Blawert, C.; Lu, X.; Serdechnova, M.; Zheludkevich, M.L. Difference in formation of plasma electrolytic oxidation coatings on MgLi alloy in comparison with pure Mg. J. Magnes. Alloys 2021, 9, 1725–1740. [Google Scholar] [CrossRef]
- Kaseem, M.; Zehra, T.; Dikici, B.; Dafali, A.; Yang, H.W.; Ko, Y.G. Improving the electrochemical stability of AZ31 Mg alloy in a 3.5wt.% NaCl solution via the surface functionalization of plasma electrolytic oxidation coating. J. Magnes. Alloys 2022, 10, 1311–1325. [Google Scholar] [CrossRef]
- Liu, X.; Liu, L.; Dong, S.; Chen, X.-B.; Dong, J. Towards dense corrosion-resistant plasma electrolytic oxidation coating on Mg-Gd-Y-Zr alloy by using ultra-high frequency pulse current. Surf. Coat. Technol. 2022, 447, 128881. [Google Scholar] [CrossRef]
- Zehra, T.; Patil, S.A.; Shrestha, N.K.; Fattah-alhosseini, A.; Kaseem, M. Anionic assisted incorporation of WO3 nanoparticles for enhanced electrochemical properties of AZ31 Mg alloy coated via plasma electrolytic oxidation. J. Alloys Compd. 2022, 916, 165445. [Google Scholar] [CrossRef]
- Ali, W.; Echeverry-Rendón, M.; Dominguez, G.; van Gaalen, K.; Kopp, A.; González, C.; Llorca, J. Bioabsorbable WE43 Mg alloy wires modified by continuous plasma electrolytic oxidation for implant applications. Part II: Degradation and biological performance. Biomater. Adv. 2023, 147, 213325. [Google Scholar] [CrossRef] [PubMed]
- Wu, J.; Wu, L.; Yao, W.; Chen, Y.; Chen, Y.; Yuan, Y.; Wang, J.; Atrens, A.; Pan, F. Effect of electrolyte systems on plasma electrolytic oxidation coatings characteristics on LPSO Mg-Gd-Y-Zn alloy. Surf. Coat. Technol. 2023, 454, 129192. [Google Scholar] [CrossRef]
- Zafari, A.; Ghasemi, H.M.; Mahmudi, R. An investigation on the tribological behavior of AZ91 and AZ91+3wt% RE magnesium alloys at elevated temperatures. Mater. Des. (1980–2015) 2014, 54, 544–552. [Google Scholar] [CrossRef]
- Yu, L.; Cao, J.; Cheng, Y. An improvement of the wear and corrosion resistances of AZ31 magnesium alloy by plasma electrolytic oxidation in a silicate–hexametaphosphate electrolyte with the suspension of SiC nanoparticles. Surf. Coat. Technol. 2015, 276, 266–278. [Google Scholar] [CrossRef]
- Zhang, Y.; Xu, Y.; Miao, C.; Tu, X.; Yu, J.; Li, J. Effect of Tungsten Carbide Particles on the Characteristics of PEO Coatings Formed on AZ31B Magnesium Alloy in Alkaline Electrolyte. Int. J. Electrochem. Sci. 2018, 13, 7923–7929. [Google Scholar] [CrossRef]
- NasiriVatan, H.; Ebrahimi-Kahrizsangi, R.; Asgarani, M.K. Tribological performance of PEO-WC nanocomposite coating on Mg Alloys deposited by Plasma Electrolytic Oxidation. Tribol. Int. 2016, 98, 253–260. [Google Scholar] [CrossRef]
- Tang, M.; Feng, Z.; Wu, X.; Wang, W.; Li, G.; Yan, Z.; Zhang, R. Microarc oxidation coatings containing TiC and NbC on magnesium alloy. Surf. Eng. 2019, 36, 1171–1179. [Google Scholar] [CrossRef]
- Wang, S.-y.; Si, N.-c.; Xia, Y.-p.; Liu, L. Influence of nano-SiC on microstructure and property of MAO coating formed on AZ91D magnesium alloy. Trans. Nonferrous Met. Soc. China 2015, 25, 1926–1934. [Google Scholar] [CrossRef]
- Wu, M.; Jiang, F. Effect of SiC addition in electrolyte on the microstructure and tribological properties of micro-arc oxidation coatings on Al-Mg-Sc alloy. Surf. Topogr. Metrol. Prop. 2021, 9, 035043. [Google Scholar] [CrossRef]
- Yang, Y.; Wu, H. Effects of Current Frequency on the Microstructure and Wear Resistance of Ceramic Coatings Embedded with SiC Nano-particles Produced by Micro-arc Oxidation on AZ91D Magnesium Alloy. J. Mater. Sci. Technol. 2010, 26, 865–871. [Google Scholar] [CrossRef]
- Golhin, A.P.; Kamrani, S.; Fleck, C.; Ghasemi, A. Corrosion protection of Mg-SiC nanocomposite through plasma electrolytic oxidation coating process. Mater. Corros. 2022, 73, 1813–1825. [Google Scholar] [CrossRef]
- Lu, X.; Blawert, C.; Huang, Y.; Ovri, H.; Zheludkevich, M.L.; Kainer, K.U. Plasma electrolytic oxidation coatings on Mg alloy with addition of SiO2 particles. Electrochim. Acta 2016, 187, 20–33. [Google Scholar] [CrossRef]
- Lu, X.; Blawert, C.; Mohedano, M.; Scharnagl, N.; Zheludkevich, M.L.; Kainer, K.U. Influence of electrical parameters on particle uptake during plasma electrolytic oxidation processing of AM50 Mg alloy. Surf. Coat. Technol. 2016, 289, 179–185. [Google Scholar] [CrossRef]
- Mohedano, M.; Blawert, C.; Zheludkevich, M.L. Silicate-based Plasma Electrolytic Oxidation (PEO) coatings with incorporated CeO2 particles on AM50 magnesium alloy. Mater. Des. 2015, 86, 735–744. [Google Scholar] [CrossRef]
- Wang, Y.; Wei, D.; Yu, J.; Di, S. Effects of Al2O3 Nano-additive on Performance of Micro-arc Oxidation Coatings Formed on AZ91D Mg Alloy. J. Mater. Sci. Technol. 2014, 30, 984–990. [Google Scholar] [CrossRef]
- Zhang, Y.; Chen, F.; Zhang, Y.; Du, C. Influence of graphene oxide additive on the tribological and electrochemical corrosion properties of a PEO coating prepared on AZ31 magnesium alloy. Tribol. Int. 2020, 146, 106135. [Google Scholar] [CrossRef]
- Mashtalyar, D.V.; Gnedenkov, S.V.; Sinebryukhov, S.L.; Imshinetskiy, I.M.; Puz’, A.V. Plasma electrolytic oxidation of the magnesium alloy MA8 in electrolytes containing TiN nanoparticles. J. Mater. Sci. Technol. 2017, 33, 461–468. [Google Scholar] [CrossRef]
- Mashtalyar, D.V.; Sinebryukhov, S.L.; Imshinetskiy, I.M.; Gnedenkov, A.S.; Nadaraia, K.V.; Ustinov, A.Y.; Gnedenkov, S.V. Hard wearproof PEO-coatings formed on Mg alloy using TiN nanoparticles. Appl. Surf. Sci. 2020, 503, 144062. [Google Scholar] [CrossRef]
- Doerner, M.F.; Nix, W.D. A method for interpreting the data from depth-sensing indentation instruments. J. Mater. Res. 1986, 1, 601–609. [Google Scholar] [CrossRef]
- Oliver, W.C.; Pharr, G.M. An improved technique for determining hardness and elastic modulus using load and displacement sensing indentation experiments. J. Mater. Res. 1992, 7, 1564–1583. [Google Scholar] [CrossRef]
- Field, J.S.; Swain, M.V. A simple predictive model for spherical indentation. J. Mater. Res. 1993, 8, 297–306. [Google Scholar] [CrossRef]
- Gong, J.; Peng, Z.; Miao, H. Analysis of the nanoindentation load–displacement curves measured on high-purity fine-grained alumina. J. Eur. Ceram. Soc. 2005, 25, 649–654. [Google Scholar] [CrossRef]
- Drunka, R.; Iesalniece, P.; Savkovs, K.; Krumina, A. Plasma electrolytic oxidation of AZ31 Mg alloy in bipolar pulse mode and influence of corrosion to surface morphology of obtained coatings. Mater. Sci. (Medžiagotyra), 2022; Accepted. [Google Scholar]
- Drunka, R.; Iesalniece, P.; Steins, I.; Grase, L.; Eiduks, T.V.; Savkovs, K.; Blumbergs, I. Complex coating system for improving corrosion resistance of AZ31 magnesium alloy. J. Phys. Conf. Ser. 2023, 2423, 012020. [Google Scholar] [CrossRef]
- Lee, K.M.; Shin, K.R.; Namgung, S.; Yoo, B.; Shin, D.H. Electrochemical response of ZrO2-incorporated oxide layer on AZ91 Mg alloy processed by plasma electrolytic oxidation. Surf. Coat. Technol. 2011, 205, 3779–3784. [Google Scholar] [CrossRef]
- Molaei, M.; Babaei, K.; Fattah-alhosseini, A. Improving the wear resistance of plasma electrolytic oxidation (PEO) coatings applied on Mg and its alloys under the addition of nano- and micro-sized additives into the electrolytes: A review. J. Magnes. Alloys 2021, 9, 1164–1186. [Google Scholar] [CrossRef]
- Pierson, H.O. Handbook of Refractory Carbides & Nitrides: Properties, Characteristics, Processing and Applications; William Andrew: Norwich, NY, USA, 1996. [Google Scholar]
- Moriyama, M.; Kawazoe, T.; Tanaka, M.; Murakami, M. Correlation between microstructure and barrier properties of TiN thin films used Cu interconnects. Thin Solid Films 2002, 416, 136–144. [Google Scholar] [CrossRef]
- Daviau, K.; Lee, K.K.M. Decomposition of silicon carbide at high pressures and temperatures. Phys. Rev. B 2017, 96, 174102. [Google Scholar] [CrossRef]
- Lee, K.M.; Lee, B.U.; Yoon, S.I.; Lee, E.S.; Yoo, B.; Shin, D.H. Evaluation of plasma temperature during plasma oxidation processing of AZ91 Mg alloy through analysis of the melting behavior of incorporated particles. Electrochim. Acta 2012, 67, 6–11. [Google Scholar] [CrossRef]
- Polunin, A.V.; Cheretaeva, A.O.; Borgardt, E.D.; Rastegaev, I.A.; Krishtal, M.M.; Katsman, A.V.; Yasnikov, I.S. Improvement of oxide layers formed by plasma electrolytic oxidation on cast Al Si alloy by incorporating TiC nanoparticles. Surf. Coat. Technol. 2021, 423, 127603. [Google Scholar] [CrossRef]
- Lu, X.; Blawert, C.; Zheludkevich, M.L.; Kainer, K.U. Insights into plasma electrolytic oxidation treatment with particle addition. Corros. Sci. 2015, 101, 201–207. [Google Scholar] [CrossRef]
- O'Hara, M.; Troughton, S.C.; Francis, R.; Clyne, T.W. The incorporation of particles suspended in the electrolyte into plasma electrolytic oxidation coatings on Ti and Al substrates. Surf. Coat. Technol. 2020, 385, 125354. [Google Scholar] [CrossRef]
- Nikkam, N.; Saleemi, M.; Haghighi, E.B.; Ghanbarpour, M.; Khodabandeh, R.; Muhammed, M.; Palm, B.; Toprak, M.S. Fabrication, Characterization and Thermophysical Property Evaluation of SiC Nanofluids for Heat Transfer Applications. Nano-Micro Lett. 2014, 6, 178–189. [Google Scholar] [CrossRef]
- Zhang, J.; Duan, L.; Jiang, D.; Lin, Q.; Iwasa, M. Dispersion of TiN in aqueous media. J. Colloid Interface Sci. 2005, 286, 209–215. [Google Scholar] [CrossRef]
- Cheng, Y.-T.; Li, Z.; Cheng, C.-M. Scaling relationships for indentation measurements. Philos. Mag. A 2002, 82, 1821–1829. [Google Scholar] [CrossRef]
- Lawn, B.R.; Howes, V.R. Elastic recovery at hardness indentations. J. Mater. Sci. 1981, 16, 2745–2752. [Google Scholar] [CrossRef]
- Chen, C.T.; Song, Y.C.; Yu, G.P.; Huang, J.H. Microstructure and hardness of hollow cathode discharge ion-plated titanium nitride film. J. Mater. Eng. Perform. 1998, 7, 324–328. [Google Scholar] [CrossRef]
Disclaimer/Publisher’s Note: The statements, opinions and data contained in all publications are solely those of the individual author(s) and contributor(s) and not of MDPI and/or the editor(s). MDPI and/or the editor(s) disclaim responsibility for any injury to people or property resulting from any ideas, methods, instructions or products referred to in the content. |
© 2023 by the authors. Licensee MDPI, Basel, Switzerland. This article is an open access article distributed under the terms and conditions of the Creative Commons Attribution (CC BY) license (https://creativecommons.org/licenses/by/4.0/).

