Article

Structural, Optical and Dielectric Properties of Holmium-Doped Nickel-Cadmium Ferrite Nanoparticles Synthesized by Sol-Gel Auto-Combustion Method

1
Department of Physics, Riphah International University, Islamabad 44000, Pakistan
2
Department of Physics, Government Post Graduate College Nowshera, Nowshera 24100, Pakistan
3
Department of Physical Sport Science, College of Education, Princess Nourah bint Abdulrahman University, P.O. Box 84428, Riyadh 11671, Saudi Arabia
4
Mechanical Engineering Department, College of Engineering, King Khalid University, Abha 61421, Asir, Saudi Arabia
5
Research Center for Advanced Materials Science (RCAMS), King Khalid University, P.O. Box 9004, Abha 61413, Asir, Saudi Arabia
6
Institute of IR 4.0, Universiti Kebangsaan Malaysia, Bangi 43600, Malaysia
7
Department of Electrical, Electronic and Systems Engineering, Faculty of Engineering and Built Environment, Universiti Kebangsaan Malaysia, Bangi 43600, Malaysia
8
Department of Chemistry, College of Science, Taif University, Taif 21944, Saudi Arabia
*
Authors to whom correspondence should be addressed.
Crystals 2023, 13(3), 495; https://doi.org/10.3390/cryst13030495
Submission received: 24 February 2023 / Revised: 2 March 2023 / Accepted: 2 March 2023 / Published: 14 March 2023
(This article belongs to the Special Issue Nanomaterials: Nanostructures and Magnetic Semiconductors)

Abstract

:
Nanoparticles where holmium was substituted with nickel-cadmium Ni0.5Cd0.5HoxFe2-xO4 (X = 0, 0.02, and 0.04) ferrites were synthesized through a sol-gel auto-combustion process to reveal their structural and physical properties. The synthesized nanoparticles were characterized using X-ray diffraction (XRD), a scanning electron microscope (SEM), Fourier transform infrared ray (FTIR) spectroscopy, and impedance spectroscopy techniques. XRD revealed the formation of the cubic crystal structure had a preferential orientation along (311). By including holmium, the lattice constant was reduced, while the average crystallite size was increased. SEM analysis revealed that the nanoparticles exhibited regular shapes, and the average grain size increased with the holmium content. FTIR spectroscopy determined that all the organic and inorganic materials had an absorption range of 400 to 4000 cm−1. The dielectric properties were measured between the frequency ranges of 1 kHz and 2 MHz. This shows that the tangent loss and the dielectric constant were raised when the concentration of holmium was increased.

1. Introduction

Many researchers have studied the application of nanotechnology during the last few years. The subject of nanotechnology has seen a number of significant breakthroughs; according to (Feynman, 1960), ‘There are plenty of rooms at the bottom’. Nanotechnology has enabled the production of a wide variety of materials at the nanoscale. A broad category of materials known as nanoparticles (NPs) is made up of compounds that are particulate and have at least one dimension greater than 1 nm and less than 100 nm [1]. The following categories can be used to classify nanomaterials according to their dimension: (a) zero-dimensional (0D): All of the dimensions of this type of nanomaterial fall inside the nanometer (nm) range. Typically, they have a spherical shape, such as nanodots, clusters, etc.; (b) one-dimensional (1D): In 1D nanomaterials, only one dimension is outside the nm range. They are long like cylinders, such as nanorods, nanowires, fibers, and so on; (c) two-dimensional (2D): These nanoparticles have two dimensions and are similar to sheets outside of the nanometer range, such as nanotubes, coatings, and films; (d) three-dimensional (3D): 3D nanomaterials are large materials, such as sand and crystals, that have no dimensions in the nanoscale range [2].
Nanostructure ferrites have become more well known in the world of electronic technology as a result of their outstanding “ferrimagnetism” feature [3]. A cubic structure with the typical formula AB2O4 (where A stands for divalent cation and B for trivalent cation) is described as “spinel” [4,5]. Spinel ferrites are defined as closely packed simple cubic structures along with Fe3+ ion as trivalent, i.e., AFe2O4; the bulk of transitional metals, including Co, Fe, Ba, Ni, Cd, Zn, etc.; and their concerned composites, as well. This type of ferrite resembles spinel, a naturally occurring mineral made of MgAl2O4, in terms of its structural makeup. By definition, these cubic ferrites, also known as ferro spinels, are semiconducting [6]. In this situation, the cubic or spinel type of crystal structure leads to the creation of numerous free charge carriers and vacancies in the structure, the presence of which determines the practical application of these materials. One of the simplest methods for creating oxide nanostructures with a spinel-like structure is the oxidizing of solid solutions of FeCo and FeNi by introducing oxygen into the nodes and interstices of the crystal lattice [7]. Spinel ferrites have drawn a lot of interest from researchers due to their incredible, extraordinary magnetic and dielectric properties, i.e., high saturation magnetization, considerable magneto-crystalline anisotropy, and low coercivity [8]. Based on their magnetic characteristics, ferrites can be divided into some groups: (a) hard ferrites: They are sometimes mentioned as “permanent magnets”, since they can be difficult to magnetize and then demagnetize. High coercivity and saturation magnetization characterize them. Hard ferrites have a hexagonal structure and are mostly composed of Fe and Ba or Sr oxides [9]; (b) soft ferrites: These materials are referred to as “soft ferrites” because of how easily they can become magnetized and demagnetized. Due to their low coercivity, they can serve as magnetic field conductors. Nickel, manganese, and zinc compounds make up the majority of them [10]. The creation of FNPs is evolving into one of the most fascinating fields of research due to their use in practically every aspect of life, including electronic devices for energy storage applications; antimicrobial activity [11]; biomedical applications, such as magnetic resonance imaging (MRI), hyperthermia, drug delivery, etc. [12,13]; and use as sensors for various poisonous gases [14]. They have significantly aided in the treatment of sewage by acting as photo catalysts [15]. Spinel ferrites, along with different dopants in MFe2O4 (M = Co, Ni, Mn, Zn, Mg, etc.), are the most compatible materials [16]. Spinel ferrites can be broadly divided into three categories, i.e., (i) normal spinels: In general, they are (M12+)[Fe3+]2O4. Divalent ions occupy the tetrahedral or A-site of typical spinels, while trivalent ions are found in B-site octahedra; (ii) inverse spinels: They are (Fe3+) [M12+Fe3+]O4 in general. In this instance, trivalent metal ions were only found at site A, while divalent metal ions were found at site B; (iii) mixed spinels: divalent metal ions that are present in both the A- and B-sites make up mixed spinels, which have no clear preference. Numerous industries, including medicine delivery, antimicrobial activity, gas sensors, energy storage, and microwave devices, use spinel ferrites [17]. Ferrites are a cheap material that can be used for a variety of sensor probes, including those for temperature, mechanical stress, and magnetic fields and currents [18,19,20,21]. Regarding applications, the shape, size, purity, and magnetic stability of nanoparticles all affect their magnetic characteristics. Due to their large thermal stability and electrical resistivity, they are used in electrode materials for high temperature applications [22,23]. Ferrites as temperature sensors can measure the body’s temperature and are used in biological applications [24]. The inverse form of the soft magnetized spinel, nickel ferrite is used extensively in modern electronics, particularly in phase shifters, circulators, isolators, power converters, and many electromagnetic devices for electromagnetic interference reduction (EMIS) [25,26,27]. Due to the wide functional diversity of properly substituted nickel ferrites, the use of high-resistivity nickel ferrites with appropriate doping, i.e., divalent ions (Mn2+ Co2+ and Zn2+), trivalent ions (Al3+, Cr3+, and Sb3+), and rare earth (RE) ions (Nd3+, Dy3+, Y3+, Pr3+, and Sm3+), has received particular attention from many researchers [28]. In nickel ferrite, the cation distribution is typically thought of as (Fe2+)[Ni2+Fe3+]O4, where doping with various cations at tetrahedral and octahedral sites was reported to impart special properties to these nanostructures synthesized by the sol-gel route [29,30,31]. Due to modified electrical and magnetic properties of spinel-type ferrites caused by RE-Fe interactions and magneto-crystalline anisotropy in rare earth ions, the replacement of Fe3+ by rare earth ions has been favorable. For example, the efficiency of doping with Er3+ ions had a significant impact on the optical and shielding properties of TeO2-ZnO-Er2O3 glasses. In general, doping oxide glasses with rare earth elements, such as cerium, samarium, erbium, gadolinium, and neodymium, is typically performed, as evidenced by a review of the literature. This leads to significant changes in both the structural and optical and shielding properties of telluride or boride glasses, which can be exploited as one of the methods to improve their ionizing radiation shielding efficiency and their resistance to external influences [32]. A few methodologies are used for the synthesis of obtaining the oxide compositions, such as either by soft chemistry, such as sol-gel, or by hydrothermal or electrochemical deposition, solvothermal strategies, co-precipitation, or organic–inorganic solution [33,34,35]. In their study of the dielectric and magnetic characteristics of Pr3+ doped Zn-Ni ferrite, Peng et al. found that Pr3+ replacement decreases the dielectric properties in frequency range of 1 MHz–400 MHz [36].
The main objective of this research work was to synthesize and characterize low-loss dielectrics with improved structural and dielectric properties through studying the effect of Ho3+ substitutions at the B-site cation for Fe3+ in Ni0.5Cd0.5Fe2O4 structure ceramics.

2. Experimental Methods

Samples of Ni0.5Cd0.5HoxFe2-xO4 (X = 0, 0.02, and 0.04) nanoferrite were made using the sol-gel auto-combustion technique to reveal their chemical makeup. High-grade chemicals, i.e., Ni (NO3)2 0.6(H2O), Cd (NO3)2 0.4(H2O), Ho (NO3)2 0.4(H2O), and Fe(NO3)2 0.9(H2O), were used as precursors. Stoichiometric calculations showed that 0.5 M and 2 M solutions of Ni (NO3)2 0.6(H2O), Cd (NO3)2 0.4(H2O), Ho (NO3)2 0.4(H2O), and Fe (NO3)2 0.9(H2O) were synthesized in 100 mL of distilled water separately, and all the mixtures were then stirred continuously for 30 min to create a homogeneous solution, using citric acid as a chelating agent. The solution was then put on a heated plate set to 80 °C, where it was continuously stirred while an ammonia solution was added to keep the pH level at 7–8. The fluid formed into a viscous brown gel after 5–6 h, and then the gel self-combusted, turning it into ash. The ash was thoroughly crushed and processed before being converted into a fine powder and sintered for five hours at 700 °C in a furnace. An X-ray diffractometer, (JDX-3532, JEOL, Tokyo, Japan), scanning electron microscopy (SEM) (JSM-5910, JEOL, Tokyo, Japan), and Fourier transform infrared spectroscopy were used to evaluate the produced Ni0.5Cd0.5HoxFe2-xO4 (X = 0, 0.02, and 0.04) nanoferrites. To analyze the dielectric behavior, all of the samples were compressed into pellets using a hydraulic press at a pressure of 50 MPa, measuring 12 mm in diameter and 2 to 3 mm in thickness. An LCR meter (Wayne-Kerr version-6500B, Wayne-Kerr Electronics, Bognor Regis, UK) was used to measure the dielectric constant (ε′) and dielectric loss tangent (tan δ ) in the frequency range of 1 KHz to 2 MHz at ambient temperature.

3. Results and Discussion

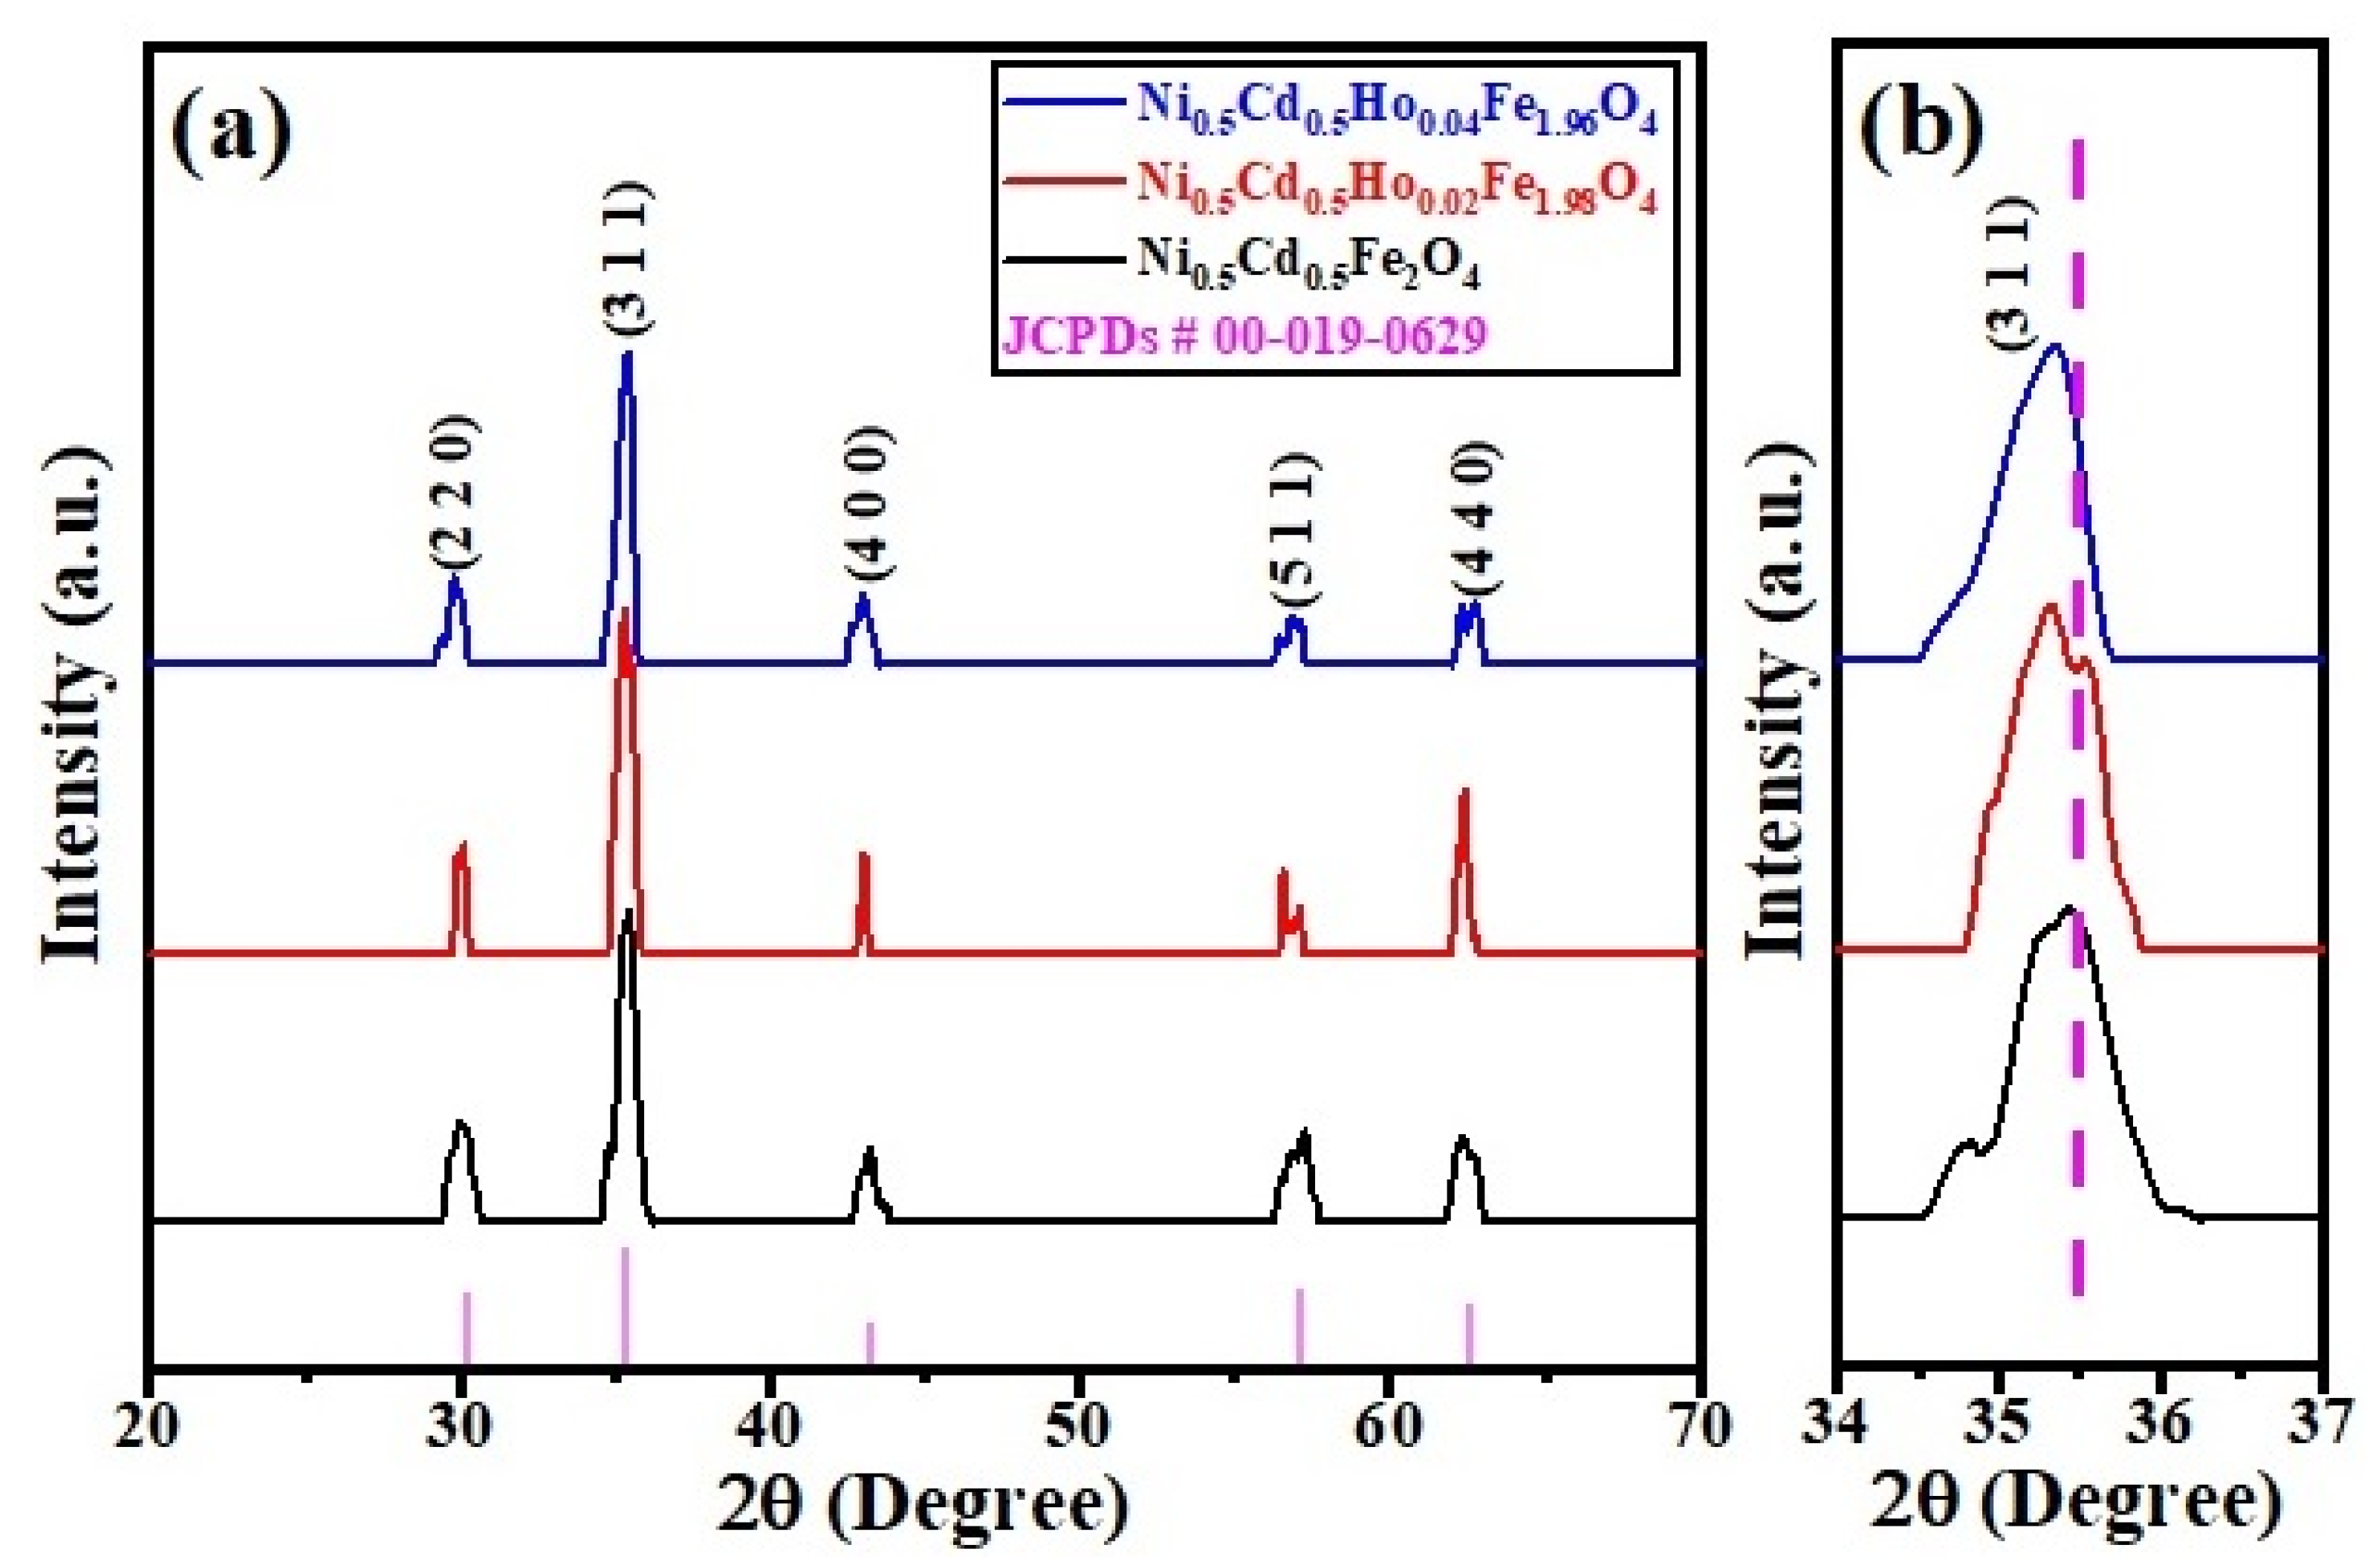
3.1. Structural Evaluation

X-ray diffraction was used for the analysis of crystal structure and phase purity. The lattice constants, interplanar spacing, crystallite size, and X-ray density may all be calculated from the XRD data. This Ni0.5Cd0.5HoxFe2-xO4 (X = 0, 0.02, and 0.04) nanoparticle study revealed a cubic crystal structure with the Fd-3m (227) space group. The planes (220), (311), (400), (511), and (440) were where the reflection took place. These planes correspond to JCPD card number [00-019-0629] from the Joint Committee on Powder Diffraction Standards. The peak (311) shifting towards a lower Bragg’s angle was observed as shown in the Figure 1b. The shifting of the peak was due to the difference of the ionic radius of the host and dopant elements. According to XRD analysis, the use of rare earth Ho ions up to 0.02 in nanoparticles did not change the crystal structure, and no second phase was observed, according to XRD analysis.
Equation (1) and the Debye–Scherrer Equation (2) were used to determine the cubic structure’s lattice parameter (a) and average crystallite size (D) [37].
a = d h 2 + k 2 + l 2
D = k λ β c o s θ
In Equations (1) and (2), d is the spacing element (given in Bragg’s law) and full width at half maximum (FWHM) of the primary XRD peak. h, k, and l are Miller indices.
Equation (3) is used to compute X-ray density, also known as theoretical density.
ρ = 8 M N a V
where Na is Avogadro’s number (6.02 × 10²³), M is the sample’s molecular mass, V is the unit cell’s volume, and since each spinel primitive cell is composed of eight molecules, the molecule’s mass is multiplied by eight.
Table 1 provides the lattice characteristics, typical crystallite sizes, and X-ray density. The prepared sample was a single-phase, cubic crystalline system, as indicated by the XRD peaks that were obtained in the 20° to 90° range. Table 1’s findings demonstrate that swapping Ho for nickel-cadmium ferrite had no appreciable impact on the lattice constant. Although Ho’s ionic radius (0.901) is significantly higher than iron’s (0.67) [38,39,40], the substitution of Ho did not change the lattice constant. This might be because Ho’s substitution was so minute. By moving the Fe3+ ion from the octahedral to the tetrahedral site, holmium with larger ionic radii could be found on the octahedral site. The size of crystallites is typically between 10 nm and 13 nm.

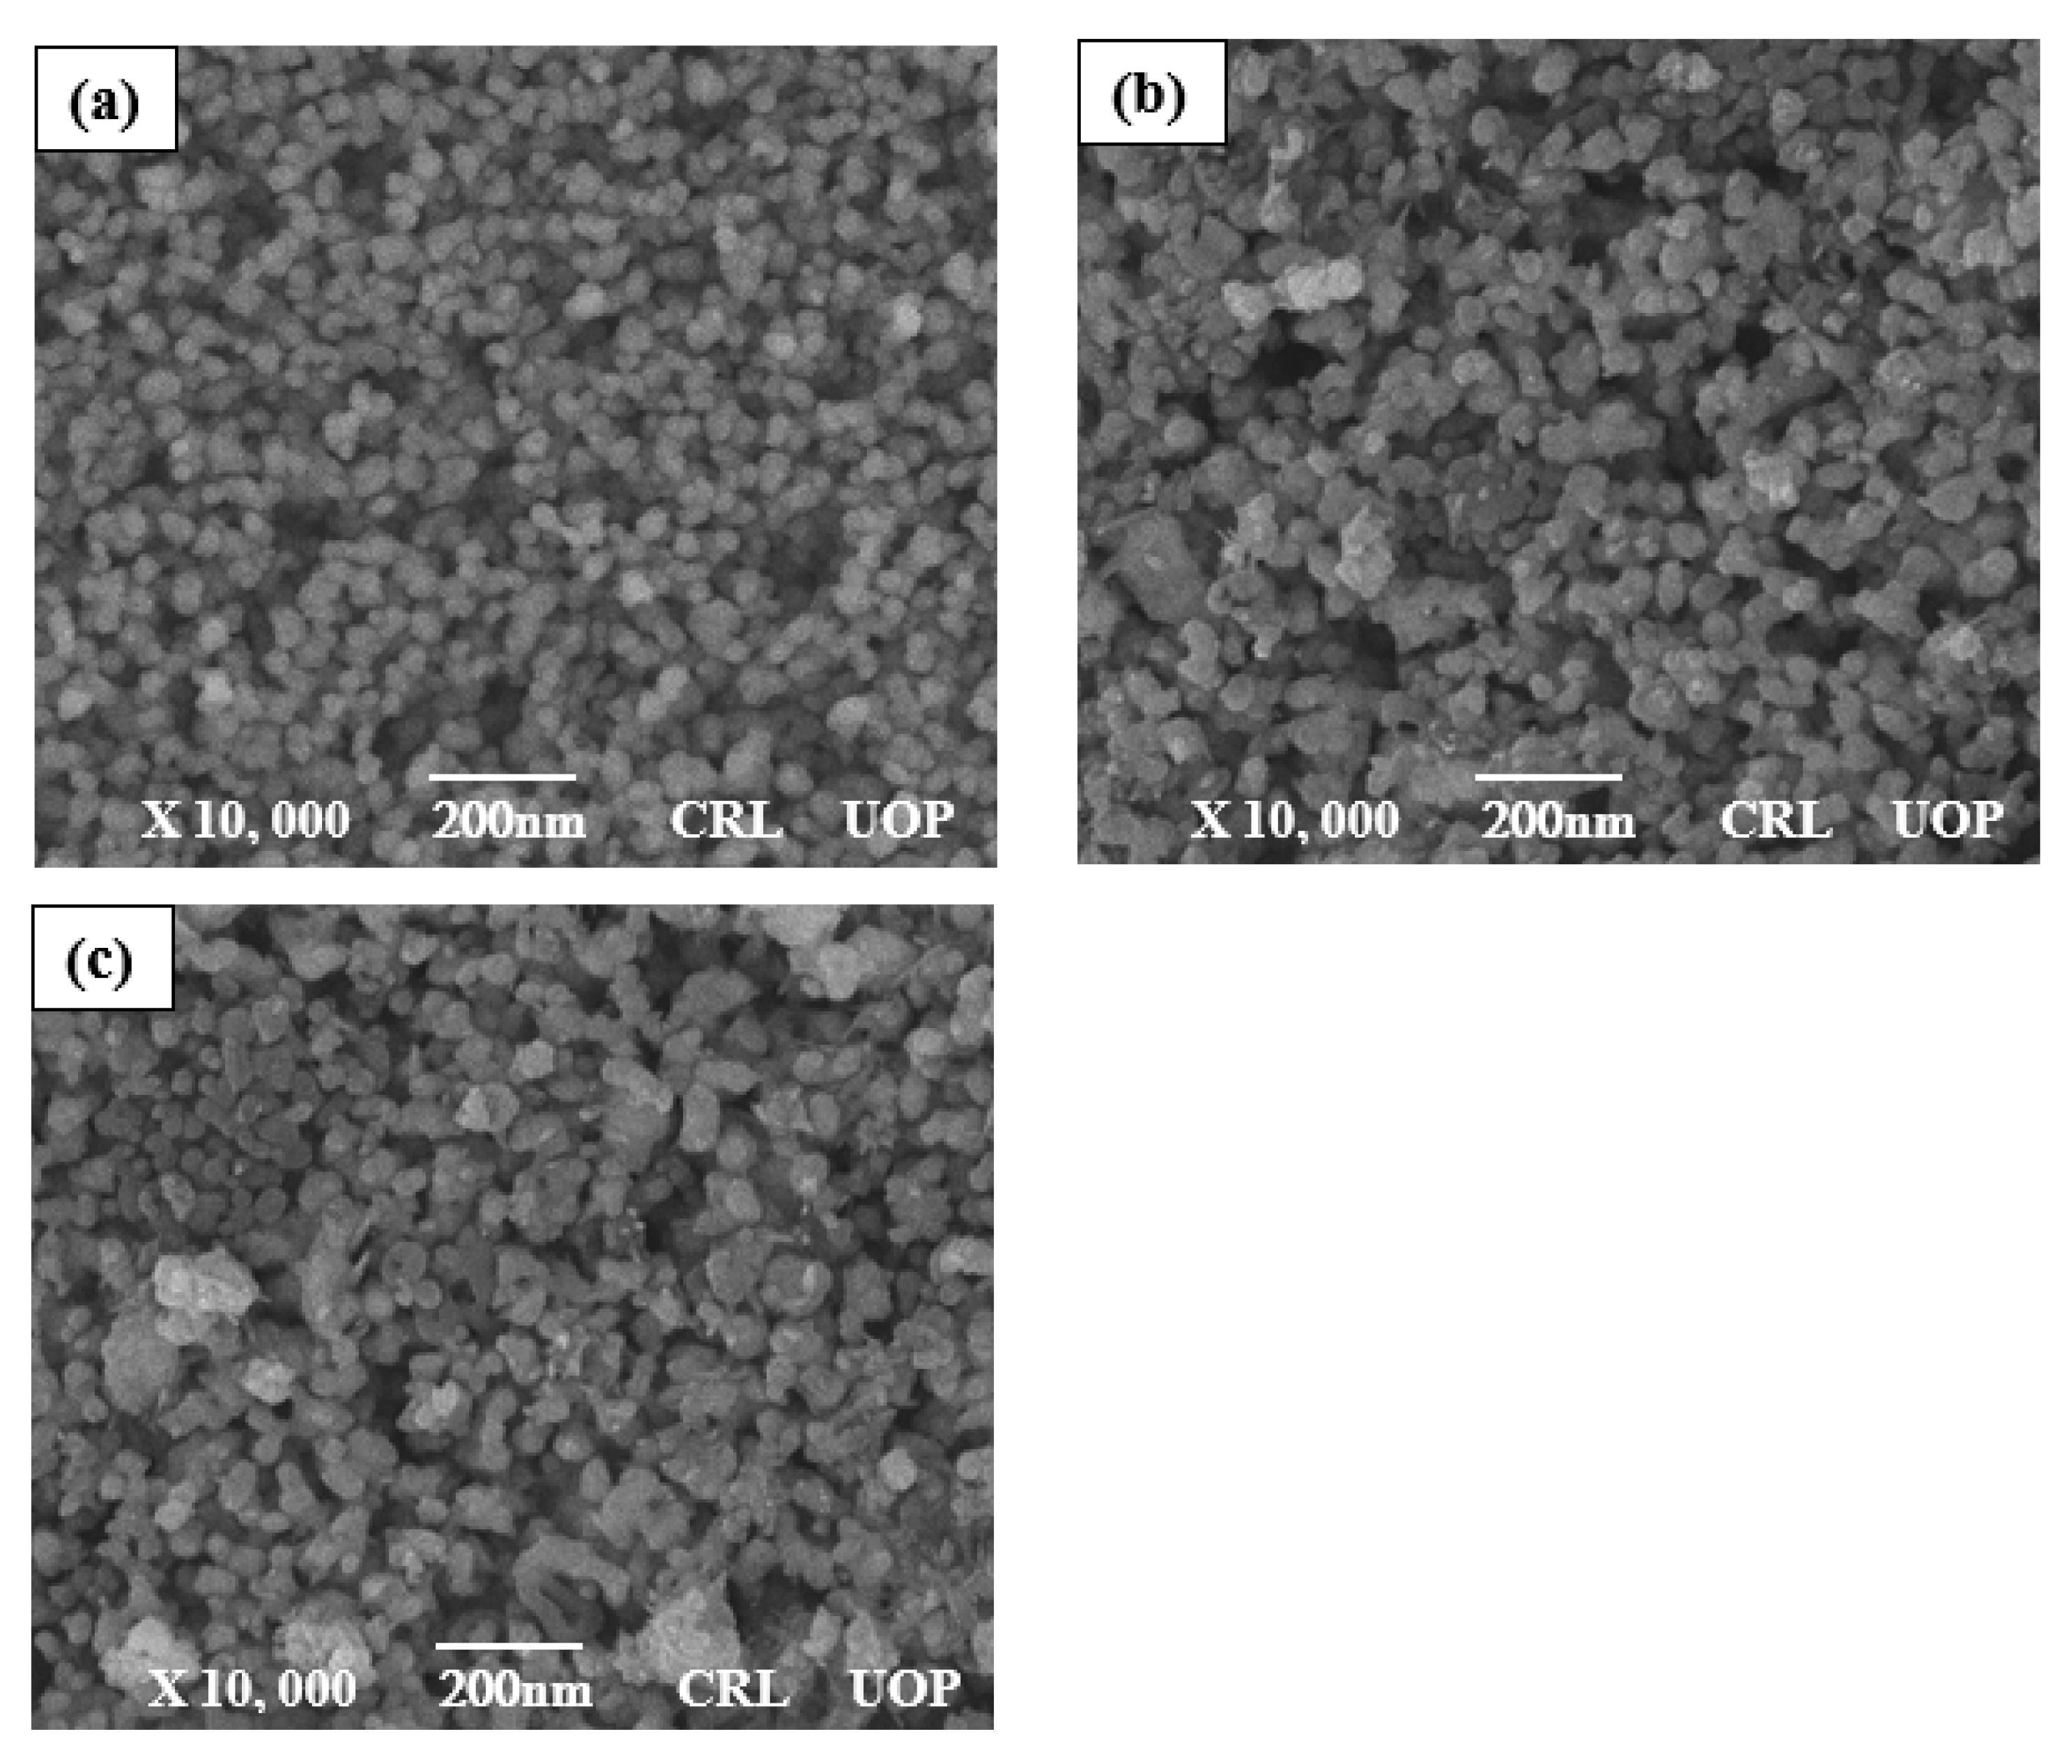
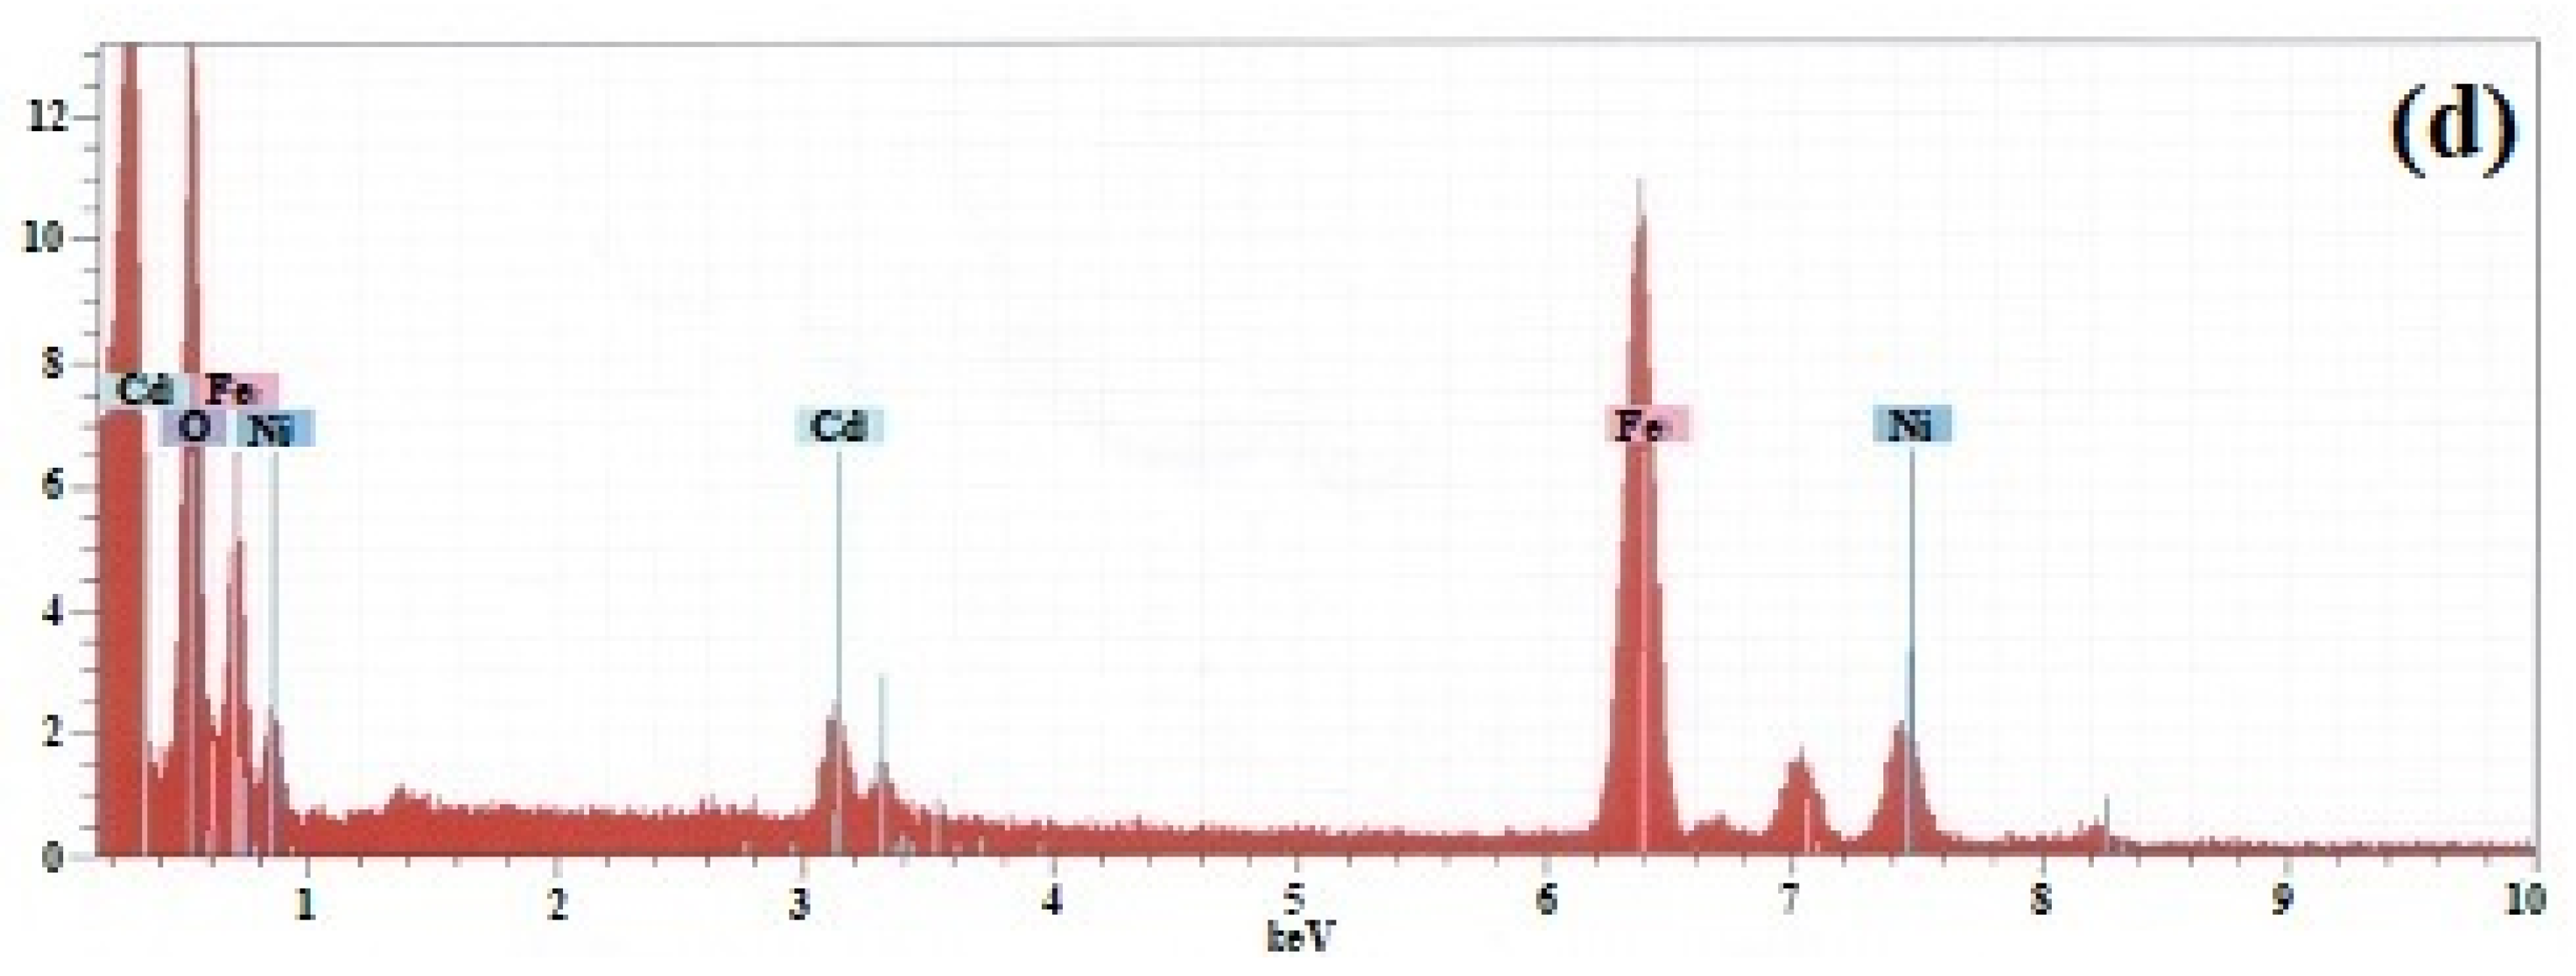
3.2. Morphological Investigations
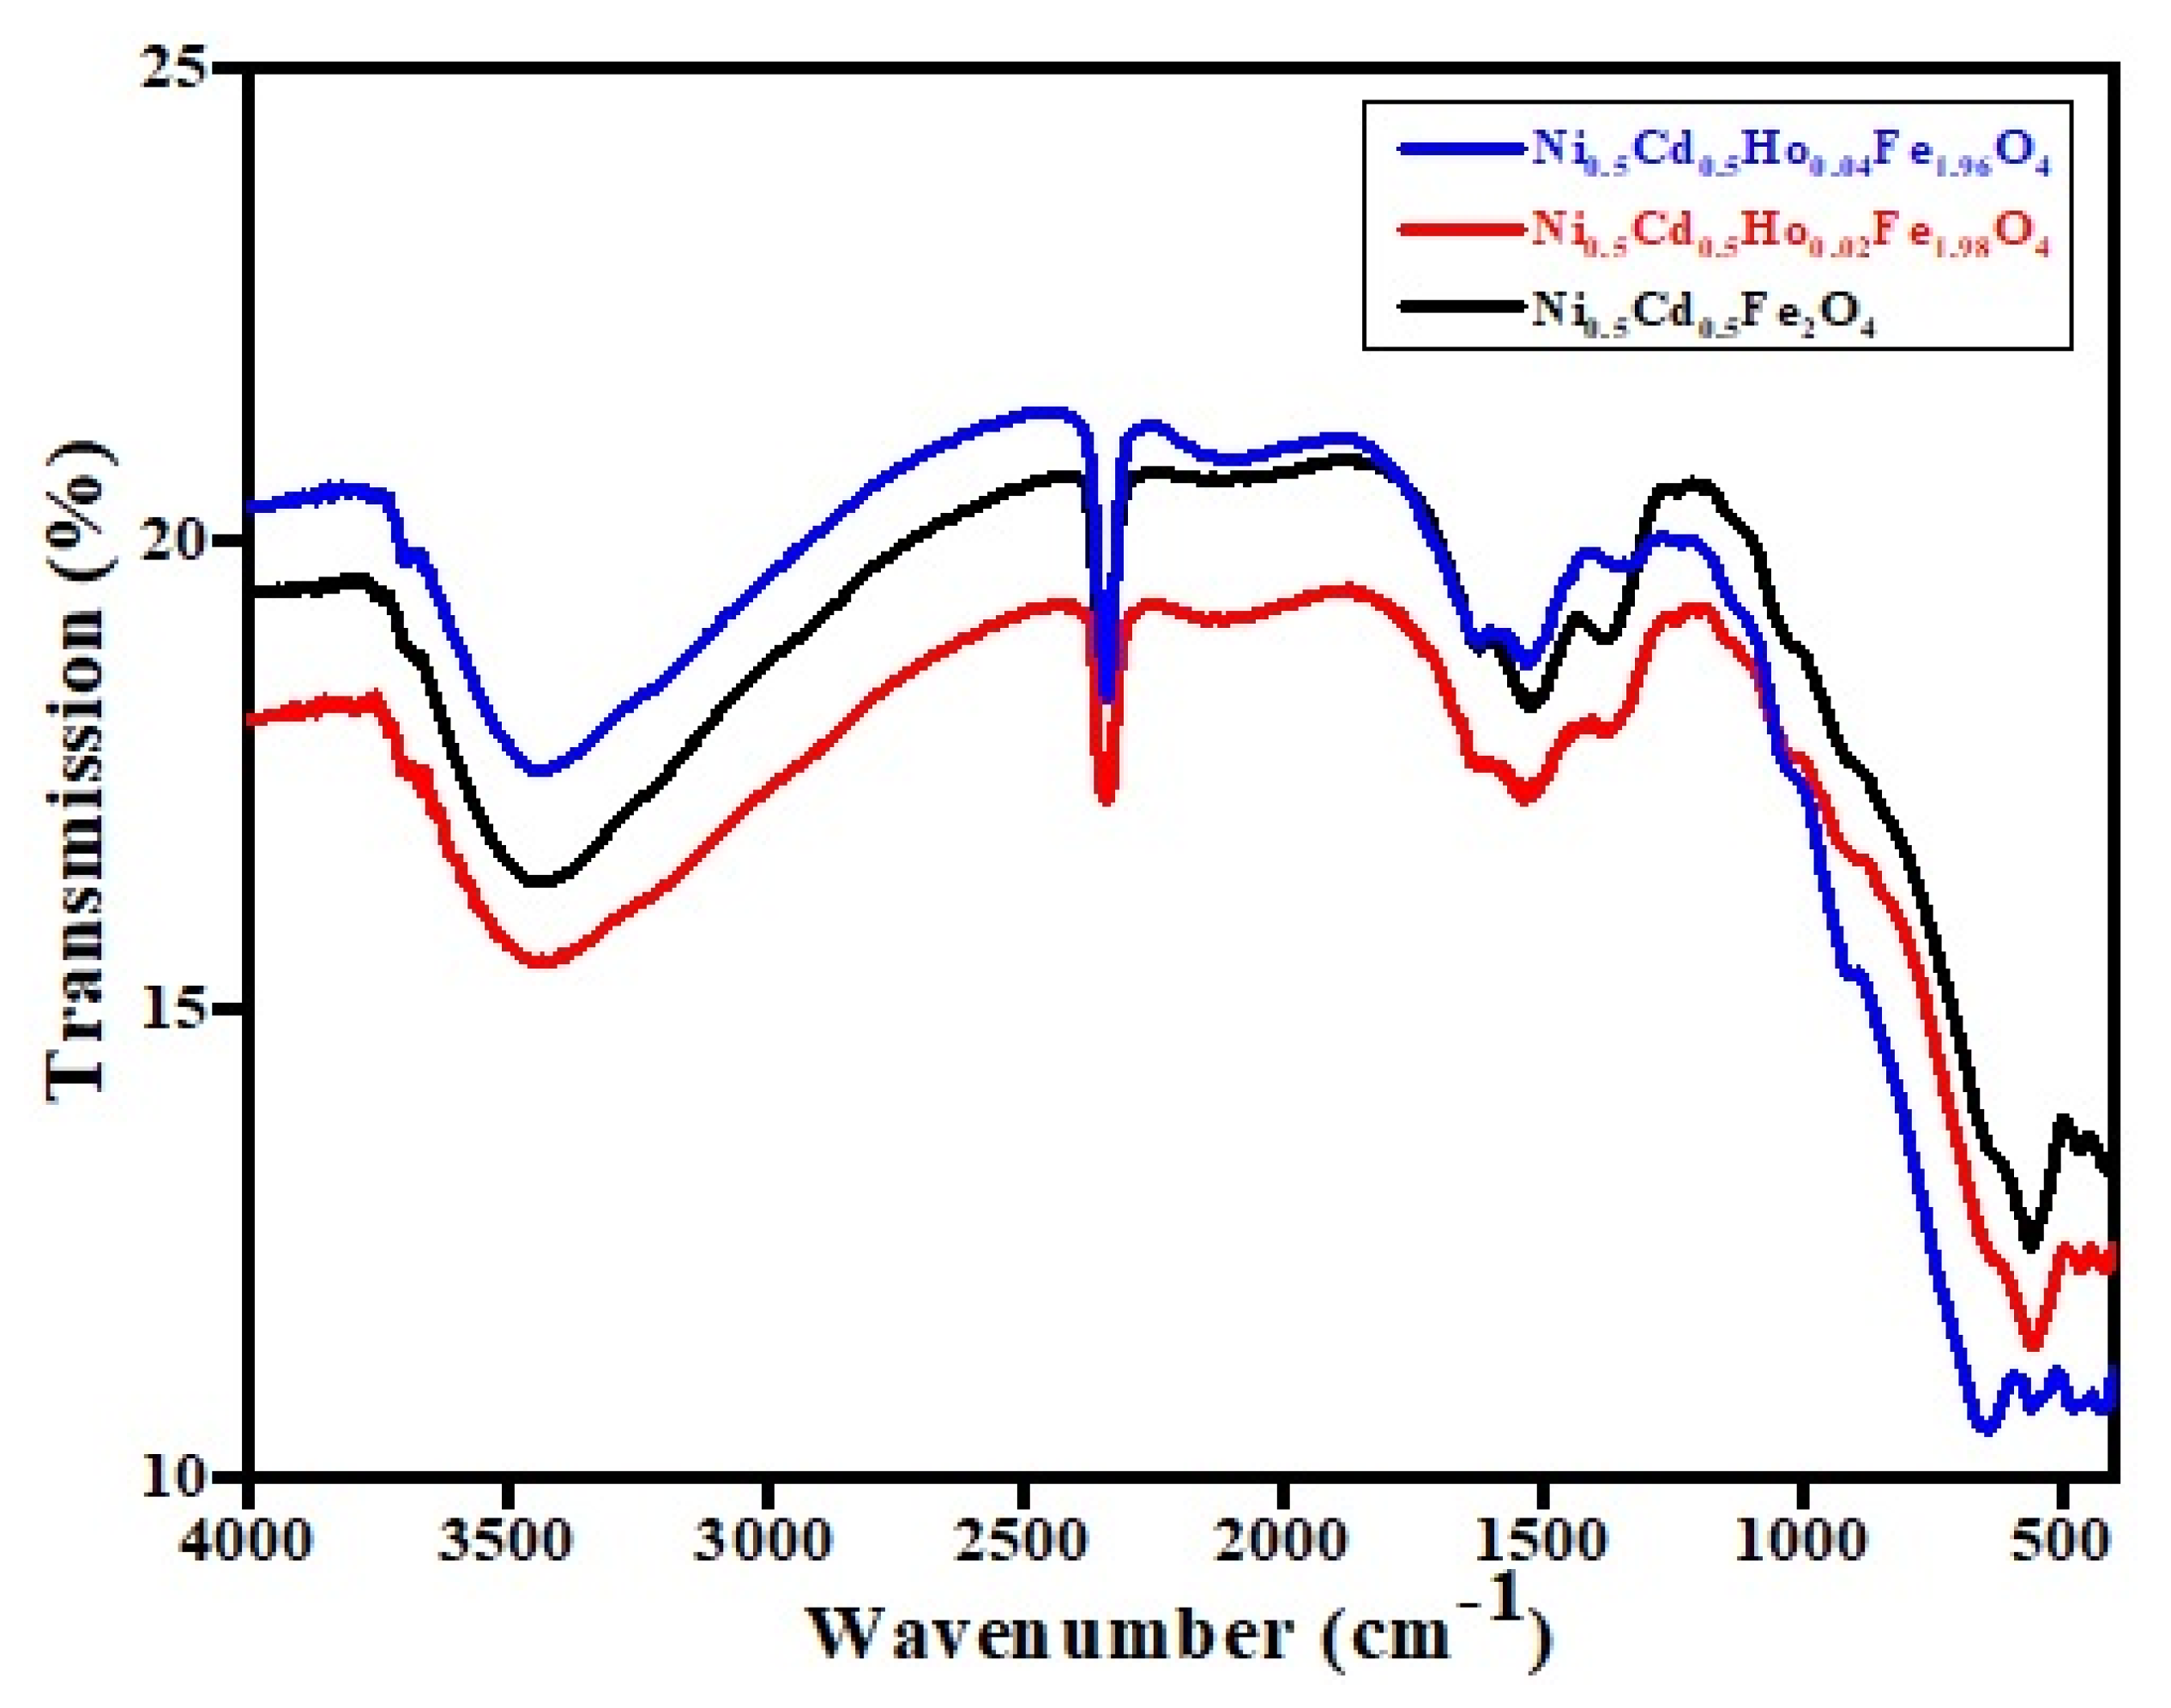
SEM images were analyzed to examine the surface morphology along with the grain size of the nanopowders and help in understanding the growth of the grain sizes. Figure 2 shows the SEM images of the Ni0.5Cd0.5HoxFe2-xO4 (X = 0, 0.02, and 0.04) nanoparticles sintered at 700 °C. SEM micrographs demonstrate the samples’ porosity, regularity in shape, and uneven grain size variations where particles formed large clusters. The small agglomerations in the samples were seen with non-uniform distribution. It was also found that the grain size decreased with the increasing of the Ho3+ content. The lowest average grain size and maximum homogeneity was observed at x = 0.0. The average grain sizes measured by IMAGEJ (developed by National Institutes of Health (NIH), USA) for the Ni0.5Cd0.5HoxFe2-xO4 nanoparticles with x = 0, 0.02, and 0.04 were 54.47, 57.31, and 58.76 nm, respectively (See Table 2). According to the literature, the nucleation and grain development processes that take place during synthesis affect the size and form of crystallites in compounds [41,42]. Figure 2d shows the elemental compositions of the synthesized Ni0.5Cd0.5HoxFe2-xO4 (x = 0, 0.02, and 0.04) nanoparticles.

3.3. FT-IR Study

The unidentified material, quality, and components of the samples were discovered via FTIR analysis. The spectrum of the nickel-cadmium ferrites is shown in Figure 3 and ranged from 400 to 4000 cm−1. The mass of the metal cations and the strength of the connection between the metal cations and oxygen determine the frequency at which absorption occurs. In the spectrum, the band between 400 and 600 cm−1 is significant for ferrites. Spinel ferrite contains two absorption bands; the highest band is at 648 cm−1 and is referred to as the intrinsic stretching vibration of the metal ion at the tetrahedral site [43,44]. The lowest band is at 557 cm−1 and is referred to as the octahedral metal stretching vibration. Peaks in the nickel-cadmium ferrites were somewhat moved toward the lowest range of wavelength by adding more holmium to the mixture. The addition of holmium caused the dispersion of Fe3+ from the B- to the A-site.

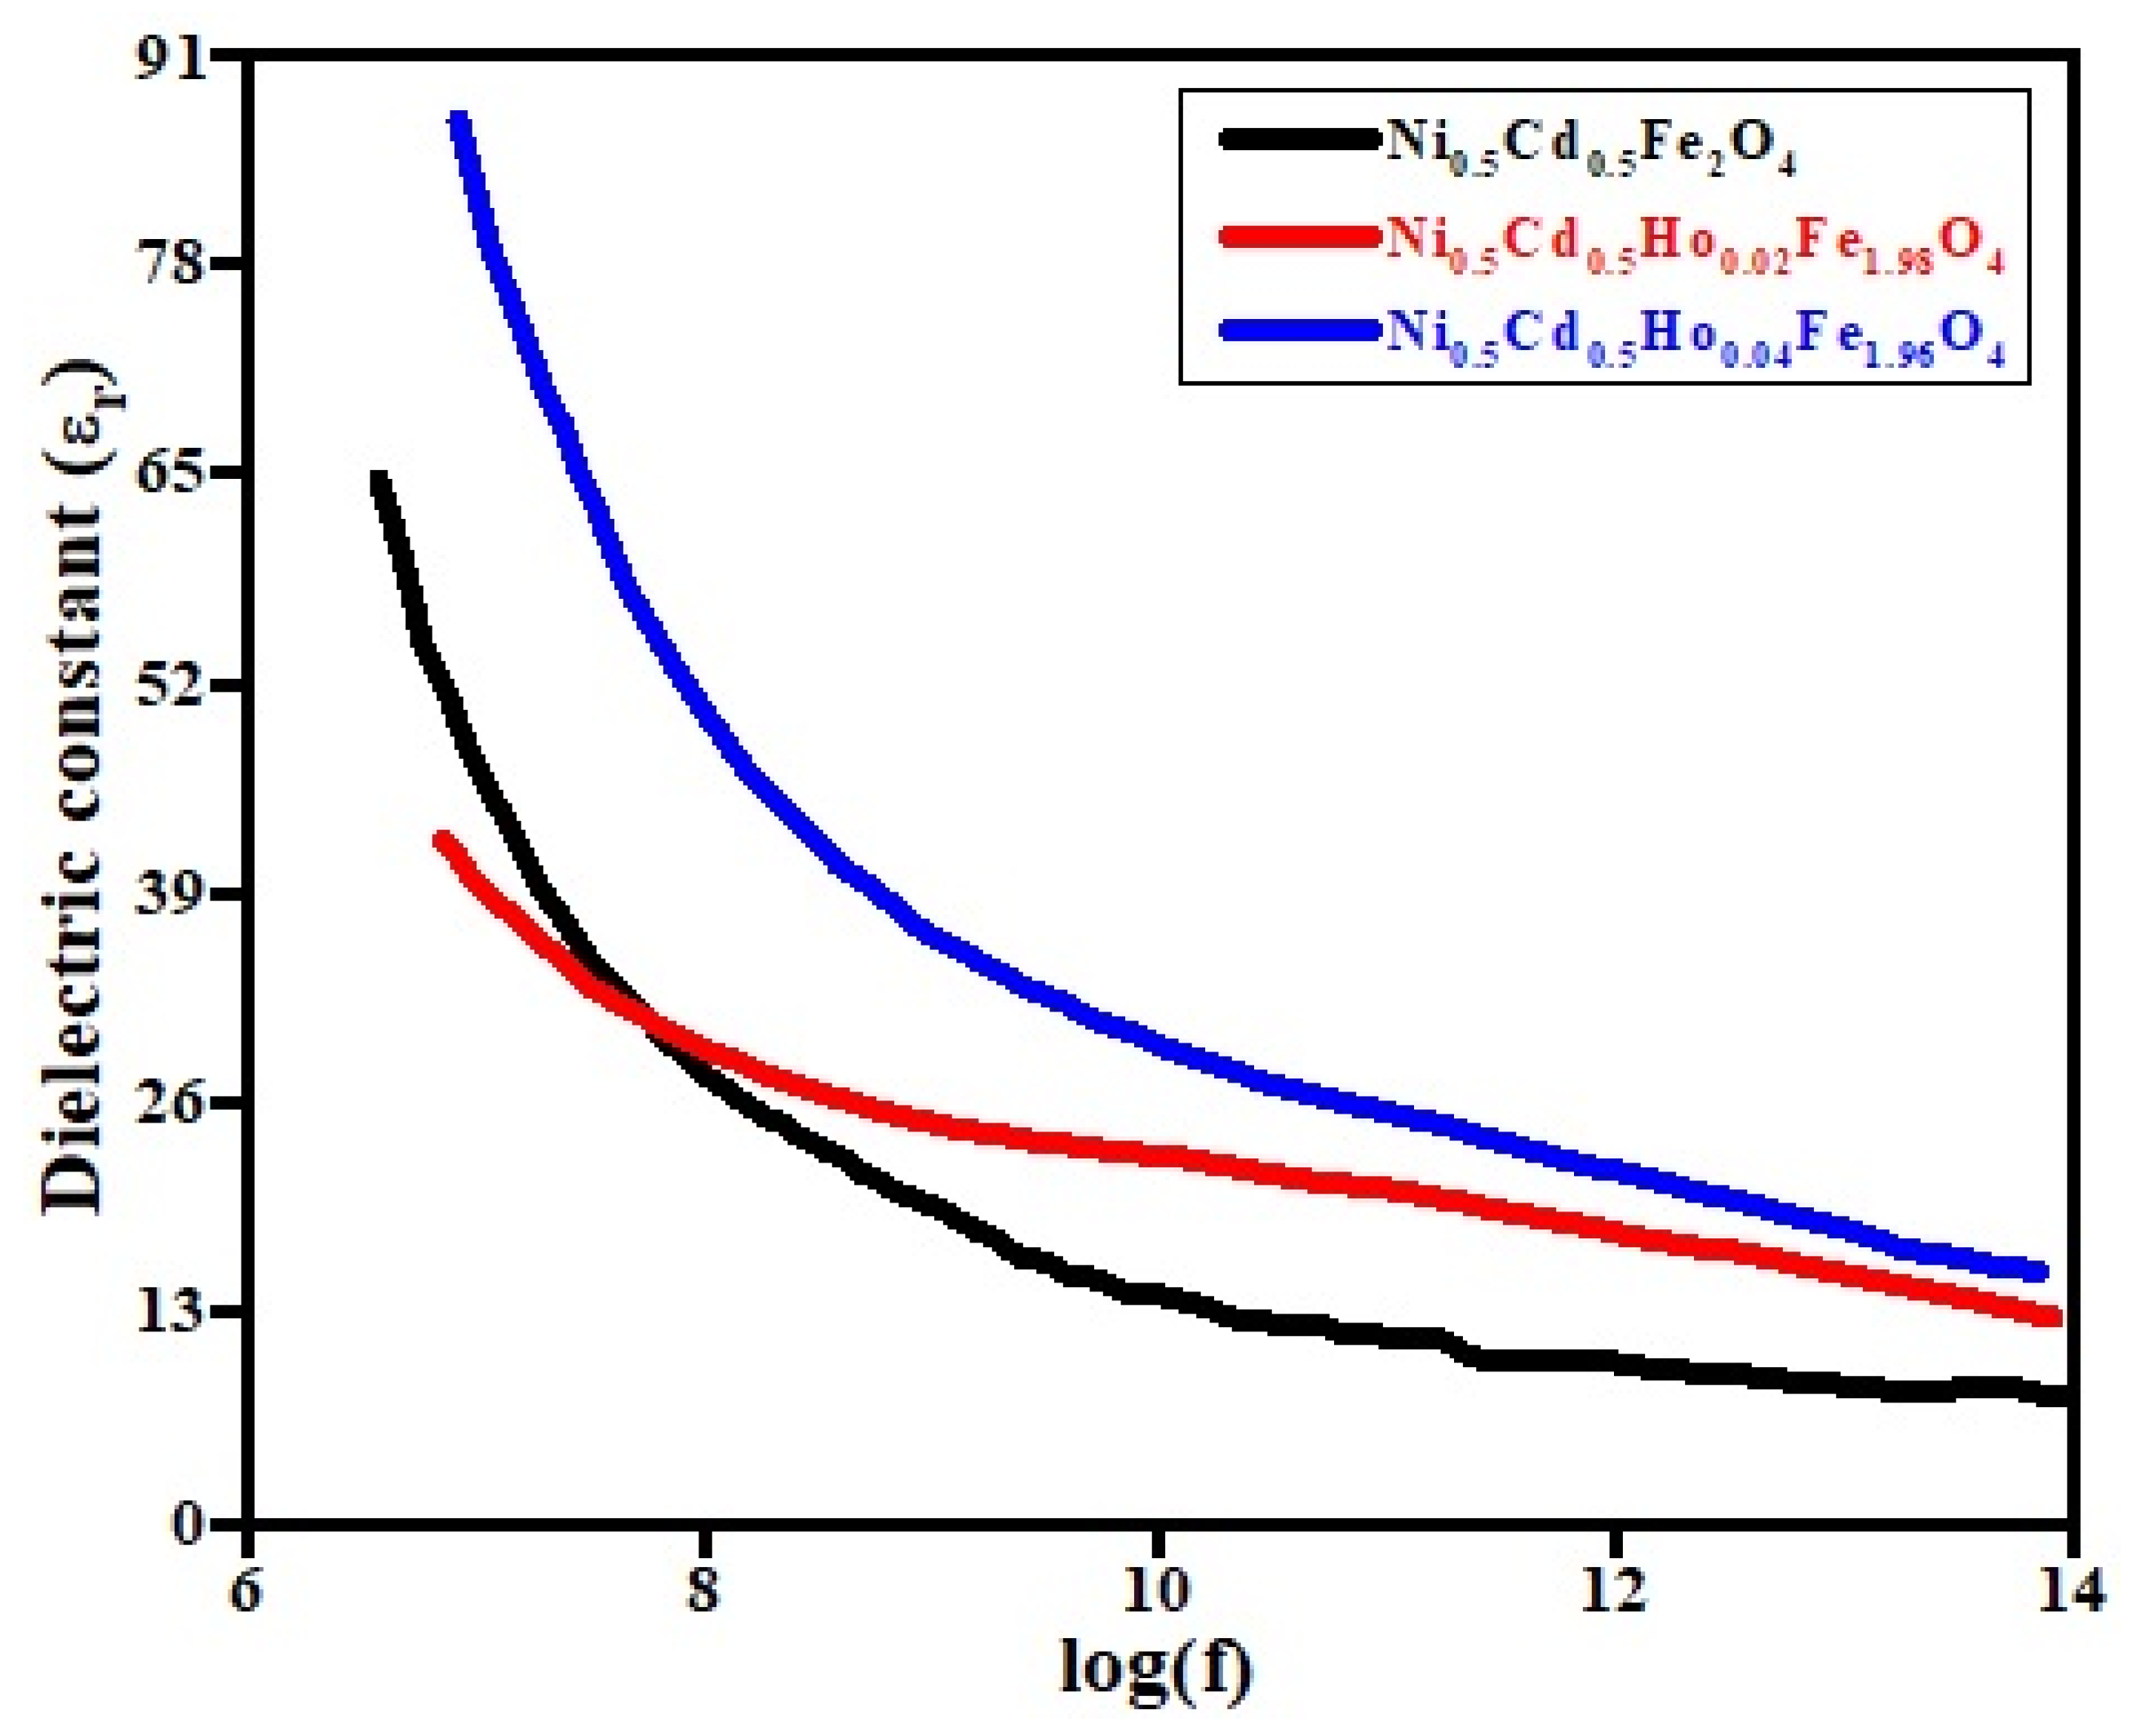
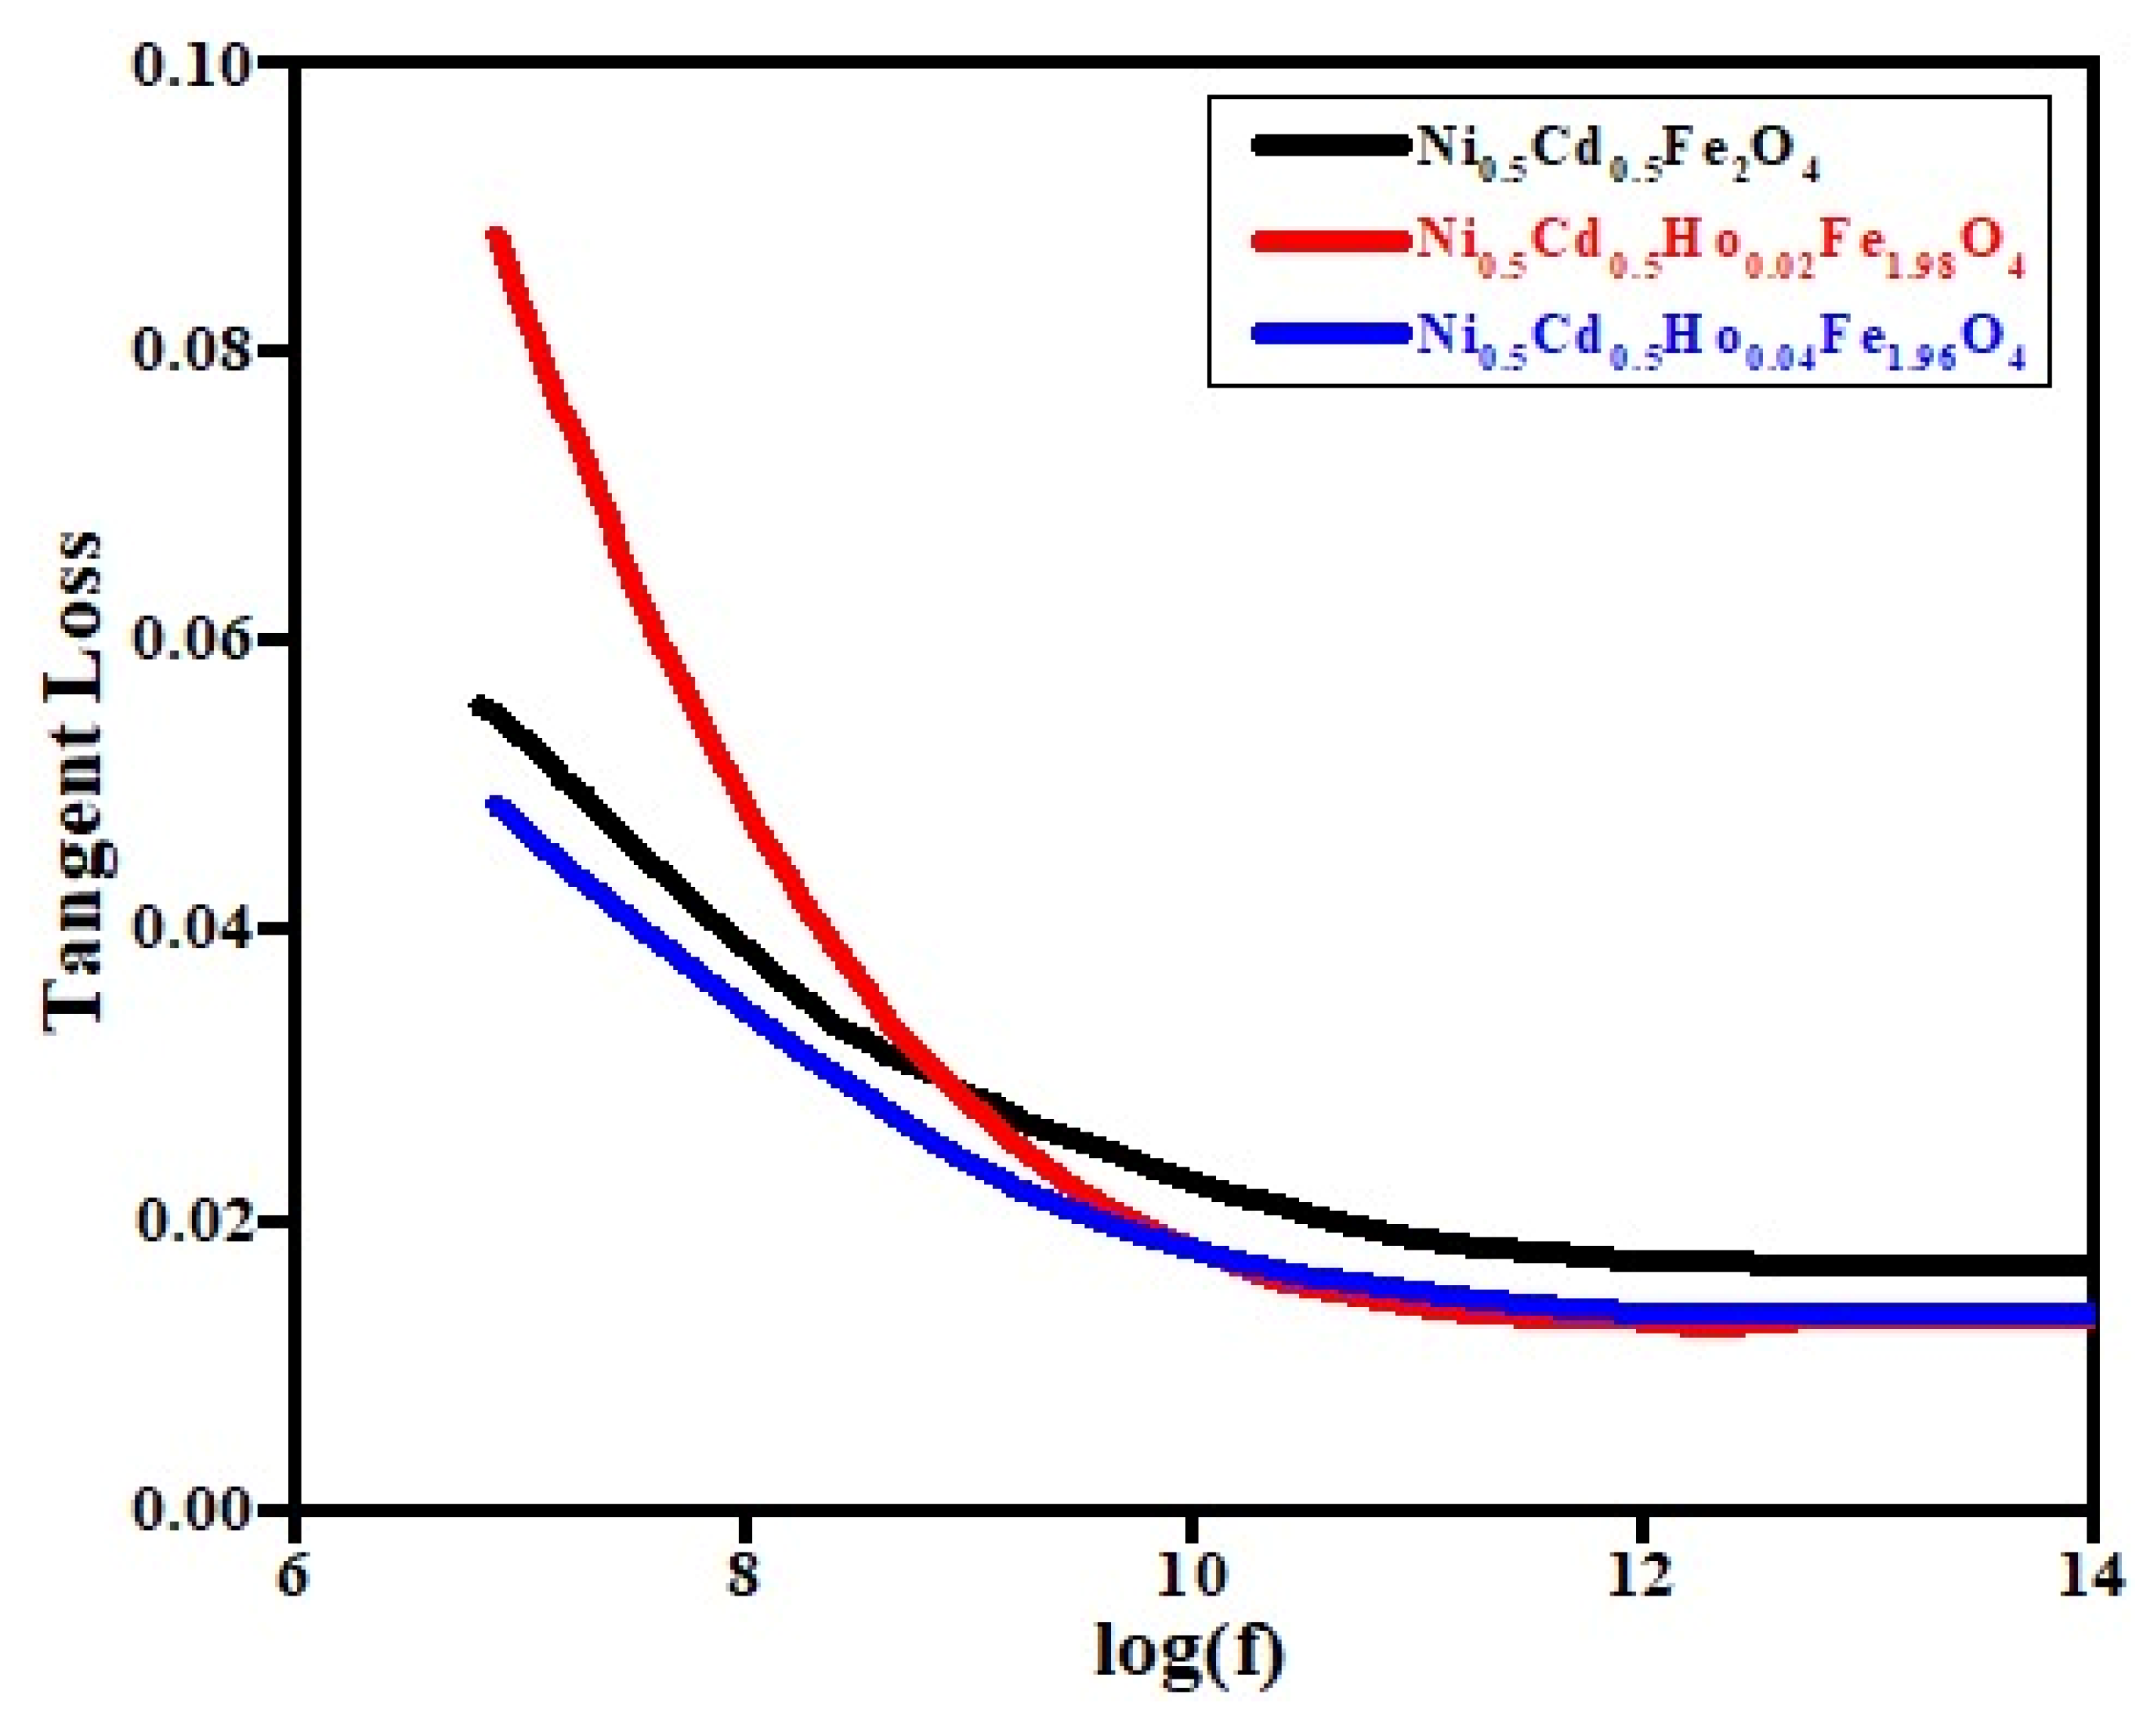
3.4. Dielectric Properties

Utilizing the parallel equivalent capacitance that can be measured with an LCR meter at frequencies between 1 KHz and 2 MHz, the dielectric constant and tangent loss were determined. Ferrite nanoparticles’ dielectric characteristics are influenced by a number of variables, including composition, production method, grain size, etc. These variables provided details regarding the prepared sample’s dielectric properties.
The below formulae were adopted to determine various parameters using the parallel equivalent capacitance (Cp) measurement, including the dielectric constant (ε′) and dielectric loss (tanδ) [45].
E   = C p × d A × E 0
t a n δ   = E E
A is the sample’s surface area, d is the thickness of the pellet, and εo is the vacuum permittivity. Figure 4 demonstrates the dielectric constant variation with frequency of the produced samples. This typical trend is observed in ferrites. The dielectric constant is highest for the lowest values of frequency and dramatically decreases with the rising frequency before becoming constant and giving no response to the applied frequency. At the grain boundaries, space charge polarization accumulates in the low-frequency region, and the dielectric constant is large. Polarization is used to study the decreasing dielectric constant trend, which shows if a material is polar or conductive. As the frequency rises, the polarization declines. Space charge polarization is used to describe the trend in the dielectric constant [46]. Polarization is caused by the displacement of the electron in the direction of the applied field as a result of the electron exchange between Fe2+ and Fe3+. Due to the fact that the frequency of electronic exchange cannot follow the frequency of the alternating field, polarization decreases. In other words, the polarizability is frequently behind the external field. Due to the dominance of species such as Fe2+, the dielectric constant values at lower frequencies are larger at the grain border due to interface dislocation.
Figure 5 illustrates how tangent loss (tan) varies with frequency. The graph demonstrates that tangent loss reduces with frequency. This phenomenon is explained by the Maxwell–Wagner model and Koop’s hypothesis, which hold true for higher frequencies [47,48]. Electron and charge defect dipole hoops cause ferrites to lose their dielectric properties. At lower frequencies, electron hopping occurs, whereas at higher frequencies, dielectric loss is caused by charge defect dipoles. When the applied AC frequency matches the frequency of the exchange of electrons between Fe2+ and Fe3+, polarization occurs [49]. Dielectric loss continues as a result of structural impurities.

4. Conclusions

As a general formula for nickel-cadmium ferrites doped with holmium, sol-gel auto-combustion was used to prepare Ni0.5Cd0.5HoxFe2-xO4 (X = 0, 0.02, and 0.04). X-ray diffraction, scanning electron microscopy, Fourier transform infrared spectroscopy, and an LCR meter were used to characterize the produced samples. The produced nanoparticles’ cubic spinel structure is visible in the XRD graph, and the Scherrer formula was used to determine the size of the crystals. The average particle size varied from 54.47 nm to 58.76 nm, with Ho content revealed by SEM micrographs. Dielectric characteristics, such as the relative permittivity and tangent loss, were examined in frequency ranges between 1 kHz and 2 MHz, and these characteristics varied depending on the holmium concentration. The highest concentration of doped material (at x = 0.04) yielded the highest value for the dielectric constant. Dielectric characteristics are caused by space charge polarization. The vibrational spectrum was seen by FTIR. The spectrum spanned 400 to 4000 cm−1. For ferrites, the 400–600 cm−1 band is crucial. When the holmium concentration was increased, the peaks of the produced nanoparticles with reported structural and physical features were moved toward the lowest wavelength. These nanoparticles are employed for energy storage and microwave absorption applications.

Author Contributions

This work was carried out in collaboration among all authors. Methodology, Z.A.; formal analysis, A.M.A. and M.A.; writing—original draft preparation, D.A., A.A. (Asad Ali) and A.Z.; writing—review and editing, A.Z., V.T., M.R.S., N.A.M.K. and A.A. (Ali Algahtani). All authors have read and agreed to the published version of the manuscript.

Funding

The authors appreciate the support given by the Universiti Kebangsaan Malaysia for the operational and financial support to this project under Project Codes RHB-UKM-2021-002. The authors extend their appreciation to the Deanship of Scientific Research at King Khalid University Abha 61421, Asir, Kingdom of Saudi Arabia for funding this work through the Small Groups Project under grant number RGP.1/123/43. Princess Nourah bint Abdulrahman University Researchers Supporting Project number (PNURSP2023R65), Princess Nourah bint Abdulrahman University, Riyadh, Saudi Arabia.

Data Availability Statement

Generated data should be publicly available and cited in accordance with journal guidelines.

Conflicts of Interest

The authors have no conflict of interest.

References

  1. Khan, I.; Saeed, K.; Khan, I. Nanoparticles: Properties, applications and toxicities. Arab. J. Chem. 2019, 12, 908–931. [Google Scholar] [CrossRef]
  2. Pokropivny, V.V.; Skorokhod, V.V. Classification of nanostructures by dimensionality and concept of surface forms engineering in nanomaterial science. Mater. Sci. Eng. C 2007, 27, 990–993. [Google Scholar] [CrossRef]
  3. Sabri, N.G. The outermembrane proteins profile of Salmonella enterica serotypes Enteritidis, Muenster, Florian, Omuna and Noya and their dendrogram analysis. Int. J. Adv. Res. 2013, 2, 182–187. [Google Scholar]
  4. Atiq, S.; Majeed, M.; Ahmad, A.; Abbaas, S.K.; Saleem, M.; Riaz, S.; Naseem, S. Synthesis and investigation of structural, morphological, magnetic, dielectric and impedance spectroscopic characteristics of Ni-Zn ferrite nanoparticles. Ceram. Int. 2017, 43, 2486–2494. [Google Scholar] [CrossRef]
  5. Agayev, F.G.; Trukhanov, S.V.; Trukhanov, A.V.; Jabarov, S.H.; Ayyubova, G.S.; Mirzayev, M.N.; Trukhanov, A.V.; Kozlovskiy, A.L.; Zdorovets, M.V.; Sombra, A.S.B.; et al. Study of structural features and thermal properties of barium hexaferrite upon indium doping. J. Therm. Anal. Calor. 2022, 147, 14107–14114. [Google Scholar] [CrossRef]
  6. Ditta, A.; Khan, M.A.; Junaid, M.; Khalil, R.M.A.; Warsi, M.F. Structural, magnetic and spectral properties of Gd and Dy codoped dielectrically modified Co-Ni (Ni0.4Co0.6Fe2O4) ferrites. Phys. B 2017, 507, 27–34. [Google Scholar] [CrossRef]
  7. Zdorovets, M.V.; Kozlovskiy, A.L.; Shlimas, D.I.; Borgekov, D.B. Phase transformations in FeCo–Fe2CoO4/Co3O4-spinel nanostructures as a result of thermal annealing and their practical application. J. Mater. Sci. Mater. Electron. 2021, 32, 16694–16705. [Google Scholar] [CrossRef]
  8. Jalaiah, K.; Babu, K.V. Structural, magnetic and electrical properties of nickel doped Mn-Zn spinel ferrite synthesized by sol-gel method. J. Magn. Magn. Mater. 2017, 423, 275–280. [Google Scholar] [CrossRef]
  9. Heiba, Z.K.; Mohamed, M.B.; Hamdeh, H.H.; Ahmed, M.A. Structural analysis and cations distribution of nanocrystalline Ni1−xZnxFe1.7Ga0.3O4. J. Alloys Compd. 2015, 618, 755–760. [Google Scholar] [CrossRef]
  10. Raghunathan, A.; Melikhov, Y.; Snyder, J.E.; Jiles, D.C. Generalized form of anhysteretic magnetization function for Jiles–Atherton theory of hysteresis. Appl. Phys. Lett. 2009, 95, 172510. [Google Scholar] [CrossRef]
  11. Al-Zahrani, S.A.; Manikandan, A.; Thanrasu, K.; Dinesh, A.; Raja, K.K.; Almessiere, M.A.; Slimani, Y.; Baykal, A.; Bhuminathan, S.; Jayesh, S.R.; et al. Influence of Ce3+ on the Structural, Morphological, Magnetic, Photocatalytic and Antibacterial Properties of Spinel MnFe2O4 Nanocrystallites Prepared by the Combustion Route. Crystals 2022, 12, 268. [Google Scholar] [CrossRef]
  12. Venkatasubramanian, R.; Srivastava, R.S.; Misra, R.D.K. Comparative study of antimicrobial and photocatalytic activity in titania encapsulated composite nanoparticles with different dopants. Mater. Sci. Technol. 2008, 24, 589–595. [Google Scholar] [CrossRef]
  13. Joshi, H.M.; Lin, Y.P.; Aslam, M.; Prasad, P.V.; Schultz-Sikma, E.A.; Edelman, R.; Dravid, V.P. Effects of shape and size of cobalt ferrite nanostructures on their MRI contrast and thermal activation. J. Phys. Chem. C 2009, 113, 17761–17767. [Google Scholar] [CrossRef] [Green Version]
  14. Wu, H.; Liu, G.; Wang, X.; Zhang, J.; Chen, Y.; Shi, J.; Yang, S. Solvothermal synthesis of cobalt ferrite nanoparticles loaded on multiwalled carbon nanotubes for magnetic resonance imaging and drug delivery. Acta Biomater. 2011, 7, 3496–3504. [Google Scholar] [CrossRef]
  15. Reddy, C.G.; Manorama, S.V.; Rao, V.J. Preparation and characterization of ferrites as gas sensor materials. J. Mater. Sci. Lett. 2000, 19, 775–778. [Google Scholar] [CrossRef]
  16. Lou, J.-C.; Huang, Y.-J.; Han, J.-Y. Treatment of printed circuit board industrial wastewater by Ferrite process combined with Fenton method. J. Hazard. Mater. 2009, 170, 620–626. [Google Scholar] [CrossRef]
  17. Valenzuela, R. Magnetic Ceramics; Cambridge University Press: Cambridge, UK, 2005; Volume 4. [Google Scholar]
  18. Muhammad, F.; Tahir, M.; Zeb, M.; Kalasad, M.N.; Mohd Said, S.; Sarker, M.R.; Sarker, M.R.; Ali, S.H.M. Synergistic enhancement in the microelectronic properties of poly-(dioctylfluorene) based Schottky devices by CdSe quantum dots. Sci. Rep. 2020, 10, 4828. [Google Scholar] [CrossRef] [PubMed] [Green Version]
  19. Lin, J.; He, Y.; Du, X.; Lin, Q.; Yang, H.; Shen, H. Structural and magnetic studies of Cr3+ substituted nickel ferrite nanomaterials prepared by sol-gel auto-combustion. Crystals 2018, 8, 384. [Google Scholar] [CrossRef] [Green Version]
  20. Bieńkowski, A.; Szewczyc, R. The possibility of utilizing the high permeability magnetic materials in construction of magneto elastic stress and force sensors. Sens. Act. A 2004, 113, 270–276. [Google Scholar] [CrossRef]
  21. Zhang, G.; Li, C.; Cheng, F.; Chen, J. ZnFe2O4 tubes: Synthesis and application to gas sensors with high sensitivity and low-energy consumption. Sens. Act. B 2007, 120, 403–410. [Google Scholar] [CrossRef]
  22. Zeb, M.; Tahir, M.; Muhammad, F.; Mohd Said, S.; Mohd Sabri, M.F.; Sarker, M.R.; Ali, S.H.M.; Wahab, F. Amplified spontaneous emission and optical gain in organic single crystal quinquethiophene. Crystals 2019, 9, 609. [Google Scholar] [CrossRef] [Green Version]
  23. Kim, Y.H.; Hashi, S.; Ishiyama, K.; Arai, K.I.; Inoue, M. Remote temperature sensing system using reverberated magnetic flux . IEEE Trans. Magn. 2000, 36, 3643–3645. [Google Scholar] [CrossRef]
  24. Osada, H.; Chiba, S.; Oka, H.; Hatafuku, H.; Tayama, N.; Seki, K. Non-contact magnetic temperature sensor for biochemical applications. J. Magn. Magn. Mater. 2004, 272–276, 1761–1762. [Google Scholar] [CrossRef]
  25. Spaldin, N.A.; Fiebig, M. The renaissance of magnetoelectric multiferroics. Science 2005, 309, 391–392. [Google Scholar] [CrossRef]
  26. Petrila, I.; Tudorache, F. The influence of Li+ and K+ added cations and annealing temperature on the magnetic and dielectric properties of Mg-Zn ferrite. Materials 2021, 14, 4916. [Google Scholar] [CrossRef] [PubMed]
  27. Shelar, M.; Jadhav, P.; Chougule, S.; Mallapur, M.; Chougule, B. Structural and electrical properties of nickel cadmium ferrites prepared. J. Alloy. Compd. 2009, 476, 760–764. [Google Scholar] [CrossRef]
  28. Patange, S.; Shirsath, S.; Toksha, B.; Jadhav, S.; Jadhav, K. Electrical and magnetic properties of Cr3+ substituted nanocrystalline nickel ferrite. J. Appl. Phys. 2009, 106, 023914. [Google Scholar] [CrossRef]
  29. Shinde, T.; Gadkari, A.; Vasambekar, P. Influence of Nd3+ substitution on structural, electrical and magnetic properties of nonocrystalline nickel ferrties. J. Alloy. Compd. 2012, 513, 80–85. [Google Scholar] [CrossRef]
  30. Almessiere, M.A.; Slimani, Y.; Algarou, N.A.; Vakhitov, M.G.; Klygach, D.S.; Baykal, A.; Zubar, T.I.; Trukhanov, S.A.; Trukhanov, A.V.; Attia, H. Tuning the Structure, Magnetic, and High Frequency Properties of Sc-Doped Sr0.5Ba0.5ScxFe12-xO19/NiFe2O4 Hard/Soft Nanocomposites. Adv. Electron. Mater. 2022, 8, 2101124. [Google Scholar] [CrossRef]
  31. Amiri, A.; Ghaemi, F. Solid-phase extraction of non-steroidal anti-inflammatory drugs in human plasma and water samples using sol-gel-based metal-organic framework coating. J. Chromatogr. A 2021, 1648, 462168. [Google Scholar] [CrossRef]
  32. Kozlovskiy, A.L.; Shlimas, D.I.; Zdorovets, M.V. Synthesis, structural properties and shielding efficiency of glasses based on TeO2-(1-x)ZnO-xSm2O3. J. Mater. Sci. Mater. Electron. 2021, 32, 12111–12120. [Google Scholar] [CrossRef]
  33. Kadyrzhanov, K.K.; Shlimas, D.I.; Kozlovskiy, A.L.; Zdorovets, M.V. Research of the shielding effect and radiation resistance of composite CuBi2O4 films as well as their practical applications. J. Mater. Sci. Mater. Electron. 2020, 31, 11729–11740. [Google Scholar] [CrossRef]
  34. El-Shater, R.E.; El Shimy, H.; Saafan, S.A.; Darwish, M.A.; Zhou, D.; Trukhanov, A.V.; Trukhanov, S.V.; Fakhry, F. Synthesis, characterization, and magnetic properties of Mn nanoferrites. J. Alloy. Compd. 2022, 928, 166954. [Google Scholar] [CrossRef]
  35. Fatah, A.F.; Mohamad, A.A.; Muchtar, A.; Hamid, N.A. Physical characterization of LSCF-CuO via enhanced modified sol-gel method for intermediate temperature Solid oxide Fuel Cells (IT-SOFCs). Mater. Today Proc. 2021, 46, 2052–2057. [Google Scholar] [CrossRef]
  36. Pujar, P.; Pal, A.; Mandal, S. Combustion aided in situ consolidation of high strength porous ceramic structures with a minimum thermal budget. Mater. Lett. 2020, 265, 127410. [Google Scholar] [CrossRef]
  37. Jamil, N.H.J.; Zainuddin, Z.; Jumali, M.H.H.; Izzuddin, I.; Nadzir, L. Tetragonal tungsten bronze phase potential in increasing the piezoelectricity of sol-gel synthesized (K0.5Na0.5)1-xLixNbO3 ceramics. Ceram. Int. 2022, 48, 9324–9329. [Google Scholar] [CrossRef]
  38. Peng, Z.; Fu, X.; Ge, H.; Fu, Z.; Wang, C.; Qi, L.; Miao, H. Effect of Pr3+ doping on magnetic and dielectric properties of Ni–Zn ferrites by one-step synthesis. J. Magn. Magn. Mater. 2011, 323, 2513–2518. [Google Scholar] [CrossRef]
  39. Xiang, J.; Shen, X.; Zhu, Y. Effects of Ce3+ doping on the structure and magnetic properties of Mn-Zn ferrite fibers. Rare Met. 2009, 28, 151–155. [Google Scholar] [CrossRef]
  40. Al-Senani, G.M.; Al-Fawzan, F.F.; Almufarij, R.S.; Abd-Elkader, O.H.; Deraz, N.M. Biosynthesis, Physicochemical and Magnetic Properties of Inverse Spinel Nickel Ferrite System. Crystals 2022, 12, 1542. [Google Scholar] [CrossRef]
  41. Patil, K.C. Chemistry of Nanocrystalline Oxide Materials: Combustion Synthesis, Properties and Applications; World Scientific: Singapore, 2008. [Google Scholar]
  42. Pujar, P.; Gupta, B.; Sengupta, P.; Gupta, D.; Mandal, S. Sodium ion incorporated alumina-A versatile anisotropic ceramic. J. Eur. Ceram. Soc. 2019, 39, 4473–4486. [Google Scholar] [CrossRef]
  43. Ali, A.; Jameel, M.H.; Uddin, S.; Zaman, A.; Iqbal, Z.; Gul, Q.; Sultana, F.; Mushtaq, M.; Althubeiti, K.; Ullah, R. The Effect of Ca Dopant on the Electrical and Dielectric Properties of BaTi4O9 Sintered Ceramics. Materials 2021, 14, 5375. [Google Scholar] [CrossRef]
  44. Hamza, M.; ur Rehman, A.; Ali, I.; Asif, M.; Ahmad, M. Detailed analysis of lanthanum impact on structural, morphological and magnetic properties of manganese spinel ferrites (MnLaxFe2-xO4 x = (0.0, 0.1, 0.2) synthesized through hydrothermal technique. J. Magn. Magn. Mater. 2022, 564, 169852. [Google Scholar] [CrossRef]
  45. Zeb, M.; Tahir, M.; Muhammad, F.; Gul, Z.; Wahab, F.; Sarker, M.R.; Ali, S.; Alamgeer; Ilyas, S.Z.; Ali, S. Pyrrol-Anthracene: Synthesis, Characterization and Its Application as Active Material in Humidity, Temperature and Light Sensors. Coatings 2022, 12, 848. [Google Scholar] [CrossRef]
  46. Abbas, M.; Ullah, R.; Ullah, K.; Sultana, F.; Mahmood, A.; Mateen, A.; Zhang, Y.; Ali, A.; Althubeiti, K.; Mushtaq, M.; et al. Structural, optical, electrical and dielectric properties of (Sr1-xMgx)(Sn0.5Ti0.5)O3(x = 0.00, 0.25, 0.50, 0.75) ceramics via solid state route. Ceram. Int. 2021, 47, 30129–30136. [Google Scholar] [CrossRef]
  47. Dubey, H.K.; Lahiri, P. The effect of dysprosium on nickel-cadmium spinel ferrites. Phase Trans. 2021, 94, 842–855. [Google Scholar] [CrossRef]
  48. Chethan, B.; Raj Prakash, H.G.; Vijayakumari, S.C.; Ravikiran, Y.T. Structural and electrical properties of nickel substituted cadmium ferrite. In AIP Conference Proceedings; AIP Publishing LLC: Melville, NY, USA, 2018; Volume 1953, p. 090028. [Google Scholar]
  49. Afzal, A.B.; Akhtar, M.J.; Nadeem, M.; Hassan, M.M. Investigation of structural and electrical properties of polyaniline/gold nanocomposites. J. Phys. Chem. C 2009, 113, 17560–17565. [Google Scholar] [CrossRef]
Figure 1. (a) XRD patterns of Ni0.5Cd0.5HoxFe2-xO4 (x = 0, 0.02, and 0.04). (b) zoomed view of (3 1 1) peak shifting toward the lower angle.
Crystals 13 00495 g001
Figure 2. The SEM micrographs of all the samples of Ni0.5Cd0.5HoxFe2-xO4 (x = 0, 0.02, and 0.04). (a) X = 0; (b) X = 0.02; (c) X = 0.04.; and (d) EDX spectrum.
Crystals 13 00495 g002aCrystals 13 00495 g002b
Figure 3. FTIR graph of samples of Ni0.5Cd0.5HoxFe2-xO4 (x = 0, 0.02, and 0.04).
Crystals 13 00495 g003
Figure 4. The dielectric constant vs. log(f) plot for Ni0.5Cd0.5HoxFe2-xO4 (x = 0, 0.02, and 0.04).
Crystals 13 00495 g004
Figure 5. Tangent loss vs. log(f) plot for Ni0.5Cd0.5HoxFe2-xO4 (x = 0, 0.02, and 0.04).
Crystals 13 00495 g005
Table 1. XRD parameters of Ni0.5Cd0.5HoxFe2-xO4 (x = 0, 0.02, and 0.04) ferrite samples.
Sample NameInterplanar Distance (d) ÅLattice Constant (a) (Å)Crystal Size
(D) (nm)
Volume
(Å)3
X-ray Density (ρ) (g/cm3)
Ni0.5Cd0.5Fe2O42.54338.435111600.165.7841
Ni0.5Cd0.5 Ho0.02Fe1.98O42.54188.430110599.095.8431
Ni0.5Cd0.5Ho0.04 Fe1.96O42.53628.411613595.165.8912
Table 2. Grain size obtained from SEM analysis for Ni0.5Cd0.5HoxFe2-xO4 (x = 0, 0.02, and 0.04) nanoparticles.
SampleGrain Size (nm)
Ni0.5Cd0.5Fe2O454.47
Ni0.5Cd0.5 Ho0.02 Fe1.98O457.31
Ni0.5Cd0.5Ho0.04 Fe1.96O458.76
Disclaimer/Publisher’s Note: The statements, opinions and data contained in all publications are solely those of the individual author(s) and contributor(s) and not of MDPI and/or the editor(s). MDPI and/or the editor(s) disclaim responsibility for any injury to people or property resulting from any ideas, methods, instructions or products referred to in the content.

