
Features of the Phase Preferences, Long- and Short-Range Order in Ln2(WO4)3 (Ln = Gd, Dy, Ho, Yb) with Their Relation to Hydration Behavior

 ,
,  , , , , , ,
  , ,
, ,
Abstract
:1. Introduction
2. Experimental
2.1. Synthesis
2.2. Characterization
3. Results and Discussion
3.1. ICP-AES Study
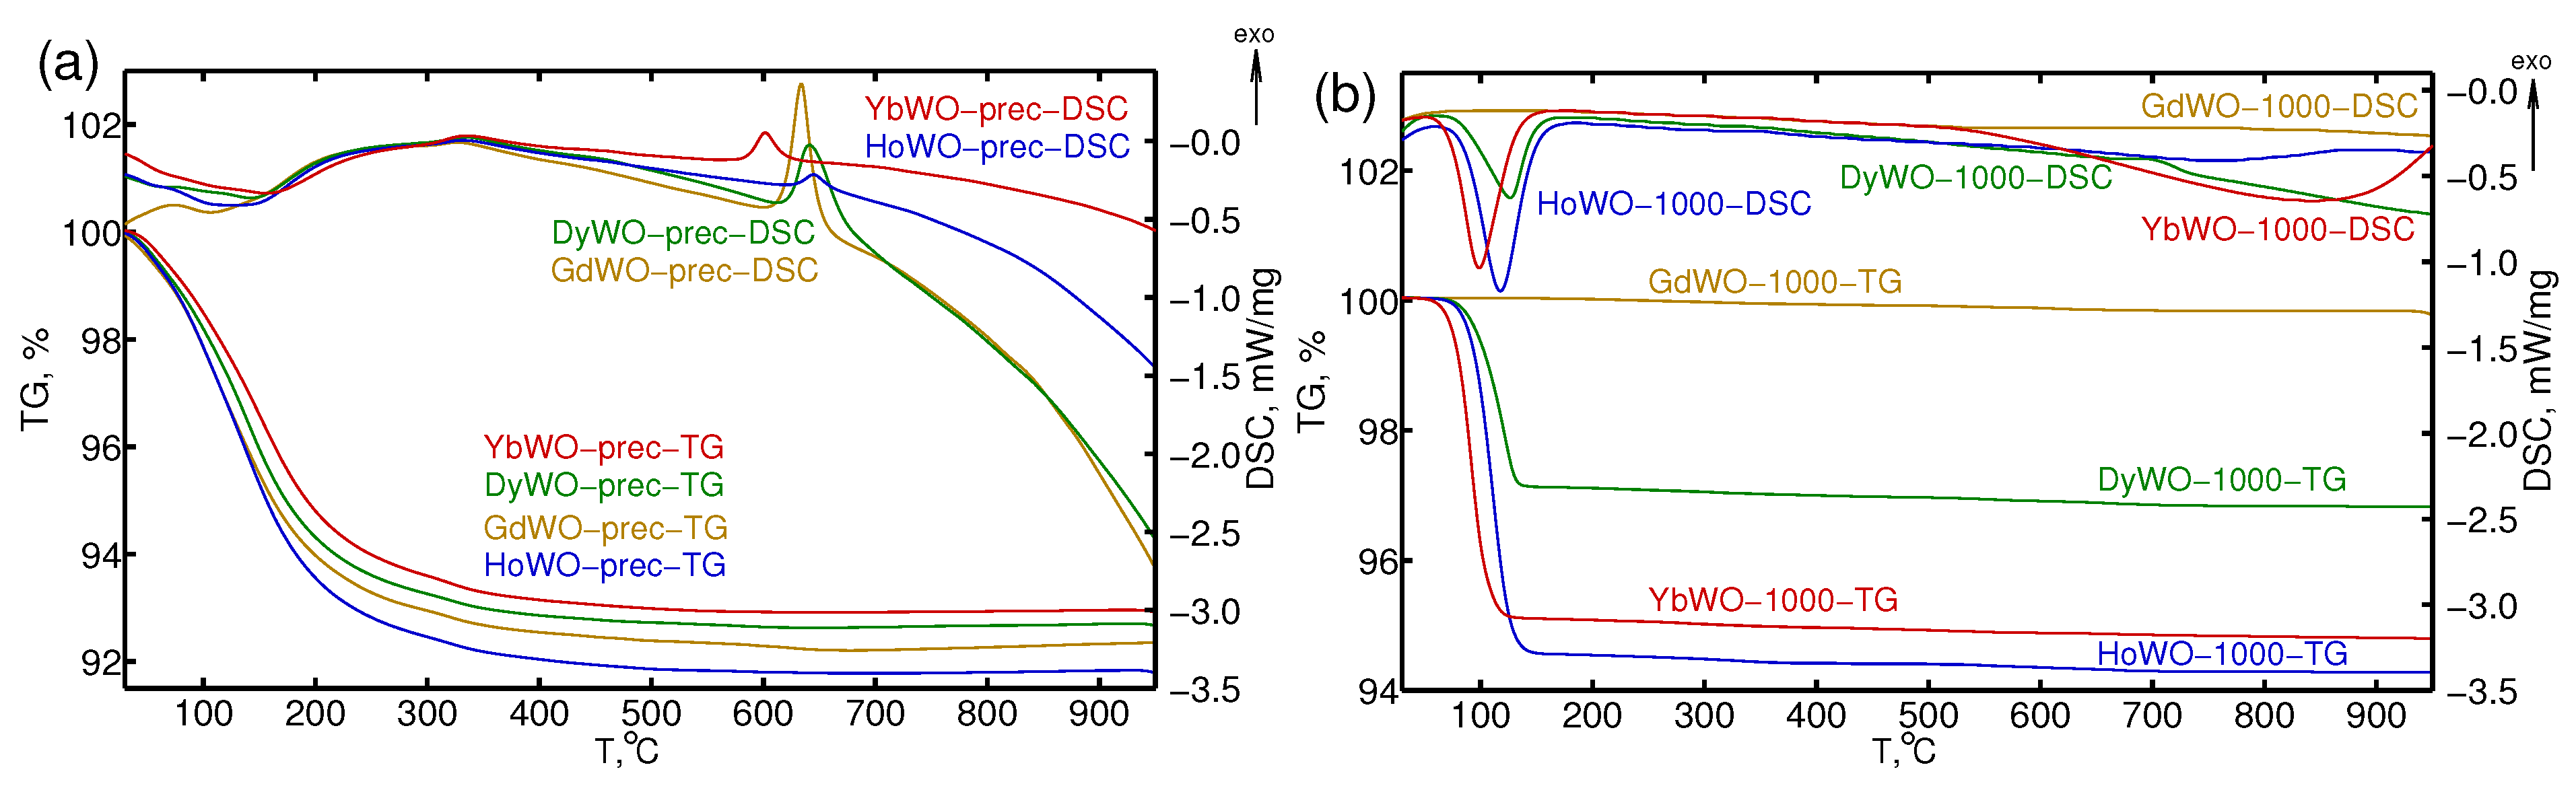
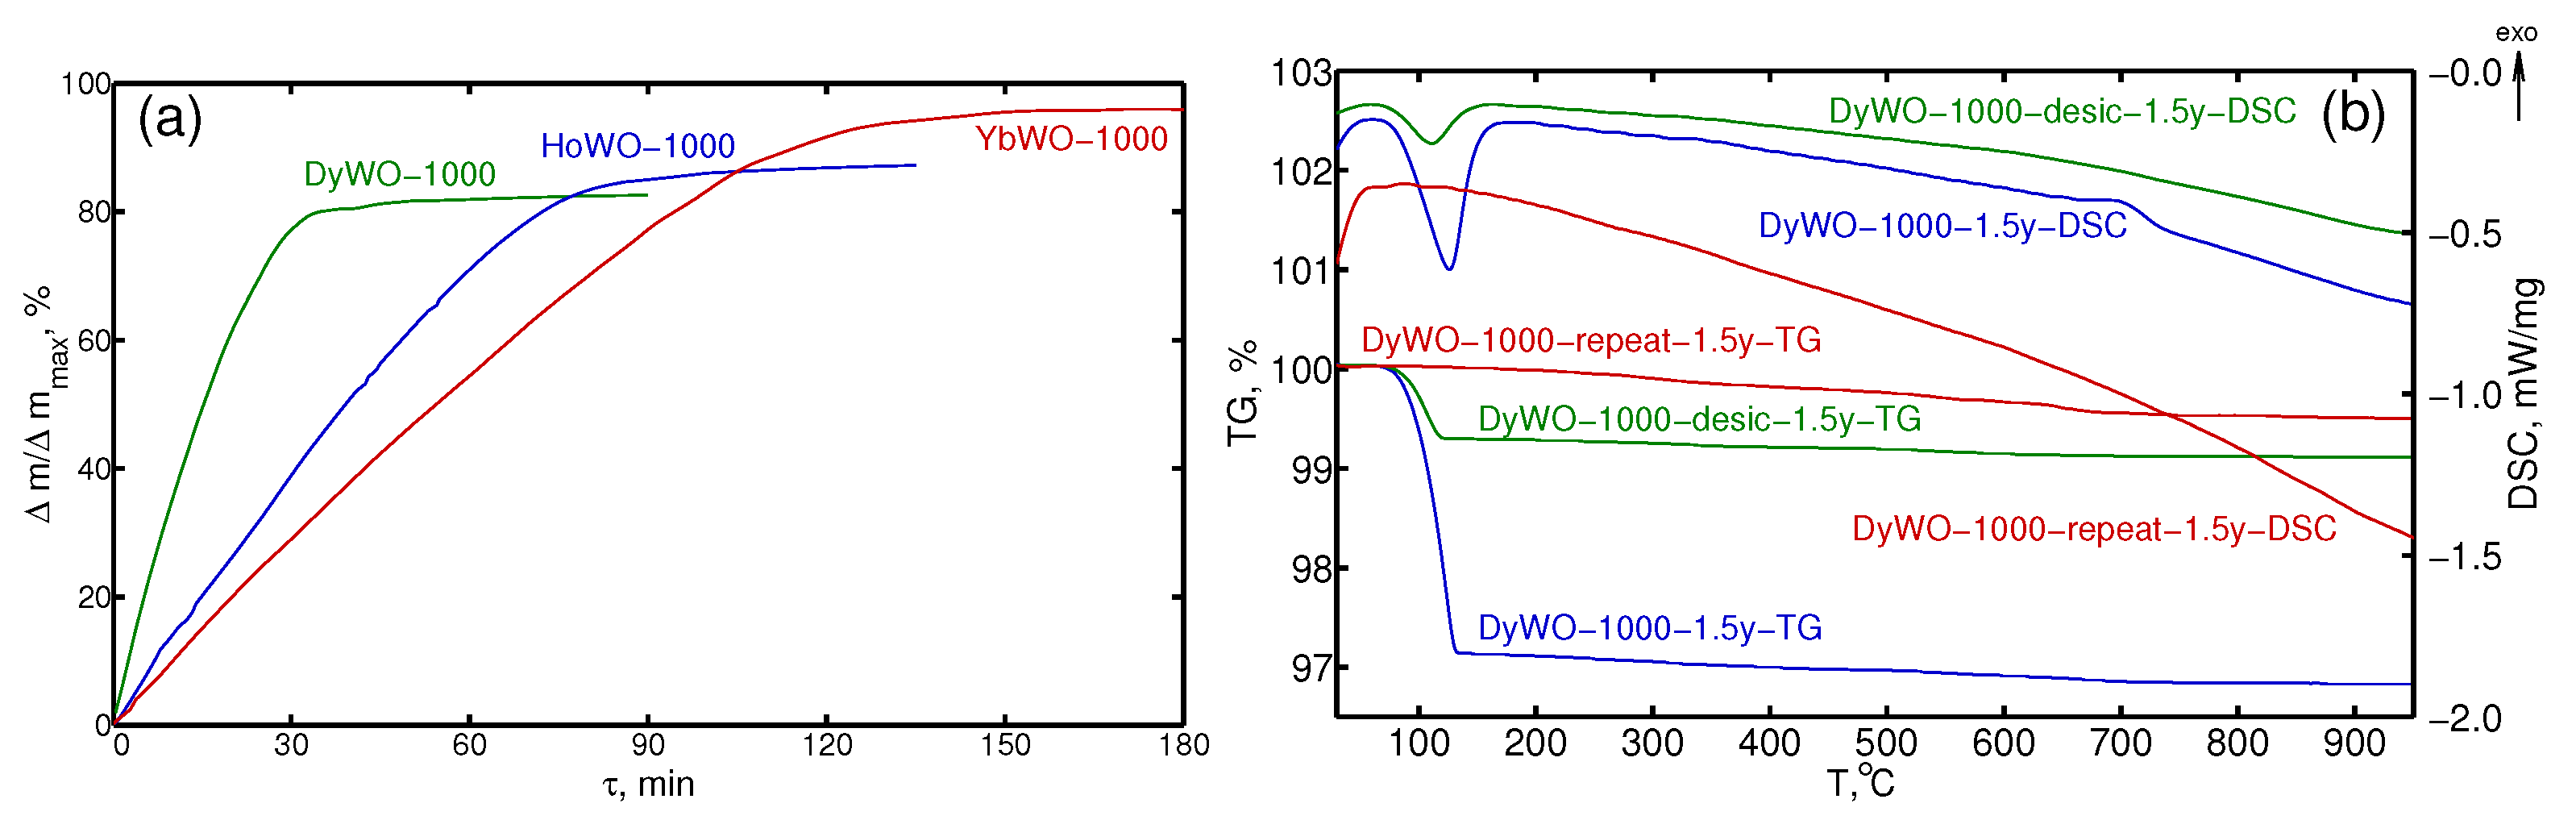
3.2. STA Study
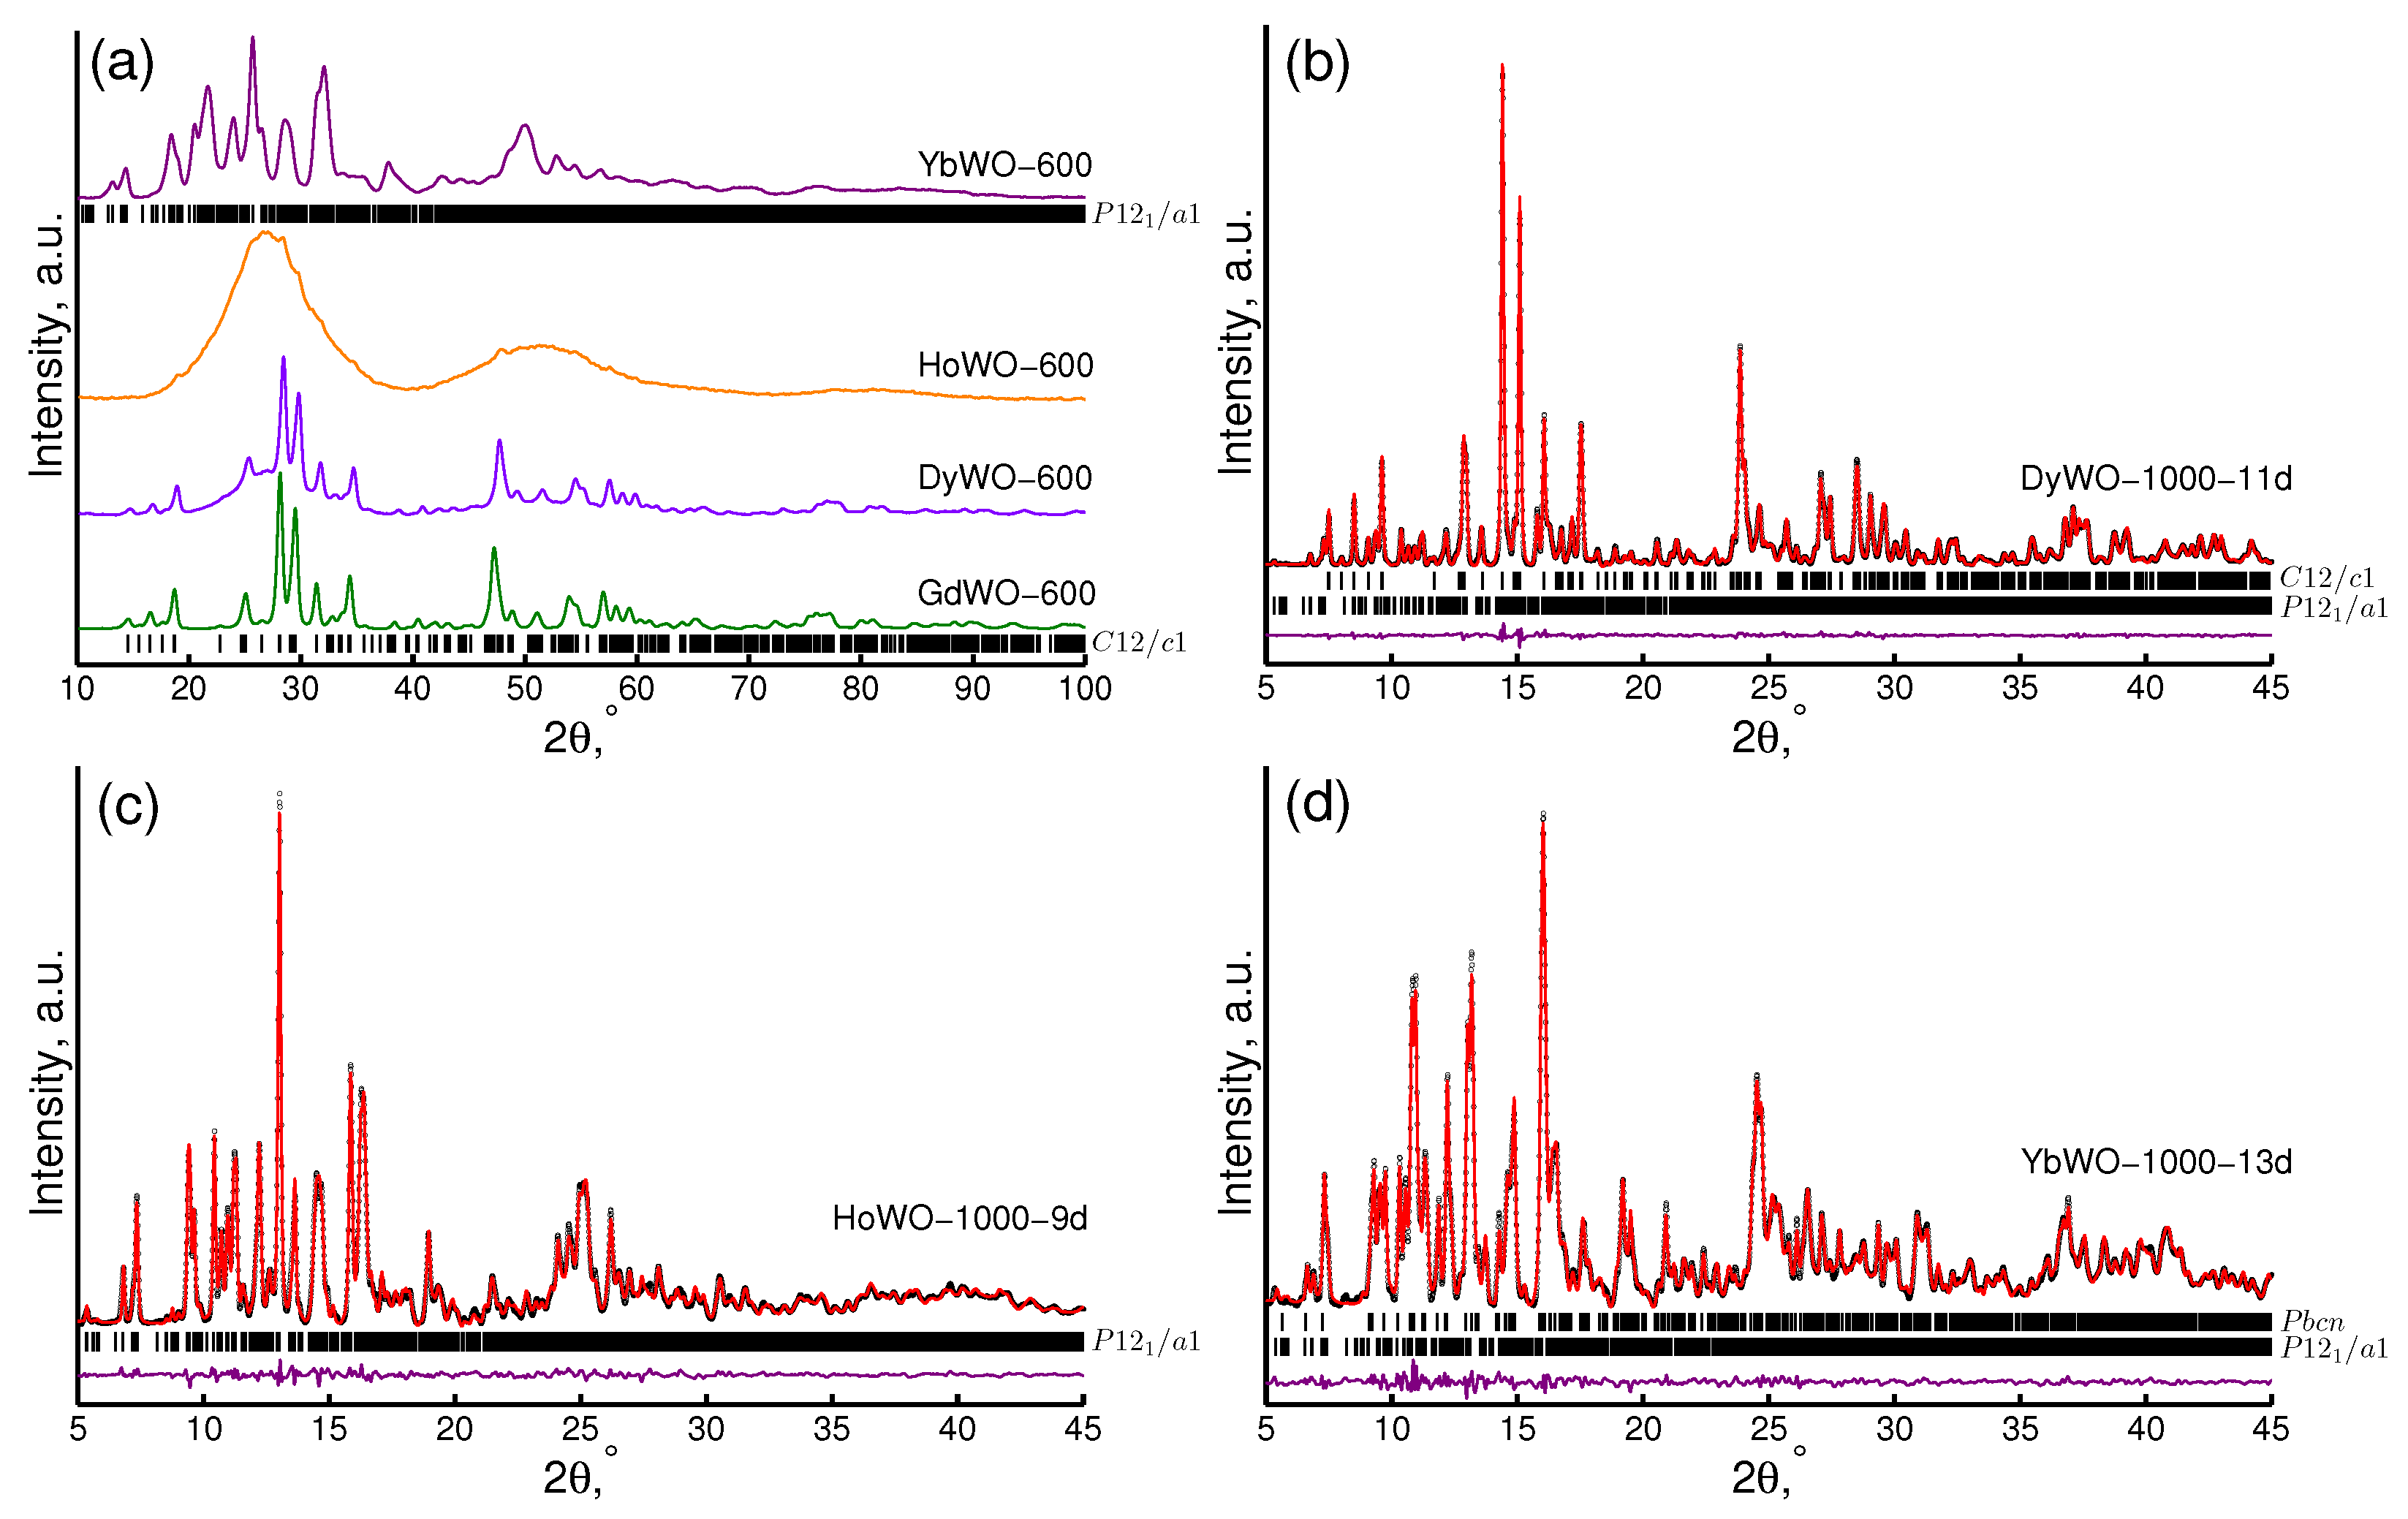
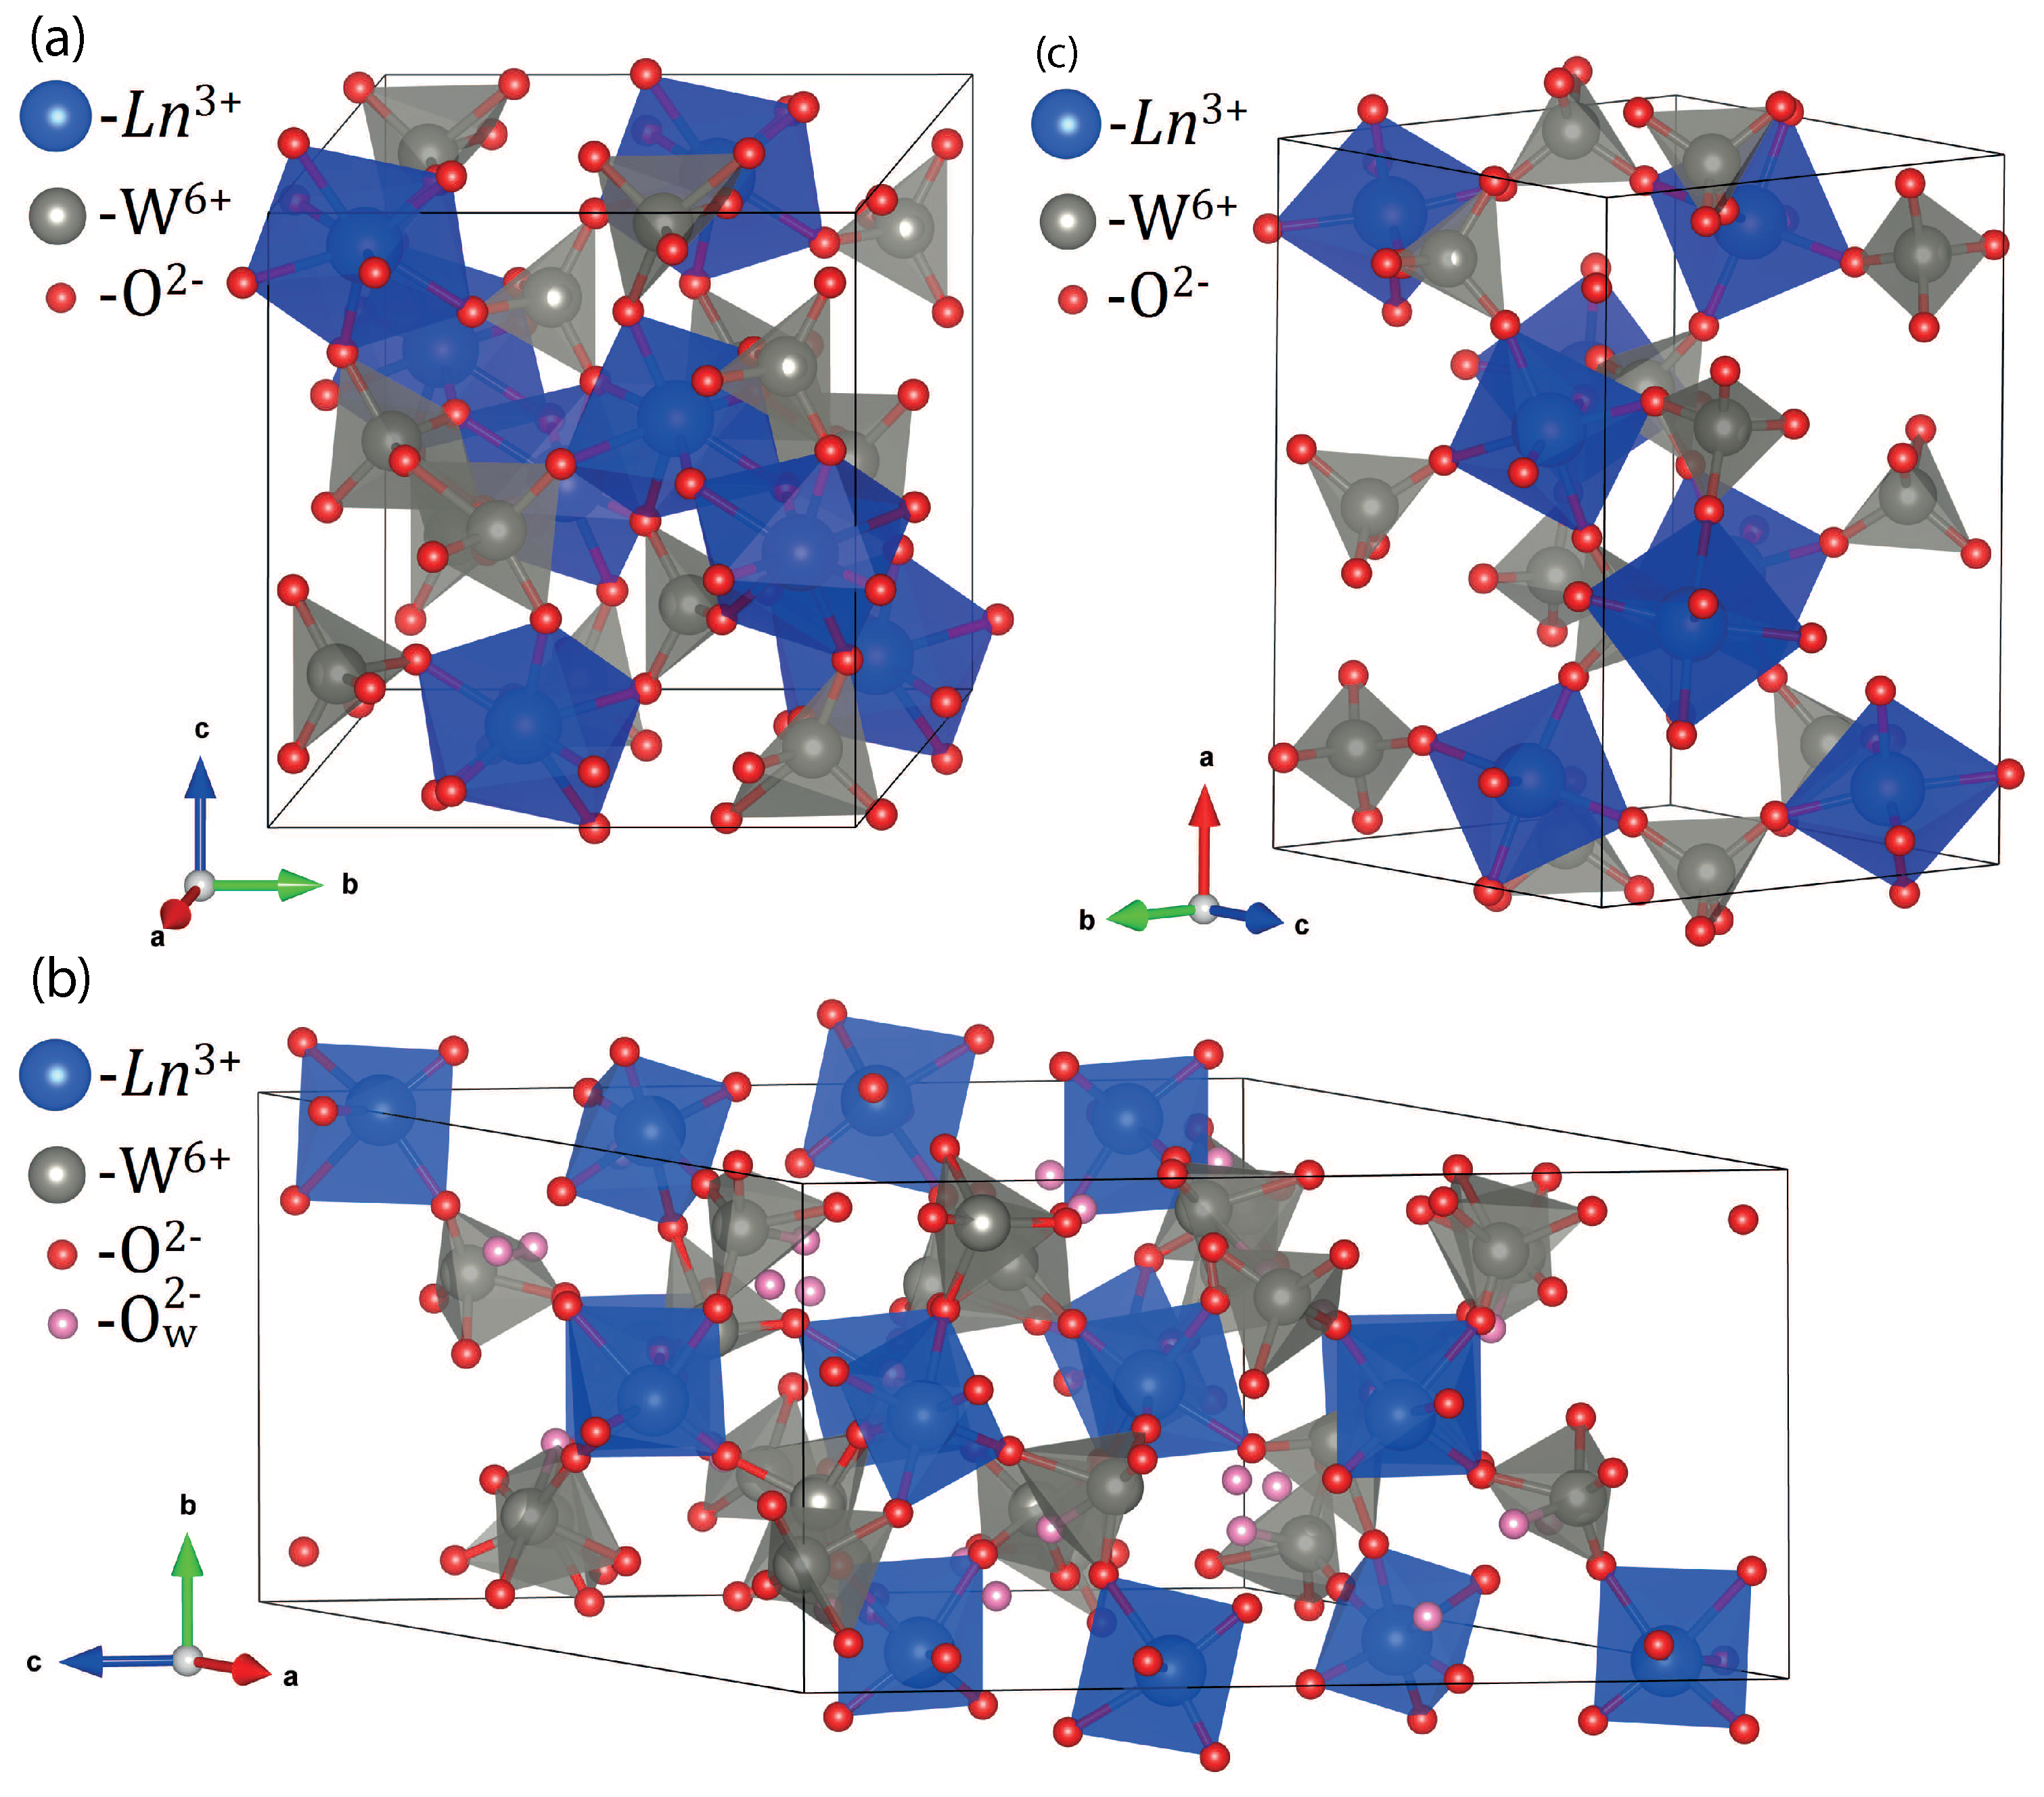
3.3. XRD Study
3.4. X-ray Absorption Spectroscopy
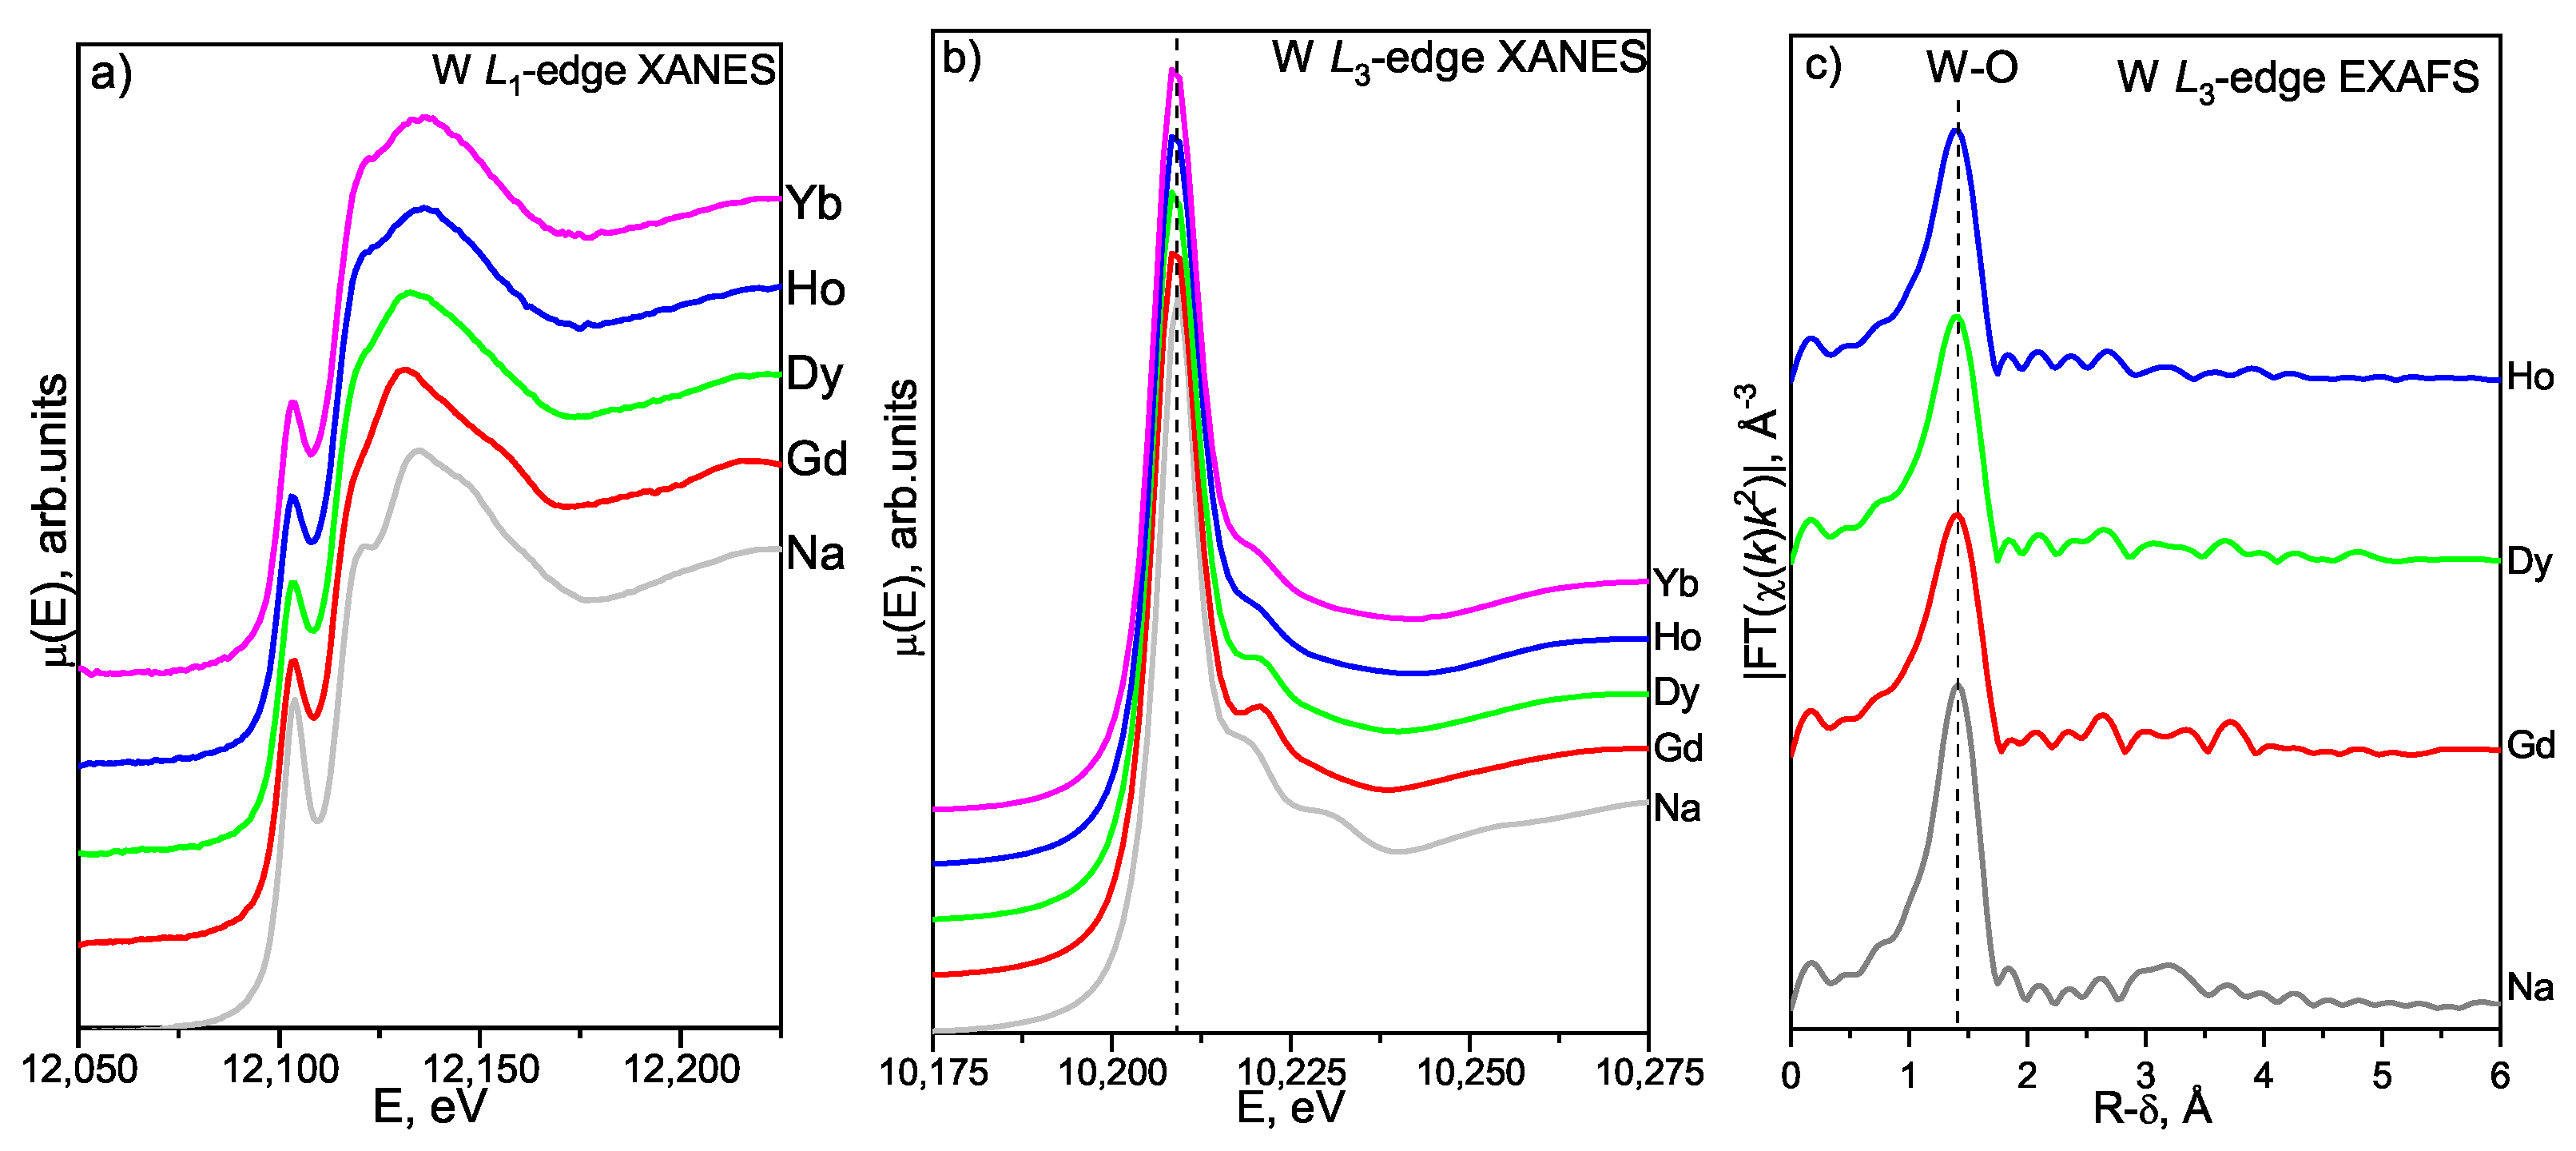
3.4.1. W L- and L-Edges XAFS Study
W L-Edge XANES
W L-Edge XANES
W L-Edge EXAFS
3.4.2. Lanthanoid L-Edge XAFS Study
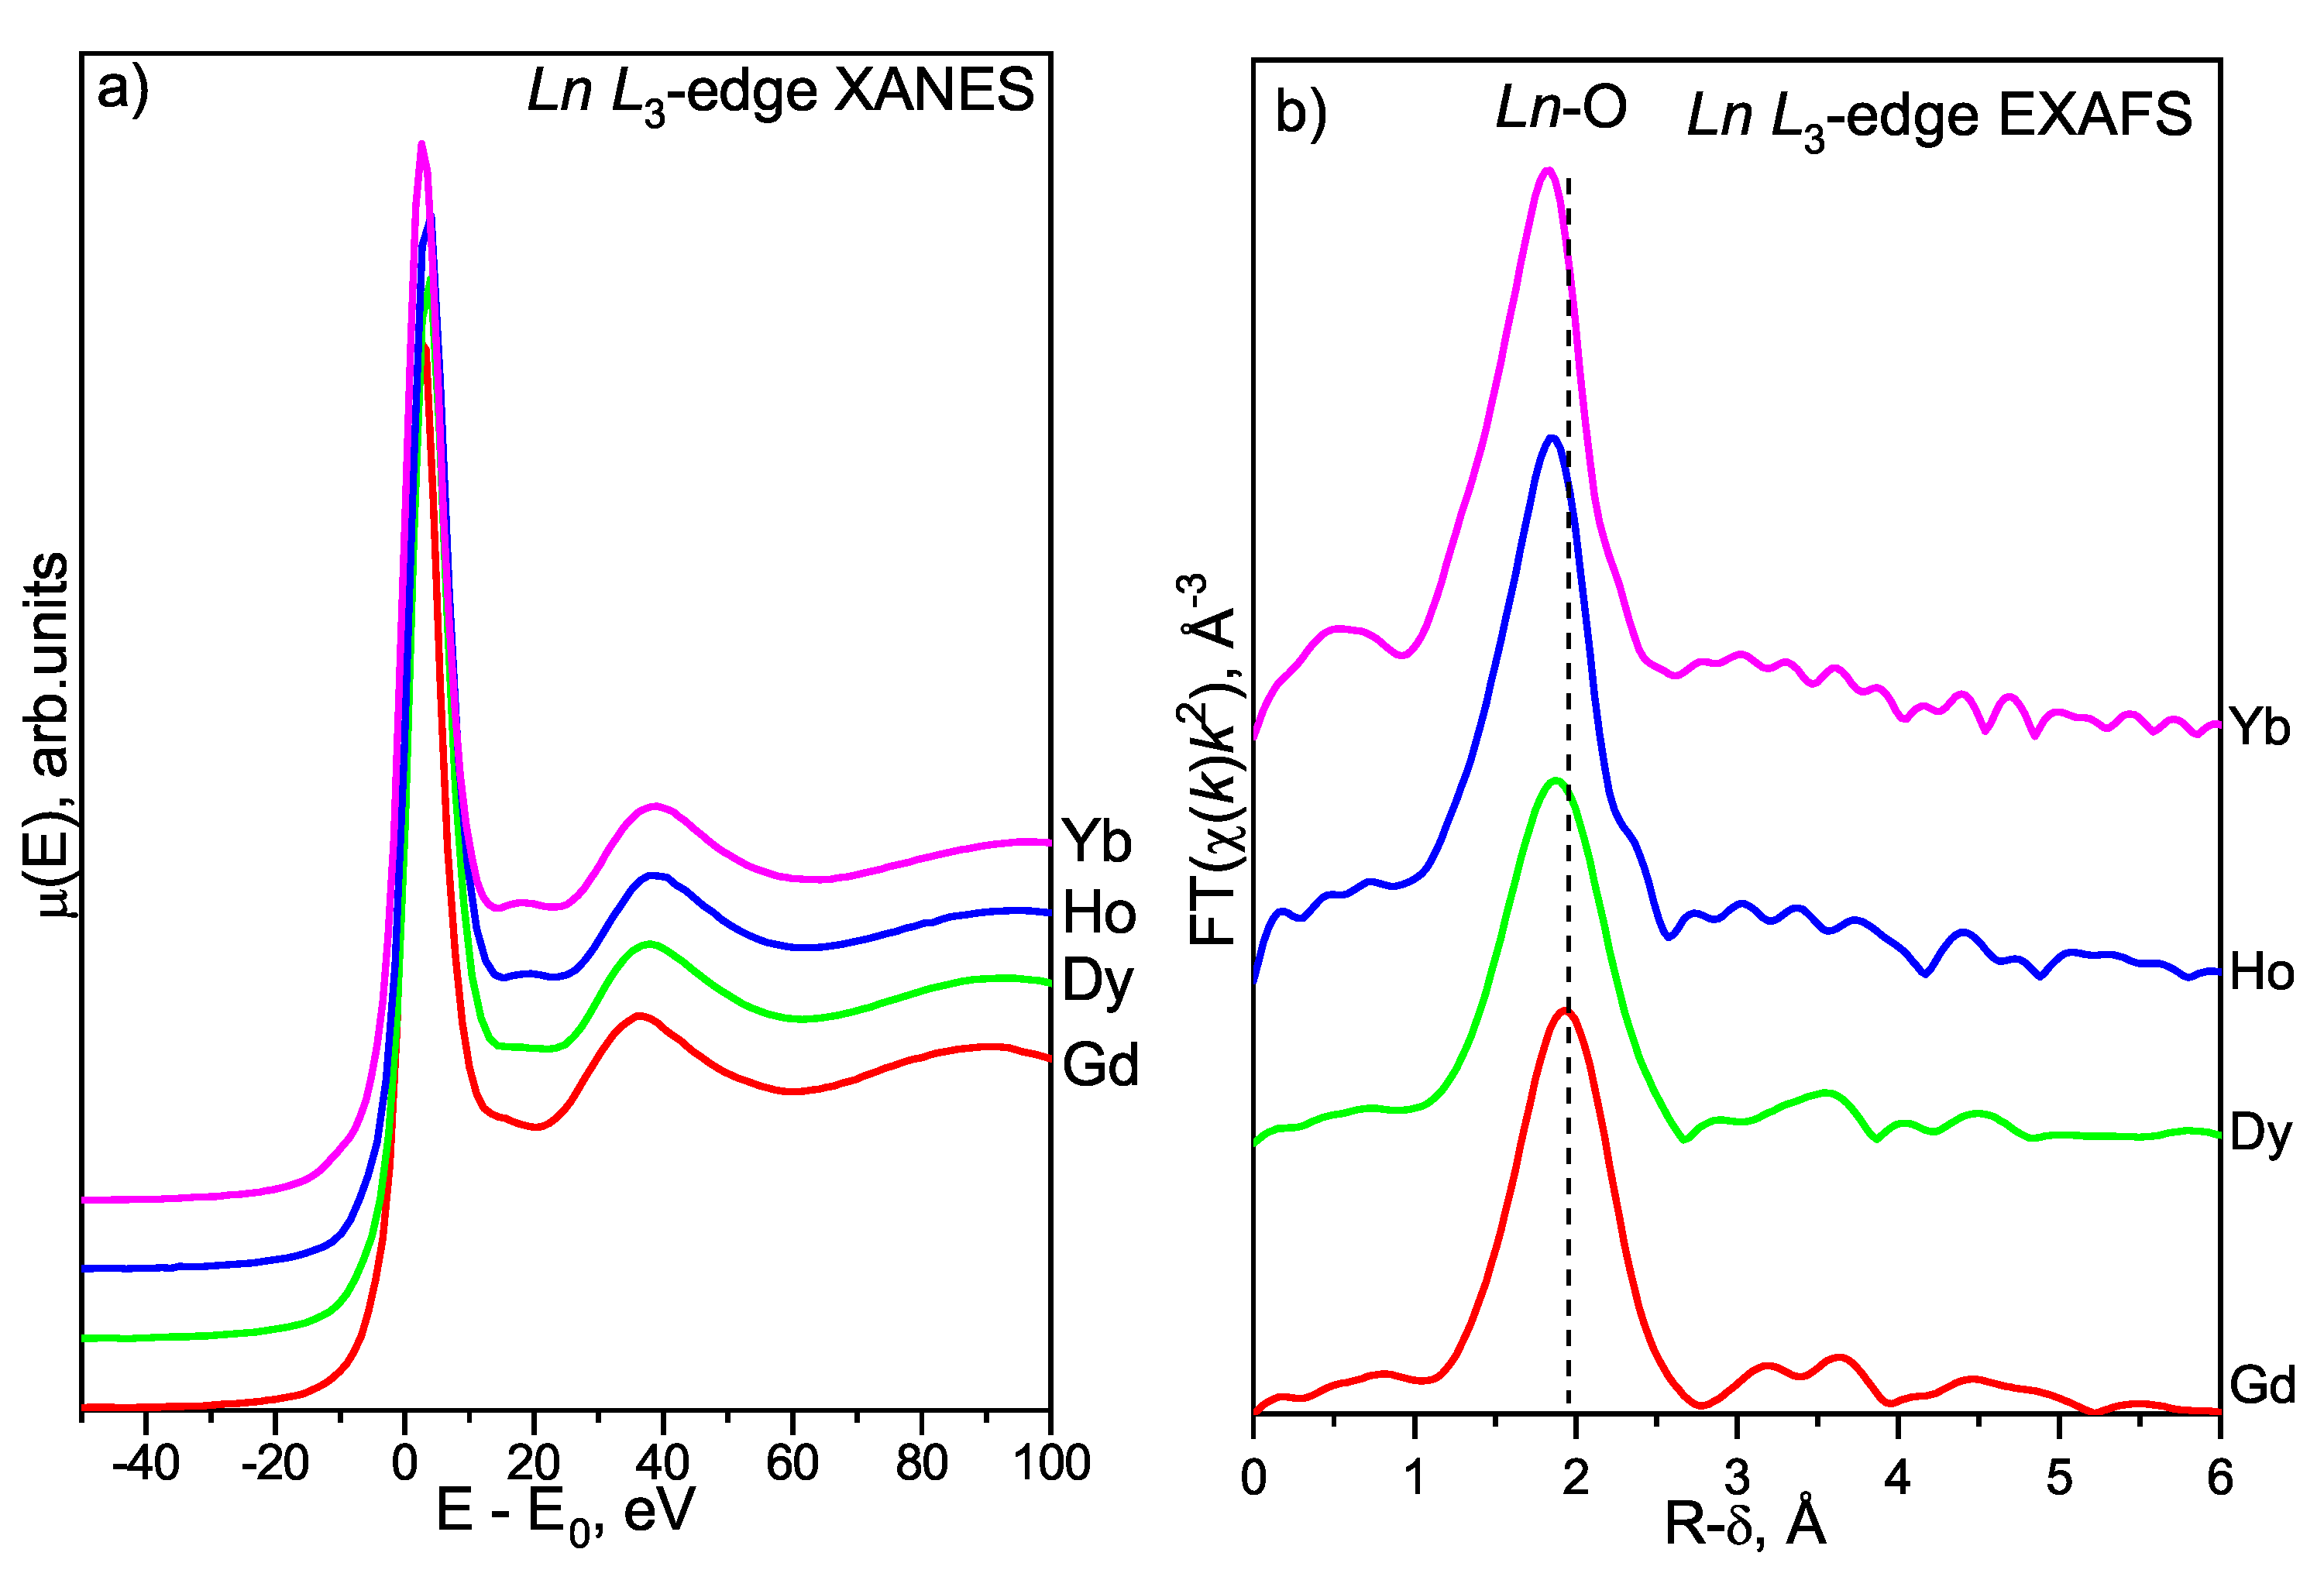
Ln L-Edge XANES
Ln L-Edge EXAFS
3.5. Vibrational Spectroscopy
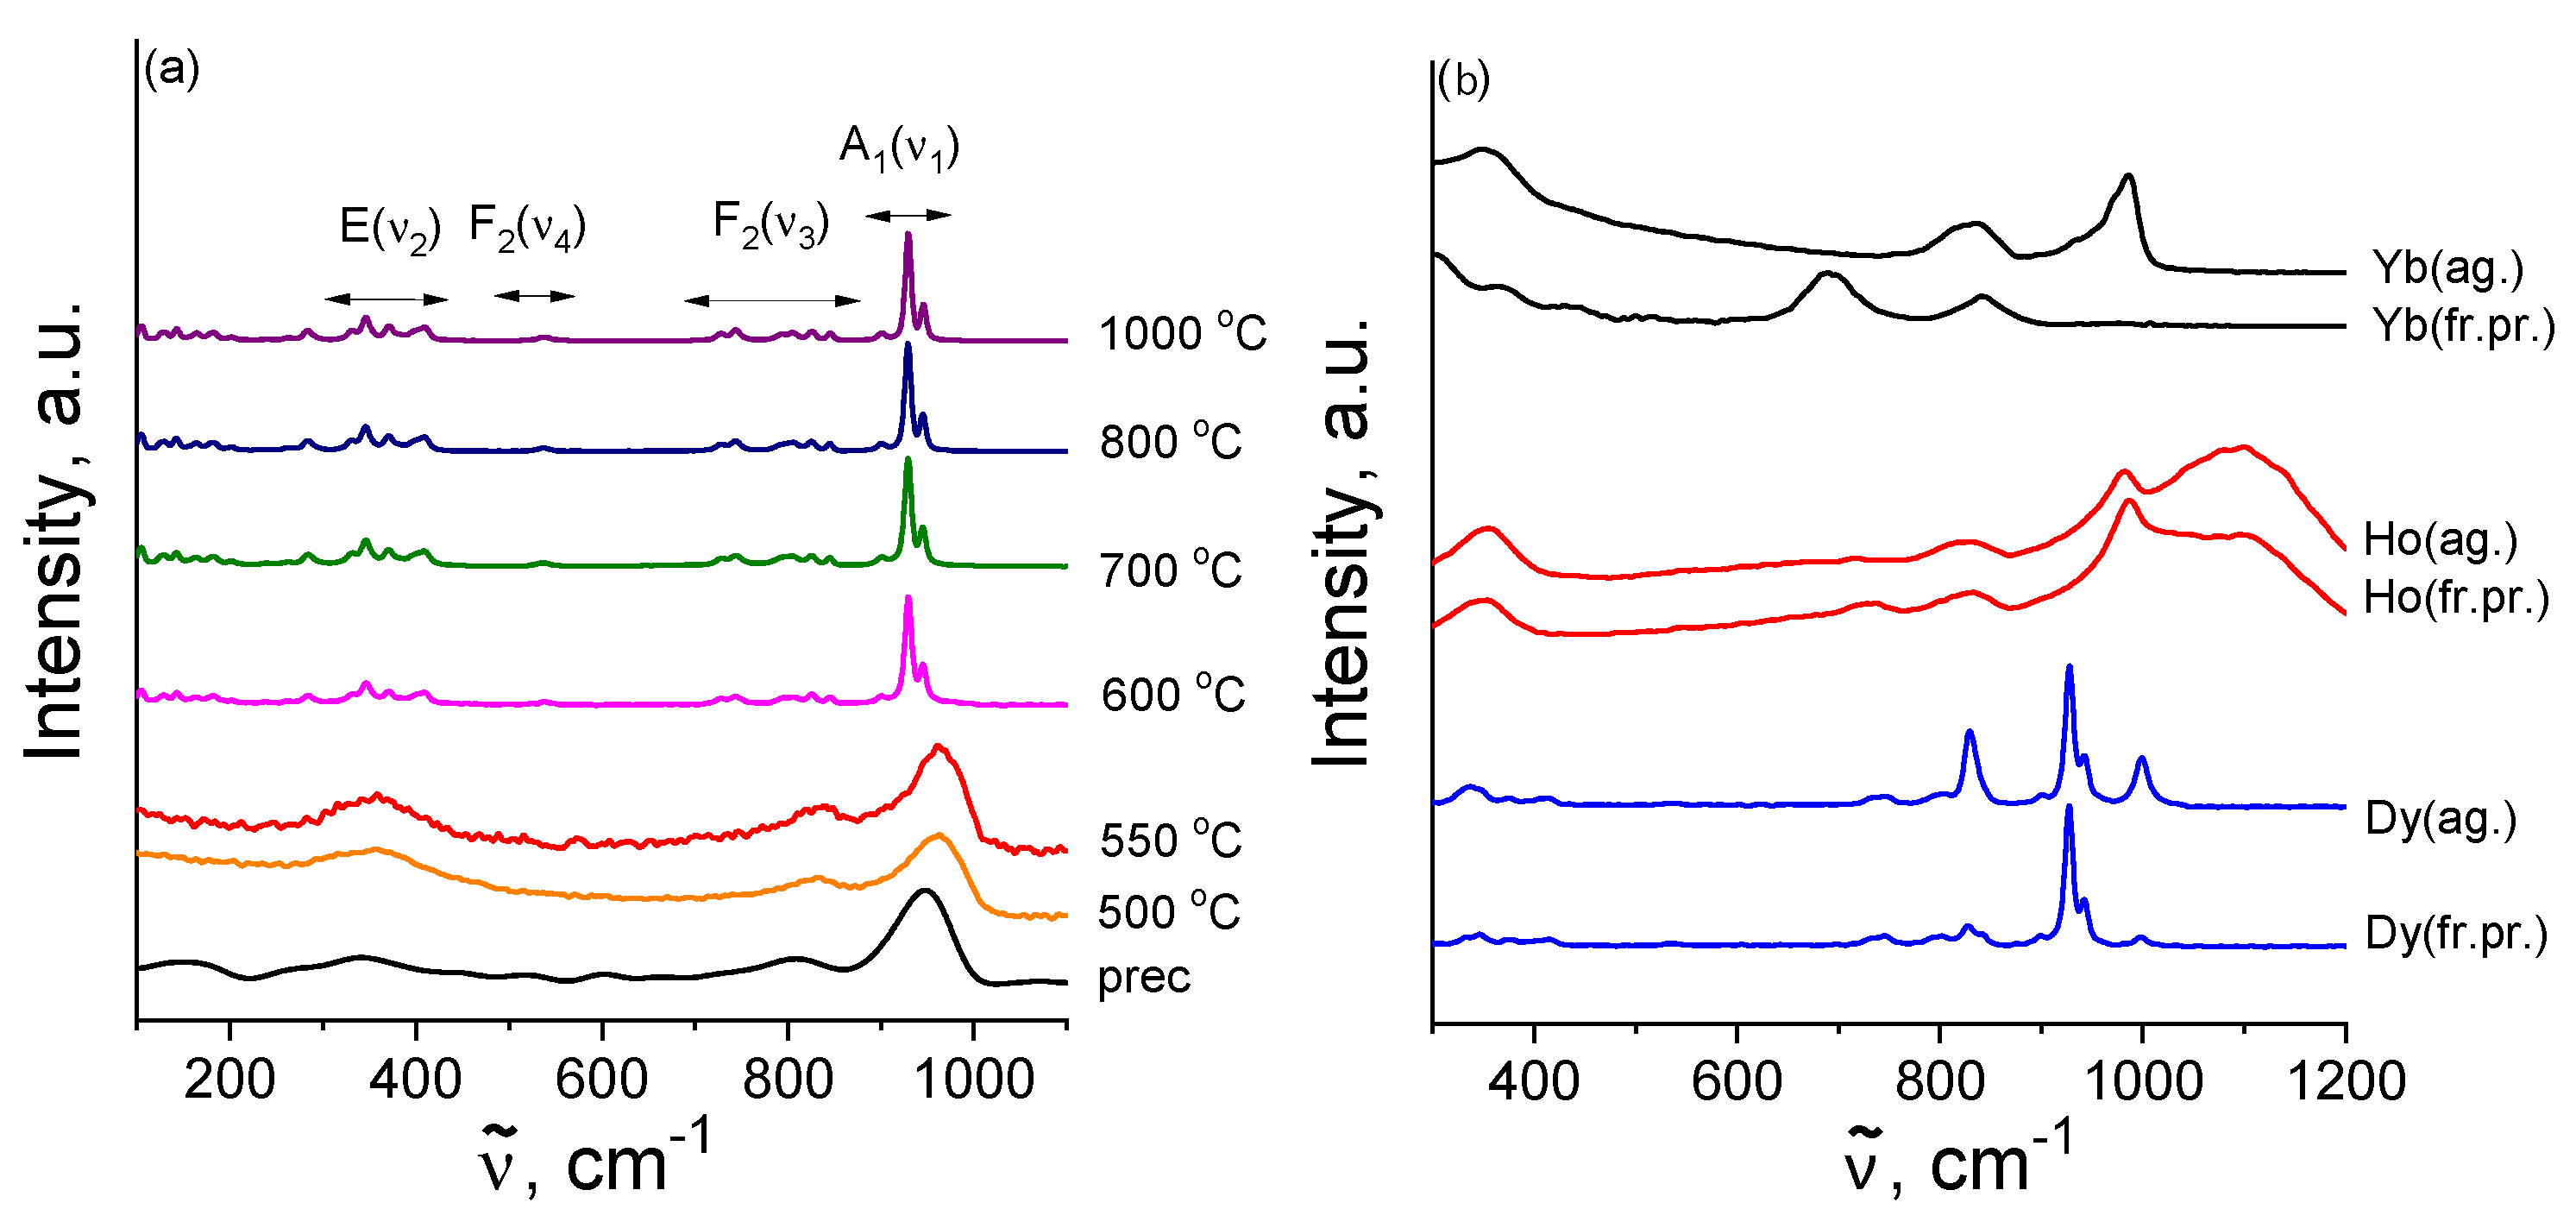
3.5.1. Raman Study
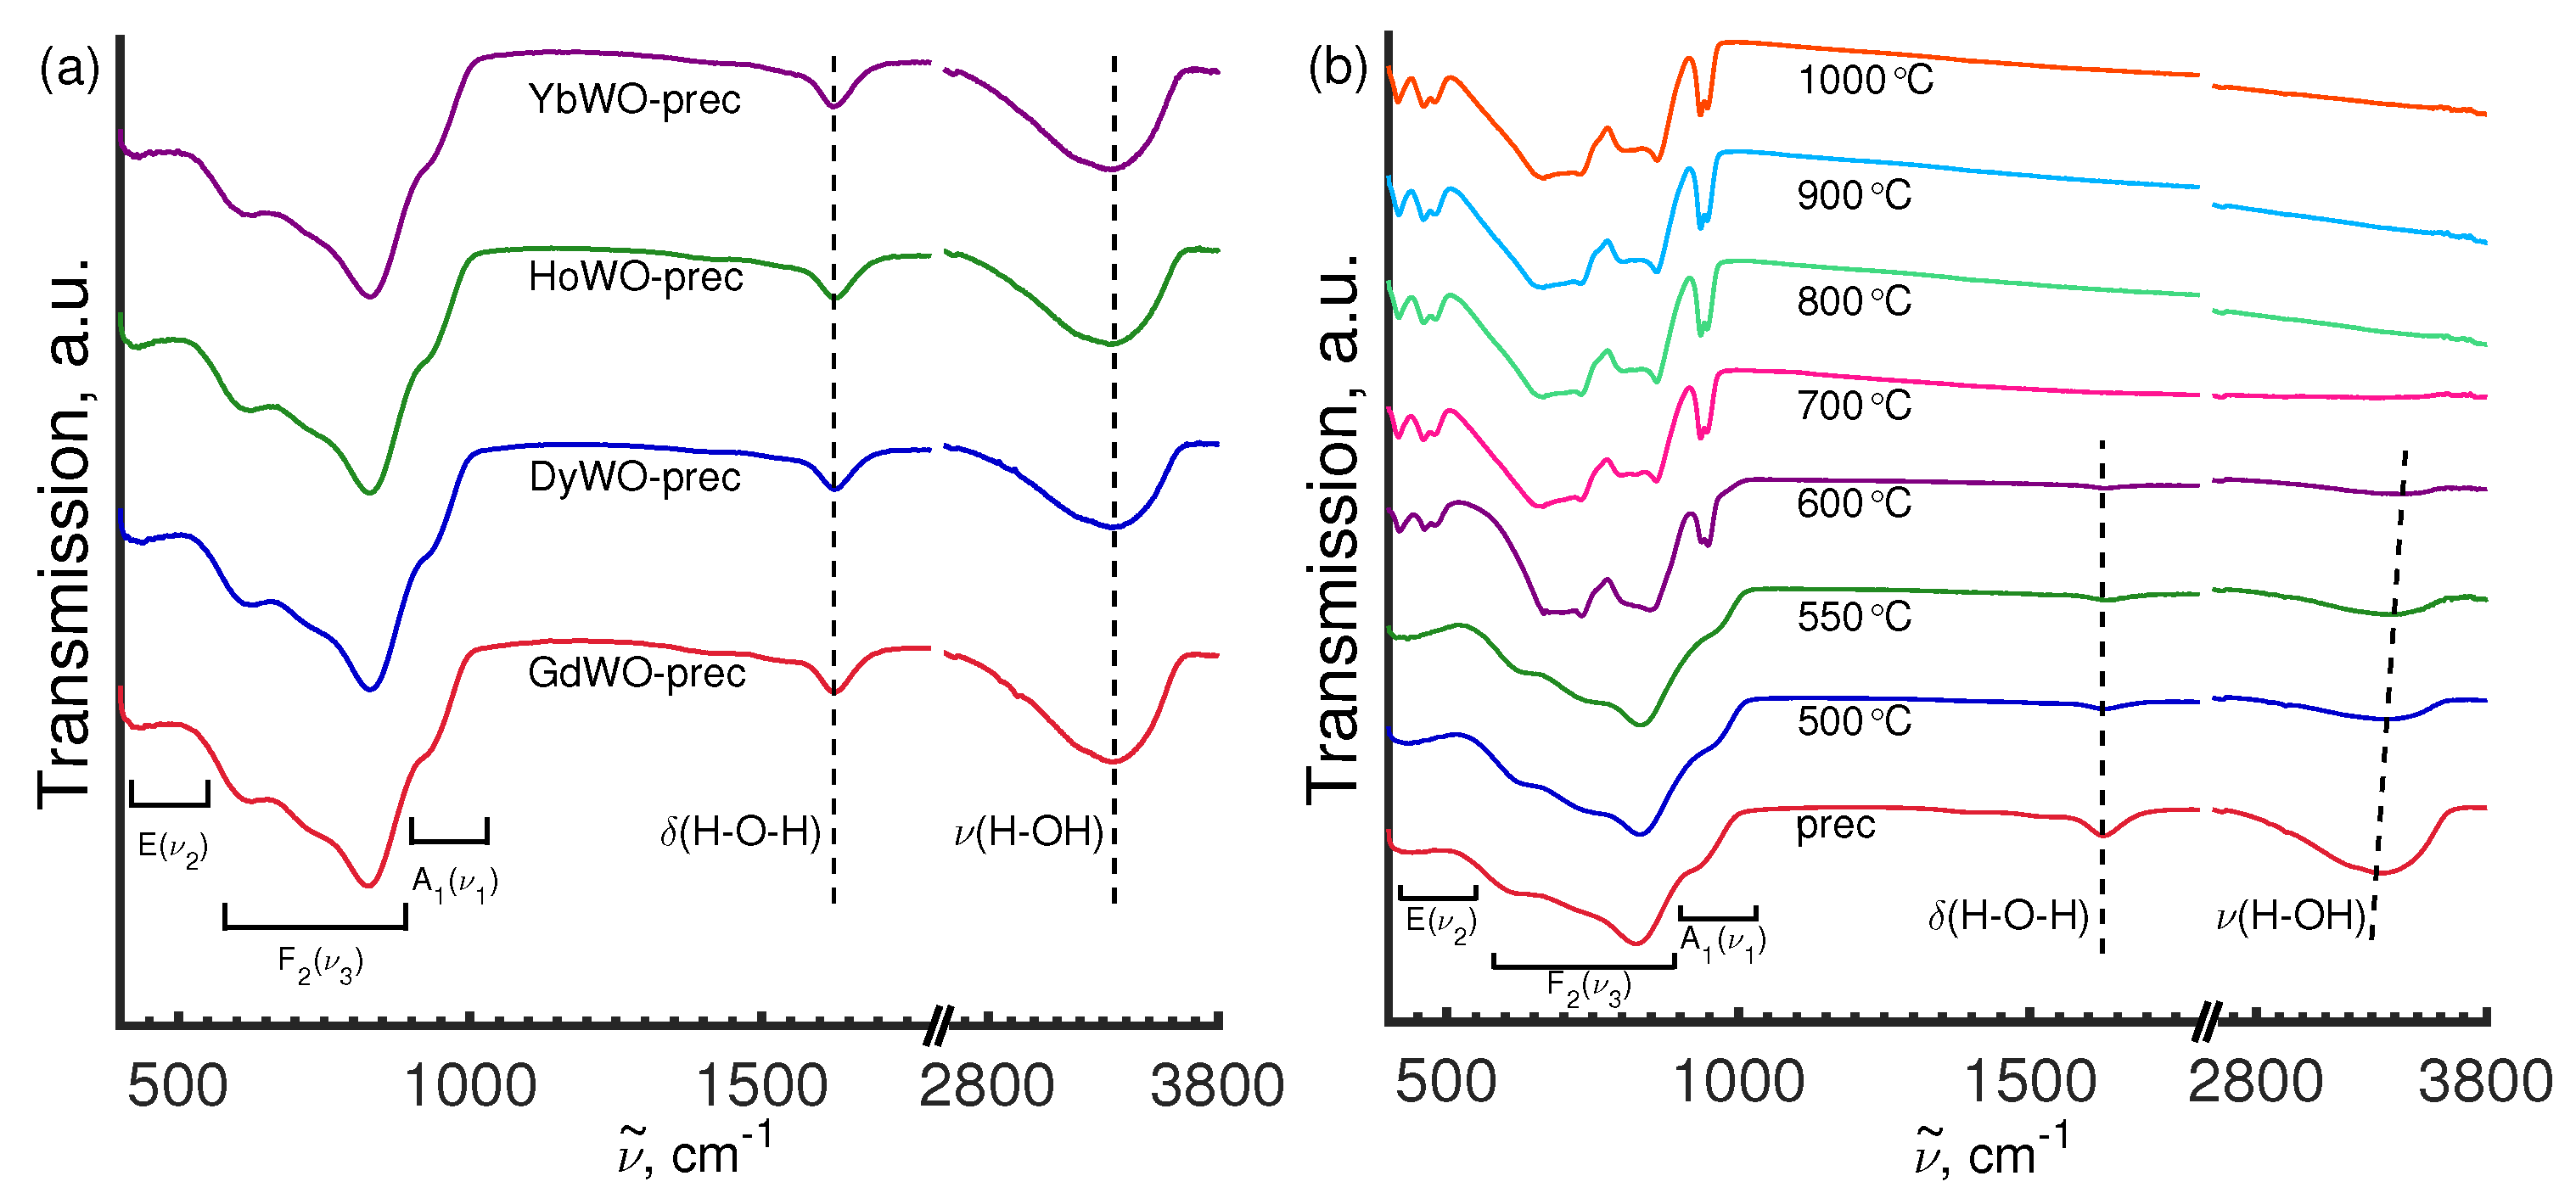
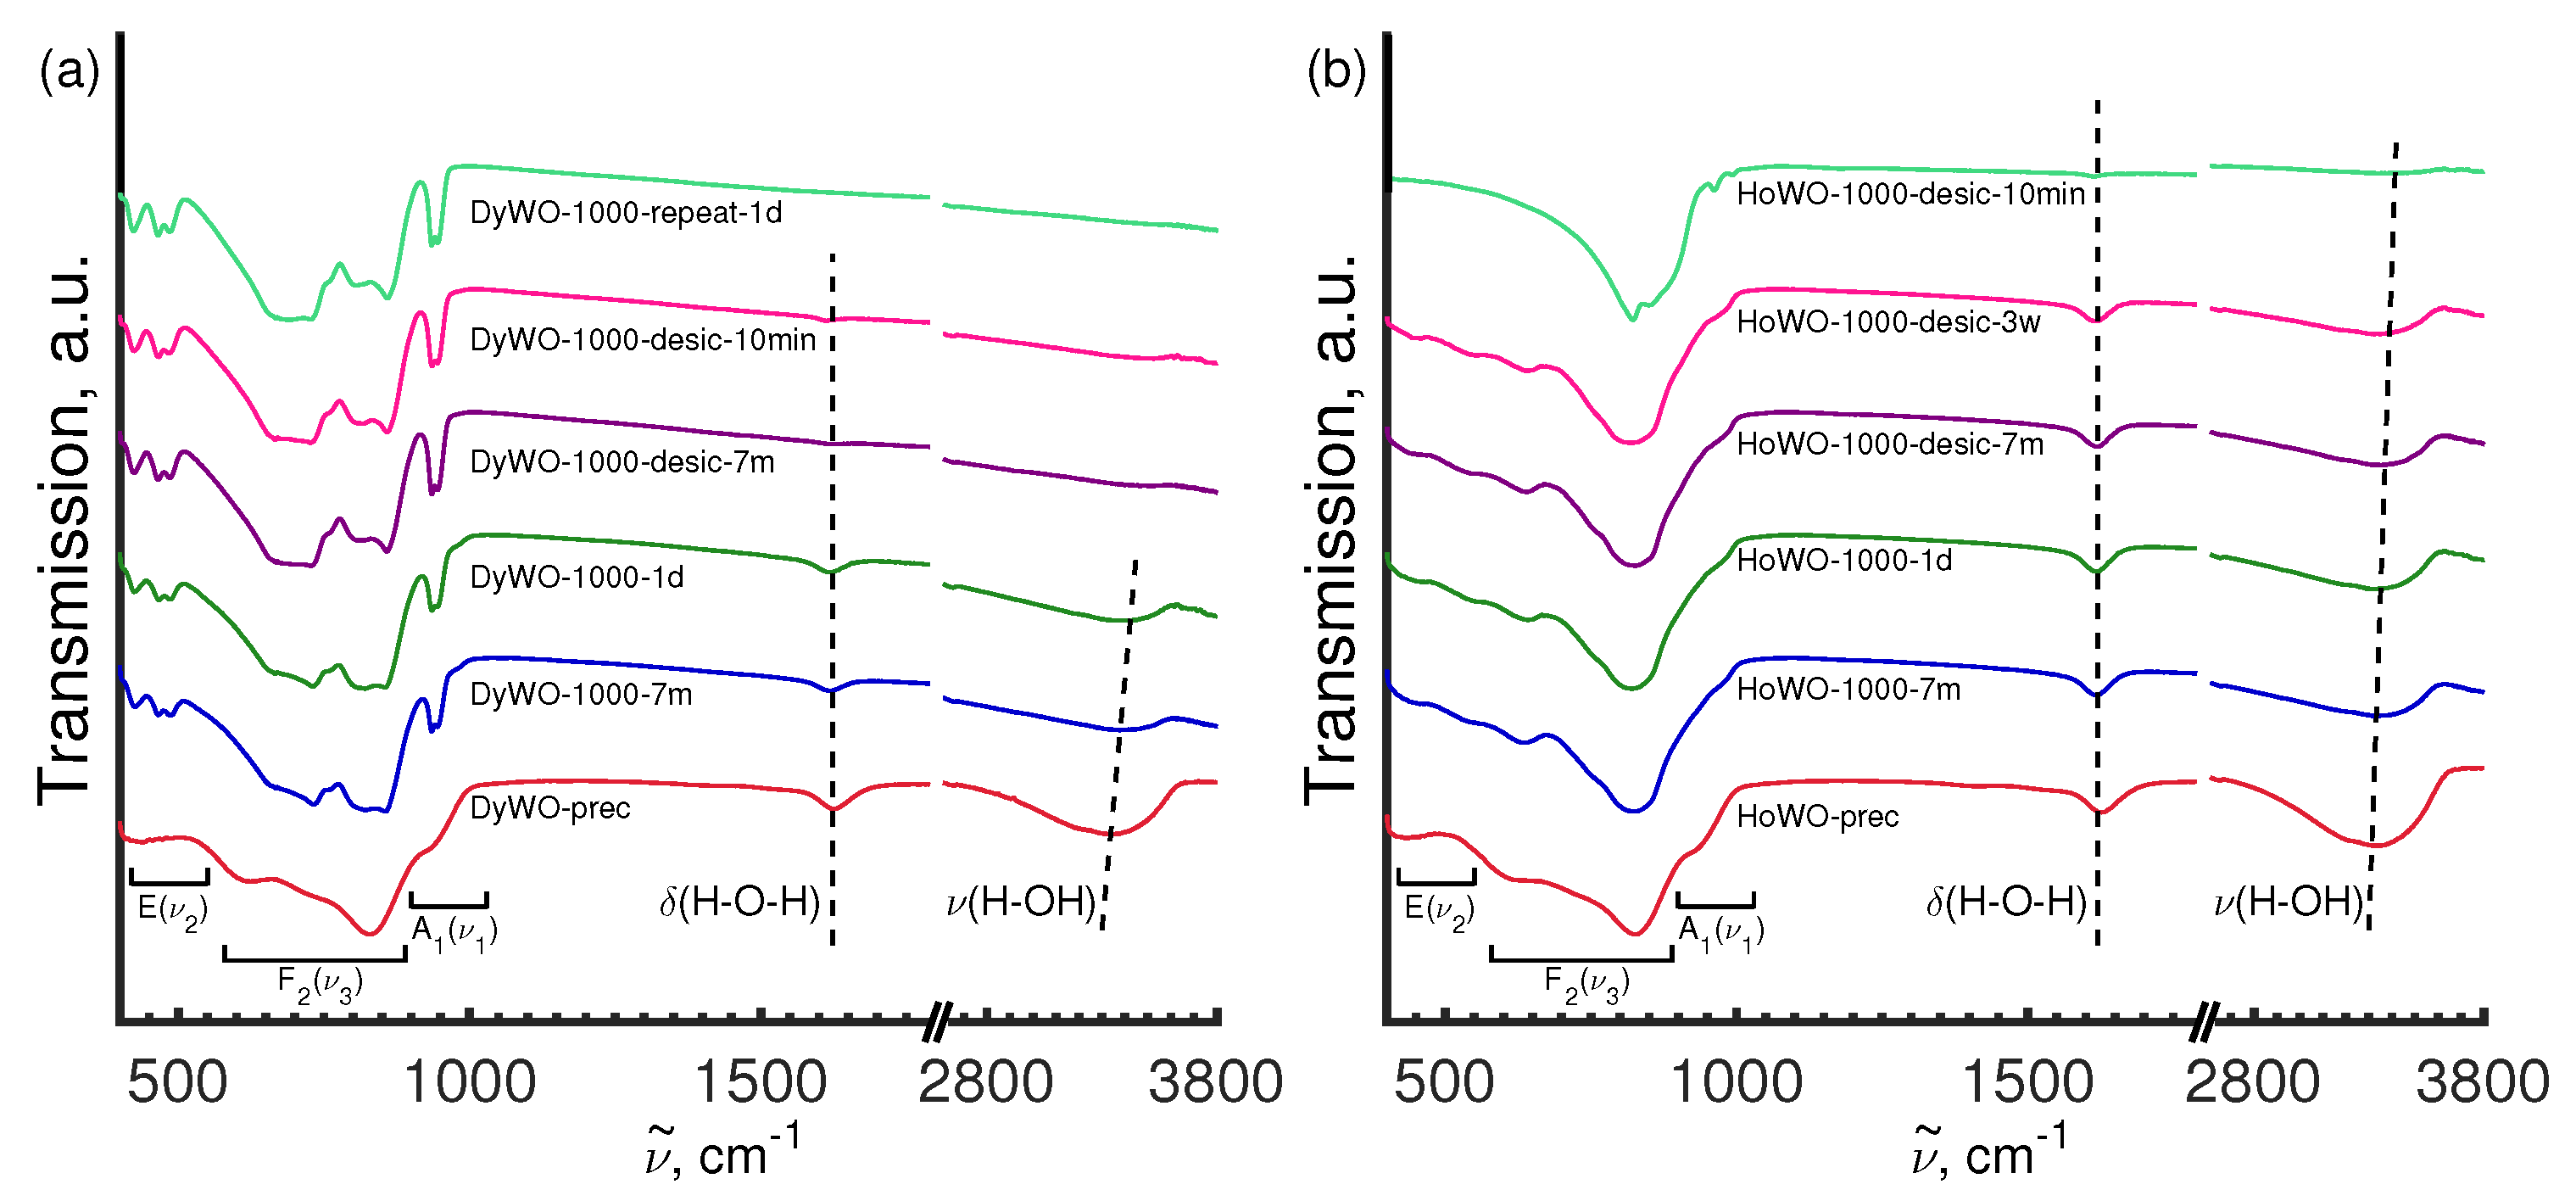
3.5.2. FT-IR Study
4. Conclusions
Supplementary Materials
Author Contributions
Funding
Institutional Review Board Statement
Informed Consent Statement
Data Availability Statement
Acknowledgments
Conflicts of Interest
References
- Imanaka, N.; Köhler, J.; Tamura, S.; Adachi, G. Ion conducting behavior in (Lu1−xMx)2(WO4)3 solid solutions (M = Sm, Ho, Er) with the Sc2(WO4)3 type structure. Eur. J. Inorg. Chem. 2002, 1, 105–109. [Google Scholar] [CrossRef]
- Zhou, Y.; Yan, B. RE2(MO4)3:Ln3+ (RE = Y, La, Gd, Lu; M = W, Mo; Ln = Eu, Sm, Dy) microcrystals: Controlled synthesis, microstructure and tunable luminescence. CrystEngComm 2013, 15, 5694. [Google Scholar] [CrossRef]
- Kaczmarek, A.M.; Deun, R.V. Rare earth tungstate and molybdate compounds—From 0D to 3D architectures. Chem. Soc. Rev. 2013, 42, 8835–8848. [Google Scholar] [CrossRef]
- Liu, J.; Kaczmarek, A.; Deun, R. Advances in tailoring luminescent rare-earth mixed inorganic materials. Chem. Soc. Rev. 2018, 47, 7225–7238. [Google Scholar] [CrossRef]
- Vickery, R.C. Studies of the rare-earth tungstates. J. Chem. Soc. 1949, 2501–2505. [Google Scholar] [CrossRef]
- Borchardt, H. Rare Earth Tungstates and 1:1 Oxytungstates. J. Chem. Phys. 1963, 39, 504–511. [Google Scholar] [CrossRef]
- Nassau, K.; Levinstein, H.J.; Loiacono, G.M. A comprehensive study of trivalent tungstates and molybdates of the type L2(MO4)3. J. Phys. Chem. Solids 1965, 26, 1805–1816. [Google Scholar] [CrossRef]
- Sleight, A.W. Negative Thermal Expansion. MRS Proc. 2002, 755, 106. [Google Scholar] [CrossRef]
- Sumithra, S.; Umarji, A.M. Role of crystal structure on the thermal expansion of Ln2W3O12 (Ln = La, Nd, Dy, Y, Er and Yb). Solid State Sci. 2004, 6, 1313–1319. [Google Scholar] [CrossRef]
- Liu, H.; Sun, W.; Zhang, Z.; Lovings, L.; Lind, C. Thermal Expansion Behavior in the A2M3O12 Family of Materials. Solids 2021, 2, 87–107. [Google Scholar] [CrossRef]
- Marinkovic, B.A.; Pontón, P.I.; Romao, C.P.; Moreira, T.; White, M.A. Negative and Near-Zero Thermal Expansion in A2M3O12 and Related Ceramic Families: A Review. Front. Mater. 2021, 8, 741560. [Google Scholar] [CrossRef]
- Templeton, D.H.; Zalkin, A. Crystal structure of europium tungstate. Acta Cryst. 1963, 16, 762–766. [Google Scholar] [CrossRef] [Green Version]
- Gärtner, M.; Abeln, D.; Pring, A.; Wilde, M.; Reller, A. Synthesis, Structure, and Reactivity of Novel Lanthanum Tungstates. J. Solid State Chem. 1994, 111, 128–133. [Google Scholar] [CrossRef]
- Gressling, T.; Müller-Buschbaum, H. Zur Kristallstruktur von Ce2(WO4)3/On the Crystal Structure of Ce2(WO4)3. Z. Naturforsch. B 1995, 50, 1513–1516. [Google Scholar] [CrossRef]
- Shen, R.; Wang, C.; Wang, T.; Dong, C.; Chen, X.; Liang, J. Crystal Structures of Dy2(WO4)3 and GdY(WO4)3. Rare Met. 2003, 22, 49–54. [Google Scholar]
- Weil, M.; Stöger, B.; Aleksandrov, L. Nd2(WO4)3. Acta Crystallogr. E 2009, 65, i45. [Google Scholar] [CrossRef] [Green Version]
- dos Passos, R.H.D.; de Souza, C.P.; Bernard-Nicod, C.; Leroux, C.; Arab, M. Structural and electrical properties of cerium tungstate: Application to methane conversion. Ceram. Int. 2020, 46, 8021–8030. [Google Scholar] [CrossRef]
- Sabalisck, N.P.; de Cos, G.G.; González-Silgo, C.; Guzmán-Afonso, C.; Lavín, V.; López-Solano, J.; Martín-Mateos, I.T.; Mestres, L.; Mujica, A.; Santamaría-Pérez, D.; et al. Role of rare earth sites and vacancies in the anomalous compression of modulated scheelite tungstates RE2(WO4)3. Phys. Rev. Mater. 2021, 5, 123601. [Google Scholar] [CrossRef]
- Pestereva, N.N.; Vyatkin, I.A.; Lopatin, D.A.; Guseva, A.F. Nature of ionic conductivity of lanthanoid tungstates with imperfect scheelite structure. Russ. J. Electrochem. 2016, 52, 1082–1089. [Google Scholar] [CrossRef]
- Xiao, X.; Cheng, Y.; Peng, J.; Wu, M.; Chen, D.; Hu, Z.; Kiyanagi, R.; Fieramosca, J.; Short, S.; Jorgensen, J. Thermal expansion properties of A2(MO4)3 (A = Ho and Tm; M = W and Mo). Solid State Sci. 2008, 10, 321–325. [Google Scholar] [CrossRef]
- Lahoz, F.; Sabalisck, N.P.; Cerdeiras, E.; Mestres, L. Nano-to millisecond lifetime luminescence properties in Ln2(WO4)3 (Ln = La, Ho, Tm and Eu) microcrystalline powders with different crystal structures. J. Alloys Compd. 2015, 649, 1253–1259. [Google Scholar] [CrossRef]
- Kol’tsova, T.N. X-ray diffraction study of Y2W3O12·3H2O. Inorg. Mater. 2001, 37, 1175–1177. [Google Scholar] [CrossRef]
- Pontón, P.I.; Prisco, L.P.; Dosen, A.; Faro, G.S.; de Abreu, M.A.; Marinkovic, B.A. Co-precipitation synthesis of Y2W3O12 submicronic powder. Ceram. Int. 2017, 43, 4222–4228. [Google Scholar] [CrossRef]
- Yamazoe, S.; Hitomi, Y.; Shishido, T.; Tanaka, T. XAFS Study of Tungsten L1- and L3-Edges: Structural Analysis of WO3 Species Loaded on TiO2 as a Catalyst for Photo-oxidation of NH3. J. Phys. Chem. C 2008, 112, 6869–6879. [Google Scholar] [CrossRef]
- Timoshenko, J.; Anspoks, A.; Kalinko, A.; Kuzmin, A. Local structure of nanosized tungstates revealed by evolutionary algorithm. Phys. Status Solidi A 2015, 212, 265–273. [Google Scholar] [CrossRef]
- Kuriakose, S.; H, H.; Jose, A.; John, M.; Varghese, T. Structural and optical characterization of lanthanum tungstate nanoparticles synthesized by chemical precipitation route and their photocatalytic activity. Opt. Mater. 2020, 99, 109571. [Google Scholar] [CrossRef]
- Meng, Q.; Hua, R.; Chen, B.; Tian, Y.; Lu, S.; Sun, L. Study on Luminescent Properties of Eu3+ Doped Gd2WO6, Gd2W2O9 and Gd2(WO4)3 Nanophosphors Prepared by Co-Precipitation. J. Nanosci. Nanotechnol. 2011, 11, 182–188. [Google Scholar] [CrossRef]
- Popov, V.V.; Menushenkov, A.P.; Yaroslavtsev, A.A.; Zubavichus, Y.V.; Gaynanov, B.R.; Yastrebtsev, A.A.; Leshchev, D.S.; Chernikov, R.V. Fluorite-pyrochlore phase transition in nanostructured Ln2Hf2O7 (Ln = La-Lu). J. Alloys Compd. 2016, 689, 669–679. [Google Scholar] [CrossRef]
- Popov, V.V.; Menushenkov, A.P.; Gaynanov, B.R.; Zubavichus, Y.V.; Svetogorov, R.D.; Yastrebtsev, A.A.; Pisarev, A.A.; Arzhatkina, L.A.; Ponkratov, K.V. Features of formation and evolution of crystal and local structures in nanocrystalline Ln2Zr2O7 (Ln = La–Tb). J. Phys. Conf. Ser. 2017, 941, 012079. [Google Scholar] [CrossRef] [Green Version]
- Popov, V.V.; Menushenkov, A.P.; Ivanov, A.A.; Gaynanov, B.R.; Yastrebtsev, A.A.; d’Acapito, F.; Puri, A.; Castro, G.R.; Shchetinin, I.V.; Zheleznyi, M.V.; et al. Comparative analysis of long- and short-range structures features in titanates Ln2Ti2O7 and zirconates Ln2Zr2O7 (Ln = Gd, Tb, Dy) upon the crystallization process. J. Phys. Chem. Solids 2019, 130, 144–153. [Google Scholar] [CrossRef]
- Popov, V.V.; Menushenkov, A.P.; Yastrebtsev, A.A.; Molokova, A.Y.; Rudakov, S.G.; Svetogorov, R.D.; Tsarenko, N.A.; Ponkratov, K.V.; Ognevskaya, N.V.; Seregina, O.N. The effect of the synthesis conditions on the structure and phase transitions in Ln2(MoO4)3. Solid State Sci. 2021, 112, 106518. [Google Scholar] [CrossRef]
- Popov, V.V.; Menushenkov, A.P.; Yastrebtsev, A.A.; Rudakov, S.G.; Ivanov, A.A.; Gaynanov, B.R.; Svetogorov, R.D.; Khramov, E.V.; Zubavichus, Y.V.; Molokova, A.Y.; et al. Multiscale study on the formation and evolution of the crystal and local structures in lanthanoid tungstates Ln2(WO)4)3. J. Alloys Compd. 2022, 910, 164922. [Google Scholar] [CrossRef]
- Svetogorov, R.D.; Dorovatovskii, P.V.; Lazarenko, V.A. Belok/XSA Diffraction Beamline for Studying Crystalline Samples at Kurchatov Synchrotron Radiation Source. Cryst. Res. Tech. 2020, 55, 1900184. [Google Scholar] [CrossRef]
- Petricek, V.; Dusek, M.; Palatinus, L. Crystallographic computing system JANA2006: General features. Z. Krist. 2014, 229, 345–352. [Google Scholar] [CrossRef]
- Chernyshov, A.; Veligzhanin, A.; Zubavichus, Y. Structural Materials Science end-station at the Kurchatov Synchrotron Radiation Source: Recent instrumentation upgrades and experimental results. Nucl. Instrum. Methods Phys. Res. Sect. A 2009, 603, 95–98. [Google Scholar] [CrossRef]
- Ravel, B.; Newville, M. ATHENA, ARTEMIS, HEPHAESTUS: Data analysis for X-ray absorption spectroscopy using IFEFFIT. J. Synchrotron Radiat. 2005, 12, 537–541. [Google Scholar] [CrossRef] [Green Version]
- Newville, M. IFEFFIT: Interactive XAFS analysis and FEFF fitting. J. Synchrotron Radiat. 2001, 8, 322–324. [Google Scholar] [CrossRef]
- Rehr, J.J.; Albers, R.C. Theoretical approaches to X-ray absorption fine structure. Rev. Mod. Phys. 2000, 72, 621–654. [Google Scholar] [CrossRef]
- Klementev, K.V. Extraction of the fine structure from X–ray absorption spectra. J. Phys. D Appl. Phys. 2001, 34, 209–217. [Google Scholar] [CrossRef]
- Rehr, J.J.; Kas, J.J.; Vila, F.D.; Prange, M.P.; Jorissen, K. Parameter-free calculations of X-ray spectra with FEFF9. Phys. Chem. Chem. Phys. 2010, 12, 5503–5513. [Google Scholar] [CrossRef]
- Evdokimov, A.A.; Efremov, V.A.; Trunov, V.K.; Kleinman, I.A.; Dzurinskii, B.F. Rare Earth Elements Compounds. Molybdates, Tungstates; Nauka (Science): Moscow, Russia, 1991. (In Russian) [Google Scholar]
- Wu, M.Y.; Jia, Y.; Sun, Q. Effects of A3+ cations on hydration in A2M3O12 family materials: A first-principles study. Comput. Mater. Sci. 2016, 111, 28–33. [Google Scholar] [CrossRef]
- Shmurak, S.Z.; Kedrov, V.V.; Kiselev, A.P.; Fursova, T.N.; Zver’kova, I.I.; Khasanov, S.S. Spectral and Structural Characteristics of (Lu1-xEux)2(WO4)3 Tungstates. Phys. Solid State 2019, 61, 2117–2129. [Google Scholar] [CrossRef]
- Richard, A.P.; Edwards, D.D. Subsolidus phase relations and crystal structures of the mixed-oxide phases in the In2O3–WO3 system. J. Solid State Chem. 2004, 177, 2740–2748. [Google Scholar] [CrossRef]
- Sumithra, S.; Umarji, A.M. Hygroscopicity and bulk thermal expansion in Y2W3O12. Mater. Res. Bull. 2005, 40, 167–176. [Google Scholar] [CrossRef]
- Luo, Q.H.; Howell, R.C.; Dankova, M.; Bartis, J.; Williams, C.W.; Horrocks, W.D.; Young, V.G.; Rheingold, A.L.; Francesconi, L.C.; Antonio, M.R. Coordination of Rare-Earth Elements in Complexes with Monovacant Wells–Dawson Polyoxoanions. Inorg. Chem. 2001, 40, 1894–1901. [Google Scholar] [CrossRef]
- Sabalisck, N.P.; Lopez-Solano, J.; Guzman-Afonso, C.; Santamaria-Perez, D.; Gonzalez-Silgo, C.; Mujica, A.; Munoz, A.; Rodriguez-Hernandez, P.; Radescu, S.; Vendrell, X.; et al. Effect of pressure on La2(WO4)3 with a modulated scheelite-type structure. Phys. Rev. B 2014, 89, 174112. [Google Scholar] [CrossRef] [Green Version]
- Burcham, L.J.; Wachs, I.E. Vibrational analysis of the two non-equivalent, tetrahedral tungstate (WO4) units in Ce2(WO4)3 and La2(WO4)3. Spectrochim. Acta A 1998, 54, 1355–1368. [Google Scholar] [CrossRef]
- Pourmortazavi, S.M.; Rahimi-Nasrabadi, M.; Ganjali, M.; Sadeghpour, K.M.; Norouzi, P.; Faridbod, F. Facile and Effective Synthesis of Praseodymium Tungstate Nanoparticles through an Optimized Procedure and Investigation of Photocatalytic Activity. Open Chem. J. 2017, 15, 129–138. [Google Scholar] [CrossRef]
- Rahimi-Nasrabadi, M.; Pourmortazavi, S.M.; Ganjali, M.R.; Banan, A.R.; Ahmadi, F. Synthesis procedure optimization and characterization of europium (III) tungstate nanoparticles. J. Mol. Struct. 2014, 1074, 85–91. [Google Scholar] [CrossRef]
- Nakamoto, K. Infrared and Raman Spectra of Inorganic and Coordination Compounds. Part A: Theory and Applications in Inorganic Chemistry, 6th ed.; John Wiley & Sons, Inc.: Hoboken, NJ, USA, 2009. [Google Scholar]
- Yin, M.; Liu, Y.; Mei, L.; Molokeev, M.S.; Huang, Z.; Fang, M. Preparation, crystal structure and up-conversion luminescence of Er3+, Yb3+ co-doped Gd2(WO4)3. RSC Adv. 2015, 5, 73077–73082. [Google Scholar] [CrossRef]


| No | Preparation Protocol | Sample Code |
|---|---|---|
| 1 | Ln(WO) precursors | LnWO-prec |
| 2 | Ln(WO) calcined at 1000 °C, cooled in the open air and then stored in air 1 day * | LnWO-1000-1d |
| 3 | Ln(WO) calcined at 1000 °C, cooled in a desiccator and then stored in air 1 day * | LnWO-1000-desic-1d |
| 4 | Ln(WO) calcined at 1000 °C, cooled in the open air, after that repeat heated up to 1000 °C, cooled in the open air and then stored in air 1 day * | LnWO-1000-repeat-1d |
| Ln Type | T, °C | H, J/g | m, % | Composition |
|---|---|---|---|---|
| Gd | 633.7 | 116 | 7.83 | Gd(WO)5.0HO |
| Dy | 637.5 (650.8 shoulder) | 91 | 7.43 | Dy(WO)4.8HO |
| Ho | 643.8 | 17 | 8.23 | Ho(WO)5.4HO |
| Yb | 600.9 | 24 | 7.14 | Yb(WO)4.7HO |
| Lanthanoid Cation | Model 1/2 | N | R, Å | , Å | R, % |
|---|---|---|---|---|---|
| Gd | 1 | 3.7(5) | 1.79(1) | 0.004(1) | 8 |
| 1.2(5) | 2.19(1) | 0.007(1) | |||
| 2 | 2 (fixed) | 1.76(1) | 0.008(1) | 8 | |
| 2 (fixed) | 1.80(1) | 0.002(1) | |||
| 1 (fixed) | 2.17(1) | 0.002(1) | |||
| Dy | 1 | 3.5(5) | 1.79(1) | 0.003(1) | 9 |
| 1.2(5) | 2.18(1) | 0.008(1) | |||
| 2 | 2 (fixed) | 1.76(1) | 0.010(1) | 9 | |
| 2 (fixed) | 1.79(1) | 0.002(1) | |||
| 1 (fixed) | 2.16(1) | 0.003(1) | |||
| Ho | 1 | 3.6(5) | 1.78(1) | 0.003(1) | 12 |
| 0.8(5) | 2.13(1) | 0.003(1) | |||
| 2 | 2 (fixed) | 1.74(2) | 0.002(2) | 12 | |
| 2 (fixed) | 1.82(1) | 0.002(1) | |||
| 1 (fixed) | 2.11(1) | 0.004(1) | |||
| Yb | W L- and Yb L-edge spectra strongly overlap | ||||
| lanthanoid Cation | Model 1/2 | N | R, Å | , Å | P, % | R, % |
|---|---|---|---|---|---|---|
| Gd | 1 | 8.0(9) | 2.39(2) | 0.009(1) | - | 8 |
| 2 | 6 (fixed) | 2.38(1) | 0.009(1) | 23 | 8 | |
| 2 (fixed) | 2.40(1) | 0.009(1) | ||||
| Dy | 1 | 7.9(9) | 2.34(2) | 0.011(1) | - | 8 |
| 2 | 6 (fixed) | 2.31(1) | 0.008(1) | 58 | 9 | |
| 2 (fixed) | 2.44(1) | 0.005(1) | ||||
| Ho | 1 | 7.3(9) | 2.32(2) | 0.011(1) | - | 11 |
| 2 | 6 (fixed) | 2.30(1) | 0.008(1) | 98 | 12 | |
| 2 (fixed) | 2.45(2) | 0.004(1) | ||||
| Yb | 1 | 6.6(9) | 2.22(1) | 0.009(1) | - | 12 |
| 2 | 6 (fixed) | 2.26(1) | 0.007(1) | 5 | 15 | |
| - | - | - |
| Ln Type | Phase Preference | Comment |
|---|---|---|
| Gd | C12/c1 | Negligible proneness to hydration |
| Dy | C12/c1, | The P12/a1 phase component is prone to fast spontaneous hydration. |
| P12/a1 | The balance between C12/c1 and P12/a1 can be controlled by preparation | |
| protocol: a strictly single-phase C12/c1 can be obtained via repeated heating | ||
| Ho | P12/a1 | Rapid spontaneous hydration |
| Yb | P12/a1, | Rapid spontaneous hydration; the Pbcn phase probably corresponds to an |
| Pbcn | unhydrated or partly hydrated structure; fully hydrated samples | |
| are single-phase P12/a1 |
Publisher’s Note: MDPI stays neutral with regard to jurisdictional claims in published maps and institutional affiliations. |
© 2022 by the authors. Licensee MDPI, Basel, Switzerland. This article is an open access article distributed under the terms and conditions of the Creative Commons Attribution (CC BY) license (https://creativecommons.org/licenses/by/4.0/).
Share and Cite
Popov, V.V.; Zubavichus, Y.V.; Menushenkov, A.P.; Yastrebtsev, A.A.; Gaynanov, B.R.; Rudakov, S.G.; Ivanov, A.A.; Dubyago, F.E.; Svetogorov, R.D.; Khramov, E.V.; et al. Features of the Phase Preferences, Long- and Short-Range Order in Ln2(WO4)3 (Ln = Gd, Dy, Ho, Yb) with Their Relation to Hydration Behavior. Crystals 2022, 12, 892. https://doi.org/10.3390/cryst12070892
Popov VV, Zubavichus YV, Menushenkov AP, Yastrebtsev AA, Gaynanov BR, Rudakov SG, Ivanov AA, Dubyago FE, Svetogorov RD, Khramov EV, et al. Features of the Phase Preferences, Long- and Short-Range Order in Ln2(WO4)3 (Ln = Gd, Dy, Ho, Yb) with Their Relation to Hydration Behavior. Crystals. 2022; 12(7):892. https://doi.org/10.3390/cryst12070892
Chicago/Turabian StylePopov, Victor V., Yan V. Zubavichus, Alexey P. Menushenkov, Alexey A. Yastrebtsev, Bulat R. Gaynanov, Sergey G. Rudakov, Andrey A. Ivanov, Fyodor E. Dubyago, Roman D. Svetogorov, Evgeny V. Khramov, and et al. 2022. "Features of the Phase Preferences, Long- and Short-Range Order in Ln2(WO4)3 (Ln = Gd, Dy, Ho, Yb) with Their Relation to Hydration Behavior" Crystals 12, no. 7: 892. https://doi.org/10.3390/cryst12070892
APA StylePopov, V. V., Zubavichus, Y. V., Menushenkov, A. P., Yastrebtsev, A. A., Gaynanov, B. R., Rudakov, S. G., Ivanov, A. A., Dubyago, F. E., Svetogorov, R. D., Khramov, E. V., Tsarenko, N. A., Ognevskaya, N. V., & Shchetinin, I. V. (2022). Features of the Phase Preferences, Long- and Short-Range Order in Ln2(WO4)3 (Ln = Gd, Dy, Ho, Yb) with Their Relation to Hydration Behavior. Crystals, 12(7), 892. https://doi.org/10.3390/cryst12070892