Article

Effect of Arc Behaviour and Metal Transfer Process on Aluminium Welds during Ultrasonic Frequency Pulsed GMAW

Department Materials Processing, School of Mechanical Engineering and Automation, Beijing University of Aeronautics and Astronautics, Beijing 100191, China
*
Author to whom correspondence should be addressed.
Crystals 2022, 12(5), 586; https://doi.org/10.3390/cryst12050586
Submission received: 31 March 2022 / Revised: 15 April 2022 / Accepted: 18 April 2022 / Published: 22 April 2022
(This article belongs to the Special Issue Physical Mechanism of Welding of Metallic Materials)

Abstract

:
In order to study the influence of a novel current waveform control method of ultrasonic-frequency pulse (UFP) on arc behaviour, metal transfer process and the welds formation, monitoring system and image processing algorithms were employed for extracting the welding characters. Mechanics, defect, microstructure and mechanical property analysis based on pulsed GMAW was carried out. The results showed that, compared with the conventional pulsed GMAW, the ultrasonic-frequency pulse not only increased axial arc plasma jet force, arc force and droplet falling acceleration, but also suppressed the welded porosity formation, decelerated the microstructure regional element segregations, refined the grain and increased the microhardness property of welded joint. The study helped to reveal the mechanism for improving welding quality of ultrasonic-frequency pulsed GMAW.

1. Introduction

To improve the welding quality of gas metal arc welding (GMAW), pulsed GMAW (GMAW-P) has become pretty popular in recent years for the advantage of its controllable heat input [1,2]. Based on GMAW-P, researchers had found various methods to optimize arc behaviour and the metal transfer process in order to improve the welded joint quality, as shown below.
Pulsed-ultrasonic-assisted GMAW was analysed by Chen et al. [3,4,5]; the results showed that arc length was compressed, metal transfer frequency increased, and weld appearance and mechanical properties were improved with the growing pulsed frequency. Simon [6] compared the experimental and simulated current in the peak current phase of GMAW-P process with an evaporation-determined arc–cathode coupling model, which reconstructed the critical link between surface temperature, plasma temperature and total current transmitted. Sathishkumar et al. [7,8] proposed that double-pulsed GMAW had an increased cooling rate, refined grain, better mechanical property, and element segregation was completely precluded. Yu [9] proposed a low-heat-input double-pulse GMAW, which could produce more obvious fish-scale ripples, lower penetration, smaller and more uniform grains, and higher microhardness than double-pulse GMAW. Wu [10,11] presented a double-wire GMAW system for investigating the effects of high frequency phase shift of the double pulse on metal transfer and bead formation. Yang [12] provided with a triple-wire double pulsed GMAW process to study the arc and droplet characters, which benefited the performances of weld formation, morphology, hardness, and tensile strength. Liu [13] proposed a new method of active gases in narrow-gap GMAW-P, which was beneficial to improving the weld bead formation and welding process stability. Wang [14] found the dual GMAW-P bilateral synchronous welding was able to effectively reduce the heat input and welds deformation on the basis of weld filling.
Above all, based on GMAW-P, the results had shown the advantages of methods including assisted-field, simulation model, double-pulse, low heat input, multi wire, et al. Hence, in this work, ultrasonic-frequency pulse gas metal arc welding (UFP-GMAW) was provided as a novel current waveform control method in order to research the influence of the different current parameters on arc behaviour, metal transfer process, and the welded joint quality compared with conventional pulsed GMAW (GMAW-CP). Experiments and case studies based on GMAW-P were discussed.

2. Materials and Methods

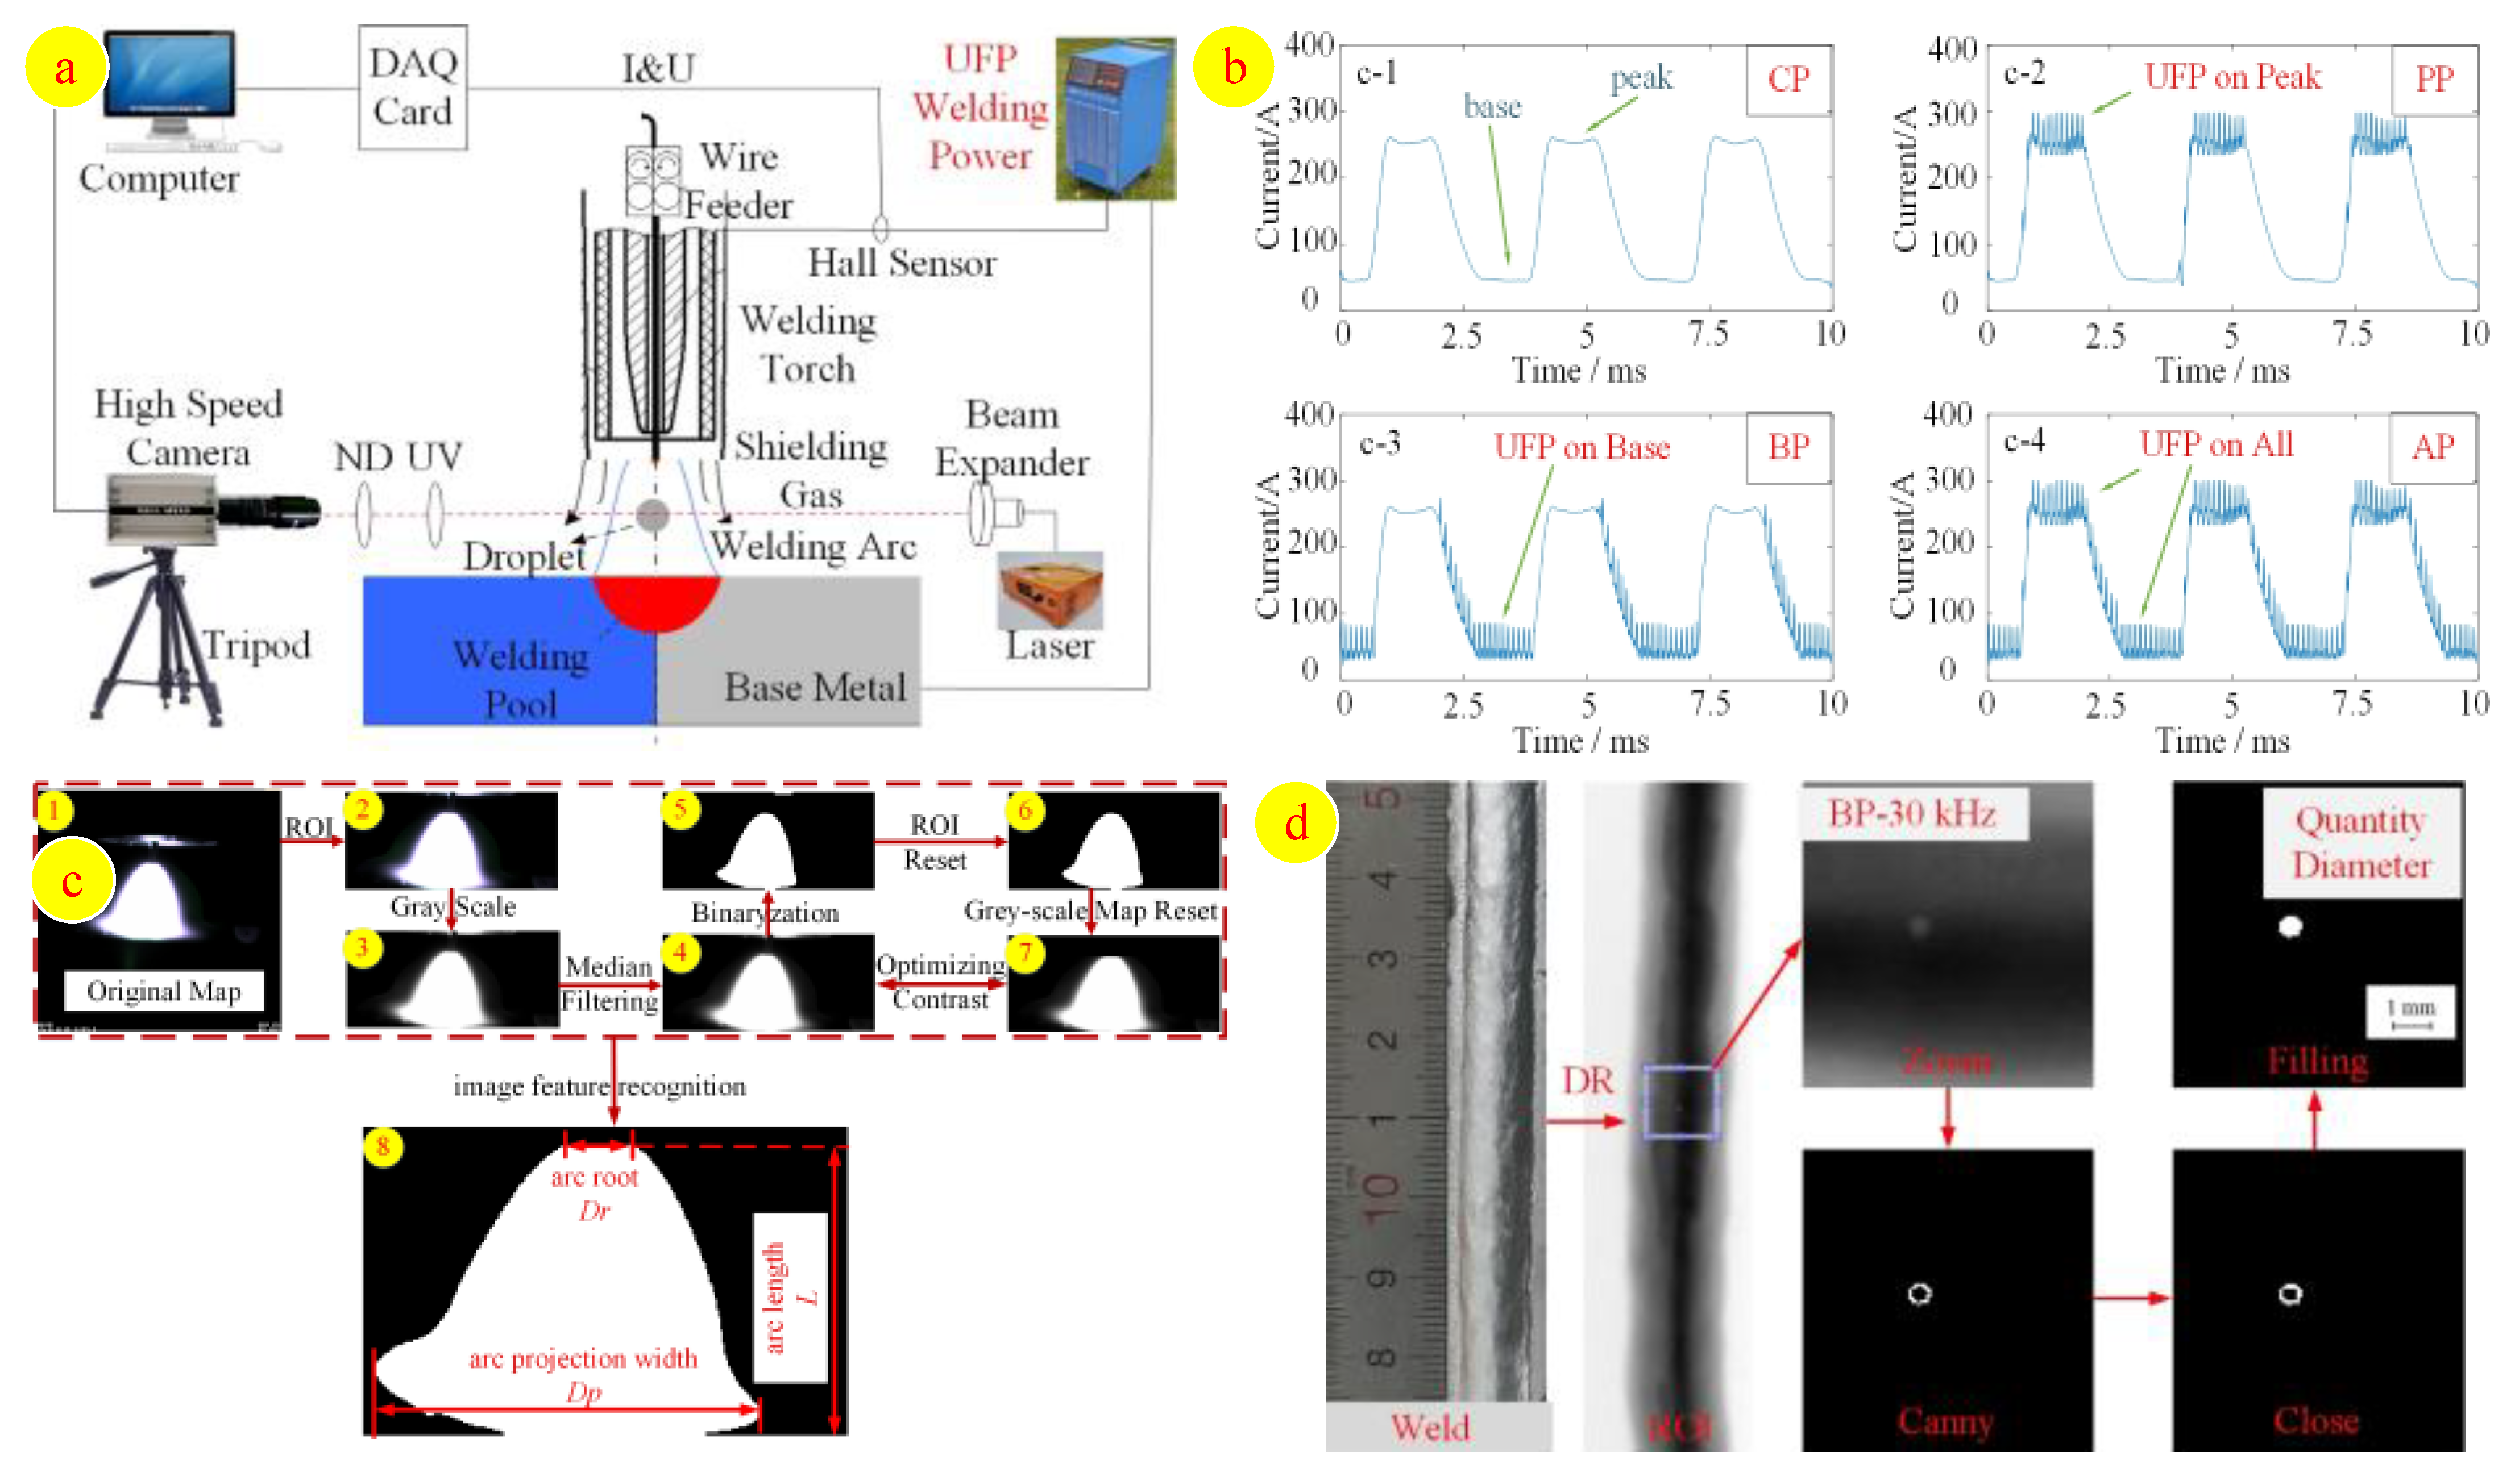
2.1. Procedure and Experiments

The visual monitoring system of the UFP-GMAW metal transfer process/arc behaviour is shown as Figure 1a, which displays the schematic diagram of the experimental monitoring system. It mainly consisted of two parts: welding system part, including UFP-GMAW power source, wire feeder, shielding gas, welding torch and the base metal, was proposed to provide with a stable welding condition. Monitoring system part, including high-speed camera, ultraviolet filter (UV), neutral-density filter (ND) and narrow band filter (NB). The near-infrared ray laser of 808 nm, PC, hall sensor and data acquisition (DAQ) card were used to acquire droplet/arc visual information and welding electrical signal. The UFP-GMAW power source was independently developed by Bojin Qi ultrasonic-frequency-pulse welding team, BeiHang Univ., China. The welding power adopted advanced switching power supply technology of ultra-fast transform square wave composite pulse, which could realize 10–100 kHz UFP current with an amplitude between 0 and 100 A.
There are four modes of UFP-GMAW current waveform control method used in this paper as shown in Figure 1b. Figure 1b(c-1) shows the conventional pulse (CP) mode, which switches the peak and base current incessantly. Figure 1b(c-2) displays the peak-time pulse (PP) mode, which hybridizes the UFP in the peak-time duration of the CP mode. Figure 1b(c-3) illuminates the base-time pulse (BP) mode, which hybridizes the UFP in the base-time duration of the CP mode. Figure 1b(c-4) is the all-time pulse (AP) mode, which hybridizes the UFP in all-time duration of the CP mode.
The key experimental parameters are shown in Table 1. Welding power source embraced an adaptive arc length control strategy [15]. Laser power was 0.529 W. High-speed-camera was working at an exposure time of 150 μs for arc, 3 μs for droplet, frame rate of 4000 fps. Base metal was 2219-C10s aluminium alloy of 200 mm × 100 mm × 4 mm with the chemical composition as shown in Table 2, the filler wire was 2319 aluminium alloys with a diameter of 1.2 mm, and the wire feed rate was 7 m/min. Pure argon was used as the shielding gas which adopted a gas flow rate of 15 L/min. Welding speed was 600 mm/min.
Microstructure samples were obtained by wire-electrode cutting, grinded and polished for scanning electron microscope (SEM) and microhardness detection. SEM was detected by zeiss-supra55 made in Germany. Microhardness was detected by FALCON500 made in Netherlands, along the middle of the welded joint cross section, from left to right in terms of ‘heat affected zone (HAZ)-fusion zone-HAZ’, the test point interval was 0.2 mm. A square conical diamond with an included angle of 136° was pressed into the material surface under the load of 1.98 N (200 g), with a lasting time of 10 s. As for optical microscope (OM), the grinded and polished samples would be etched by Keller reagent (HF: 0.5 mL + HNO3: 1.25 mL + HCl: 0.75 mL + H2O: 47.5 mL).

2.2. Image Processing Algorithms

Based on MATLAB, the images would be processed as follows.

2.2.1. Arc Shape Characters Extracting Algorithm

Detecting the effective arc edge became the main purpose in order to obtain the diameter of arc root (Dr), arc length (L) and arc projection width (Dp), as shown in Figure 1c, which are the most vital characterization parameters of the arc shape. As for Figure 1c, Figure 1c(1) is the original map captured by a high-speed camera, the regions of interest (ROI) are selected to highlight the feature areas and reduce the computational cost, as shown in Figure 1c(2), in grey in Figure 1c(3), median filtered in Figure 1c(4), the greyscale value 240 is binarized in Figure 1c(5), the ROI is reset to delete the reflections from the copper torch in Figure 1c(6), and a record of the highest point coordinate of the arc column and a reset of the grey-scale map by turning the greyscale value to 0 above the highest point is shown in Figure 1c(7). Taking a greyscale value, 100, to binarize again, as shown in Figure 1c(8), the arc column edge is finally captured; hence, the pixel values of Dr, L and Dp were easy to count.

2.2.2. Porosity Defect Characters Extracting Algorithm

The X-ray destructive detection method of direct-digit radiography (DR) is employed as shown in Figure 1d to display the porosity defect; the porosity is seen as a sphere, so its size and quantities could be extracted by image processing algorithm as follows.
Firstly, ROI was selected, zoomed. Secondly, the edge of the porosity was detected by a ‘canny’ operator, which was one of the most efficient computational theory to detect the true weak edge. Thirdly, in case of breakpoints on the edge line, close operation was employed to erode the image for connecting the breakpoint. Finally, the porosity area was obtained by filling; hence, the accurate porosity pixel information could be obtained, and the quantity and size of porosity could be captured.

3. Results and Discussion

Previous work [16] of the authors’ welding team had already displayed the example drawing of four modes (CP, PP-10 kHz, BP-10 kHz, and AP-10 kHz) real-time electrical signal of the current, voltage waveform and the corresponding arc/droplet visualization. The CP and UFP both worked in ‘one drop per pulse’ mode, in which each pulse produced a droplet. However, the UFP arc shape was obviously different from CP mode; the dynamic metal transfer processes for UFP and CP definitely had distinction. This meant that there were various characters in UFP arc/droplet, so the differences of UFP and CP were supposed to be discussed.

3.1. Arc Force

Arc force mainly consisted of electromagnetic force and plasma jet force; the arc force (Farc) could be expressed as Equation (1) [17].
F arc   =   μ 0 4 π I 2   ln D p D r
where μ0 was the permeability of vacuum, I was the welding current, and arc shape parameters Dr and Dp were supposed to be acquired by the method of image processing extracting algorithm as Section 2.2.1.
Compared with arc electromagnetic force, the plasma jet force dominated the Farc, and it was the main driving force for the droplet passing through the arc. The distribution of the axial plasma jet force showed double exponential or Gaussian. Hence, the distribution of plasma jet force of the stochastic arc axial section (Fps) could be
F ps   =   F arc   ×   e a | r |
where ‘a’ was the scale parameter of double exponential distribution curve; ‘r’ was the stochastic arc radial coordinate, which possessed the value between 0 and Dp/2. For the whole arc column, the value of arc plasma jet force (Fp) was able to be integrated as shown in Equation (3)
F p   =   0 π D p / 2 D p / 2 1 2 r   ×   F ps   ×   d r d θ   =   2 π a 2 D p 2   ×   F z 0 D p / 2 r 3 1     ( 1   +   ar )   ×   e a r d r
The axial arc force and plasma jet force could be computed by Equations (1) and (3). In particular, the value of Fp was quantized, which standard value was taken as 1 during the peak-time current of CP mode.
Compared with CP mode, the Farc (Figure 2a) and Fp quantized value (Figure 2b) under different UFP modes (PP/BP/AP), frequencies (10–40 kHz), and current duration (peak/base) are exhibited. It could clearly be seen that the curve of Farc and Fp possessed the same trend—there were just slight differences in the amplitude of curve fluctuation. There’s UFP in the peak-current duration of PP and AP modes, the arc shape was axially compressed, Fp increased by 1.57% (PP) and 2.17% (AP), respectively, on average, compared with CP mode. However, there’s no UFP in the peak-current duration of BP mode; therefore, the Farc and Fp in BP were in line with CP mode. As for base-time duration, there was a slight rise in BP and a decrease in PP/BP. In short, the consequence indicated that the UFP was capable of increasing the Farc and Fp.

3.2. Droplet Dynamics

Previous analysis [16] had calculated the droplet diameter under different UFP modes and frequencies. In addition, during the stage for droplet passing through the arc, UFP could generate a larger arc force on the droplet, increasing the droplet falling speed. Peak-time current hybridized by UFP was able to increase the droplet falling acceleration.
On one hand, the steeper slope during the peak-time current for average acceleration was able to be captured, and the droplet mass was the product of density and volume. The volume could be obtained by spherical volume formula according to the known droplet diameter value. Afterwards, monitoring value of resultant external force (Fmr) was able to be gained according to Newton’s second law. On the other hand, Fp was the dominant driving force for the droplet, which could be seen as the theoretical calculation value of resultant external force (Ftr). Comparing Fmr with Ftr, as shown in Figure 3, although two completely different methods were used for the calculation, it was remarkable that the theoretical value matched monitoring value pretty well, which proved the credibility of the results and the accuracy of the algorithm. As for the monitoring value Fmr, compared with CP mode, because there’s no UFP in the peak-time duration of BP mode, BP had little change. However, there’s UFP in the peak-time duration of PP and AP, which brought greater plasma jet force, causing the Fmr in PP and AP modes had increases of 13.58% and 21.44%, respectively.

3.3. Welds Porosity Defect

Compared with CP mode, the UFP pressure of molten pool increased because the axial arc force value was enhanced, causing the pressure of the growing gas pore in the molten pool became bigger, forcing gas pores to be extruded into an ellipsoid shape, leading to the interface radius of curvature between gas pores and molten pool wall to increase, so the gas pore was supposed to escape from the molten pool wall at once, resulting in no residual gas pores on the wall [18]. Although there was inertia while the temperature changed, the transient electromagnetic force generated by UFP passing through the molten pool possessed no inertia. Therefore, electromagnetic stirring of the molten pool, which was subject to the rapidly changing electromagnetic force, could accelerate the gas pores escape process from the molten pool.
As a result, the porosity quantities, maximum diameter of UFP modes decreased obviously as shown in Figure 4, which displays the porosity quantities (Figure 4a) and the maximum diameter (Figure 4b) in different modes and frequencies. Compared with CP mode, the porosity quantities decreased by 75% for PP, 45% for BP, 67% for AP on average, respectively. It was noteworthy that there’s no porosity at AP-20 kHz. The porosity maximum diameter decreased by 37% for PP, 18% for BP, 26% for AP, respectively.
Based on these analyses, it could be concluded that UFP was capable of decreasing the welds porosity quantities and sizes markedly.

3.4. Microstructure and Microhardness Property

Figure 5 reveals each microstructure area of the welded joint under different UFP modes and frequencies by OM/SEM. Base metal, the rolled 2219 aluminium alloy consisted of lath-like crystals, which possessed the matrix phase α-Al and second phase particles θ-Al2Cu, as shown in Figure 5a. The molten pool began to solidify at the end of the welding process; it was easy for the grains to nucleate at the wall of the molten pool, squeezing with each other and growing to form columnar crystals, as shown in Figure 5b. Nevertheless, the grains in the fusion zone centre grew without directionality, full of classical aluminium equiaxed dendrites, as shown in Figure 5c. The bond area was a partially melted zone, where the temperature distribution was extremely uneven, causing the size of fine equiaxed crystals to also be nonuniform, as shown in Figure 5d. HAZ was the unmelted zone; however, the difference in peak temperature value and duration generated various grain morphology and microstructure as shown in Figure 5e,f. HAZ near the fusion zone went through the recovery and recrystallization, leading to coarse equiaxed crystals. Nevertheless, HAZ away from the fusion zone possessed little change of deformation, which consisted of lath-like crystals.
Table 3 is the results of energy dispersive spectrometer (EDS), which is used to recognize the phase composition and distribution as shown in Figure 5c. Theoretically, the weight percentage of θ-Al2Cu was 46%(Al) and 54%(Cu); thus matrix phase α-Al was black for SEM and white for OM. A small number of particles θ-Al2Cu were diffusely distributed in the grain, which was white for SEM, black for OM. The grain boundary primarily covered α-Al+Al2Cu eutectic structure—white for SEM, and black for OM.
Because of the electromagnetic stirring effect on molten pool, UFP was capable of increasing the molten pool fluidity, improving uniformity of temperature distribution [19,20]. Thus the regional element segregations of Cu were suppressed, as shown in Figure 6, which shows the microstructure of fusion zone centre under different UFP modes. The poor Cu area was relatively white. There was a big area size and ratio of poor Cu area within the field of vision in CP mode, as shown in Figure 6a. By comparison, the inhibition effect of regional element segregations for PP, BP and AP appeared improved significantly, which predicated the fusion zone of UFP possessed a more homogeneous microstructure distribution than CP.
The vision of equiaxed dendrite in fusion zone centre captured by OM was disorderly; it’s pretty hard to recognize the boundary of each grain. In order to calculate the change degree of grain size under different UFP modes frequencies. Equiaxed crystals of HAZ near the fusion zone were adopt by the methods of average intercept, as shown in Figure 7a, redline (1,2) divided the HAZ image into three parts vertically on average, redline (3,4) horizontally. The quantities of grain boundaries which passed through four lines (P) were counted. Consequently, the average intercept length (Lavg) could be calculated, as shown in Equation (4).
  L avg = L T / PM
where LT represented total length of four lineation redlines and M revealed the magnification of microstructure image.
By calculation, the values of Lavg under different UFP modes/frequencies were shown in Figure 7b. A previous study [21] found that UFP was able to not only raise the molten pool temperature, but also improve the HAZ temperature at the same distance away from welding pool centre. Meanwhile, the higher peak temperature led to grain refinement [22] of HAZ near the fusion zone. As a result, the UFP Lavg value was obviously smaller than CP, the grain refinement degree increased by 11.27% for PP, 8.43% for BP, and 6.23% for AP on average, respectively.
In conclusion, UFP had the ability to decelerate regional element segregations, improving the homogeny of microstructure distribution. Thus, the microhardness property of the welds became better, as shown in Figure 8, which exhibits the microhardness value under different UFP modes and frequencies.
Figure 8a reveals the testing results of microhardness curve under different UFP modes and frequencies, the left and right sides of the welds show extremely high axial symmetry along the central line of fusion zone, where the minimum hardness is possessed. Because the aluminium alloy metal in fusion zone had experienced a complete melting solidification process, with the thermal cycle characteristics of fastest temperature rise, the longest peak temperature lasted a long time. A large number of elements (Cu) were segregated at the grain boundary, leading to the solute strengthening effect turned weakened. Meanwhile, the amounts of homogeneous distributed granulates (θ-Al2Cu) decreased substantially, which decreased the aging strengthening effect. As a result, the microhardness minimum values appeared at the fusion zone. The microhardness value of HAZ was situated between the microhardness values of the fusion zone and base metal. The farther the distance from fusion zone, the greater the microhardness value. However, there were areas of local maximum value (around 4.4 mm) and local minimum value (around 5.4 mm). The local maximum value area was located in the full reversion area [23], where the strengthening phase redissolved to form supersaturated solid solution, which improved the solute strengthening effect. Local maximum value area was seated in the over-aged area, where the precipitated phase was too coarse to maintain the aging strengthening effect.
Compared with CP mode, UFP modes definitely enhanced the welds microhardness of whole areas including HAZ and fusion zone, because the grain size and regional dendrite segregation played significant roles in microhardness variation. Taking the average microhardness of fusion zone as an example, as shown in Figure 8b, the value increased by 23.25% for PP, 22.49% for BP, and 24.58% for AP, respectively.

4. Conclusions

According to the test monitoring and image processing, the paper analysed a novel waveform control method of ultrasonic frequency on GTAW-P, and revealed its distinctive properties, compared with the conventional pulsed GMAW, UFP possessed the characters as below.
(1)
The axial arc plasma jet force and arc force were increased.
(2)
The average droplet falling acceleration in peak-time duration was computed to contrast with the theoretical calculated value, and the result matched each other pretty well. UFP monitoring value possessed an increase by 13.58% for PP and 21.44% for AP, respectively.
(3)
The welds porosity quantities and sizes markedly were decreased.
(4)
UFP was capable of decelerating regional element segregations, improving the grain refinement, leading to the increased microhardness property of welded joint, and relieved joint softening phenomenon. The average microhardness of UFP fusion zone increased by 23.25% for PP, 22.49% for BP, and 24.58% for AP, respectively.

Author Contributions

Conceptualization, B.Q.; methodology, H.Z., H.L. and M.Y.; software, H.Z. and H.L.; validation, H.Z., B.Q. and M.Y.; formal analysis, H.Z.; investigation, H.Z.; resources, B.Q.; data curation, H.Z. and H.L.; writing—original draft preparation, H.Z. and M.Y.; writing—review and editing, H.Z. and M.Y.; visualization, H.Z. and H.L.; supervision, B.Q.; project administration, B.Q.; funding acquisition, B.Q. All authors have read and agreed to the published version of the manuscript.

Funding

This research was funded by the National Natural Science Foundation of China [grant number U20B2031, 52075024]; The Academic Excellence Foundation of BUAA for PhD Students.

Institutional Review Board Statement

Not applicable.

Informed Consent Statement

Not applicable.

Data Availability Statement

Not applicable.

Conflicts of Interest

The authors declare no conflict of interest.

References

  1. Xu, J.; Zhou, X.; Zhu, D. Effect of Arc Length on Oxygen Content and Mechanical Properties of Weld Metal during Pulsed GMAW. Crystals 2022, 12, 176. [Google Scholar] [CrossRef]
  2. Wu, D.; Chen, Y.; Chen, H.; Chen, S. Influences of weaving parameters on dynamic characteristics and stability control of the droplet transfer in arc-weaving P-GMAW process. Int. J. Adv. Manuf. Technol. 2022, 119, 5233–5250. [Google Scholar] [CrossRef]
  3. Chen, C.; Society, A.W.; Fan, C.; Cai, X.; Liu, Z.; Lin, S.; Yang, C. Characteristics of arc and metal transfer in pulsed Ultrasonic-Assisted GMAW compared to conventional GMAW, PU-GMAW of aluminum alloy is found to reduce droplet size and increase droplet frequency. Weld. J. 2020, 99, 203s–208s. [Google Scholar] [CrossRef]
  4. Zhang, H.; Chen, C. Effect of pulse frequency on weld appearance of Al alloy in pulse power ultrasonic assisted GMAW. J. Manuf. Process. 2021, 71, 565–570. [Google Scholar] [CrossRef]
  5. Chung, V.T.-T.; Nguyen, C.T.; Bui, K.D.; Nguyen, L.H.; Van Nguyen, A.; Nguyen, H.T. Penetration and microstructure of steel joints by ultrasonic-assisted gas metal arc welding. Jpn. J. Appl. Phys. 2022, 61, 046502. [Google Scholar] [CrossRef]
  6. Simon, M.S.; Mokrov, O.; Sharma, R.; Reisgen, U.; Zhang, G.; Goett, G.; Uhrlandt, D. Validation of evaporation-determined model of arc-cathode coupling in the peak current phase in pulsed GMA welding. J. Phys. D Appl. Phys. 2021, 55, 105204. [Google Scholar] [CrossRef]
  7. Wang, L.; Xue, J. Perspective on Double Pulsed Gas Metal Arc Welding. Appl. Sci. 2017, 7, 894. [Google Scholar] [CrossRef]
  8. Sathishkumar, M.; Bhakat, Y.J.; Kumar, K.G.; Giribaskar, S.; Oyyaravelu, R.; Arivazhagan, N.; Manikandan, M. Investigation of Double-Pulsed Gas Metal Arc Welding Technique to Preclude Carbide Precipitates in Aerospace Grade Hastelloy X. J. Mater. Eng. Perform. 2021, 30, 661–684. [Google Scholar] [CrossRef]
  9. Yu, X.; Xue, J.; Shen, Q.; Zheng, Z.; Ou, N. Effect of low heat-input double-pulse gas metal arc welding on weld formation and microstructure of 6061 aluminium alloy. Sci. Technol. Weld. Join. 2022, 27, 238–249. [Google Scholar] [CrossRef]
  10. Wu, K.; Zeng, Y.; Zhang, M.; Hong, X.; Xie, P. Effect of high-frequency phase shift on metal transfer and weld formation in aluminum alloy double-wire DP-GMAW. J. Manuf. Process. 2022, 75, 301–319. [Google Scholar] [CrossRef]
  11. Wu, K.; Zhan, J.; Cao, X.; Hong, X.; Xie, P. Dynamic Metal Transfer Behavior in Double-Wire DP-GMAW of Aluminum Alloy Under Different Pulse Phases. J. Manuf. Sci. Eng. 2021, 143, 041002. [Google Scholar] [CrossRef]
  12. Yang, K.; Wang, F.; Liu, H.; Wang, P.; Luo, C.; Yu, Z.; Yang, L.; Li, H. Double-Pulse Triple-Wire MIG Welding of 6082-T6 Aluminum Alloy: Process Characteristics and Joint Performances. Metals 2021, 11, 1388. [Google Scholar] [CrossRef]
  13. Liu, G.; Tang, X.; Xu, Q.; Lu, F.; Cui, H. Effects of Active Gases on Droplet Transfer and Weld Morphology in Pulsed-Current NG-GMAW of Mild Steel. Chin. J. Mech. Eng. 2021, 34, 66. [Google Scholar] [CrossRef]
  14. Wang, C.; Zhang, H.; Yan, Z.; Zhao, Y.; Chen, S. Study on Medium-Thick Al-Alloy T-Joints by Dual P-GMAW Bilateral Synchronous Welding. Metals 2021, 11, 1794. [Google Scholar] [CrossRef]
  15. Wang, Q.; Qi, B.; Cong, B.; Yang, M. Output characteristic and arc length control of pulsed gas metal arc welding process. J. Manuf. Process. 2017, 29, 427–437. [Google Scholar] [CrossRef]
  16. Zheng, H.; Qi, B.; Yang, M. Dynamic analysis of the ultrasonic-frequency pulsed GMAW metal transfer process. J. Manuf. Process. 2021, 62, 283–290. [Google Scholar] [CrossRef]
  17. Ando, K.; Hasegawa, M. Welding Arc Phenomena; China Machine Press: Beijing, China, 1985; pp. 249–250. [Google Scholar]
  18. Yang, M.; Yang, Z.; Cong, B.; Qi, B. How ultra high frequency of pulsed gas tungsten arc welding affects weld porosity of Ti-6Al-4V alloy. Int. J. Adv. Manuf. Technol. 2015, 76, 955–960. [Google Scholar] [CrossRef]
  19. Li, L.; Yang, M.; Qi, B.; Liu, H. Study of high frequency pulsed arc on molten pool thermal properties of Ti-6Al-4V. J. Manuf. Process. 2019, 38, 308–312. [Google Scholar] [CrossRef]
  20. Yang, M.; Liu, H.; Qi, B. The surface depression and temperatures in molten pool with pulsed arc welding. J. Manuf. Process. 2018, 37, 130–138. [Google Scholar] [CrossRef]
  21. Yang, M.; Bai, R.; Zheng, H.; Qi, B. Temperature monitoring and calibration in Ti–6Al–4V molten pool with pulsed arc welding. Sci. Technol. Weld. Join. 2020, 25, 369–376. [Google Scholar] [CrossRef]
  22. Di, X.-J.; Xie, H.-J.; Chen, C.-X.; Deng, C.-Y.; Wang, D.-P. Microstructural Evolution and Softening Behavior of Simulated Heat-Affected Zone in 2219 Aluminum Alloy. Acta Met. Sin. (Engl. Lett.) 2017, 30, 1177–1184. [Google Scholar] [CrossRef] [Green Version]
  23. Zhang, D.-K.; Wang, G.-Q.; Wu, A.-P.; Shan, J.-G.; Zhao, Y.; Zhao, T.-Y.; Meng, D.-Y.; Song, J.-L.; Zhang, Z.-P. Effects of Post-weld Heat Treatment on Microstructure, Mechanical Properties and the Role of Weld Reinforcement in 2219 Aluminum Alloy TIG-Welded Joints. Acta Met. Sin. (Engl. Lett.) 2019, 32, 684–694. [Google Scholar] [CrossRef] [Green Version]
Figure 1. UFP-GMAW arc/droplet monitoring system (a), current waveforms (b), image processing method of the arc shape (c), and image processing method of the porosity (d).
Crystals 12 00586 g001
Figure 2. The curve of axial arc force (a) and plasma jet force quantized value (b).
Crystals 12 00586 g002
Figure 3. Comparison between theoretical and monitoring value of droplet resultant external force.
Crystals 12 00586 g003
Figure 4. Porosity quantity (a) and the maximum diameter (b).
Crystals 12 00586 g004
Figure 5. Microstructure of base metal (a), areas near the fusion line (b), fusion zone centre (c), bond area (d), and HAZ (e,f).
Crystals 12 00586 g005
Figure 6. Comparison of regional element segregations under different UFP modes, CP (a), PP (b), BP (c), AP (d).
Crystals 12 00586 g006
Figure 7. The average intercept length of HAZ grain, lineation method (a), value of different modes and frequencies (b).
Crystals 12 00586 g007
Figure 8. The welds microhardness (a) and its average value of fusion zone (b).
Crystals 12 00586 g008
Table 1. Current parameters of the welding power.
Test No.ModeConventional PulseUFP
Base-
Current/A
Peak-
Current/A
Peak-Time
/ms
Frequency
/kHz
Amplitude
/A
Duty Cycle
/%
1CP402501.3///
2PP40240105020
320
430
540
6BP3025010
720
830
940
10AP3024010
1120
1230
1340
Table 2. Chemical composition of the base metal.
Chemical CompositionCuMnTiMgZrVFeSiAl
mass fraction/%5.8~6.80.2~0.40.02~0.10.20.1~0.250.05~0.150.30.2Bal.
Table 3. EDS analysis results of different areas in Figure 5c (wt.%).
ElementMatrixParticleBoundary
Al96.2548.6978.92
Cu3.7551.3121.08
Publisher’s Note: MDPI stays neutral with regard to jurisdictional claims in published maps and institutional affiliations.

