Abstract
High zinc containing Al-Zn-Mg-Cu is the research focus of ultra-high strength aluminum alloy. In the present paper, the Al-Zn-Mg-Cu multi-component system is studied when the content of Zn is 10.5 wt.%, 11 wt.% and 12 wt.%, respectively. The vertical sections of phase diagrams are calculated by the thermodynamic method. The precipitation parameters of the η’ phase, including the density of precipitate, precipitate radius and volume fraction, are obtained by using the methods of kinetic calculations. The yield strength of Al-Zn-Mg-Cu alloy with different content of Zn is calculated by an empirical model containing a chemical element and a microstructure parameter. The calculated results of yield strength are verified by experimental data and provide primary guidance to developing Al-Zn-Mg-Cu ultra-high strength aluminum alloys.
1. Introduction
Ultra-high strength aluminum alloy, also known as 7xxx aluminum alloy, is one of the important structural materials in the aerospace industry [1,2]. It is the highest strength of various deformed aluminum alloys that has successfully realized commercial application. Because of its advantages of low density, high strength, good hot working performance, good corrosion resistance and low cost, it has been widely used in the fields of aerospace and transportation. Zn, Mg and Cu are the main alloying elements of ultra-high strength aluminum alloy [3,4]. In recent years, in order to meet the higher strength requirements of aerospace materials, new Al-Zn-Mg-Cu systems of ultra-high strength aluminum alloy have been developed, such as 7037 alloy, 7056 alloy, 7097 alloy and 7095 alloy. Compared with the widely used 7050 and 7055 alloys, these new alloys have higher Zn content. Zn is the main element of precipitate strengthening in ultra-high strength aluminum alloys [5,6]. The higher content of Zn, the higher the strength of the aluminum alloy. Therefore, research on Al-Zn-Mg-Cu alloys with high Zn has become a hot issue. At present, the research work on aluminum alloy with more than 9% zinc content needs to be further improved. It is well known that element Zn enhances the strength of aluminum alloy by forming a precipitate phase. The sequence for the precipitate phase is as follows: The supersaturated solid solution → GP zones →η’ phase →η phase. GP zones are coherent, while η’ is semi-coherent and η is incoherent. η’ is a metastable phase, which will change to η phase at a higher aging temperature and a longer aging time. The strength of aluminum alloy is the highest when the η’ phase precipitates during peak aging.
Thermodynamic calculations can be used to acquire the thermodynamic data, including phase diagrams and thermochemistry information [7,8]. Kinetic calculations can be coupled with the thermodynamic data to obtain the precipitation parameters of the strengthening phase during aging, such as the density, radius and volume fraction of precipitate. Using these parameters, yield strength can be calculated by empirical function. In the present paper, the phase diagrams are calculated in actual Al-Zn-Mg-Cu multi-component alloys. The precipitation parameters and yield strength are described by the relevant model quantitatively. The calculated results of yield strength are verified by experimental data and could provide suggestions for the rational design of ultra-high strength aluminum alloys with high Zn content.
2. Methodology
2.1. Thermodynamic Method of Calphad
The CALPHAD (Computer Coupled Phase Diagram and Thermochemistry) technique aims to promote thermodynamics calculation by developing models representing the thermodynamic properties of alloy phases [9,10]. The method may be used effectively to extrapolate phase diagrams of multicomponent alloy systems. The Pandat2014 [11] software is a computational tool developed on the basis of the CALPHAD and can be used to calculate the phase diagram and materials property of alloy systems by using a thermodynamic database. The PanAl thermodynamic database [12,13] contains the thermodynamic information on the present Al-Zn-Mg-Cu multicomponent system. The thermodynamic information is described by Gibbs energy functions.
In the database, the solution phase is described with a substitution solution model. The relevant Gibbs energy can be written as:
where is the Gibbs energy of phase , is the Gibbs energy of pure component , is the gas constant, is the mole fraction of the component , and is the excess Gibbs energy of the phase .
An intermetallic phase is described with sublattice models and the relevant Gibbs energy is expressed as:
where is the site fraction of the component in the sublattice , is the Gibbs energy of the end member , and is the mole fraction of the sublattice .
2.2. Model for Precipitation Kinetics
Using the model by Lager, Schwartz, Kampmann and Wagner [14,15,16,17], the isothermal precipitation process of aging can be researched. The process of precipitation can be considered as two stages—the first stage involved simultaneous nucleation and growth, and the second stage included simultaneous growth and coarsening.
The activation energy of nucleation can be expressed as:
where is the interfacial energy andis the driving force.
In the first stage of precipitation, the nucleation and growth are considered simultaneously. Based on the Becker–Doring law [18], the nucleation rate can be written as:
where is the precipitate density, is the number of atoms by unit volume, Z is Zeldovich’s factor, and is the incubation time.
And the precipitate radius is given by:
where is the precipitate radius, is the diffusion coefficient, is the current solute concentration of the matrix, is the equilibrium solute concentration of the matrix, and is the numerical factor.
In the second stage of precipitation, the growth and coarsening are considered simultaneously. The corresponding nucleation rate and precipitate radius aregiven by:
where is the coarsening fraction, and it can be written as:
2.3. Strengthening Mechanism and Model
The contribution of all hardening mechanisms should be considered in calculating yield strength. Therefore, the total strength can be described as:
where is total yield strength, and M is Taylor factor about 3 [19].
is the contribution from grain boundary strengthening, which can be described by the Hall–Petch function [20,21] as:
where is the yield strength for pure aluminum, is the Hall–Petch constant [22], is the average grain size, and is an exponent with a typical value of 0.5.
is the contribution from solid solution strengthening, which is written as [23]:
is the contribution from precipitation strengthening, which is given by:
is the contribution from work hardening, and it is described as:
where is the constant about 0.2 for Fcc structure and is the average inter-particle spacing [25], which is described as:
2.4. Experimental Procedure
According to thermodynamic, kinetic and strength calculations, three kinds of high zinc containing Al-Zn-Mg-Cu alloys are designed and the composition of these alloys is shown in Table 1. These alloys are prepared by the conventional melting and casting route, and the weight of ingot is 15 kg. Homogenization is performed at 470 °C for 60 h, and the samples are quenched into cold water. Subsequently, the ingot is transformed into a plate by an extrusion, as shown in Figure 1.

Table 1.
Composition and yield strength of alloys.
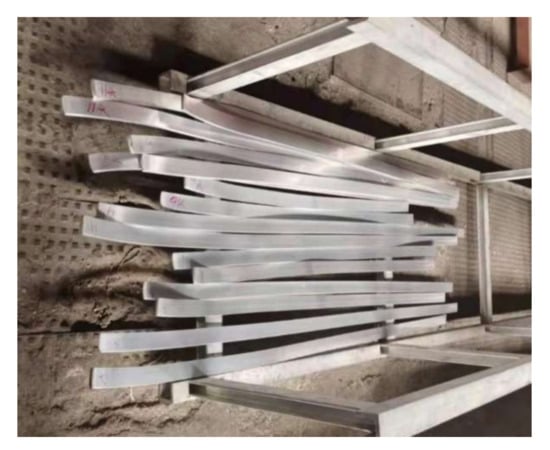
Figure 1.
The extruded plates.
Solution treatment is performed at 470 °C for 8 h, and the isothermal ageing is carried out at 120 °C for 24 h. After that, tensile samples are prepared to test the mechanical properties of alloys. Figure 2 illustrates the size of the tensile sample. Table 1 lists the composition and yield strength of the alloys.
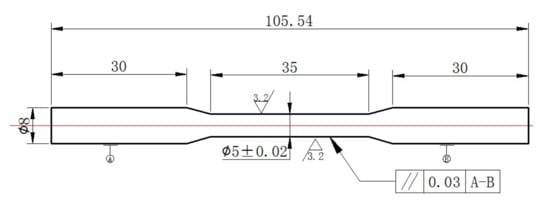
Figure 2.
The size of tensile sample.
3. Results
3.1. Thermodynamic Calculations
Using the PanAl database of Pandat software, the phase diagrams of Al-Zn-Mg-Cu multi-component systems are calculated. The effects of Mg and Cu are analyzed in an ultra-high strength aluminum alloy at a predetermined amount of 10.5 wt.% Zn, 11 wt.% Zn and 12 wt.% Zn, respectively.
Figure 3 presents vertical sections of the Al-Zn-Mg phase diagram for (a) Al-10.5Zn-xMg, (b) Al-11Zn-xMg and (c) Al-12Zn-xMg alloys with varying Mg content (1 ≤ x ≤ 3 wt.%). It can be seen that the transition line between the two phase η + Fcc region to the three phase η + Fcc + T region rises from 2.3 wt.% Mg (Al-10.5Zn-xMg; Figure 3a) to 2.4 wt.% Mg (Al-11Zn-xMg; Figure 3b) and 2.5 wt.% Mg (Al-12Zn-xMg; Figure 3c) in the ageing temperature 120 °C. According to the calculated results, the content of Mg can be set to 2.2 wt.% to avoid the harmful T phase.
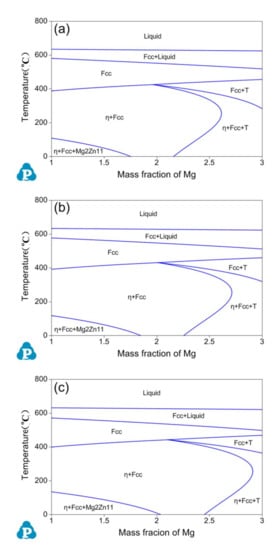
Figure 3.
Calculated vertical section of the Al-Zn-Mg phase diagram for (a) Al-10.5Zn-xMg, (b) Al-11Zn-xMg, (c) Al-12Zn-xMg.
Figure 4 shows vertical sections of the Al-Zn-Mg-Cu phase diagram for (a) Al-10.5Zn-2.2Mg-xCu, (b) Al-11Zn-2.2Mg-xCu and (c) Al-12Zn-2.2Mg-xCu alloys with different Cu content (1 ≤ x ≤ 2.5 wt.%). From the Figure, one significant situation can be observed: the single phase Fcc region disappears in the whole of the temperature when the content of Cu is higher than 1.8 wt.% (Al-10.5Zn-2.2Mg-xCu; Figure 4a), 1.7 wt.% (Al-11Zn-2.2Mg-xCu; Figure 4b) and 1.5 wt.% (Al-12Zn-2.2Mg-xCu; Figure 4c), respectively. In order to retain the single phase Fcc region for homogenization and solution heat treatment, the content of Cu is set to 1.5 wt.% uniformly and the content of Mg is designed by later calculated work.
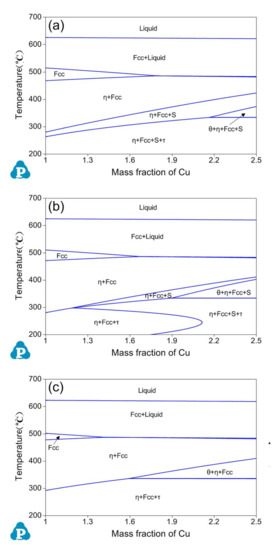
Figure 4.
Calculated vertical section of the Al-Zn-Mg-Cu phase diagram for (a) Al-10.5Zn-2.2Mg-xCu, (b) Al-11Zn-2.2Mg-xCu, (c) Al-12Zn-2.2Mg-xCu.
Figure 5 illustrates vertical sections of the Al-Zn-Mg-Cu phase diagram for (a) Al-10.5Zn-xMg-1.5Cu, (b) Al-11Zn-xMg-1.5Cu and (c) Al-12Zn-xMg-1.5Cu alloys with varying Mg content (1 ≤ x ≤ 3 wt.%). When the content of Mg reaches 2 wt.%, the width of single phase Fcc region is about 40 °C (Al-10.5Zn-xMg-1.5Cu; Figure 5a), 30 °C (Al-11Zn-xMg-1.5Cu; Figure 5b) and 20 °C (Al-12Zn-xMg-1.5Cu; Figure 5c), respectively. It can fulfill the requirement of heat treatment temperature. Therefore, three groups of composition can be obtained: Al-10.5Zn-2Mg-1.5Cu, Al-11Zn-2Mg-1.5Cu and Al-12Zn-2Mg-1.5Cu alloys.
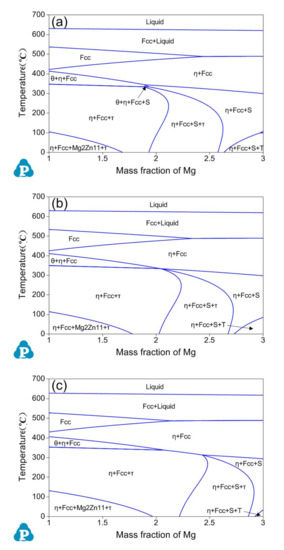
Figure 5.
Calculated vertical section of the Al-Zn-Mg-Cu phase diagram for (a) Al-10.5Zn-xMg-1.5Cu, (b) Al-11Zn-xMg-1.6Cu, (c) Al-12Zn-xMg-1.6Cu.
Figure 6 shows the microstructure of the alloy in the ageing state. A large amount of η’ phase appears in the figure, while T phase does not appear. That is because T phase is an equilibrium phase. Generally, it will not form when ageing at 120 °C.

Figure 6.
TEM micrograph of Al-11.6Zn-2.9Mg-1.9Cu at aging.
3.2. Kinetic Calculations
Based on the three alloy systems, Al-10.5Zn-2Mg-1.5Cu, Al-11Zn-2Mg-1.5Cu and Al-12Zn-2Mg-1.5Cu, the corresponding precipitation behavior of the η’ strengthening phase is modeled by the kinetic method. Especially in this calculation, these alloys are assumed to be quasi-binary systems, which means that the composition of η’ precipitate is a fixed combination of Mg and Zn.
Figure 7 represents a plot of the predicted evolution of η’ precipitate density with time at 120 °C for alloy compositions of Al-10.5Zn-2Mg-1.5Cu (10.5Zn), Al-11Zn-2Mg-1.5Cu (11Zn) and Al-12Zn-2Mg-1.5Cu (12Zn), respectively. From the figure, the curves of density can be divided into three stages. In the first stage, precipitate density rises with increasing time. In the second stage, it remains nearly constant. In the third stage, it reduces with increasing time. The situation can correspond to the process of precipitation involving nucleation, growth and coarsening. In the whole process of precipitation, the alloy with 12Zn has the highest value of the precipitate density among the other alloys. The precipitate density of alloy with 11Zn is slightly larger than the density of 10.5Zn only when the density rises to the peak value.

Figure 7.
The calculated density of η’ precipitate at 120 °C.
The change of the η’ precipitate radius with aging time at 120 °C for alloy compositions of 10.5Zn, 11Zn and 12Zn are illustrated in Figure 8. Similar to the precipitate density, the curves of precipitate radius exist in three parts involving nucleation, growth and coarsening. During the nucleation process, the precipitate radius is almost unchanged. In time of growth, it first increases quickly; afterwards, the growth rate is getting smaller and smaller. In time of coarsening, it continues to increase with a representative cubed rule nearly. Particularly, the values of three curves are very close in all precipitate times.
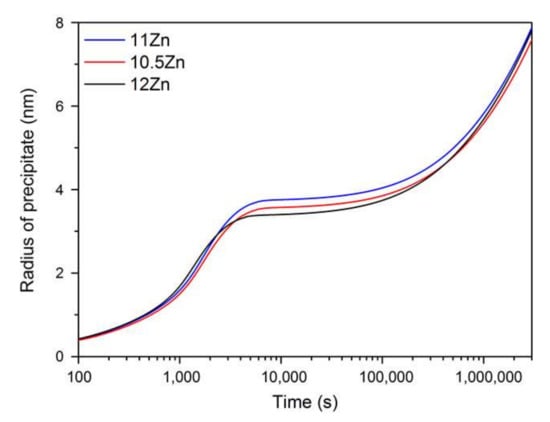
Figure 8.
The calculated radius of η’ precipitate at 120 °C.
The development of η’ precipitate volume fraction with time at 120 °C for alloy compositions of 10.5Zn, 11Zn and 12Zn is obtained as shown in Figure 9. The curves of precipitate volume are a typical S-shape. The precipitate volumes increase all the while, but the increasing rates firstly increase and then decrease with the evolution of precipitation time. Distinctly, the volume values of precipitate can be ranked from high to low as follows: 12Zn > 11Zn > 10.5Zn.

Figure 9.
The calculated volume fraction of η’ precipitate at 120 °C.
3.3. Strength Calculations
Based on the above calculated results of composition and microstructure, the evolution of yield stress with ageing time at 120 °C for different compositions of 10.5Zn, 11Zn and 12Zn are calculated by using the strength model considering grain boundary strengthening, solid solution strengthening, precipitation strengthening and work hardening as illustrated in Figure 10. It can be seen that the curves of yield strength can be divided into three stages. In the first stage, strength rises with increasing time. In the second stage, it reaches peak strength. In the third stage, it reduces with increasing time. The situation can correspond to the process of ageing involving under ageing, peak ageing and over ageing. According to the results of kinetic calculations, the increase of strength in the early stage mainly arises from the development of η’ precipitate volume fraction, and the η’ precipitate coarsening results in the decrease of strength in the late stage. Moreover, the yield strength can be listed from high to low as follows: 12Zn > 11Zn > 10.5Znin the whole ageing process.

Figure 10.
The calculated yield strength of alloy at 120 °C.
Table 1 lists the alloy compositions and corresponding yield strength, together with the experimental results. In this work, the peak strengths of alloys 10.5Zn, 11Zn and 12Zn are calculated to 710 MPa, 720 MPa and 760 MPa, respectively. The calculated results are consistent with the experiment results, with the relative deviations within ± 2%.Therefore, the calculated work is reasonable and can be used in the design of ultra-high strength aluminum alloys with high Zn content. Moreover, when the Zn content reaches 12 wt.%, it is difficult for Zn elements to dissolve completely in the process of homogenization and solid solution. Therefore, less precipitation and lower strength are formed in the ageing process than expected.
4. Conclusions
In the present paper, the Al-Zn-Mg-Cu system for ultra-high strength aluminum alloys is developed by the method of thermodynamic, kinetic and strength calculations. The following conclusions are acquired:
- (1)
- From the thermodynamic calculations, three groups of composition are acquired: Al-10.5Zn-2Mg-1.5Cu, Al-11Zn-2Mg-1.5Cu and Al-12Zn-2Mg-1.5Cu;
- (2)
- Using the kinetic calculations, the precipitation parameters of these three alloys in the whole ageing process, which is density, radius and volume fraction of η’ precipitate, are obtained;
- (3)
- Based on the strength model, the curves of yield stress at ageing are calculated and listed from high to low as follows: 12Zn > 11Zn > 10.5Zn. The peak strength of alloys accords with the experiment results.
Author Contributions
J.W.: calculation and material design. X.X.: experimental verification. All authors have read and agreed to the published version of the manuscript.
Funding
This research received no external funding.
Data Availability Statement
Not applicable.
Conflicts of Interest
The authors declare no conflict of interest.
References
- Lukasak, D.A.; Hart, R.M. Strong aluminum alloy shaves airframe weight. Adv. Mater. Processes 1991, 140, 46–49. [Google Scholar]
- Huang, L.P.; Chen, K.H.; Li, S. Influence of high-temperature pre-precipitationon local corrosion behaviors of Al-Zn-Mg alloy. Scripta Mater. 2007, 56, 305–310. [Google Scholar] [CrossRef]
- Polmear, I.J. A trace element effect in alloys based on the Aluminium-Zinc-Magnesium system. Nature 1960, 186, 303–306. [Google Scholar] [CrossRef]
- Kikuchi, S.; Yamazaki, H.; Otsuka, T. Peripheral-recrystallized structures formed in Al-Zn-Mg-Cu-Zr alloy materials during extrusion and their quenchingsensitivity. J. Mater. Process. Technol. 1993, 38, 689–690. [Google Scholar] [CrossRef]
- Fang, H.C.; Chen, K.H.; Chen, X. Effect of Cr, Yb and Zr additions on localized corrosion of Al-Zn-Mg-Cu alloy. Corros. Sci. 2009, 51, 2872–2875. [Google Scholar] [CrossRef]
- Ayer, R.; Koo, J.Y.; Steeds, J.W. Microanalytical study of the heterogeneous phases in commercial Al-Zn-Mg-Cu alloys. Metall. Trans. A 1985, 16, 1925–1927. [Google Scholar] [CrossRef]
- Meijering, J.L. Retrograde solubility curves especially in alloy solid solutions. Philips Res. Rep. 1948, 3, 281–285. [Google Scholar]
- Sundmann, B.; Jansson, B.; Anderson, J.O. Thermo-Calc database. Calphad 1985, 9, 153–190. [Google Scholar] [CrossRef]
- Dinsdale, A.T. SGTE data for pure elements. Calphad 1991, 15, 317–320. [Google Scholar] [CrossRef]
- Redlich, O.; Kister, A.T. Algebraic representation of thermodynamic properties and the classification of solutions. Ind. Eng. Chem. 1948, 40, 345–347. [Google Scholar] [CrossRef]
- Chen, S.L.; Daniel, S.; Zhang, F. The Pandat software package and its applications. Calphad 2002, 26, 175–188. [Google Scholar] [CrossRef]
- Phillips, H.W.L. Equilibrium Diagrams of Aluminum Alloy Systems, The Aluminum Development Association; Information Bulletin: London, UK, 1961; Volume 2, pp. 105–106. [Google Scholar]
- Liang, P.; Tarfa, T.; Robinson, J.A.; Wagner, S.; Ochin, P.; Harmelin, M.G.; Seifert, H.J.; Lukas, H.L.; Aldinger, F. Experimental investigation and thermodynamic calculation of the Al-Mg-Zn system. Thermochim. Acta 1998, 314, 87–90. [Google Scholar] [CrossRef]
- Langer, J.S.; Schwartz, A.J. Kinetics of nucleation in near-critical fluids. Phys. Rev. 1980, 21, 948–950. [Google Scholar] [CrossRef]
- Wagner, R.; Kampman, R. Materials Science and Technology, A Comprehensive Treatment; VCH: Weinheim, Germany, 1991; Volume 5, pp. 213–215. [Google Scholar]
- Kampmann, R.; Wagner, R. In Decomposition of Alloys: The Early Stages; Pergamon Press: Oxford, UK, 1984; pp. 91–92. [Google Scholar]
- Deschamps, A.; Brechet, Y. Influence of predeformation and aging of an Al-Zn-Mg alloy—II. Modeling of precipitation kinetics and yield stress. Acta Mater. 1998, 47, 93–95. [Google Scholar] [CrossRef]
- Russell, K.C. Nucleation in solid: The induction and steady state effects. Adv. Colloid Interface Sci. 1980, 13, 205–208. [Google Scholar] [CrossRef]
- Wagner, C. Theorie der alterung von niederschlagendurchumlosen (ostwald-reifung). Z. Electrochem. 1961, 65, 581–583. [Google Scholar]
- Hoyt, J.J. On the coarsening of precipitates located on grain boundaries and dislocations. Acta Metal. 1991, 39, 2091–2092. [Google Scholar] [CrossRef]
- Allen, R.M.; Vander, S.J.B. The oriented growth of precipitates on dislocations in Al-Zn-Mg-Part II. A model. Acta Metal. 1980, 28, 1197–1200. [Google Scholar] [CrossRef]
- Poole, W.J.; Shercliff, H.R.; Castillo, T. Process model for two step age hardening of 7475 aluminum alloy. Mater. Sci. Technol. 1997, 13, 897–904. [Google Scholar] [CrossRef]
- Kreye, H. Einflus von versetzungen auf die umlosung von teilchen. Z. Metallk. 1970, 61, 108–110. [Google Scholar]
- Ardell, A.J. On the coarsening of grain boundary precipitates zurvergroberung von korngrenzen-ausscheidungen. Acta Metall. 1972, 20, 601–602. [Google Scholar] [CrossRef]
- Ardell, A.J. Precipitation hardening. Metall. Trans. 1985, 16, 2131–2133. [Google Scholar] [CrossRef]
Publisher’s Note: MDPI stays neutral with regard to jurisdictional claims in published maps and institutional affiliations. |
© 2022 by the authors. Licensee MDPI, Basel, Switzerland. This article is an open access article distributed under the terms and conditions of the Creative Commons Attribution (CC BY) license (https://creativecommons.org/licenses/by/4.0/).