Article

Ammonia Mono Hydrate IV: An Attempted Structure Solution

SUPA, Centre for Science at Extreme Conditions, School of Physics and Astronomy, The University of Edinburgh, Edinburgh EH9 3FD, UK
*
Author to whom correspondence should be addressed.
Crystals 2022, 12(2), 135; https://doi.org/10.3390/cryst12020135
Submission received: 12 October 2021 / Revised: 7 December 2021 / Accepted: 5 January 2022 / Published: 19 January 2022
(This article belongs to the Special Issue The Structures and Transitions of Ice and Water)

Abstract

:
The mixed homonuclear and heteronuclear hydrogen bonds in ammonia hydrates have been of interest for several decades. In this manuscript, a neutron powder diffraction study is presented to investigate the structure of ammonia monohydrate IV at 170 K at an elevated pressure of 3–5 GPa. The most plausible structure that accounts for all features in the experimental pattern was found in the P 2 1 / c space group and has the lattice parameters a = 5.487 ( 3 ) Å, b = 19.068 ( 4 ) Å, c = 5.989 ( 3 ) Å, and β = 99.537 ( 16 ) deg. While the data quality limits discussion to a proton-ordered structure, the structure presented here sheds light on an important part of the ammonia–water phase diagram.

1. Introduction

The water–ammonia system is of interest for a variety of reasons. First and foremost, it is a model system in which the behaviour of materials that contain homonuclear and heteronuclear hydrogen bonds can be observed; H 2 O readily forms H-bonds with itself and with NH 3 , while NH 3 tends to donate H-bonds to H 2 O. These N-H⋯O and N⋯H-O hydrogen bonds are highly relevant as proxies for the hydrogen bonds in proteins and other biomolecules, where these H-bonds play an important role in folding, replication, and overall functionality [1]. As such, water ice and solid ammonia, as well as their three stoichiometric mixtures—ammonia hemihydrate (NH 3 · 1 2 H 2 O, AHH), ammonia monohydrate (NH 3 · H 2 O, AMH), and ammonia dihydrate (NH 3 · 2H 2 O, ADH) [2]—are important proxies for the understanding of more complex hydrogen-bonded molecules.
Of equal importance is the abundance of ammonia (15%) and water (45%) in the outer solar system. This suggests that ammonia–water is one of the main phases in this region of the solar system [3,4,5,6] and large proportions of the mantle regions of Uranus and Neptune (the “ice giants”) are likely composed of those two molecules, where they experience pressure conditions from the kbar to Mbar range (see Hubart et al. [7] and the phase diagram in Figure 1). Furthermore, their abundance on icy moons in our solar system has been confirmed [8], and NH 3 -H 2 O is presumed to feature prominently in the interiors of a large number of trans-Neptunian objects and Neptune-like exoplanets [9,10]. In this astrophysical context, ammonia is considered the most plausible planetary ‘antifreeze’ agent [11].
The flexibility of the hydrogen bond leads one to suspect that NH 3 –H 2 O mixtures, much like pure water or ammonia, should support a wide range of different phases at different pressures and temperatures, characterised by specific network topologies, density profiles, elastic and viscous properties, etc. The first visual and Raman-scattering observations made using diamond anvil cells indicated that AMH possessed no high-pressure polymorphs [12]. This assumption was proven incorrect; to date, five AMH phases have been identified: AMH-I, AMH-II, AMH-III, AMH-IV and DMA (formerly AMH VI) [2,13]. The first of the high-pressure phases, AMH-II, was characterised by Nelmes et Loveday by means of neutron powder diffraction and the pattern of AMH-II, collected at 508.9 MPa, was incorrectly indexed with an orthorhombic unit cell [14]. Finally, the structure was solved in 2009 for a diffraction pattern collected at 443 MPa and 174 K (a = 18.8680(2) Å, b = 6.9477(1) Å, and c = 6.8589(1) Å) [15].
Of the remaining three high-pressure phases, only the structure of the disordered molecular alloy phase (DMA) is known. It has been extensively studied [13] and crystallises in the cubic structure ( I m 3 ¯ m ) with the lattice parameter a = 3.273 Å. In DMA, the two possible crystallographic sites (0, 0, 0) and ( 1 2 , 1 2 , 1 2 ) are equally occupied by either an ammonia or a water molecule. Together with AMH-III (still unsolved), this structure counts towards the ‘high-temperature’ phases of ammonia monohydrate, as it can only be observed at >200 K and >270 K, respectively. The p/T phase diagram for AMH is shown in Figure 1.
Figure 1. The AMH phases diagram. For the known crystal structures, the respective unit cells are shown. Please note that broken lines do not denominate phase boundaries, but rather a line at which the respective other phase first appears. The grey lines in the background give the phase diagram of water as a reference. The melting curves and phase boundaries are taken from [13,15,16,17,18,19,20].
Crystals 12 00135 g001
In this body of work, we investigate the structure of ammonia monohydrate IV. With results based on a neutron diffraction study carried out at the ISIS neutron source, paired with density functional theory (DFT) calculations, we try to propose a possible structure solution for this—so far, unsolved—polymorph.

2. Materials and Methods

The experiment was carried out on a sample of nominal composition ND 3 · D 2 O (AMH), prepared by condensing ND 3 gas (99 atom% D from Aldrich Chemicals Co., Dorset (SP8 4XT), UK) into a Swagelock steel cylinder, which was cooled to 77 K in a bath of liquid nitrogen (LN2). The cylinder was then weighed and the contents diluted to the appropriate stoichiometry with D 2 O (Aldrich Chemicals Co., 99 atom% D). The resulting mixture was then warmed in a bath of isopropanol and liquid nitrogen at 184 K to stabilise a ND 3 · D 2 O liquid. To crystallise the AMH, the liquid was once again cooled in a bath of LN2 and the so-obtained sample was stored at these conditions; the ideal AMH stoichiometry is 48.598 wt.% ND 3 .
The sample was transported to ISIS (RAL, Oxfordshire, UK), where it was cryo-loaded into a Paris-Edinburgh press (PE-press) at PEARL [21,22]. To that purpose, the sample was ground to a fine powder under liquid nitrogen and loaded into a pre-cooled gasket. The gasket was sitting on an anvil (sintered-diamond) that was immersed in liquid nitrogen. After loading, the gasket–anvil assembly was then put into the PE-press and an initial sealing load of 5 t was applied. Data were collected for 81.2 < 2 θ < 98.8 ( L 2 = 0.8 m, 0.5 < d(Å) < 4.1, Δ d / d 0.65 %), the optimised geometry of the PE press. Second frame data were taken but the level of signal was too low to be useful [22].
Diffraction data were analysed (Le Bail, Rietveld, MCSA) using the GSAS-II software suite [23].
We also performed calculations of the enthalpies of structural candidates obtained from Rietveld refinements, using density functional theory (DFT), as implemented in the Castep code [24]. Exchange-correlation effects were described within the generalised gradient approximation (GGA) using the Perdew–Burke–Ernzerhof (PBE) functional [25] and ultra-soft pseudo-potentials or norm-conserving potentials as generated ‘on-the-fly’ by Castep with cut-off radii of 1.1 Bohr for oxygen and nitrogen, and 0.6 Bohr for hydrogen. Geometry optimisations were performed with plane wave cut-offs of 1000 eV and Monkhorst-Pack [26] k-point spacings of no more than 2 π × 0.04 Å 1 , until residual forces and stresses were below 50 meV/Å and 0.1 GPa, respectively.

3. Results

After applying a sealing load of 5 t, the sample in the PE-cell was lowered into the diffractometer. A cryostat was then used to increase the temperature of the cell and sample to 170 K. At this temperature, the load was increased incrementally to 40 t. During the pressure increase, the sample first transformed into AMH-II and then, ultimately, into AMH-IV. No pressure marker was used for this experiment to avoid parasitic lead peaks; therefore, the exact pressure is unknown. However, from previous pressure–load curves and the phase diagram of AMH, it can be deduced that the sample pressure lies between 3 and 5 GPa. Once the load of 40 t was reached, a powder pattern was recorded.

3.1. Density of Ammonia Hydrate and Initial Indexing

From the initial composition of the water–ammonia mixture and the absence of other known phases of ice, water and ammonia–water mixtures, it is evident that AMH-IV is a 1:1 mixture. This is mentioned because, in a previous study, the composition of ammonia–water phases was wrongly identified (c.f. the DMA phase in AMH and ADH) [13]).
The average volumes per molecule for ADH, AMH, and AHH at ambient pressure are, respectively, 30.170(6) Å 3 , 30.604(2) Å 3 , and 30.583(2) Å 3 [27]. These values are remarkably similar and show no obvious correlation with composition. This trend is also visible in the similarity of the equations-of-state of the high-pressure phases of both the AMH and ADH [2,15,17,19,27]. It thus seems reasonable to assume that AMH-IV also shows no significant composition dependence in its equations of state; in the pressure range from 3 to 5 GPa, it should have a density of 1.4–1.8 g/cm 3 . The content of a unit cell can be estimated from these densities.
Altogether, the data collection resulted in 15 well-defined, although broad, peaks and several heavily overlapping ones (see diffraction data below). The relatively small number of peaks imposes an upper limit on the size of unit cells that can be meaningfully tested. In this case, refinements of unit cells larger than 400 Å 3 proved to be very unstable unless a high-symmetry space group was used.
Peaks in the diffraction data were identified by fitting them with pseudo-Voigt functions, and then the GSAS-II indexing routine was run. In general, the indexing of cubic, hexagonal, and trigonal crystal systems resulted in unit cells that were too large (>1000 Å 3 ) for the dataset and, hence, were mostly discarded. This indexing resulted in 108 possible cells, not including a triclinic lattice. A Le–Bail (LB) refinement was carried out in the respective lowest symmetry space group for this crystal system to account for all possible peaks in the powder pattern. Al total of 60 cells showed promising Le–Bail fits and were used for the next step of the data analysis. Please note that most of the 60 cells had several possible space groups with higher symmetries, which fit the pattern equally well [28].

3.2. Structure Search Using Monte Carlo Simulated Annealing

In order to solve the structure for AMH-IV, initially, the GSAS-II charge flipping algorithm was used. However, charge flipping is not well-suited to neutron powder diffraction data; hence, Monte-Carlo-Simulated Annealing (MCSA) was used here. MCSA uses atoms, molecules, or molecule fragments and varies their position in the unit cell [29,30]. This is performed using a random-walk approach [31], as implemented in crystallographic software packages [23]. For the resulting structure model, the peak intensities were calculated and compared with the intensities from the Le–Bail fit. This procedure was repeated until a convergence criterion was met. As such, MCSA has the advantage that the molecules placed in the unit cell can be chosen so that the required density is 1.4–1.8 g/cm 3 . Here, the starting structures for the MCSA consisted of water D 2 O and ammonia ND 3 . Both molecules were constrained to have a fixed internal geometry and the position and orientation in the unit cell of these rigid bodies was varied.
The MCSA was considered successful if several runs converged to the same structural model. The obtained structure was then used for individual Rietveld refinements. For the initial refinement, the atoms were fixed in the molecular geometry as a rigid body. After refining their positions and isotropic displacement parameters, the restrictions were lifted and a full refinement was carried out. To double-check whether the structures were physically plausible, geometry optimisations (GO) were carried out in CASTEP. Finally, this procedure was repeated for all possible space groups of higher symmetry in the respective unit cell.

3.3. Two Structure Candidates Based on Rietveld Refinements
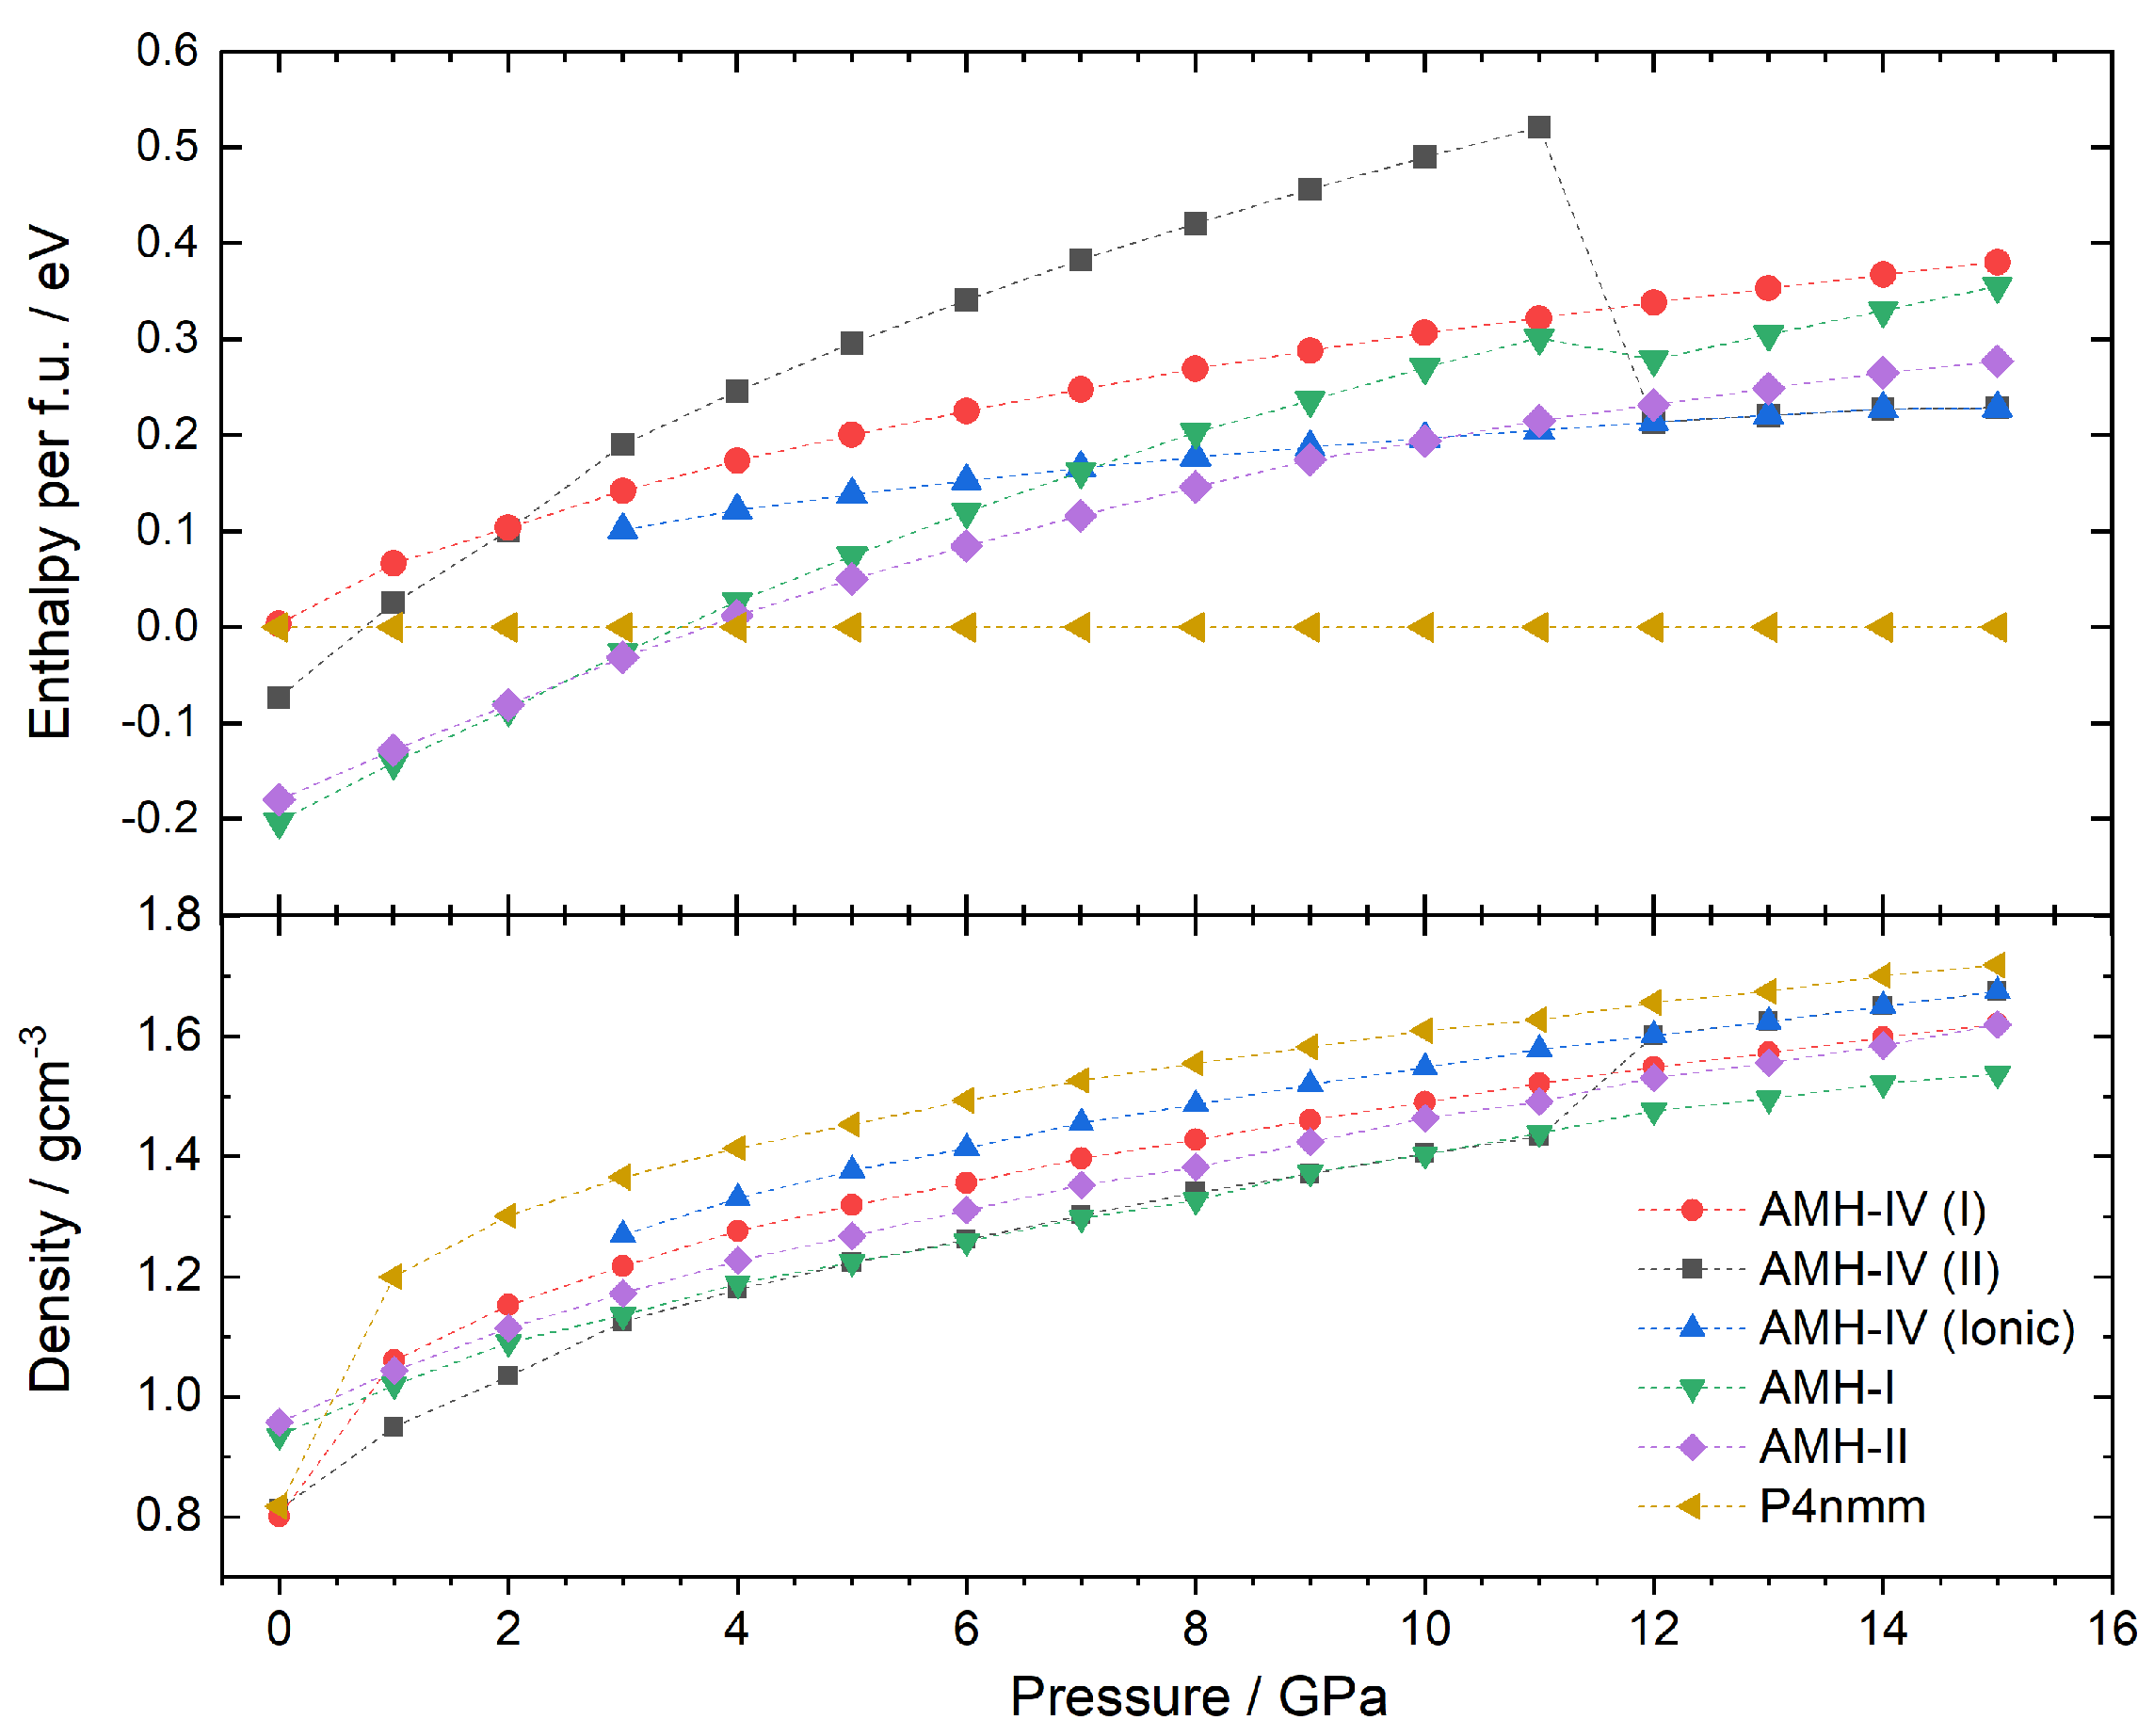
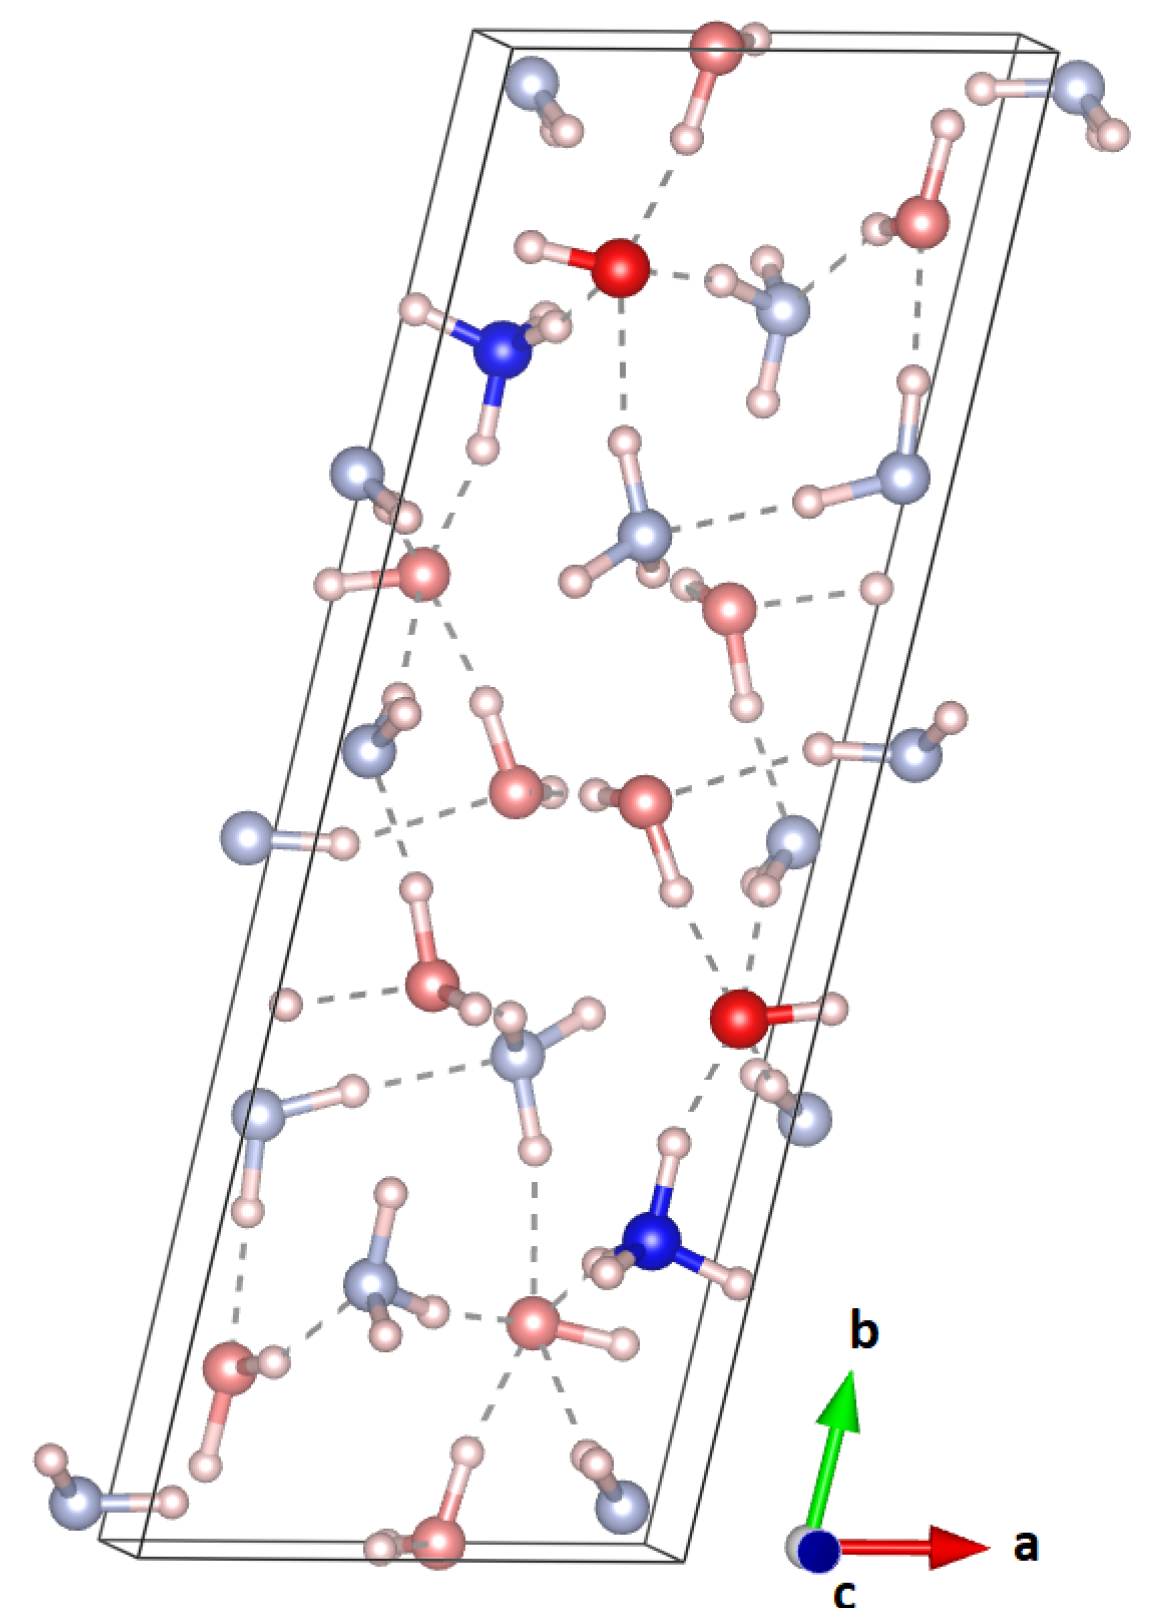
In most cases, a reasonable structure was obtained from the MCSA runs. However, the MCSA solutions often were not stable in Rietveld refinements or in GO. Here, we discuss the only two structures that fulfilled both requirements; as both candidate structures were found in the P2 1 /c space group, they are labelled P2 1 / c (I) and P2 1 / c (II).
The first cell presented here, P2 1 / c (I), had the lattice parameters a = 4.379 ( 3 ) , b = 4.502 ( 4 ) , c = 17.770 ( 5 ) , and β = 92.39 ( 2 ) deg. This structure is similar to that of AMH-II ( P b c a ). Compared to the density of AMH-II (1.190 g/cm 3 , Z = 16), its density is higher 1.52 g/cm 3 (Z = 12) [32]. The monoclinic cell deviates from an ideal orthorhombic cell by only 2.4 deg. From the MCSA in the space group P 2 1 / c , a structure model was obtained, which employed, similarly to AMH-II, a motif of partially layered ammonia and water [32]. The layers of ammonia are stacked along the c-axis at z = 0 and z = 0.5 and ammonia and water mix and intertwine between those layers. Furthermore, pure layers of ammonia and water are stacked along the a-axis. A Rietveld refinement of this structure was stable with R w = 2.784% for 32 parameters and the Rietveld fit to the data is given in Figure 2.
The structural parameters were then used as an input for a geometry optimisation in Castep; the respective enthalpy plot is shown in Section 3.4. The geometry optimisation did not result in massive shifts in molecule positions (average displacement of 0.964(3) Å of the molecular centres between the GO and the Rietveld solutions), and resulted in a physically plausible structure. To further verify that the structure is plausible, phonon calculations were carried out at the Γ -point, and resulted in real phonon frequencies only. While the Rietveld fit of the (geometry optimised) structure reproduces the main features of the experimental data (see Figure 2), many peaks—particularly in the high-Q range (d-spacings 1.3–1.9)—are poorly fitted by this structure.
The second monoclinic cell, P 2 1 / c (II), which showed promising results, has the dimensions a = 5.487 ( 3 ) Å, b = 19.068 ( 4 ) Å, c = 5.989 ( 3 ) Å, and β = 99.537 ( 16 ) deg. A Rietveld fit to the experimental data is given in Figure 3 with an overall R w of 4.451%. Compared to the structure discussed above, P 2 1 / c (II) seems to fit all main features of the diffraction pattern quite well. To further verify that the structure is plausible, phonon calculations were carried out, again sampling the Γ -point and confirming real phonon frequencies only. More details of the DFT analyses are discussed in Section 3.4 below.
Compared to the first structure, P 2 1 / c (II) does not show layers of H 2 O or NH 3 in the a c -plane (along the b-axis). However, the lattice parameters again show a resemblance to the ones of AMH-II, with the b-axis being three times as long as the a and c axis. This seems plausible, as AMH-IV is an intermediary state between AMH-II and the high-pressure phases AMH-DMA or AHH-II. A density of about 1.30 g/cm 3 was calculated for the above-mentioned lattice parameters (Z = 12). While this density is at the lower end of the reasonable densities, P 2 1 / c (II) is the most plausible structure that we were able to obtain.

3.4. Structure and DFT Study of P 2 1 / c (II)

As mentioned in the section above, the best fit to the diffraction pattern of AMH-IV resulted from a unit cell with the dimensions a = 5.487 ( 3 ) Å, b = 19.068 ( 4 ) Å, c = 5.989 ( 3 ) Å, and β = 99.537 ( 16 ) deg and the P 2 1 / c symmetry; the values were obtained from the Rietveld refinement shown in Figure 3. The overall fit resulted in R w = 4.451%, and—as stated above—accounts for nearly all features in the diffraction pattern. However, due to the limited number of well-resolved peaks and the large unit cell volume of 613.30(8) Å 3 the molecular geometry had to be fixed with rigid bodies. Furthermore, a high symmetry spacegroup had to be chosen to avoid exceeding the empirical 3 n -rule of refinable parameters. The atom positions and isotropic displacement parameters for the proposed structure of AMH-IV are summarised in Table 1.
An attempt was made to remove the rigid body restriction and reduce the symmetry of the space group to P 2 1 , both of which remained fruitless. The former resulted in unreasonable O-H and N-H distances of <0.8 Å, paired with an asymmetry in bond lengths in the H 2 O and NH 3 molecules. However, the overall structure remained intact. In the latter case of lowering the symmetry, the structure completely fell apart. Without access to additional data of better quality, these limitations are necessary and, due to these restrictions, some peaks are still not perfectly fit.
Two motifs seem to repeat in this structure: a planar quadrilateral and an “envelope shaped” quadrilateral (see Figure 4). The rings constitute of alternating NH 3 and H 2 O molecules and are interconnected by hydrogen bonds. The former are stacked along the a-axis, oriented with the two NH 3 , either up or down. The latter quadrilaterals form alternating stacks that are tilted either +25 deg relative to the b c -plane, or −25 deg relative to the b c -plane.
Please note that all considerations so far have assumed a hydrogen-ordered structure; this is based on the observation that the structures of most ammonia hydrates (AMH-I, AMH-II, ADH-I, AHH-I, AHH-II [2,19]) are ordered at the low temperature at which the data were collected; the DMA phase, on the other hand, is highly disordered [13]. The possibility that AMH-IV is also (partially) disordered, therefore, cannot be completely ruled out. This argument is further supported by the isotropic displacement parameter in the Rietveld refinement; the variation in the parameters would suggest disorder. (Please note that a refinement in which all U i s o values were fixed to 0.05 remained stable, with an R w of 5.444%). However, given the data quality and the structural complexity, it is not possible to test for disorder in a meaningful way.
The enthalpy calculations based on density functional theory were performed using the Castep code [24,33] on the ammonia monohydrate structure obtained by MCSA. Additionally, calculations were performed on the structures of AMH-I, AMH-II, and the ionic P 4 / n m m phase; the latter phase was chosen as a reference structure. To calculate stable compounds, enthalpy values H were compared according to H = U + P V , where U is the internal energy per molecule and P and V are the pressure and molecular volume, respectively. To determine the relative stability, the formation enthalpies at every pressure point from 1 to 15 GPa, relative to the reference structure at the same pressure, were plotted according to
Δ H ( P ) = H ( P ) H ( P ) r e f .
These data are shown in Figure 5. Please note that the transition pressures obtained from DFT calculations are usually higher than the ones observed in experiments.
At ambient pressure, AMH-I is the most stable compound. Upon an increase in pressure, AMH-II starts to compete with AMH-I and becomes energetically favourable at 4 GPa. This is also observed in experiments at a transition pressure of about 0.5 GPa. AMH-I, despite not being the dominant species anymore, was traced to 15 GPa. The kink in the enthalpy curve at 12 GPa indicates ionisation of two of the four water-ammonia pairs to NH 4 + and OH . The spontaneous ionisation of this form has been observed in several DFT studies before [34,35]. Between 4 and 5 GPa, Griffiths’ ionic P 4 / n m m phase becomes the energetically favourable phase and remains so for the whole pressure regime studied here. While this behaviour has been observed by Griffiths et al. as well [34], experimentally, no ionisation of this sort has been observed in AMH to date. From neutron diffraction experiments, it is known that AMH-II transforms into AMH-IV at 2.2 GPa (upon a pressure increase) or into AMH-III at 210 K (upon heating); see Loveday and Nelmes (2004) [2].
The P 2 1 / c (II) structure of AMH-IV was tracked in the same way and remains energetically unfavourable throughout the whole pressure range. This would indicate the metastability of the phase, but could also be a result of the temperature difference between the DFT-study (0 K) and the experiment (170 K). Similar to AMH-I, AMH-IV partially ionises at 12 GPa; two of the twelve formula units form NH 4 + OH pairs. The ionisation goes hand in hand with a change in lattice parameters to a = 5.79316, b = 16.59557, c = 4.67090, α = 89.5249, β = 88.4048, and γ = 76.2010 (at 12 GPa). Furthermore, a jump in energy of −0.3 eV per formula unit can be observed. This jump is remarkable, much larger than in AMH-I, despite only 2 of the 12 molecules ionising vs. 2 of the 4 in AMH-I. The reason for this is the transition to a completely new (theoretical) phase. Additionally, this structure was traced back (see red curve in Figure 5) along the pressure axis. No transition back to a purely molecular phase could be observed from 15 to 3 GPa.
Since the triclinic, partially ionic structure is energetically much more favourable, an attempt was made to use this as an input structure for a Rietveld refinement. However, the experimentally observed pattern did not match this triclinic structure at all. The unit cell of this structure can be seen in Figure 6. In this cell, α and γ deviated from a monoclinic cell by less than 4 deg. Hence, to reduce the fitting parameters, a higher symmetry, molecular equivalent of this structure in space group P 2 1 , was carefully constructed (a = 16.59557, b = 4.67090, c = 5.79316, and β = 76.2010), but this second attempt proved fruitless.

4. Conclusions

A neutron powder diffraction study was carried out to investigate the structure of ammonia monohydrate IV. To that end, a neutron diffraction pattern, collected at 170 K at an elevated pressure of 3–4 GPa, was used. Considerations based on the density of other ammonia–water phases suggest a density of 1.4–1.8 g/cm 3 and a proton-ordered structure.
The most plausible structure, which accounts for all features in the experimental pattern, was found in the P 2 1 / c space group and has the lattice parameters a = 5.487 ( 3 ) Å, b = 19.068 ( 4 ) Å, c = 5.989 ( 3 ) Å, and β = 99.537 ( 16 ) deg. DFT calculations revealed a high formation enthalpy relative to other ammonia monohydrate phases, which could indicate its metastability. Another possible explanation for this energy difference could be that the assumption of an ordered structure is wrong. A disordered structure could also explain the U i s o parameters obtained in the Rietveld refinement. However, the data quality, due to the nature of the broad and heavily overlapping reflections, was not sufficient to test disordered structures. Therefore, a proton-disordered or disordered molecular alloy variant of the structure cannot be ruled out. Finally, it is possible that too high a symmetry for the cell was chosen; this includes the possibility of a triclinic unit cell, which was not investigated based on the same data-quality reasoning as above.
To address the above-mentioned concerns in the future, an X-ray diffraction study would prove helpful. First and foremost, a diffraction pattern with less information, i.e. without information on the hydrogen positions, would simplify the search for a suitable unit cell and a structure based on X-ray data would not be affected by any hydrogen disorder.

Author Contributions

B.M. analysed the data and wrote the first draft of the manuscript. J.S.L., V.N.R. and C.G.P. carried out the experiment and J.S.L. and A.H. edited the text. B.M., L.J.C. and A.H. performed the calculations. All authors have read and agreed to the published version of the manuscript.

Funding

Computing resources provided by the UK national high-performance computing service, ARCHER2, which is partially funded by EPSRC (EP/P020194), and for which access was obtained via the UKCP consortium funded by EPSRC grant no. EP/P022561/1 and project d56 “Planetary Interiors”, are gratefully acknowledged. LJC acknowledges studentship funding from EPSRC under grant no. EP/L015110/1.

Institutional Review Board Statement

Not applicable.

Informed Consent Statement

Not applicable.

Data Availability Statement

Data was obtained at ISIS neutron source. The data presented in this study are available on request from the corresponding author.

Acknowledgments

We would like to thank Craig Bull (ISIS Facility) for his technical assistance with the experiments and the Science, Technology and Facilities Research Council for offering access to ISIS through the allocation of beamtime.

Conflicts of Interest

The authors declare no conflict of interest.

References

  1. Berg, J.M.; Tymoczko, J.L.; Stryer, L. Biochemistry, 5th ed.; W. H. Freeman: Oxford, NY, USA, 2002. [Google Scholar]
  2. Loveday, J.S.; Nelmes, R.J. The ammonia hydrates-Model mixed-hydrogen-bonded systems. High Press. Res. 2004, 24, 45–55. [Google Scholar] [CrossRef]
  3. Lewis, J.S.; Prinn, R.G. Kinetic inhibition of CO and N2 reduction in the solar nebula. Astrophys. J. 1980, 238, 357. [Google Scholar] [CrossRef]
  4. Prinn, R.G.; Fegley, B. Kinetic inhibition of CO and N2 reduction in circumplanetary nebulae-Implications for satellite composition. Astrophys. J. 1981, 249, 308. [Google Scholar] [CrossRef]
  5. Lunine, J.I.; Stevenson, D.J. Clathrate and ammonia hydrates at high pressure: Application to the origin of methane on Titan. Icarus 1987, 70, 61–77. [Google Scholar] [CrossRef]
  6. Cynn, H.C.; Boone, S.; Stevensons, D.J. Proceedings of the 19th Lunar and Planetary Science Conference; Cambridge University Press/Lunar and Planetary Institute: Cambridge, UK, 1989; Volume 1, p. 433. [Google Scholar]
  7. Hubbard, H.B.; MacFarlane, J.J. Structure and evolution of Uranus and Neptune. J. Geophys. Res. Solid Earth 1980, 85, 225–234. [Google Scholar] [CrossRef]
  8. Young, L.A.; Stern, S.A.; Weaver, H.; Bagenal, F.; Binzel, R.P.; Buratti, B.; Cheng, A.F.; Cruikshank, D.; Gladstone, G.R.; Grundy, W.M.; et al. New Horizons: Anticipated Scientific Investigations at the Pluto System. Space Sci. Rev. 2008, 140, 93–127. [Google Scholar] [CrossRef] [Green Version]
  9. Sekine, Y.; Genda, H.; Sugita, S.; Kadono, T.; Matsui, T. Replacement and late formation of atmospheric N2 on undifferentiated Titan by impacts. Nat. Geosci. 2011, 4, 359–362. [Google Scholar] [CrossRef] [Green Version]
  10. Noack, L.; Snellen, I.; Rauer, H. Water in Extrasolar Planets and Implications for Habitability. Space Sci. Rev. 2017, 212, 877–898. [Google Scholar] [CrossRef]
  11. Mousis, O.; Gautier, D.; Coustenis, A. The D/H ratio in methane in Titan: Origin and history. Icarus 2002, 159, 156–165. [Google Scholar] [CrossRef]
  12. Koumvakalis, A. High Pressure Study of Ammonia Monohydrate. Ph.D. Thesis, University of California, Los Angeles, CA, USA, 1988. [Google Scholar]
  13. Loveday, J.S.; Nelmes, R.J. Ammonia monohydrate VI: A hydrogen-bonded molecular alloy. Phys. Rev. Lett. 1999, 83, 4329–4332. [Google Scholar] [CrossRef]
  14. Nelmes, R.J.; Loveday, J.S. ISIS Experimental Report RB9859; CCLRC Rutherford Appleton Laboratory: Chilton, WI, USA, 1998. [Google Scholar]
  15. Fortes, A.D.; Suard, E.; Lemee-Cailleau, M.H.; Pickard, C.J.; Needs, R. Crystal Structure of Ammonia Monohydrate Phase II. JACS 2009, 131, 13508–13515. [Google Scholar] [CrossRef] [PubMed]
  16. Loveday, J.S.; Nelmes, R.J.; Guthrie, M.; Belmonte, S.A.; Allan, D.R.; Klug, D.D.; Tse, J.S.; Handa, Y.P. Stable methane hydrate above 2 GPa and the source of Titan’s atmospheric methane. Nature 2001, 410, 661–663. [Google Scholar] [CrossRef] [PubMed]
  17. Fortes, A.D.; Wood, I.G.; Alfredsson, M.; Vocadlo, L.; Knight, K.S.; Marshall, W.G.; Tucker, M.G.; Fernandez-Alonso, F. The high-pressure phase diagram of ammonia dihydrate. High Press. Res. 2007, 27, 201–212. [Google Scholar] [CrossRef]
  18. Wilson, C.W.; Bull, C.L.; Stinton, G.W.; Amos, D.M.; Donnelly, M.E.; Loveday, J.S. On the stability of the disordered molecular alloy phase of ammonia hemihydrate. J. Chem. Phys. 2015, 142, 094707. [Google Scholar] [CrossRef] [Green Version]
  19. Griffiths, G.I.G.; Fortes, A.D.; Pickard, C.J.; Needs, R.J. Crystal structure of ammonia dihydrate II. J. Chem. Phys. 2012, 136, 174512. [Google Scholar] [CrossRef]
  20. Dunaeva, A.N.; Antsyshkin, D.V.; Kuskov, O.L. Phase diagram of H2O: Thermodynamic functions of the phase transitions of high-pressure ices. Sol. Syst. Res. 2010, 44, 202–222. [Google Scholar] [CrossRef]
  21. Besson, J.M.; Nelmes, R.J.; Hamel, G.; Loveday, J.S.; Weill, G.; Hulld, S. Neutron powder diffraction above 10 GPa. Phys. B Condens. Matter 1992, 180, 907–910. [Google Scholar] [CrossRef]
  22. Bull, C.L.; Funnell, N.P.; Tucker, M.G.; Hull, S.; Francis, D.J.; Marshall, W.G. PEARL: The high pressure neutron powder diffractometer at ISIS. High Press. Res. 2016, 36, 493–511. [Google Scholar] [CrossRef] [Green Version]
  23. Toby, B.H.; Dreele, R.B.V. GSAS-II: The genesis of a modern open-source all purpose crystallography software package. J. Appl. Crystallogr. 2013, 46, 544–549. [Google Scholar] [CrossRef]
  24. Clark, S.J.; Segall, M.D.; Pickard, C.J.; Hasnip, P.J.; Probert, M.I.J.; Refson, K.; Payne, M.C. First principles methods using CASTEP. Z. Fuer Krist. 2005, 220, 567–570. [Google Scholar] [CrossRef] [Green Version]
  25. Perdew, J.P.; Burke, K.; Ernzerhof, M. Generalized gradient approximation made simple. Phys. Rev. Lett. 1996, 77, 3865–3868. [Google Scholar] [CrossRef] [Green Version]
  26. Monkhorst, H.J.; Pack, J.D. Special points for Brillouin-zone integrations. Phys. Rev. B 1976, 13, 5188–5192. [Google Scholar] [CrossRef]
  27. Wilson, C.W.; Bull, C.L.; Stinton, G.; Loveday, J.S. Pressure-induced dehydration and the structure of ammonia hemihydrate-II. J. Chem. Phys. 2012, 136, 094506. [Google Scholar] [CrossRef]
  28. Lebail, A. Whole Powder Pattern Decomposition Methods and Applications: A Retrospection. Powder Diffr. 2005, 20, 316. [Google Scholar] [CrossRef] [Green Version]
  29. Khachaturyan, A.; Semenovskaya, S. Statistical-Thermodynamic Approach to Determination of Structure Amplitude Phases. Sov. Phys. Crystallogr. 1979, 24, 519–524. [Google Scholar]
  30. Khachaturyan, A.; Semenovskaya, S. The Thermodynamic Approach to the Structure Analysis of Crystals. Acta Crystallogr. 1981, A37, 742–754. [Google Scholar] [CrossRef]
  31. Metropolis, N.; Rosenbluth, A.; Rosenbluth, M.; Teller, A.; Teller, E. Equation of State Calculations by Fast Computing Machines. J. Chem. Phys. 1953, 21, 1087–1092. [Google Scholar] [CrossRef] [Green Version]
  32. Fortes, A.D.; Wood, I.G.; Vocadlo, L.; Knight, K.S.; Marshall, W.G.; Tucker, M.G.; Fernandez-Alonso, F. Phase behaviour and thermoelastic properties of perdeuterated ammonia hydrate and ice polymorphs from 0 to 2 GPa. J. Appl. Crystallogr. 2009, 42, 846–866. [Google Scholar] [CrossRef]
  33. Payne, M.C.; Teter, M.P.; Allan, D.C.; Arias, T.; Joannopoulos, J.D. Iterative minimization techniques for ab initio total-energy calculations-molecular-dynamics and conjugate gradients. Rev. Mod. Phys. 1992, 64, 1045–1097. [Google Scholar] [CrossRef] [Green Version]
  34. Griffiths, G.I.G.; Misquitta, A.J.; Fortes, A.D.; Pickard, C.J.; Needs, R. High pressure ionic and molecular crystals of ammonia monohydrate within density functional theory. J. Chem. Phys. 2012, 137, 064506. [Google Scholar] [CrossRef] [PubMed] [Green Version]
  35. Robinson, V.; Wang, Y.; Ma, Y.; Hermann, A. Stabilization of ammonia-rich hydrate inside icy planets. Proc. Natl. Acad. Sci. USA 2017, 114, 9003–9008. [Google Scholar] [CrossRef] [PubMed] [Green Version]
Figure 2. (Left): Rietveld fits to experimental data and respective structures for the monoclinic cell P 2 1 / c (I) with a = 4.379 ( 3 ) , b = 4.502 ( 4 ) , c = 17.770 ( 5 ) , and β = 92.39 ( 2 ) deg. Grey (red, blue) graphs represent diffraction data (Rietveld fits, residuals). Orange ticks represent peak positions of P 2 1 / c (I), blue ones parasitic peaks from anvils. (Right): The model obtained from the Rietveld refinement. Red (blue, white) spheres represent oxygen (nitrogen, hydrogen) atoms.
Crystals 12 00135 g002
Figure 3. (Left): Rietveld fits to experimental data and respective structures for the monoclinic cell P 2 1 / c (II) with a = 5.487 ( 3 ) Å, b = 19.068 ( 4 ) Å, c = 5.989 ( 3 ) Å, and β = 99.537 ( 16 ) deg. (Right): The model obtained from the Rietveld refinement. Data representation as explained in the caption of Figure 2.
Crystals 12 00135 g003
Figure 4. Reduced structure without hydrogen/deuterium along the unique axis (b-axis). The unit cell is indicated by a grey rectangle. Two structural motifs repeat along this axis, a planar quadrilateral and an ‘envelope shaped’ quadrilateral.
Crystals 12 00135 g004
Figure 5. Enthalpy per formula unit and densities of the ammonia monohydrate phases AMH–I, AMH–II, Griffiths’ P 4 / n m m phase and the P 2 1 / c structures of AMH–IV as a function of pressure. AMH–IV (II) spontaneously ionises at 12 GPa and changes its unit cell.
Crystals 12 00135 g005
Figure 6. Unit cell of the triclinic, partially ionic structure obtained from DFT; the ionic units are highlighted. This structure does not fit the experimentally observed powder pattern.
Crystals 12 00135 g006
Table 1. Atom site, position and isotropic displacement parameters for AMH-IV in space group P 2 1 / c (II); lattice parameters a = 5.487 ( 3 ) Å, b = 19.068 ( 4 ) Å, c = 5.989 ( 3 ) Å, and β = 99.537 ( 16 ) deg.
AtomSitexyzU iso
D14e0.062(9)0.433(4)0.724(9)0.165(15)
D24e−0.105(9)0.394(4)0.522(9)0.165(15)
D34e0.545(6)0.5092(18)0.266(5)0.006(5)
D44e0.388(6)0.5531(18)0.069(5)0.006(5)
D54e0.372(5)0.2823(12)0.558(3)0.177(16)
D64e0.343(5)0.2607(12)0.285(3)0.177(16)
D74e0.288(5)0.3429(12)0.359(3)0.177(16)
D84e0.986(5)0.2022(12)0.838(3)0.066(8)
D94e0.755(5)0.2596(12)0.776(3)0.066(8)
D104e0.733(5)0.1949(12)0.960(3)0.066(8)
D114e0.644(5)0.370(2)1.032(7)0.021(7)
D124e0.747(5)0.294(2)1.105(7)0.021(7)
D134e−0.032(4)0.9612(7)0.112(4)0.026(6)
D144e0.212(4)0.9968(7)0.275(4)0.026(6)
D154e−0.053(4)0.9870(7)0.375(4)0.026(6)
N14e0.274(5)0.2912(12)0.401(3)0.177(16)
N24e0.798(5)0.2084(12)0.815(3)0.066(8)
N34e0.024(4)0.9980(7)0.234(4)0.026(6)
O14e0.048(9)0.419(4)0.566(9)0.165(15)
O24e0.440(6)0.5501(18)0.231(5)0.006(5)
O34e0.599(5)0.321(2)1.054(7)0.021(7)
Publisher’s Note: MDPI stays neutral with regard to jurisdictional claims in published maps and institutional affiliations.

