Abstract
The standard production route for mild steels for automotive purposes is still based on conventional continuous casting (CC) and hot strip rolling (HSR). The current trend towards the “zero-carbon car” will demand the abating of material emissions in the future. Thin slab casting and direct rolling (e.g., Arvedi endless strip production (ESP)) is an approach to reduce CO2 emissions by 50% compared to CC and HSR. One of the main limitations in applying ESP for the production of ultra-low carbon/interstitial free (ULC/IF) steels is clogging. Clogging is the blockage of the submerged entry nozzle due to the build-up of oxide layers or an oxide network. The high clogging sensitivity of IF steels results most probably from the FeTi addition, and hence, a general change of the deoxidation practice might be an option to overcome these problems. In the present work, the thorough refining process of ULC steel was simulated by addressing the different deoxidation routes and the influence of titanium (Ti) alloying on steel cleanness. The developed ladle furnace (LF) and the Ruhrstahl Heraeus (RH) refining models were applied to perform the simulation. Before the simulations, the models are briefly described and validated by the published industrial data.
1. Introduction
Ultra-low carbon (ULC) steel is widely applied because of the high ductility and high surface quality for the production of cars, white goods, and drawn-and-ironed (D&I) cans. The requirement of ULC steel quality is progressively increasing. Ladle furnace treatment (LF) followed by Rurhstahl Heraeus (RH) refining is the typical process route. It is necessary to control aspects in the steel refining process, such as minimizing the size and the number of nonmetallic inclusions generated during the deoxidation refining process, reducing alloy loss, and depressing clogging problems. In this section, process modeling and simulation are introduced to better understand standard operation practice and the metallurgical reactions and to offer optimum strategies for economically producing high-quality steel.
Numerous models on LF and RH processes have been proposed to study the steel refining reactions. The representative LF models were compared in the former study [1]. It was summarized that commercial thermodynamic databases were widely applied to consider the multiphase reactions; the reaction kinetics were calculated based on double film theory and the effective equilibrium reaction zone (EERZ) method; all the simulations were evaluated by comparing with the industrial data, and the strong agreement indicated the validation of the models. When modeling the RH process, besides the steel/slag reaction in the ladle, degassing and decarburization reactions in the vacuum vessel are necessarily addressed. Van Ende et al. proposed a kinetic model that first considered the reactions in both the RH vacuum vessel and the ladle [2]. FactSageTM Macro was applied to perform a thermodynamic equilibrium calculation of multiphase reactions. The EERZ concept and former numerical simulations were also used to construct the model. The predicted [C] and [O] concentration profiles using the model agreed well with the industrial data under various operational conditions. The simulations suggested that O was transferred from slag to steel after deoxidation. The other simulations on RH decarburization and the degassing mechanism also offered valuable references for developing the modeling work [3,4,5,6,7,8,9,10]. These studies suggested that the decarburization’s main reaction sites in the RH process are the Ar bubble surface, the bath surface, and inside the bath of the vacuum chamber. The application of the thermodynamic databases brought a new development of RH refining modeling, which enables simulation of the process in a more comprehensive manner.
The through-process simulation of the secondary refining of steel is rarely reported, though various individual models on the LF and RH process were developed and applied to address the specific topics. The present work aimed to develop a comprehensive and through-process model to simulate the secondary refining process. The model considers the various operations and metallurgical phenomena in the individual metallurgical stations. In the former study, LF and RH process models were constructed along with linking applicable metallurgical models to thermodynamic databases [11]. In the present study, the refining process of ULC steel was simulated using the developed model. The thorough process model of LF and RH refining was briefly described and validated by the published industrial data. Different deoxidation routes of ULC steel were investigated and discussed. The simulations addressed the influence of carbon pre-deoxidation and FeTi addition on the Al deoxidized steel refining.
2. Model Description
The modeling work was based on the coupling of the mass transfer of steel/slag, inclusions, and lining material into the EERZ with thermodynamic databases. The thermodynamic library—ChemApp—was applied to link the source code to the database from FactSage or self-optimized ones [12,13]. The source code was programmed in FORTRAN. In the model, thermodynamic databases were applied to perform the multiphase equilibrium calculation. The EERZ method was used to describe the kinetics of the reactions [2]. Figure 1 displays the schematics of the LF and RH process models. As shown in Figure 1a, the following reactions and phenomena are considered for LF refining: (1) steel/slag reaction, (2) lining dissolution to steel, (3) inclusion floating, (4) lining dissolution into slag, (5) alloy additions, (6) and air absorption. In the steel/slag reaction, the mass transfer coefficient of steel was calculated by Equations (1) and (2) [14]; the slag’s mass transfer coefficient was assumed to be one tenth of the value for steel [14]. The inclusion floating rate (3 in Figure 1a) was estimated using Equations (2) and (3) [15]. The inclusion removal rate was further modified by multiplying the exponent item () to consider the influence of the inclusion content. It was assumed that the inclusion could not be removed when its content () was lower than the critical value ().The mass transfer coefficient and the inclusion floating rate are stirring dependent, which is also assumed for the RH refining process. Lining dissolution (2 and 4 in Figure 1a) and air absorption (6 in Figure 1a) are simply accounted for by empirical rate factors.
where, (ms−1) is the mass transfer coefficient of steel; (Wt−1) is the stirring energy of steel; (m) is the height of the steel bath; (mol−1) is the number of moles of blowing Ar; (Jmol−1) is the gas constant; (K) is the temperature; (t) is the mass of the liquid steel; (Pa) and (Pa) are the gas pressure at the bottom and surface of the ladle, respectively; (s−1) is inclusion floating rate; is the content of one inclusion type; and is the critical content of one inclusion type.
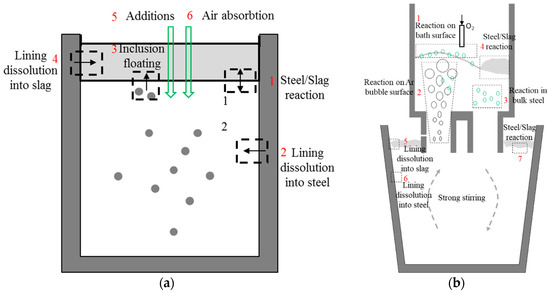
Figure 1.
Schematics of the (a) LF and (b) RH refining.
In Figure 1b, it is found that the reactions for decarburization (1 to 3) and the steel/slag reaction (4) in the vacuum vessel were accounted in addition to the reactions in the ladle (5 to 7) for the RH modeling. The oxygen blowing operation was also included in the model. The three reaction sites of decarburization and degassing were: (1) the bath surface, (2) the argon (Ar) bubble surface, and (3) the bulk steel in the vacuum vessel. According to the EERZ method, the effective volume of the steel for the decarburization reactions was necessarily defined. For the reactions at (1) the bath surface and (2) the argon (Ar) bubble surface, the effective volume of steel was defined by the surface area and the mass transfer coefficient of carbon (), as given in Equations (4) and (5). In (1) the bath surface reaction, the bath surface area () was significantly enlarged because of the vigorous stirring, gas formation, and oxygen blowing, and an effective factor ( in Equation (4)) was introduced to account for the effects. For the reaction at (2) the Ar bubble surface, the surface area of the Ar bubble was determined by the flow rate () and the mean radius of the lifting gas, which is determined empirically. The effective reaction volume () inside (3) the bulk steel was determined by the height of the gas starting to form () and the cross area of the vacuum vessel as given in Equation (6) [3]. The gas formation was set as the partial pressure of the gas (), which was larger than the total pressure of that at the half reaction depth () and the critical pressure for the formation (), as described in Equation (7). A process parameter () was introduced to account for the favorable effects of the formed gas, which should be further defined according to different practices. After the simulation has started, the steel is pumped into the vacuum vessel. The volume of steel in the vacuum vessel was empirically assumed based on the dimensions. The recirculation rate of steel in the vacuum vessel () was calculated using Equation (8), which was summarized empirically by Kuwabara et al. [3]. The treatment of the reactions (5 to 7) in the ladle is similar to those in the LF refining model.
where, , , and (m3) are the effective reaction volumes for the reaction at the bath surface, the Ar bubble surface, and inside the bath, respectively; (s) is the time step for the calculation; (m·s−1) is the mass transfer coefficient of carbon; is an effective factor to enlarge the surface area: when there is no oxygen blowing, , and when oxygen is blowing, [6,9]; (m2) is the cross area of the RH vacuum vessel; (m3·s−1) is the flow rate of the lifting gas (Ar); (m) is the mean radius of the lifting gas; (m) is the height of the gas starting to form; (m·s−1) is a process parameter to consider the influence of the formed gas; (Pa) is the pressure in the vacuum vessel; (Pa) is the critical formation pressure of CO; (Pa) is the partial pressure of the gas; (kg·m−3) is the density of liquid steel; (m·s−2) is the acceleration due to gravity; (t·min−1) is the recirculation rate of steel in the vacuum vessel; (m) is the inner diameter of the up-snorkel; and (Pa) is the pressure at the lifting gas blowing position.
The model predictions were compared with the reported industrial data to illustrate the validity of the proposed LF and RH models. The ladle metallurgy process for four heats from ArcelorMittal Dofasco was simulated under the production conditions [15,16]. The compositions of steel and slag after LF refining are compared in Figure 2 where the calculated and measured values are corresponding to the vertical and horizontal axis, respectively. The exact fitting of the calculated and measured value leads to the scatter located in the dash line with a 45° angle to the horizontal axis. From Figure 2a,b, it is found that the predicted steel and slag compositions agree well with the industrial data. Figure 2b shows that the maximum discrepancy of slag compositions is within three percentage points. Figure 3 displays the comparison of the calculated (vertical axis) and measured (horizontal axis) [C] and [O] concentrations during the RH treatment. The reported industrial data were from POSCO, including the RH refining process with various oxygen blowing strategies [2,9]. Note that the final [C] concentration was compared, and the [O] concentration was the value during the RH treatment and before the final melt deoxidation. It was found that the calculated [C] and [O] concentrations during the RH treatment are in reasonable agreement with the measurements. The maximum difference was within 20 ppm. Overall, the agreement of the predictions and the industrial data was acceptable when considering the complexity of the refining process.
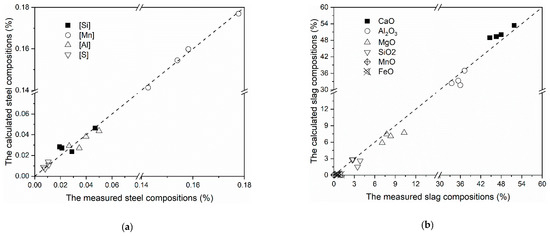
Figure 2.
The comparison of the calculated and measured final compositions in (a) steel (b) slag after LF refining (“[]” indicates dissolved value) [15,16].
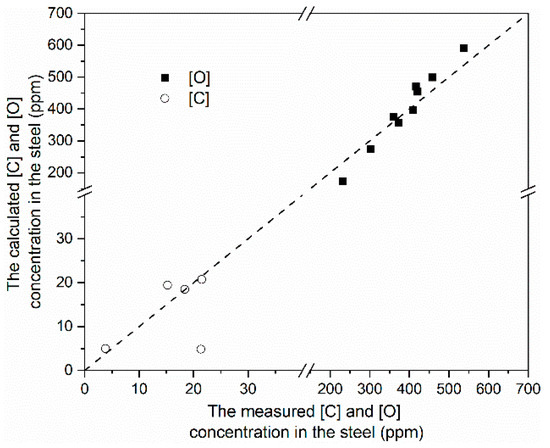
Figure 3.
The comparison of the calculated and measured [C] and [O] concentrations during the RH treatment (“[]” indicates dissolved value) [2,9].
3. Simulation of the Refining Process of ULC Steel
The refining process of ULC steel, consisting of LF and RH treatment, was simulated for different deoxidation strategies. The typical European production route for ULC steel is based on the decarburization of non-deoxidized steel in RH and subsequent deoxidation with Al at the late stage of RH treatment [17]. The simulations were targeted to theoretically evaluate the influence of carbon pre-deoxidation followed by Al deoxidation compared to the single Al deoxidation for the inclusion population (volume fraction). Ti is widely applied to stabilize ULC steel, which is realized by FeTi addition after deoxidation. It is known that Ti-stabilized ULC steel has a higher clogging tendency [18,19]. FeTi addition on the inclusion content in ULC steel was also discussed based on the simulation results.
For the simulations, the steel and slag compositions before the refining were assumed as listed in Table 1. The Fe concentration was 99.772 in mass percent (% mass). Note that the steel and slag were not necessarily in an equilibrium state before refining. Table 2 lists the mass of steel, slag, and the additions in the different simulations. Simulation A was performed under the assumption of only Al deoxidation after RH, while simulation B was performed with the addition of 80 kg carbon for pre-deoxidation during tapping and less Al addition to achieve a similar final Al concentration in the steel; simulation C was designed to study the influence of FeTi addition. The defined mass of Al addition was to acquire approximately 0.04% Al in steel after deoxidation, and Ti concentration was assumed to be close to that of Al by alloying. The ladle size was chosen to be 270 tons, and the ladle treatment and the RH refining process for the three cases were simulated. The stirring with Ar was also considered, assuming a constant flow rate of 1.2 N·m3/min overall for the LF refining process. The mass of steel in the RH vessel was chosen as 21 tons based on the numerical simulation, which is specific to the RH process at POSCO Gwangyang Work [2]. When the RH construction (e.g., size) changes, the steel content in the RH chamber will vary. The LF refining time for all the simulations was 600 s (10 min). The RH treatment time was 1000 s for simulation A, whereas the refining time was 1300 s (21.7 min) for simulations B and C. As tapping was not considered in the simulations, carbon was added at the beginning of the LF process (5 s). Al was added at 1320 s (22 min), which was 720 s (12 min) after the RH refining, and FeTi was alloyed at 1680 s (28 min) (360 s after Al deoxidation), as shown in Figure 4 [17]. Figure 4 also displays the assumed changes in pressure in the vacuum vessel and the flow rate of lifting gas and blowing oxygen during the RH process, which referred to the published data from Van Ende et al. [2]. The oxygen blowing was performed to between 660 s (11 min) and 840 s (14 min) at a rate of 17 N·m3/min. All the modeling parameters used for the following simulations were the same. Note that the steel/slag reaction in the vacuum vessel (reaction 4 in Figure 1b) was ignored because the slag was transported back to the ladle within a short time of the treatment.

Table 1.
The compositions of steel and slag before the refining (% mass).
Table 2.
The mass of steel, slag, and the additions in the different simulations.
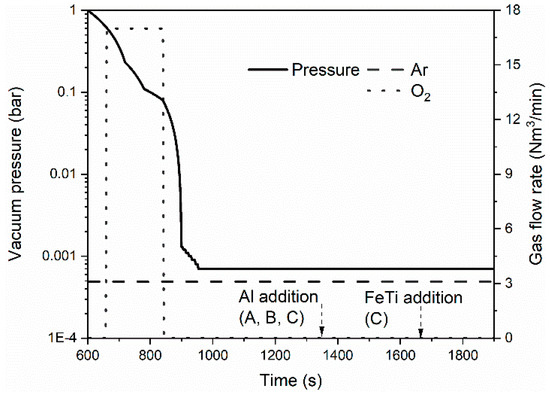
Figure 4.
The assumed pressure, oxygen, and Ar flow rates for RH treatment [2].
3.1. Influence of Pre-Deoxidation by Carbon
In this section, simulations A and B were compared to study the influence of carbon pre-deoxidation. The calculated results are shown in Figure 5, Figure 6, Figure 7, Figure 8 and Figure 9. Figure 5 displays the steel composition changes in the refining process. From Figure 5, it is found that carbon pre-deoxidation (simulation B) results in the distinct concentration difference of [O], [C], and [Mn]. In contrast, [Al] concentrations are close because of less Al addition when performing pre-deoxidation. Note that there is an initial equilibrium calculation of steel and slag in both simulations A and B before the refining and gas and inclusion phases are generated. This leads to the [C] concentration being decreased from 0.03% to 0.027%, whereas the [Mn] concentration decreased from 0.1% to 0.092%, and the [O] concentration decreased from 0.08% to 0.062%. After the refining started, the [C] and [Mn] concentrations sharply increased once carbon was added in simulation B (Figure 5a). In contrast, the [O] concentration decreased because of the deoxidation reaction by [C] (Figure 5b). The increase in the [Mn] concentration in simulation B was caused by [C]’s reduction in the formed inclusions, as referred to in Figure 8. In the later LF refining process, the [C] and [Mn] concentrations in simulation B were higher than those in simulation A, whereas the [O] concentration was lower. The steel composition in simulations A and B changed similarly: the [C] concentration remained the same, whereas the [Mn] concentration increased at a lower rate because of the Mn transfer from slag to steel, and the [O] concentration gradually decreased because of the steel/slag reaction and a further inclusion formation. When RH refining starts, the [C] concentrations in the simulations gradually decrease because of the reaction of [C] and [O] under the lowering pressure, whereas the [C] concentration in simulation B was higher and decreased faster (Figure 5a); the [O] concentrations in the simulations also decreased, and the [O] concentration in simulation B was lower and decreased faster (Figure 5b). The oxygen blowing between 660 s and 840 s caused a fluctuation in the [O] concentration profiles. As shown in Figure 5b), the [Al] concentrations soared to approximately 0.038% after Al addition in both simulations, though the Al addition mass in simulation B was 80 kg less (Table 2); the [O] concentrations sharply decreased to 4.3 ppm. In the subsequent process, the [C], [Mn], and [O] concentrations changed little, and the [Al] concentration decreased slightly. The final [C] concentrations in simulations A and B were 8 ppm and 17 ppm, respectively, which fulfils the normal requirement of ULC steel (20 to 50 ppm) [20].
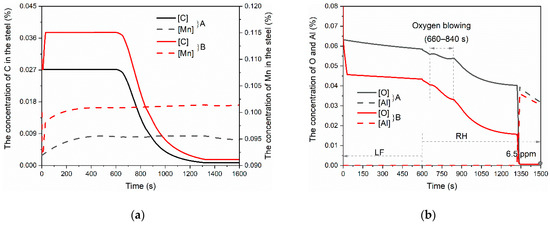
Figure 5.
Comparing the steel compositions in the refining process (a) [C] and [Mn]; (b) Al and O (“[]” indicates dissolved value).
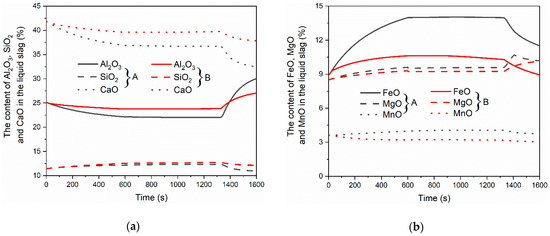
Figure 6.
Comparing the slag compositions in the refining process (a) Al2O3, SiO2, and CaO; (b) FeO, MgO, and MnO.
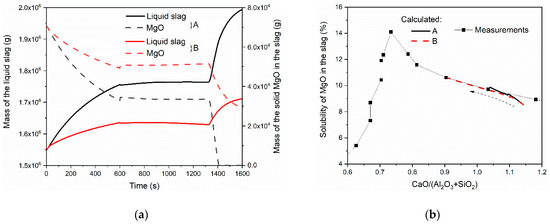
Figure 7.
Comparing (a) the mass of slag phases and (b) MgO solubility in the liquid slag [21].
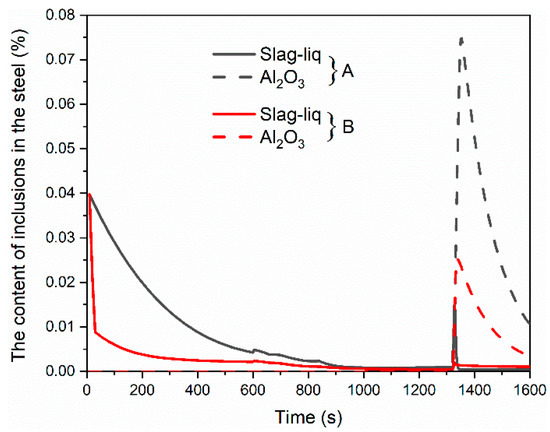
Figure 8.
The comparison of the inclusion content.
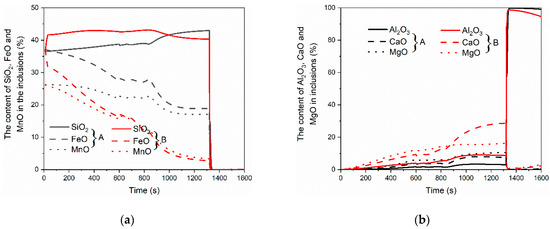
Figure 9.
Comparing the overall inclusion compositions in the refining process (a) SiO2, FeO, and MnO; (b) Al2O3, CaO, and MgO.
Figure 6 compares the slag compositions in the refining process. Carbon pre-deoxidation leads to a noticeable difference in slag composition in the simulations. The contents of Al2O3 and CaO in simulation B with pre-deoxidation were higher than those in simulation A (Figure 6a), whereas the contents of FeO and MnO were lower (Figure 6b). This was because the lower oxygen concentration of the steel in simulation B (Figure 5b) resulted in less Fe and Mn oxidized to FeO and MnO in steel and during the interfacial reaction. The contents of SiO2 and MgO in both simulations were similar. In the refining process, the slag compositions in the simulations had similar evolution profiles. The contents of SiO2 (Figure 6a), FeO, and MnO (Figure 6b) contents gradually increased during LF treatment (before 600 s). In contrast, Al2O3 and CaO contents decreased because of the inclusion removal and the steel/slag reaction. The increase in MgO content was mainly caused by solid MgO’s gradual dissolution, as indicated by Figure 7a. In the RH refining process, the changes in slag compositions were not apparent before Al addition because of the smaller mass transfer coefficient and the less-active steel/slag reaction. After Al deoxidation at the late refining stage, Al2O3 content increased because of the generated Al2O3 in steel removal to slag. Meanwhile, FeO and MnO in the slag were reduced by [Al] in steel through the interfacial reaction, which led to their decreasing contents. The percentages of CaO and SiO2 also decreased.
Figure 7 shows the mass of slag phases and the solubility of MgO in the liquid slag. From Figure 7a, it is found that the liquid slag mass in simulation A was larger than that in simulation B because of greater inclusion formations (Figure 8) and solid MgO dissolution. To prevent corrosion of lining at the slag line, MgO is usually added in the slag formation process. In both simulations, the solid MgO phase exists in the liquid slag, as the MgO content exceeds the saturation limit. As shown in Figure 7b, the predicted MgO solubility agrees well with the measurements [21]. The mass of the precipitated solid MgO in simulation B was more than that of simulation A because of the lower liquid amount. In the refining process, the mass of liquid slag increased by inclusion removal and the steel/slag reaction. As shown in Figure 7a, the liquid slag mass rapidly increased after Al deoxidation, whereas the solid MgO mass decreased because of its increasing solubility with the increasing Al2O3 (Figure 7b).
Figure 8 and Figure 9 display the comparison of the inclusion content and the overall inclusion composition during the refining process for simulations A and B. From Figure 8, it is found that the pre-deoxidation in simulation B significantly reduced the inclusion content in the refining process. At the beginning of the refining process, the added carbon in simulation B reduced the formed Slag-liq inclusions by approximately 0.03% and led to the removable CO formation. The residual inclusions were gradually removed in the subsequent process. Al deoxidation resulted in Al2O3 content’s sharp increase, whereas the content of Al2O3 in simulation B was much lower because of the lower [O] concentration (Figure 5b). The final inclusion contents in simulations A and B were 0.0114% and 0.0040%, respectively. Figure 9 shows that the inclusion’s (Slag-liq) principal components were SiO2, FeO, MnO, CaO, MgO, and Al2O3 before Al addition. FeO and MnO contents in simulation A were higher than those in simulation B because of its higher [O] concentration, whereas the other components were lower in content. FeO and MnO contents gradually decreased during the refining process, whereas CaO, MgO, and Al2O3 contents increased due to the steel/slag reaction. After Al deoxidation, the Al2O3 content accounted for more than 95%.
In the present study, the deoxidation route of carbon pre-deoxidation at the beginning of the refining and Al deoxidation at the late stage of the refining process (simulation B) was simulated and compared with the single Al deoxidation (simulation A). Based on the results shown in Figure 5, Figure 6, Figure 7, Figure 8 and Figure 9, the influence of carbon pre-deoxidation is summarized as follows:
- Al deoxidizer can be replaced by pre-deoxidation carbon in the same mass to obtain similar deoxidation significance and final [Al] concentration. This indicates that, for deoxidation, it can be reduced.
- The final [C] concentration increased, which means the added mass of carbon for pre-deoxidation was limited by the required C content of UCL steel.
- The Fe loss and alloy (such as Si and Mn) loss due to the oxidation was reduced.
- FeO and MnO contents in liquid slag were decreased, which can reduce the reoxidation and improve final steel cleanness [22,23,24].
- The liquid slag amount was decreased, which lowers the risk of slag line erosion [25].
- The inclusion content in steel was significantly reduced because of the pre-deoxidation and lower oxygen content.
- The addition of MgO can be reduced because of the lower liquid slag amount and the lower solubility in the liquid slag.
3.2. Influence of FeTi Addition on Inclusions
In this section, the influence of FeTi addition on steel cleanness was studied. As listed in Table 2, simulation C with an FeTi addition at 6 min after Al deoxidation was carried out. The composition of the FeTi alloy in the simulation was assumed as 70%Ti-3%O-2.5%Al-24.5%Fe [26]. The predicted chances of inclusion and total oxygen (Otot) in simulations B and C are compared in Figure 10. Note that only the results after 1600 s are displayed, and the results in the former refining process can be referred to in Figure 8. The FeTi addition had a minor influence on the compositions of steel (except [Ti]) and slag. Hence, only the inclusion content is discussed in this section. From Figure 10, it is found that FeTi addition significantly increased the content of inclusions and Otot, which is attributed to the relatively high O content of FeTi. The peak content of Otot was almost doubled by FeTi addition. Corundum is the dominant inclusion type, and Slag-liq also exists in both simulations, while the compositions of the inclusion phase in different simulations were different, as listed in Table 3. The Slag-liq composition without FeTi addition (simulation B) was 77%Al2O3-10%CaO-13%MgO, and it was modified to 59%Al2O3-5%CaO-12%MgO-17%Ti2O3-7TiO2 by FeTi addition. Meanwhile, Al2O3 was transformed to the corundum solution phase with the composition of 99.2%Al2O3-0.8%Ti2O3. Note that the thermodynamic equilibrium between steel and inclusion was assumed in the present model, though it is not the case in reality when considering the kinetics. Nevertheless, the inclusion composition changes in the simulations indicate that the formed inclusions are transformed to some extent besides the newly formed inclusions.
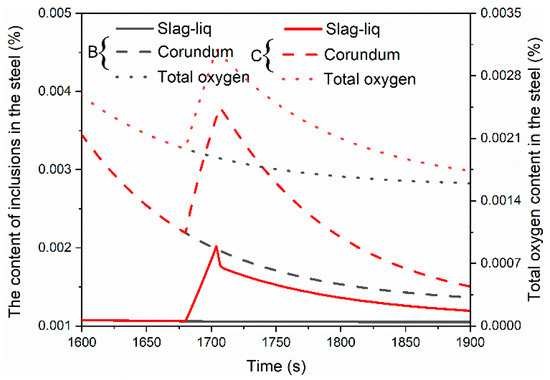
Figure 10.
The influence of FeTi addition (1680 s) on the content of inclusions and Otot.
Table 3.
The mean composition of inclusion phases in simulations B and C.
The results support the reported experimental findings and the explanation that the FeTi addition contributed to the high clogging tendency of ULC steel by generating the new inclusions [27]. As in the present study, FeTi addition promotes the nucleation of inclusions by bringing in the necessary elements ([O] and [Ti]). The local saturation of [Ti] and [O] as well as [Al] already present in steel during FeTi alloy dissolution results in the nucleation of Al2O3 with Ti-containing oxide solutions (AT). The predicted corundum inclusions have a close composition with that of the measured AT particles, which also depends on the Ti concentration in steel [28]. It was also reported that the number density of this type of inclusion (AT) is relatively larger, and they remain in a smaller size (≤3 µm) compared to the formed pure Al2O3 because of the limited oxygen content after the nucleation [29,30]. The transformed inclusions from the existing pure Al2O3 are also possibly smaller and increase the number density. In the present model, the effects of the dimension on the inclusion removal rate were not considered, and the inclusions were gradually removed, as shown in Figure 10, whereas the small inclusions are difficult to remove during the refining process in practice. The unconsidered inclusion dimension in the calculation can result in a lower prediction of the inclusion content and total oxygen in the steel. The AT inclusion is non-wettable in steel and has a similar wetting angle with ULC steel and pure Al2O3. [31] Based on the former analysis, small non-wettable inclusions in large-number densities result in a high risk of clogging [27,32,33].
4. Summary
The refining process of the ULC steel under different deoxidation strategies was simulated using the developed thorough process (LF + RH) model. From the simulation results, it can be summarized that:
- Applying a carbon pre-deoxidation at the beginning of LF treatment can effectively reduce the deoxidizer (Al) consumption and alloy loss. The addition amount of carbon is limited to the required final [C] content in ULC steel.
- The FeO and MnO content in the liquid slag is decreased by the pre-deoxidation, which lowers the risk of reoxidation.
- The volume fraction of inclusions is lowered because of carbon deoxidation and less Al2O3 formation.
- FeTi addition acts as an oxygen source for additional inclusion nucleation. The newly generated and transformed inclusions are smaller and in a larger number density, and hence, they have a higher tendency to attach to the refractory. This can be the reason for the generally high clogging sensitivity of Ti-stabilized ULC steel.
In future studies, the model will be further optimized based on the industrial experiments to address the influence of metallurgical parameters such as lining erosion and reoxidation on the inclusion evolution.
Author Contributions
Conceptualization, D.Y., C.B., A.V. and B.L.; performance of the simulations, D.Y.; analysis of the results and visualization, D.Y. and C.B.; writing—original draft preparation, D.Y.; writing—review and editing, D.Y., C.B., A.V. and B.L.; supervision, C.B.; project administration, C.B., A.V. and B.L. All authors have read and agreed to the published version of the manuscript.
Funding
Financial support by the Austrian Federal Government (in particular from Bundesministerium für Verkehr, Innovation und Technologie and Bundesministerium für Wirtschaft, Familie und Jugend) represented by Österreichische Forschungsförderungsgesellschaft mbH and the Styrian and the Tyrolean Provincial Government, represented by Steirische Wirtschaftsförderungsgesellschaft mbH and Standortagentur Tirol, within the framework of the COMET Funding Programme is gratefully acknowledged. This work is part of the ongoing K2-MPPE project P3.36 “Advanced ESP.”
Data Availability Statement
The data presented in this study are available on request from the corresponding author.
Conflicts of Interest
The authors declare no conflict of interest.
References
- You, D.; Michelic, S.K.; Bernhard, C. Modeling of Ladle Refining Process Considering Mixing and Chemical Reaction. Steel Res. Int. 2020, 91, 1–9. [Google Scholar] [CrossRef] [Green Version]
- van Ende, M.-A.; Kim, Y.-M.; Cho, M.-K.; Choi, J.; Jung, I.-H. A Kinetic Model for the Ruhrstahl Heraeus (RH) Degassing Process. Metall. Mater. Trans. B 2011, 42, 477–489. [Google Scholar] [CrossRef]
- Kuwabara, T.; Umezawa, K.; Mori, K.; Watanabe, H. Investigation of Decarburization Behavior in RH-reactor and Its Operation Improvement. ISIJ Int. 1988, 28, 305–314. [Google Scholar] [CrossRef]
- Yamaguchi, K.; Kishimoto, Y.; Sakuraya, T.; Fujii, T.; Aratani, M.; Nishikawa, H. Effect of Refining Conditions for Ultra Low Carbon Steel on Decarburization Reaction in RH Degasser. ISIJ Int. 1992, 32, 126–135. [Google Scholar] [CrossRef]
- Kitamura, S.; Yano, M.; Harashima, M.; Tsutsumi, N. Decarburization Model for Vacuum Degasser. Tetsu-to-Hagane 1994, 80, 213–218. [Google Scholar] [CrossRef] [Green Version]
- Takahashi, M.; Matsumoto, H.; Saito, T. Mechanism of Decarburization in RH Degasser. ISIJ Int. 1995, 35, 1452–1458. [Google Scholar] [CrossRef] [Green Version]
- Kitamura, T.; Miyamoto, K.; Tsujino, R.; Mizoguchi, S.; Kato, K. Mathematical Model for Nitrogen Desorption and Decarburization Reaction in Vacuum Degasser. ISIJ Int. 1996, 36, 395–401. [Google Scholar] [CrossRef] [Green Version]
- Kleimt, B.; Köhle, S.; Jungreithmeier, A. Dynamic model for on-line observation of the current process state during RH degassing. Steel Res. 2001, 72, 337–345. [Google Scholar] [CrossRef]
- Park, Y.; Yi, K. A New Numerical Model for Predicting Carbon Concentration during RH Degassing Treatment. ISIJ Int. 2003, 43, 1403–1409. [Google Scholar] [CrossRef]
- Pirker, S.; Forstner, K. Analytical and Numerical Approaches in Studying Immersed De-carbonization in RH-plants. Steel Res. Int. 2008, 79, 591–599. [Google Scholar] [CrossRef]
- You, D.; Michelic, S.K.; Bernhard, C. Modeling of the secondary refining process of steel. In Proceedings of the METEC & 4th ESTAD, The Steel Institute VDEh, Düsseldorf, Germany, 24–28 June 2019; pp. 1–6. [Google Scholar]
- Petersen, S.; Hack, K. The thermochemistry library ChemApp and its applications. Int. J. Mater. Res. 2007, 98, 935–945. [Google Scholar] [CrossRef]
- You, D.; Bernhard, C.; Michelic, S.; Wieser, G.; Presoly, P. On the modelling of microsegregation in steels involving thermodynamic databases. IOP Conf. Ser. Mater. Sci. Eng. 2016, 119, 1–8. [Google Scholar] [CrossRef] [Green Version]
- Graham, K.J.; Irons, G.A. The behavior of non-metallic inclusion during ladle refining. In Proceedings of the AISTech 2009, Association for Iron & Steel Technology, Warrendale, Pittsburgh, PA, USA, 4–7 May 2009; pp. 1003–1014. [Google Scholar]
- Graham, K.J.; Irons, G.A. Toward integrated ladle metallurgy control. Iron Steel Technol. 2009, 6, 164–173. [Google Scholar]
- Galindo, A. Kinetic Modelling for the Formation of Magnesium Aluminate Inclusions in the Ladle Metallurgy Furnace. Master’s Thesis, McMaster University, Hamilton, ON, Canada, 2015. [Google Scholar]
- Jungreithmeier, A.; Pissenberger, E.; Burgstaller, K. Production of ULC IF steel grades at Voest-Alpine Stahl GmbH. Iron Steel Technol. 2004, 4, 41–48. [Google Scholar]
- Basu, S.; Choudhary, S.; Girase, N. Nozzle Clogging Behaviour of Ti-bearing Al-killed Ultra Low Carbon Steel. ISIJ Int. 2004, 44, 1653–1660. [Google Scholar] [CrossRef]
- Cui, H.; Bao, Y.; Wang, M.; Wu, W. Clogging behavior of submerged entry nozzles for Ti-bearing IF steel. Int. J. Miner. Metall. Mater. 2010, 17, 154–158. [Google Scholar] [CrossRef]
- Jeong, W.C. Strength and formability of ultra-low-carbon Ti-IF Steels. Metall. Mater. Trans. A 2000, 31, 1305–1307. [Google Scholar] [CrossRef]
- Park, J.M.; Lee, K.K. Reaction Equilibria between Liquid Iron and CaO-Al2O3-MgOsat-SiO2-FetO-MnO-P2O5 Slag. In Proceedings of the 79th Steelmaking Conference proceedings, Iron and Steel Society, Pittsburgh, PA, USA, 24–27 March 1996; pp. 165–172. [Google Scholar]
- Lee, K.K.; Park, J.M.; Chung, J.Y.; Choi, S.H.; Ahn, S.B. The secondary refining technologies for improving the cleanliness of ultra-low carbon steel at Kwangyang Works. Rev. Met. 1996, 93, 503–509. [Google Scholar] [CrossRef]
- Lee, K.Y.; Park, J.M.; Park, C. Rate of reoxidation of ultra-low carbon steel in contact with slag of various compositions. In Proceedings of the VII International Conference on Molten Slags Fluxes and Salts, The South African Institute of Mining and Metallurgy, Cape Town, South Africa, 25–28 January 2004; pp. 601–606. [Google Scholar]
- Hara, Y.; Idogawa, A.; Sakuraya, T.; Hiwasa, S.; Nishikawa, H. Development of prevention method of steel reoxidation to produce clean steel. In Proceedings of the 75th Steelmaking Conference proceedings, Iron and Steel Society, Toronto, Canada, 5–8 April 1992; pp. 513–519. [Google Scholar]
- Pistorius, P.C. Slag carry-over and the production of clean steel. J. S. Afr. Inst. Min. Metall. 2019, 119, 557–561. [Google Scholar] [CrossRef]
- Pande, M.M.; Guo, M.; Guo, X.; Geysen, D.; Devisscher, S.; Blanpain, B.; Wollants, P. Ferroalloy quality and steel cleanliness. Ironmak. Steelmak. 2010, 37, 502–511. [Google Scholar] [CrossRef]
- Bernhard, C.; Dorrer, P.; Michelic, S.K.; Penz, A.; Rössler, R. The role of FeTi addition to micro-inclusions in the production. In Proceedings of the METEC & 4th ESTAD, The Steel Institute VDEh, Düsseldorf, Germany, 24–28 June 2019; pp. 1–6. [Google Scholar]
- Dorrer, P.; Michelic, S.K.; Bernhard, C.; Penz, A.; Rössler, R. Study on the Influence of FeTi-Addition on the Inclusion Population in Ti-Stabilized ULC Steels and Its Consequences for SEN-Clogging. Steel Res. Int. 2019, 90, 1–13. [Google Scholar] [CrossRef]
- Lyons, C.; Kaushik, P. Inclusion Characterization of Titanium Stabilized Ultra Low Carbon Steels: Impact of Oxygen Activity before Deoxidation. Steel Res. Int. 2011, 82, 1394–1403. [Google Scholar] [CrossRef]
- Kaushik, P.; Pielet, H.; Yin, H. Inclusion characterization: A tool for measurement of steel cleanliness and process control. Iron Steel Technol. 2009, 6, 82–99. [Google Scholar]
- Karasangabo, A.; Bernhard, C. Investigation of Alumina Wetting Fe-Ti, Fe-P and Fe-Ti-P Alloys. J. Adhes. Sci. Technol. 2012, 26, 1141–1156. [Google Scholar] [CrossRef]
- Sasai, K.; Mizukami, Y. Mechanism of Alumina Adhesion to Continuous Caster Nozzle with Reoxidation of Molten Steel. ISIJ Int. 2001, 41, 1331–1339. [Google Scholar] [CrossRef] [Green Version]
- Salgado, U.; Weiß, C.; Michelic, S.K.; Bernhard, C. Fluid Force-Induced Detachment Criteria for Nonmetallic Inclusions Adhered to a Refractory/Molten Steel Interface. Metall. Mater. Trans. B 2018, 49, 1632–1643. [Google Scholar] [CrossRef]
Publisher’s Note: MDPI stays neutral with regard to jurisdictional claims in published maps and institutional affiliations. |
© 2021 by the authors. Licensee MDPI, Basel, Switzerland. This article is an open access article distributed under the terms and conditions of the Creative Commons Attribution (CC BY) license (https://creativecommons.org/licenses/by/4.0/).