Abstract
Roselite from the Aghbar Mine, Morocco, [Ca2(Co2+,Mg)(AsO4)2 2H2O], was investigated by X-ray Photoelectron and Raman spectroscopy. X-ray Photoelectron Spectroscopy revealed a cobalt to magnesium ratio of 3:1. Magnesium, cobalt and calcium showed single bands associated with unique crystallographic positions. The oxygen 1s spectrum displayed two bands associated with the arsenate group and crystal water. Arsenic 3d exhibited bands with a ratio close to that of the cobalt to magnesium ratio, indicative of the local arsenic environment being sensitive to the substitution of magnesium for cobalt. The Raman arsenate symmetric and antisymmetric modes were all split with the antisymmetric modes observed around 865 and 818 cm−1, while the symmetric modes were found around 980 and 709 cm−1. An overlapping water-libration mode was observed at 709 cm−1. The region at 400–500 cm−1 showed splitting of the arsenate antisymmetric mode with bands at 499, 475, 450 and 425 cm−1. The 300–400 cm−1 region showed the corresponding symmetric bending modes at 377, 353, 336 and 304 cm−1. The bands below 300 cm−1 were assigned to lattice modes.
    1. Introduction
Roselite is a rare secondary arsenate mineral in cobalt-bearing hydrothermal mineral deposits forming a solid solution with wendwilsonite with Mg substituting for Co2+. Since both minerals are very similar in appearance, it is almost impossible to distinguish between the two minerals without proper chemical analysis. The crystals of roselite are transparent to translucent with a pale pink to dark rose-pink colour. Occasionally colour-zoning can be observed and is a function of the cobalt content []. Roselite is often associated with related arsenates such as wendwilsonite, talmessite and erythrite, as can be observed at Bou Azzer, Morocco [,,,]. Minerals of the roselite group can by characterized by the general formula X2M(TO4)2.2H2O with X = Ca, Na; M = Mg, Mn2+, Co2+, Cu2+, Zn and T = As5+, S6+. The roselite group consists of the end-member minerals: roselite Ca2Co(AsO4)2.2H2O, wendwilsonite Ca2Mg(AsO4)2.2H2O, brandtite Ca2Mn(AsO4)2.2H2O, zincroselite Ca2Zn(AsO4)2.2H2O and kröhnkite Na2Cu(SO4).2H2O. Recently a new member was added to the group with the chemical composition Ca2Cu(AsO4)2.2H2O named rruffite [].
Roselite was named in 1824 by French mathematician and mineralogist Armand Lévy (14 November 1795–29 July 1841) in honour of the German mineralogist Gustav Rose (18 March 1798–15 July 1873), who was a Professor of Mineralogy at the University of Berlin, as an orthorhombic arsenate of lime and cobalt []. About fifty years later Schrauf concluded that roselite did not possess orthorhombic symmetry, although it showed pseudo-orthorhombic triclinic elements due to the fact the crystals exhibited lamellar twinning on as many as five of the six pseudo-symmetry elements of the chosen lattice [,,]. Peacock however definitively proved that roselite belongs to the monoclinic symmetry class [] with point group 2/m (space group P21/c), a = 5.801(1) Å, b = 12.898(3) Å, c = 5.617(1) Å, β = 107°42(2)′, Z = 2. Roselite crystals have a tendency to be elongated along [100] and are frequently twinned on {100} with {100} as the composition plane [,,]. Figure 1 shows the crystal structure and form of roselite.
      
    
    Figure 1.
      (a) Crystal structure (top) of roselite based on crystal data from Hawthorne and Ferguson []; (b) crystal form.
  
While there is available data on the crystal structure and form of roselite, infrared and Raman spectroscopic data are limited while there are no reported X-ray Photoelectron data and more work is needed on this rare arsenate mineral [,,]. Both techniques allow for the non-destructive analysis of small crystals in situ. As part of an ongoing study on arsenate minerals [,,,,,,,,,] this study aims to better understand the X-ray photoelectron spectroscopy (XPS) and Raman spectra of well crystallised roselite from the Aghbar Mine, Morocco [,,]. A better understanding of the XPS and Raman spectra of roselite and other arsenate minerals will support the identification of these secondary minerals in e.g., contaminated soils due to leaching from mine tailings.
2. Materials and Methods
The roselite sample used in this study is part of the author’s private collection under catalogue number 05802 (Figure 2) and originates from the Aghbar Mine, Aghbar, Bou Azer District (Bou Azzer District), Tazenakht, Ouarzazate Province, Souss-Massa-Draâ Region, Morocco [,,].
      
    
    Figure 2.
      Microscope photo of roselite, catalogue no. 05802, field of view 0.5 mm.
  
The XPS analyses were performed on a Kratos AXIS Ultra (Kratos Analytical, Manchester, UK) with a monochromatic Al X-ray source at 225 W under ultrahigh vacuum conditions. Each analysis started with a survey scan from 0 to 1200 eV with a dwell time of 100 milliseconds, pass energy of 160 eV at steps of 1 eV with 1 sweep. For the high resolution analyses the number of sweeps was increased, the pass energy was lowered to 20 eV at steps of 100 meV and the dwell time was changed to 250 milliseconds. The spectra were charge corrected using the adventitious C 1s signal at 284.8 eV. The sample with the roselite crystal in situ was placed in the XPS after a wash with alcohol. Prior to the analyses the surface of the crystal was cleaned by Argon ion etching for 20 min. Despite the fact that XPS is generally considered a surface analysis technique, in reality more than 90% of the signal is received from the bulk crystal structure beneath the surface.
The roselite sample was orientated on a polished metal surface on the stage of an Olympus BHSM microscope equipped with 10× and 50× objectives. The microscope is part of a Renishaw 1000 Raman microscope system (Renishaw, New Mills, Wotton-under-Edge, Gloucestershire, UK), which also includes a monochromator, a filter system and a Charge Coupled Device (CCD). The Raman spectra were excited by a Spectra-Physics model-127 H-Ne laser producing highly polarised light at 633 nm. Spectra were obtained at a nominal resolution of 2 cm−1 and a precision of around 1 cm−1 in the range between 1500 and 100 cm−1.
Spectroscopic manipulation such as baseline adjustment, smoothing and normalisation were performed using the Fityk 0.9.8 software package, which enabled the type of fitting, function to be selected and allows specific parameters to be fixed or varied accordingly. Band fitting was done using a Gauss-Lorentz cross-product function with the minimum number of component bands used for the fitting process. The Gauss-Lorentz ratio was maintained at values greater than 0.7 and fitting was undertaken until reproducible results were obtained with squared correlations of r2 greater than 0.995.
3. Results and Discussion
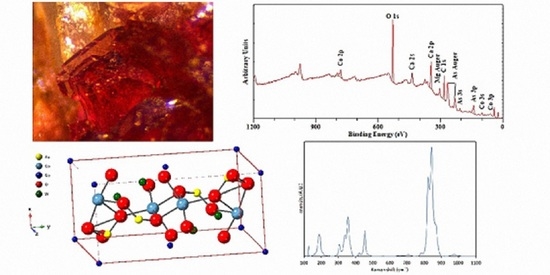
3.1. Chemical Characterization
X-ray Photoelectron Spectroscopy (XPS) is a surface sensitive quantitative spectroscopic technique for measuring the elemental composition, chemical states, and the electronic states of the elements within the material. XPS normally probes to a depth of 10 nm and involves the detection of photoelectrons emitted from a sample as a result of irradiation of the sample by single-energy (monochromatic) X-ray photons, mostly Al Kα as in this study.
The chemical composition of the roselite was determined from the XPS survey scan between 1200 and 0 eV binding energies (Figure 3), which showed only the presence of surface carbon (a small amount of surface C contamination was still observed after 20 min of argon etching), O, As, Ca, Co and Mg (Table 1). No other elements were observed to be present. The chemical analysis based on a total cation sum of five [2As + 2Ca + 1(Co + Mg)] results in a composition of Ca2.09(Co0.75Mg0.24)Σ0.99(AsO4)1.89.1.59H2O, which shows a 24% substitution of Co2+ by Mg confirming the identity of the specimen as roselite. A small excess of Ca was observed, similar to earlier observations by Dunn et al. [] for all the roselite and wendwilsonite samples analysed by an electron microprobe. They considered the excess as an analytical error rather than substitution of Ca for (Co, Mg). A similar size excess here is also observed, while at the same time, the As was slightly lower than expected. Also, it was observed that local partial dehydration seems to have taken place as a result of the combined actions of the etching and ultra-high vacuum in the XPS spectrometer.
      
    
    Figure 3.
      XPS survey scan (Al Kα, 225 W, 160 eV pass energy) of roselite.


    Table 1.
    Chemical compositions based on XPS survey scan analysis on total cation sum = 5.
  
The Mg 2s is characterised by a single peak with low signal to noise ratio at 89.0 eV (Figure 4a). The corresponding Co 2p3/2 also shows a single peak at 781.0 eV together with a couple of shake up satellite bands at slightly higher binding energies at 784.6 eV and 787.8 eV (Figure 4b). The fact that both the Mg 2s and the Co 2p show a single peak indicates that they occupy a single unique position in the roselite crystal structure.
      
    
    Figure 4.
      High resolution XPS spectra (Al Kα, 150 W, 20 eV pass energy) of (a) Mg 2s, (b) Co 2p, (c) O 1s, (d) As 3d, and (e) Ca 2p of roselite.
  
In contrast, the O 1s shows a major peak at 531.0 eV with a minor peak at 532.6 eV (Figure 4c). The major peak is associated with the oxygen atoms in the arsenate group, while the shift in binding energy of the minor peak agrees with an assignment to oxygen present as crystal water. The arsenate oxygen accounts for 87% of the O 1s signal while 13% accounts for the oxygen in the crystal water. Based on the chemical formula calculated from the survey scan, the percentages are 82% and 18%, respectively, confirming the assignment of the two O 1s bands.
The As 3d shows a more complex set of bands belong to two different environments each showing a set of As 3d5/2 and 3/2 binding energies (Figure 4d). The first environment is characterised by the As 3d5/2 at 43.7 eV and the corresponding As 3d3/2 at 44.3 eV, while the second environment has the As 3d5/2 at 45.1 eV and the As 3d3/2 at 45.7 eV. The major peak constitutes 62% while the second minor peak makes up the remaining 38%. In the pure endmember roselite without any substitution of Mg on the Co position, there is only a single type of arsenate groups in the crystal structure. Based on earlier crystallographic studies, there seems to be no effect on the atomic positions of the arsenate as a result of substitution in the roselite-wendwilsonite series [,,], but the local environment of the arsenic cation seems to be sensitive to the substitution and as a result, the binding energy of the As 3d electron is altered by about 2 eV. The ratio is reasonably close to the ratio of Co to Mg, supporting this interpretation. An alternative though unlikely explanation could be that part of the arsenate groups are exposed on the surface of the crystal missing part of their coordination or to damage caused by the Ar etching prior to the analysis. In addition, when the arsenate group is exposed on the surface, it will quickly interact even under ultra-high vacuum and form hydroxyl groups resulting in AsO4−x(OH)x groups or interact with the remaining surface carbon. The binding energy of the O 1s at 532.6 eV is too high to assign this peak to OH instead of water. Finally, the Ca 2p shows a single peak with the Ca 2p3/2 at 347.2 eV and the Ca 2p1/2 at 350.7 eV (Figure 4e) associated with a single position in the roselite crystal structure that is not affected by the Co/Mg substitution.
3.2. Raman Microscopy
The assignment of Raman spectra to minerals is straightforward and unambiguous if appropriate reference data are available. Recently, there have been a number of studies on minerals in the roselite group using Raman and Mid-Infrared spectroscopy [,,,]. There is a general consensus that in the crystal structures of the minerals in the roselite subgroup, the arsenate group has no longer a perfect tetrahedral form but is distorted and as a result, splitting of the bands can be expected for these minerals.
The 600 to 1050 cm−1 region (Figure 5a) shows the bands associated with the AsO4 υ3 antisymmetric stretching mode and the AsO4 υ1 symmetric stretching mode. The low intensity band around 709 cm−1 might be assigned to the H2O libration mode as indicated by Yang et al. []. Frost [] ascribed the band at 976 cm−1 for roselite to the υ1 symmetric stretching mode of the PO4-group substituting for the AsO4-group. Unfortunately, no chemical analyses were performed by him to prove this interpretation. Besides, no phosphorus was observed with XPS in this study of roselite from the same locality. Lastly, the band is observed in the Raman spectra for all minerals from the roselite subgroup except rruffite (Table 2). Therefore, it has to be concluded that the assignment of this band to the presence of a small amount of phosphate in the roselite structure is erroneous. In contrast, Ross [] ascribed two distinct bands at 985 and 920 cm−1 as the AsO4 υ1 symmetric stretching modes, which seems more likely to be correct. In the region between 550 and 650 cm−1, some very similar bands have been observed for roselite and zincroselite and were ascribed to the H2O libration mode of structural water (Table 2). Similar bands were not observed here.
      
    
    Figure 5.
      Raman spectra with band fitting of roselite (a) in the 600–1050 cm−1 region, (b) in the 375–525 cm−1 region, and (c) in the 150–400 cm−1 region.


    Table 2.
    Tentative assignment of the observed roselite Raman bands in comparison to the other minerals of the roselite subgroup.
  
It is interesting that in this region, Frost [] only described two bands, a rather intense one around 798 cm−1 and a low intensity one around 864 cm−1. In contrast Yang et al. [] observed an intense band around 821 cm−1, two rather low intensity bands around 840 and 868 cm−1 and an extremely low intensity band around 780 cm−1 for roselite from the same location. The roselite crystal used in this study comes from the same location as the roselite crystals studied by Frost [] and Yang et al. [] showing bands comparable to those reported by Yang et al. [] but with different intensities. This difference in intensity can be explained by differences in the orientation of the roselite crystal under the extremely polarized laser beam. As a result, two intense narrow bands were observed around 823 and 839 cm−1 with a less intense one around 865 cm−1. In addition, an extremely low intensity band around 787 cm−1 was observed. Since Yang et al. [] did not perform detailed band component analysis the 888 and 818 cm−1 bands were not reported.
The low wavenumber region between 100 and 500 cm−1 has been divided in several sections in this study: (1) the region between 400 and 500 cm−1 associated with the AsO4 υ4 antisymmetric bending mode; (2) the region between 300 and 400 cm−1 associated with the AsO4 υ2 symmetric bending mode; and (3) the region between 100 and 300 cm−1 associated with AsO stretching and bending vibrational modes and the lattice vibrational modes. A rather narrow band was observed around 450 cm−1 together with somewhat broader and less intense bands around 475, 440, 425 and 403 cm−1 (Figure 5b). These bands are due the splitting of the υ4 antisymmetric bending mode of the arsenate group. Comparable bands have been observed for wendwilsonite around 478, 454 and 419 cm−1 [] with the 400 cm−1 band missing, for brandtite around 472, 447, 419 and 401 cm−1, for zincroselite around 475, 451, 522 and 403 cm−1 []. In contrast for rruffite only two bands are reported around 451 and 426 cm−1. The 440 cm−1 band was only found in the roselite spectrum (Table 2) [this study and 14].
Analogous observations can be made for roselite in the region between 300 and 400 cm−1 for the corresponding AsO4 υ2 symmetric bending modes (Figure 5c). The principal sharp band was observed around 336 cm−1. The region below 300 cm−1 is complex and comprises a number of bands linked to primarily lattice vibrations and AsO stretching and bending vibrations. Even though small variations in the band positions of the corresponding vibrational modes in the other roselite subgroup minerals have been detected, no obvious relationship with the substitution of Co by Mg, Mn, Zn or Cu in the roselite crystal structure can be determined. The single band that exhibits a minor influence by the metal substitution is the AsO4 υ3 antisymmetric stretching mode around 800–820 cm−1, which shifts to 818/815 cm−1 for roselite/zincroselite (Co and Zn), 803 cm−1 for rruffite (Cu), and 800 cm−1 for wendwilsonite (Mg) and appears linked to the metal’s ionic radius decreasing from 74 pm for Co and Zn to 73 pm for Cu to 72 pm for Mg. Currently, it is not understood why other vibrational modes are not affected in an analogous manner and additional detailed research is necessary to explain the influence of these metal ion substitutions in the crystal structures of the roselite subgroup minerals.
4. Conclusions
XPS and Raman microscopy are very powerful tools to study arsenate minerals in situ without damaging the sample. Combination of these two techniques allows the chemical composition of a mineral to be directly coupled to the vibrational spectral information. In this study the arsenate mineral roselite was studied and compared to similar minerals from the same group i.e., wendwilsonite, brandtite, zincroselite and rruffite. It is shown that the roselite was a pure arsenate and no phosphate was present as indicated in an earlier study. The exact ratio of Co/Mg was determined by XPS confirming that this was indeed a roselite specimen. The Raman spectra show the effect of the lowering of the arsenate symmetry resulting in multiple bands for symmetric stretching and bending and the antisymmetric stretching and bending vibrations of the arsenate anion.
Author Contributions
Conceptualization, J.T.K. and D.O.O.; methodology, J.T.K. and B.J.W.; validation, J.T.K., B.J.W., D.O.O.; formal analysis, J.T.K., B.J.W., D.O.O.; investigation, J.T.K.; data curation, J.T.K.; writing—original draft preparation, J.T.K., D.O.O.; writing—review and editing, J.T.K. and D.O.O.; visualization, J.T.K.; supervision, J.T.K.; project administration, J.T.K. All authors have read and agreed to the published version of the manuscript.
Funding
This research received no external funding.
Institutional Review Board Statement
Not applicable.
Informed Consent Statement
Not applicable.
Acknowledgments
The authors wish to thank the School of Chemistry, Physics and Mechanical Engineering, Science and Engineering Faculty, Queensland University of Technology for the use of their instrumentation. The authors acknowledge the facilities, and the scientific and technical assistance, of the Australian Microscopy & Microanalysis Research Facility at the Centre for Microscopy and Microanalysis, The University of Queensland.
Conflicts of Interest
The authors declare no conflict of interest.
References
- Gaines, R.V.; Skinner, H.C.W.; Foord, E.E.; Mason, B.; Rosenzweig, A. Dana’s New Mineralogy—The System of Mineralogy of James Dwight Dana and Edward Salisbury Dana, 8th ed.; John Wiley & Sons, Inc.: New York, NY, USA, 1997; p. 1819. [Google Scholar]
 - Anthony, J.W.; Bideaux, R.A.; Bladh, K.W.; Nichols, M.C. Handbook of Mineralogy Volume IV—Arsenates, Phosphates and Vanadates; Mineral Data Publishing: Tuscon, AZ, USA, 2000; p. 680. [Google Scholar]
 - Favreau, G.; Dietrich, J.E.; Meisser, N.; Brugger, J.; Ait Haddouch, L.; Maacha, L. Famous mineral localities: Bou Azzer, Morocco. Mineral. Rec. 2007, 38, 345–407. [Google Scholar]
 - Favreau, G.; Dietrich, J.E. Die Mineralien von Bou Azzer. Lapis 2006, 31, 27–68. [Google Scholar]
 - Weiß, S.; Lengauer, C.L.; Parodi, G. Roselith, Wendwilsonit und kobalt-haltiger Talmessit: Neufunde aus Agh-bar bei Bou Azzer, Marokko. Lapis 2002, 27, 37–41. [Google Scholar]
 - Yang, H.; Jenkins, R.A.; Downs, R.T.; Evans, S.H.; Tait, K.T. Rruffite, Ca2Cu(AsO4)2·2H2O, a new member of the roselite group, from Tierra Amarilla, Chile. Can. Miner. 2011, 49, 877–884. [Google Scholar] [CrossRef]
 - Lévy, M.; Children, J.G. Account of a new mineral substance. Ann. Philos. 1824, 8, 439–442. [Google Scholar]
 - Schrauf, A. Roselite. Jahrb. Mineral. 1874, 868. [Google Scholar]
 - Schrauf, A. Zur Charakteristik der Mineralspecies Roselit. Tschermak’s Mineral. Mitt. 1873, 291–293. [Google Scholar]
 - Schrauf, A. Monographie des Roselith. Tschermak’s Mineral. Mitt. 1874, 137–160. [Google Scholar]
 - Peacock, M.A. Roselite and the rule of highest pseudosymmetry. Am. Mineral. 1936, 21, 589–603. [Google Scholar]
 - Kolitsch, U.; Fleck, M. Third update on compounds with krohnkite-type chains: The crystal structure of wend-wilsonite [Ca2Mg(AsO4)2·2H2O] and the new triclinic structure types of synthetic AgSc(CrO4)2·2H2O and M2Cu(Cr2O7)2·2H2O (M = Rb, Cs). Eur. J. Mineral. 2006, 18, 471–482. [Google Scholar] [CrossRef]
 - Hawthorne, F.C.; Ferguson, R.B. The crystal structure of roselite. Can. Mineral. 1977, 15 Pt 1, 36–42. [Google Scholar]
 - Frost, R.L. Raman and infrared spectroscopy of arsenates of the roselite and fairfieldite mineral subgroups. Spectrochim. Acta Part A Mol. Biomol. Spectrosc. 2009, 71, 1788–1794. [Google Scholar] [CrossRef][Green Version]
 - Ross, S.D. Phosphates and other oxy-anions of Group V. In The Infrared Spectra of Minerals; Farmer, V.C., Ed.; Mineralogical Society: London, UK, 1974; Volume 4, pp. 383–422. [Google Scholar]
 - Frost, R.L.; Kloprogge, J.T.; Martens, W.N. Raman spectroscopy of the arsenates and sulphates of the tsumcorite mineral group. J. Raman Spectrosc. 2004, 35, 28–35. [Google Scholar] [CrossRef]
 - Frost, R.L.; Martens, W.; Williams, P.A.; Kloprogge, J.T. Raman spectroscopic study of the vivianite arsenate minerals. J. Raman Spectrosc. 2003, 34, 751–759. [Google Scholar] [CrossRef]
 - Kloprogge, J.T.; Frost, R.L. Raman Microscopy Study of Cafarsite. Appl. Spectrosc. 1999, 53, 874–880. [Google Scholar] [CrossRef]
 - Martens, W.; Frost, R.L.; Kloprogge, J.T. Raman spectroscopy of synthetic erythrite, partially dehydrated erythrite and hydrothermally synthesized dehydrated erythrite. J. Raman Spectrosc. 2002, 34, 90–95. [Google Scholar] [CrossRef]
 - Martens, W.N.; Frost, R.L.; Kloprogge, J.T.; Williams, P.A. The basic copper arsenate minerals olivenite, cornubite, cornwallite, and clinoclase: An infrared emission and Raman spectroscopic study. Am. Miner. 2003, 88, 501–508. [Google Scholar] [CrossRef]
 - Martens, W.N.; Kloprogge, J.T.; Frost, R.L.; Rintoul, L. Site occupancy of Co and Ni in erythrite-annabergite solid solutions deduced by vibrational spectroscopy. Can. Mineral. 2005, 43, 1065–1075. [Google Scholar] [CrossRef]
 - Martens, W.N.; Kloprogge, J.T.; Frost, R.L.; Rintoul, L. Single-crystal Raman study of erythrite, Co3(AsO4)2·8H2O. J. Raman Spectrosc. 2004, 35, 208–216. [Google Scholar] [CrossRef][Green Version]
 - Kloprogge, J.T.; Frost, R.L. A Raman microscopy study of tyrolite: A multi-anion arsenate mineral. Appl. Spectrosc. 2000, 54, 517–521. [Google Scholar] [CrossRef]
 - Frost, R.L.; Kloprogge, J.T.; Weier, M.L.; Martens, W.N.; Ding, Z.; Edwards, H.G.H. Raman spectroscopy of selected arsenates—Implications for soil remediation. Spectrochim. Acta Part A 2003, 59, 2241–2246. [Google Scholar] [CrossRef]
 - Frost, R.L.; Kloprogge, J. Raman spectroscopy of some complex arsenate minerals—Implications for soil remediation. Spectrochim. Acta Part A Mol. Biomol. Spectrosc. 2003, 59, 2797–2804. [Google Scholar] [CrossRef]
 - Dunn, P.J.; Sturman, B.D.; Nelen, J.A. Wendwilsonite, the magnesium analogue of roselite, from Morocco, New Jersey, and Mexico, and new data on roselite. Am. Mineral. 1987, 72, 217–221. [Google Scholar]
 - Frost, R.L.; Scholz, R.; Lopez, A.; Belotti, F.M.; Xi, Y. Structural characterization and vibrational spectroscopy of the arsenate mineral wendwilsonite. Spectrochim. Acta Part A Mol. Biomol. Spectrosc. 2014, 118, 737–743. [Google Scholar] [CrossRef] [PubMed][Green Version]
 - Rruff. Database of Raman Spectroscopy, X-ray Diffraction and Chemistry of Minerals. Available online: http://rruff.info/ (accessed on 3 September 2020).
 
Publisher’s Note: MDPI stays neutral with regard to jurisdictional claims in published maps and institutional affiliations.  | 
© 2021 by the authors. Licensee MDPI, Basel, Switzerland. This article is an open access article distributed under the terms and conditions of the Creative Commons Attribution (CC BY) license (https://creativecommons.org/licenses/by/4.0/).