Article

Synthesis, Crystal Structure and Optical Properties of 2-(3-(Hexyloxy)-5-Methylphenoxy)-N-(4-Nitrophenyl)acetamide for Anion Detection

by
Piangkwan Jansukra
1,
Tanwawan Duangthongyou
1,
Songwut Suramitr
2,
Kittipong Chainok
3 and
Boontana Wannalerse
1,*
1
Department of Chemistry and Center of Excellence for Innovation in Chemistry, Faculty of Science, Kasetsart University, Chatuchak, Bangkok 10900, Thailand
2
Department of Chemistry, Faculty of Science, Kasetsart University, Bangkok 10900, Thailand
3
Materials and Textile Technology, Faculty of Science and Technology, Thammasat University, Pathum Thani 12120, Thailand
*
Author to whom correspondence should be addressed.
Crystals 2021, 11(6), 671; https://doi.org/10.3390/cryst11060671
Submission received: 5 May 2021 / Revised: 3 June 2021 / Accepted: 7 June 2021 / Published: 10 June 2021

Abstract

:
In this study, 2-(3-(hexyloxy)-5-methylphenoxy)-N-(4-nitrophenyl)acetamide (sensor L1) was synthesized and characterized by FT–IR, ESI–MS, 1H and 13C NMR spectroscopy, elemental analysis, and single crystal X-ray techniques. The crystal structure and space group of sensor L1 was monoclinic and P21, respectively. The crystal packing of sensor L1 was dominantly linked by two strong hydrogen bonds forming a six membered ring pattern. The binding properties of sensor L1 and various anions (F, Cl, Br, CH3COO, C6H5COO, and H2PO4) were investigated by UV–Vis and 1H NMR spectroscopy in DMSO. The proton resonance signals of sensor L1 and F greatly changed positions when compared to those of anions. The solution color of sensor L1 changed from pale yellow to orange in the presence of F. The UV–Vis results indicate that sensor L1 and F ions underwent an internal charge transfer process. The stoichiometric complex was confirmed by Job’s method, revealing a 1:1 formation for sensor L1 and fluoride. Our results show that sensor L1 is highly selective for fluoride ions over other anions.

1. Introduction

Currently, anion sensors have been the subject of considerable interest for their numerous roles in various processes in the fields of biology, catalysis, industry, and environmental protection. Anion sensors have also been used in devices such as television screens, as well as in monitoring and microelectronic sensors [1,2,3,4,5]. Researchers are interested in anion sensors with different dimensional structures, such as 2- and 3-dimensional patterns on carbon nanotubes and MOF structures [6,7]. For example, many binding units in the molecules amide, amine, thiourea, pyrrole, urea, hydroxyl, and boronic moieties are bound to anions through hydrogen bonding, anion π interaction, electrostatic force, cleavage bonds, and Lewis acid–base interactions [8,9,10,11,12,13,14,15,16]. Fluoride ions are important anions because they assist in the growth of bones and teeth. However, when a considerable number of fluoride ions remain in the human body, it can cause a variety of diseases such as bone, kidney, and gastrointestinal disorders [17,18]. The sensor–anion recognition can be observed in many processes such as internal charge transfers, twisted intramolecular charge transfers, and excited state intramolecular proton transfers [19,20,21]. 3,5-dihydroxytoluene is known as an orcinol compound. Orcinol derivatives have important roles in many applications, such as for pharmaceutical and medical functions [22,23,24,25,26,27]. Among orcinol crystal structures, there are many polymorphs, pseudopolymorphs, and co-crystals of orcinols with different co-formers such as urea, acridine, and 4-cyanopyridine. They exhibit three possible conformations (i.e., “anti-anti”, “syn-anti”, and “syn-syn”) through the packing modes of hydrogen bonds [28]. The co-crystal of an orcinol with 1,2-di(4-pyridyl)ethane can be observed in the pattern of 1D zig-zag chains that are interconnected to form a 2D layer structure by C–H–π and π–π interactions. The other co-crystal of an orcinol with 1,2-di(4-pyridyl)ethylene is formed by a 0D four component complex through hydrogen bonds [23]. The advantage of crystals of orcinol compounds and their derivatives is that they allow for the design of synthetic sensors for anion detection. Orcinolic sensors consist of substituent groups, such as –NO2 withdrawing groups, that help binding sites provide more acidic protons of the NH group in the molecule and result in a strong binding interaction with anions. Among the related literatures, Singh and coworkers prepared two new receptors based on 4-nitrobenzylidenes with a highly selective binding ability to F, AcO, and H2PO4 [29]. Erdemir et al. synthesized two new colorimetric receptors bearing one or two nitrophenyl urea moieties that specifically bound to the F ion, rather than other anions [30].
Here, we investigate the synthesis and crystallization of sensor L1, 2-(3-(hexyloxy)-5-methylphenoxy)-N-(4-nitrophenyl)acetamide, containing 3,5-dihydroxytoluene as a backbone and amide moiety as a binding site for anions. Sensor L1 was characterized by 1H, 13C NMR, ESI–MS, FT–IR, and elemental analysis. In addition, the complexation studies between sensor L1 and different anions were conducted using 1H–NMR and UV–Visible spectroscopy.

2. Experiment

2.1. Materials

All of the synthesises were used without further purification. In the titration experiment, all anions were added in the form of tetrabutylammonium (TBA) salts, which were purchased from Sigma–Aldrich Co., St. Louis, USA. Column chromatography was performed using silica gel (70–230 mesh).

2.2. Apparatus

Elemental analysis (CHNS/O) was carried out by Thermo Scientific TM FLASH 2000, Cambridge, United Kingdom. MS was performed by Agilent 1100 Series LC/MSD Trap Karlsruhe, Germany. Elemental analysis informed the percent of elements in the product. Infrared spectra (4000–400 cm−1) were obtained by a Perkin Elmer system 2000 Fourier transform infrared spectrometer, Singapore. Infrared spectra express the functional groups of the molecules. 1H and 13C NMR spectra were obtained by a Bruker, AVANCE III HD 400 MHz NMR spectrometer, Fällanden, Switzerland. 1H and 13C NMR spectra exhibit the resonance signals of the types of protons and carbons. UV–Vis spectra were recorded on a Shimadzu spectrophotometer, Kyoto, Japan. UV–Vis spectra display the absorption bands relate to the type of transitions between HOMO and LUMO.

2.3. X-ray Crystallography

Crystal of sensor L1 was selected under microscope and mounted on a Bruker D8 QUEST CMOS PHOTON II, Bremen, Germany, with graphite monochromated Mo-Kα (λ = 0.71073 Å) radiation at 296 K. Data reduction was performed with SAINT and SADABS [31]. The integrity of the symmetry was determined using PLATON [32]. The structure was solved using the ShelXT structure solution program with combined Patterson and dual-space recycling methods [33] and refined using least squares with ShelXL [34]. All non-H atoms were refined anisotropically. Mercury software was used to generate the graphic molecules [35].

2.4. Synthesis of 2-(3-(Hexyloxy)-5-Methylphenoxy)-N-(4-Nitrophenyl)acetamide, Sensor L1

The complete synthesis can be viewed in Scheme 1.

2.4.1. 2-(3-Hydroxy-5-Methylphenoxy)-N-(4-Nitrophenyl)acetamide

3,5-Dihydroxytoluene (1.50 g), potassium carbonate (3.0 g), and 2-chloro-N-(4-nitrophenyl)acetamide (2.5 g) synthesized, in accordance with Wen et al. [36], were dissolved and stirred in 35 mL of CH3CN with the addition of sodium iodide as a catalyst.
Then, the reaction mixture was stirred and refluxed at 110 °C for 16 h. The reaction mixture was extracted with H2O and 20 mL CH2Cl2 three times. The combined organic phase was dried with anhydrous Na2SO4. After the solvent was removed, the residue was purified by column chromatography over silica gel using dichloromethane:ethyl acetate (9:1) as an eluent to afford a yellow solid with a yield of 85%. mp. = 142–143 °C. 1H NMR (400 MHz, DMSO-d6):δ 10.64 (s, 1H, –NH), 9.33 (s, 1H, –OH), 8.23 (d, J = 9.40 Hz, 2H, –ArH), 7.91 (d, J = 9.20 Hz, 2H, –ArH), 6.26 (s, 1H, –ArH), 6.22 (s, 1H, –ArH), 6.19 (t, 1H, –ArH), 4.64 (s, 2H, –CH2), 2.18 (s, 3H, –CH3) 13C NMR (100 MHz, CDCl3-d):δ 167.80, 158.77, 158.35, 144.63, 142.53, 139.59, 124.92, 119.33, 106.39, 99.21, 67.08, 21.30. FT–IR (KBr, cm−1): ν 3365 (N–H stretching), 2921 (C–H stretching), 1710 (C=O stretching), 1559 (N–O stretching), 1503 (C=CAr stretching), 1334 (N–O stretching), 1255 (C–N stretching), 1172 (C–O stretching), 1109 (C–O stretching alcohol). ESI–MS: m/z calculated for C15H14N2O5 ([M+]): 302.1 found 302.6 Element analysis for C15H14N2O5 (%): C 59.60, H 4.67, N 9.27 found: C 59.55, H 4.65, N 9.06.

2.4.2. 2-(3-(Hexyloxy)-5-Methylphenoxy)-N-(4-Nitrophenyl)acetamide, (Sensor L1)

2-(3-hydroxy-5-methylphenoxy)-N-(4-nitrophenyl)acetamide) (0.50 g) and potassium carbonate (1.5 g) were dissolved in 30 mL of acetonitrile and stirred for 1 h under a N2 atmosphere. Then, a solution of 1-bromohexane (0.6 mL) and sodium iodide was added dropwise. The mixture was stirred and refluxed at 110 °C for 10 h. The reaction mixture was extracted with water and dichloromethane 50 mL three times. The combined organic phase was dried with anhydrous Na2SO4. After the solvent was removed, the residue was purified by column chromatography over silica gel using dichloromethane:ethyl acetate (9:1) as an eluent to give a yellow solid of sensor L1 with a yield of 86%. mp. = 156–157 °C. 1H NMR (400 MHz, DMSO-d6): δ10.64 (s, 1H, –NH), 8.24 (d, J = 9.20 Hz, 2H, –ArH), 7.91 (d, J = 9.30 Hz, 2H, –ArH), 6.40 (s, 1H, –ArH), 6.38 (s, 1H, –ArH), 6.36 (t, 1H, –ArH), 4.73 (s, 2H, –CH2), 3.91 (t, 2H, –CH2), 2.23 (s, 3H, –CH3), 2.08 (m, 2H, –CH2), 1.77 (m, 2H, –CH2), 1.32 (m, 4H, –CH2), 0.86 (t, 3H, –CH3). 13C NMR (100 MHz, CDCl3-d): δ 167.00, 160.65, 157.81, 144.16, 142.70, 141.11, 125.26, 119.60, 109.69, 107.70, 99.22, 68.30, 67.66, 31.70, 29.32, 25.58, 22.74, 21.96, 14.17. FT–IR (KBr, cm−1): ν 3329 (N–H stretching), 2922 (C–H stretching), 1680 (C=O stretching), 1559 (N–O stretching), 1504 (C–CAr stretching), 1404 (C–O in plan bending), 1342 (N–O stretching), 1296 (C–N stretching), 1167 (C–O stretching) ESI–MS: m/z calculated for C21H26N2O5 H+ ([M–H+]): 387.2: found 387.3. Element analysis for C21H26N2O5: C 65.27, H 6.78, N 7.25 found: C 64.83, H 6.64, N 7.00.

3. Results and Discussion

3.1. Crystal Structure and Structural Description

The light-yellow block-shaped crystals of sensor L1 were grown in the mixture of dichloromethane and hexane (1:1) solvents at room temperature. The crystal data and experimental refinement parameters of sensor L1 have been summarized in Table 1. Figure 1 exhibits the molecular structure of sensor L1 with atom labeling. The aromatic ring of 3,5-dihydroxyl toluene is combined with 4-nitrobenzene moiety by the bridging group of methylene amide with torsion angles O1–C8–C9–N1 of 17.77° and O1–C8–C9–O3 of −163.61°. In this conformation, the –NH group and oxygen atom from the previous hydroxyl group (O1) are on the same side, while the –CO group is on the opposite side. The dihedral angle between 3,5-dihydroxyl toluene and 4-nitrobenzene mean planes is 5.60°, indicating that the aromatics are almost coplanar. Additionally, another hydroxyl group of 3,5-dihydroxyl toluene at the position of C3 reacted with hexyl bromide, producing alkyl ether with torsion angles C2–C3–O2–C16 of 2.09°.
The alkyl chain (C16–C21) is in a zig-zag configuration with torsion angles in the range of 177.47–179.69°, and the dihedral angle between the plane of the alkyl chain and the aromatic plane of 3,5-dihydroxyl toluene is 7.83°. This indicates that the two functional groups on the toluene ring are almost coplanar.
The crystal packing is strongly supported by two hydrogen bonds between the –NH amide group, and the –CH in nitrobenzene with oxygen of the carbonyl group in amide of adjacent molecules (N–H∙∙∙O, and C–H∙∙∙O) with a six membered ring pattern as shown in Figure 2 and Table 2.
In addition, the crystal structure is also supported by a weak hydrogen bond between C–H of the methylene group and carbon atoms (C–H∙∙∙C), which are close to the high electronegativity atoms, N and O (Figure 2 and Table 2). The crystal packing through strong and weak hydrogen bonding interaction among the adjacent molecules in the direction of x, y + 1, z shows a one-dimensional array along the b-axis in Figure 3a. If a weaker hydrogen bond (C–H∙∙∙C) with neighbors is added in the direction of −1 − x, −1/2 + y, −1 − z, the crystal structure will appear different to that in Figure 3b–d. The selected bond length and bond angle of sensor L1 have been provided in Table 3.

3.2. Interaction between Sensor L1 and Various Anions Using UV–Vis and 1H NMR Spectroscopy

3.2.1. Colorimetric Sensor L1

The colorimetric anion recognition of sensor L1 was investigated by the naked-eye at an ambient temperature in the DMSO solution. The concentration of sensor L1 was 5 × 10⁻³ M. It was then supplemented with four equiv. of various anions such as F, Cl, Br, CH3COO, C6H5COO and H2PO4 (tetrabutylammonium salt), as depicted in Figure 4. The color of the sensor L1 solution changed from pale yellow to orange upon addition of F. This result might be due to the small size and high negative charge density of F, which induces the strongest interaction with sensor L1. For the case of CH3COO, C6H5COO, and H2SO4, the color of the sensor L1 solution changed from pale yellow to intense yellow. There was no color change in sensor L1 with the addition of Cl and Br. The 1H NMR spectrum for sensor L1 in DMSO-d6 can be found in Supplementary Material.

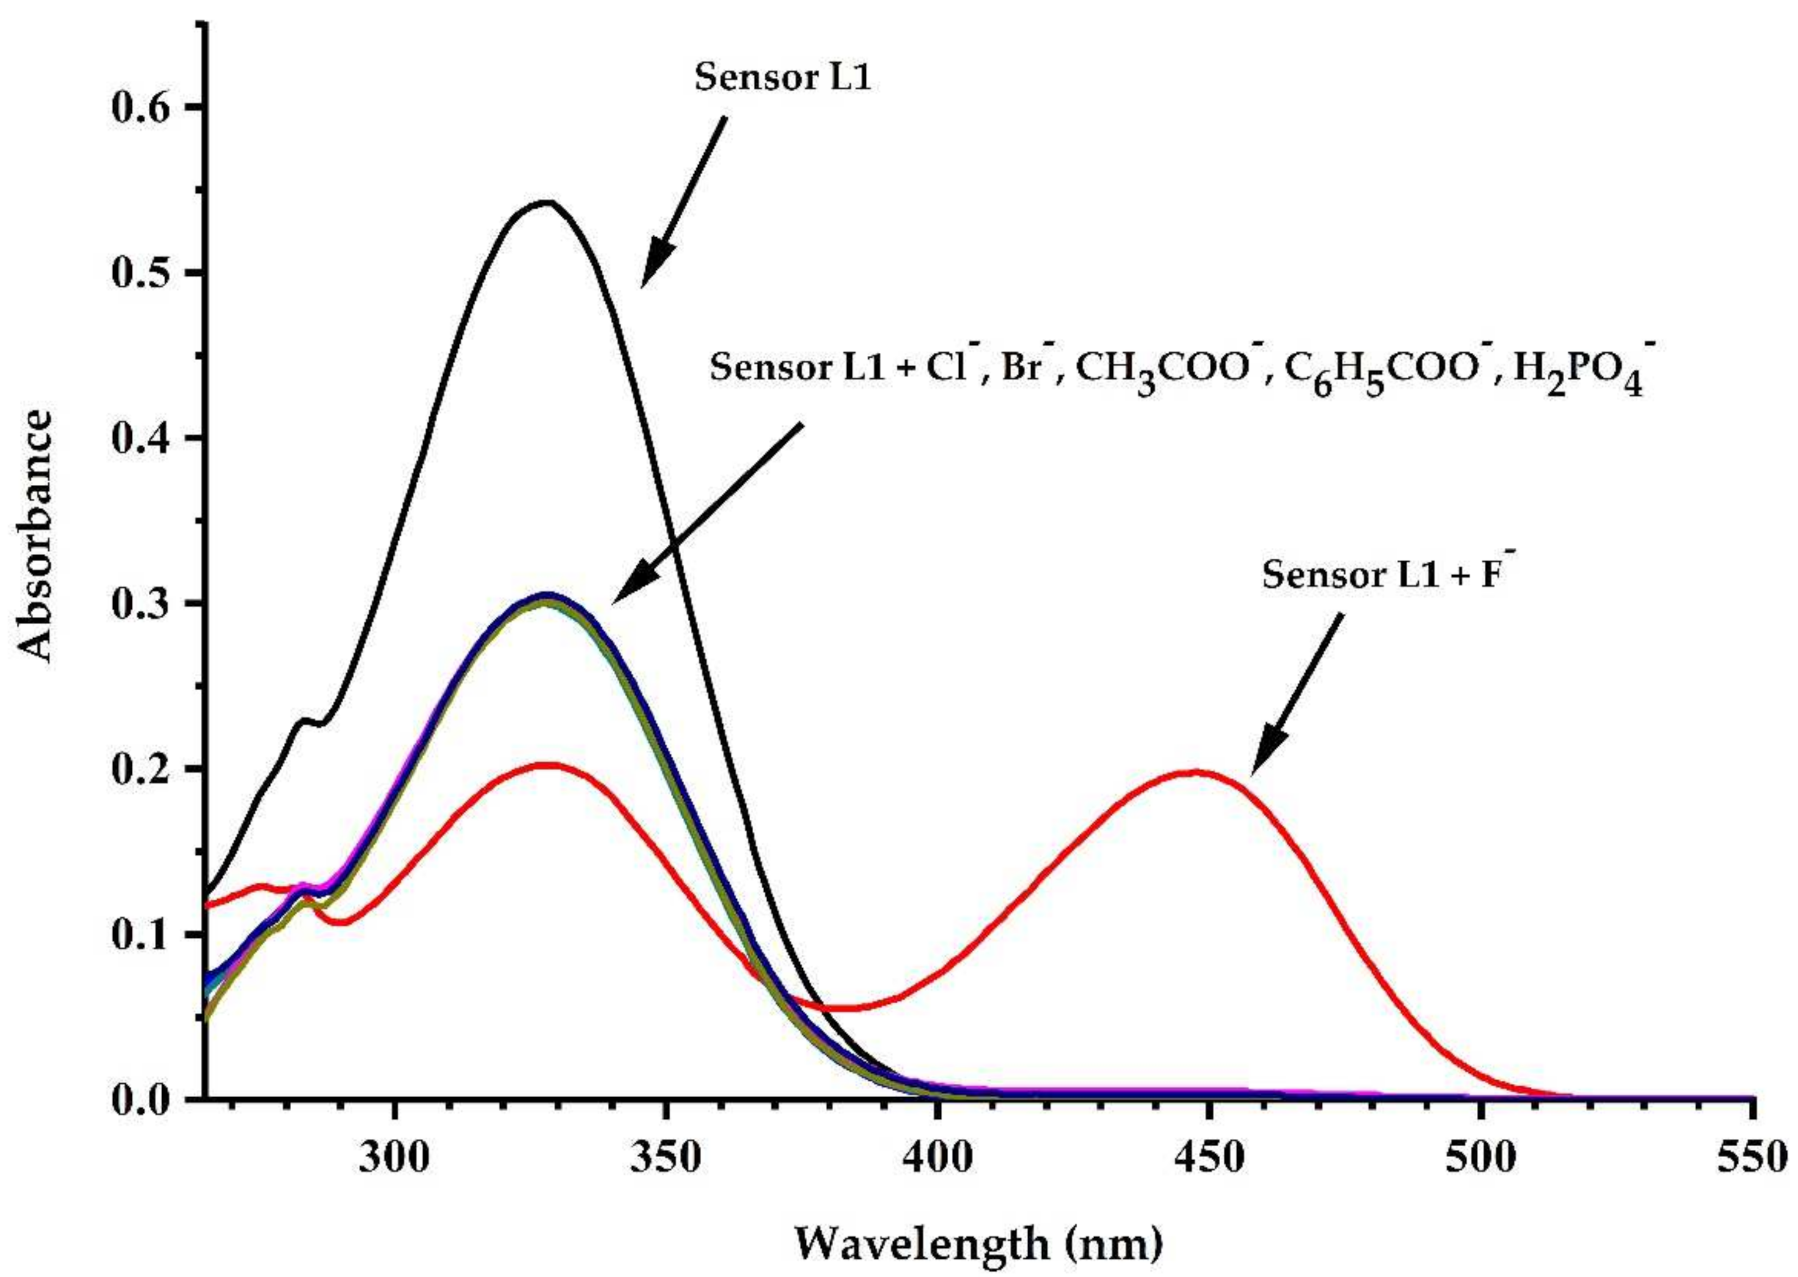
3.2.2. Interaction between Sensor L1 and Various Anions Using UV–Visible Spectroscopy

The anion binding abilities of sensor L1 were studied using UV–Vis titration with various anions such as F, Cl, Br, CH3COO, C6H5COO, and H2PO4 (as tetrabutylammonium salts). The experiment was performed by preparing 5 × 10⁻⁵ M of sensor L1 in a dimethyl sulfoxide solution. There were two absorption bands of sensor L1 that exhibited a shoulder band at approximately 284 nm and a strong band at 327 nm. Figure 5 shows the absorption spectra changes of sensor L1 in the presence of different fluoride ions (0–20 equiv.). With the addition of an increasing concentration of F ions to the sensor L1 solution, the absorption bands at 284 and 327 nm gradually decreased. In addition, a new red shift absorption band at 446 nm was observed, corresponding to a new species of the deprotonated form in the solution. An isosbestic point at 378 nm indicated that the two formations of sensor L1 were normal and deprotonated species in the equilibrium [37,38]. These results indicate that the mechanism of sensor L1 and F ions occurred under an internal charge transfer process [39]. The addition of other anions in the solution of sensor L1 caused a decrease only in the absorption bands at 284 and 327 nm because of weak interaction, as shown in Figure 6.
In Figure 7, sensor L1 with F ions exhibited an obvious new band at 446 nm. With the other anions, the spectra of sensor L1 showed a decrease in the absorption band at 284 and 327 nm without the appearance of a new absorption band. This suggests that sensor L1 is selective for F ions over other anions.
Job’s analysis presumed that the maximum absorption point estimated at the 0.50 mole fraction of [sensor L1]/([sensor L1] + [F]) indicates a 1:1 formation between sensor L1 and fluoride ions as shown in Figure 8.

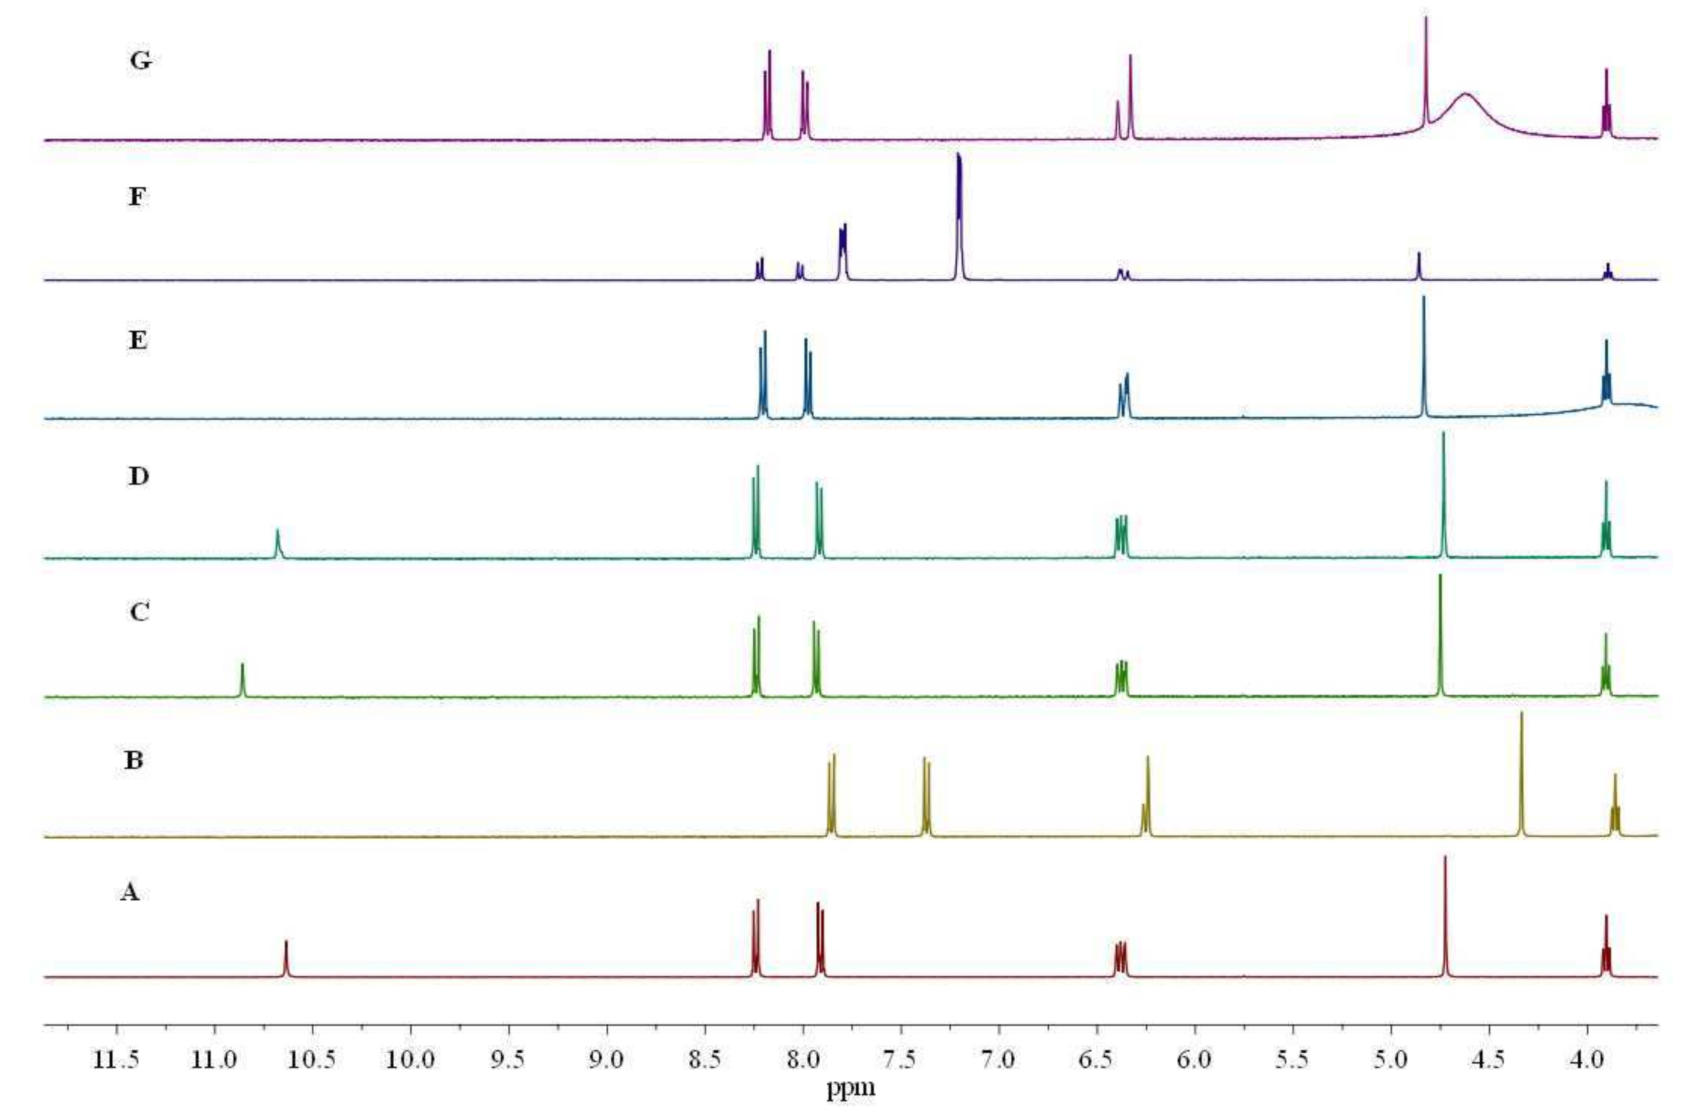
3.2.3. Interaction between Sensor L1 and Various Anions Using 1H NMR Spectroscopy

The interaction behavior of sensor L1 (5 × 10⁻³ M) with various anions such as F, Cl, Br, CH3COO, C6H5COO and H2PO4 (tetrabutylammonium salt) was investigated using 1H NMR experiments in DMSO-d6, as shown in Figure 9. The selected chemical shift assignments of sensor L1 have been listed in Table 4. Sensor L1 exhibited a sharp signal of the NH amide proton at 10.64 ppm. Upon addition of 4 equiv. F to sensor L1, the NH amide proton disappeared when under the deprotonation process, as shown in Figure 9A. In addition, the signals of aromatic protons and CH2 protons shifted upfield due to an enhancement of electron density around their region. The 1H NMR spectrum of sensor L1 with an F ion considerably changed when compared with that of other anions. In the case of CH3COO, C6H5COO, and H2PO4, the NH proton of sensor L1 also disappeared. However, the aromatic protons and CH2 protons hardly changed. In the presence of Cl and Br, the NH proton slightly shifted downfield due to weak hydrogen bonding interaction, and the aromatic protons and CH2 protons remained in unchangeable positions (Figure 9C,D).
In addition to sensor L1 with a concentration of F ions (0–4 equiv.), as shown in Figure 10, it was found that the NH signal disappeared upon the addition of F ions at a 0.5 equivalent. It was assumed that the NH proton of the amide group disappeared from the molecule because of the strength basicity of F ions. In addition, a new triplet peak was observed at 16.2 ppm, corresponding to the species of HF2 ions [38] upon the addition of 3–4 equivalents of F ion, as shown in Figure 10E,F. The aromatic protons and methyl protons gradually moved upfield with the addition of F ions from 0.5 equiv. to 4 equiv.

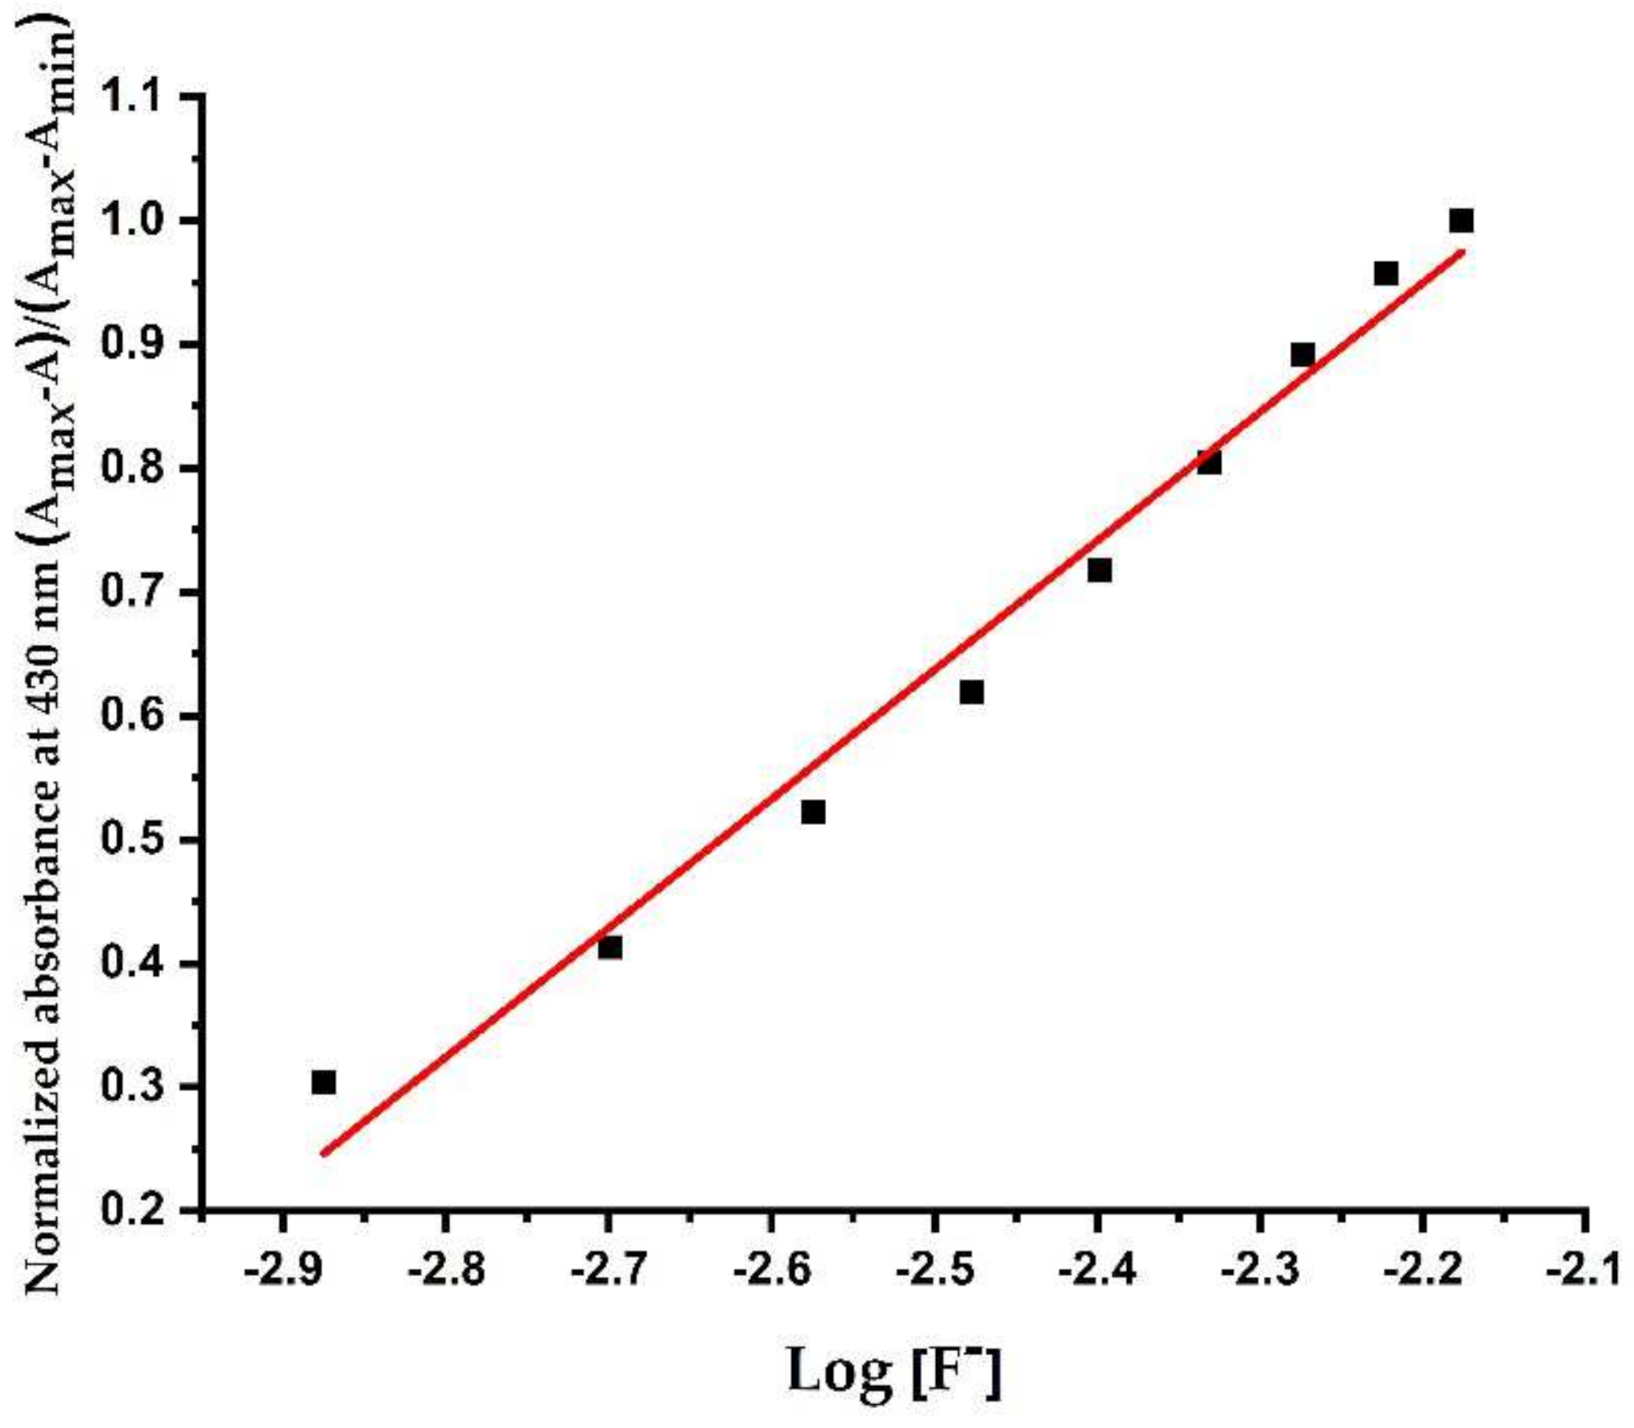
3.2.4. Determination of Association Constants (Ka) and Detection Limit of Sensor L1 with F Ions

Under a 1:1 binding complexation between sensor L1 and F ions, the association constant (Ka) was evaluated by the Benesi–Hildebrand equation as follows [40]:
1 A A 0 = 1 A m a x A 0 + 1 K a A m a x A 0 G n
The association constant of sensor L1 and F ions was determined to be 1.92 × 10³ M−1. In the other anions, this cannot be calculated since their size and shape might not be suitable for the binding site, and interactions between sensor L1 and other anions are also much weaker. From the association constants, sensor L1 showed the highest affinity binding to fluoride ions.
The detection limit between sensor L1 and F was calculated using a method present in the literature [41]. From the equation, the maximum and minimum absorbances were described as an absorbance at 430 nm of sensor L1 with 20 equivalents F and an absorbance at 430 nm of sensor L1, respectively. (Figure 11) The detection limits of F with sensor L1 was determined to be 0.77 mM.

4. Conclusions

In summary, sensor L1 was successfully designed and synthesized, including the product of crystals. The crystal structure revealed that the planes of the two functional groups (the alkyl chain and nitro benzene) were almost coplanar with the plane of toluene. The crystal packing was mainly supported by strong and weak hydrogen bonds, creating a one-dimensional array along the b-axis. From the 1H NMR results, the new HF2 species of L1 was found at 16.2 ppm following the addition of fluoride ions. This result occurred via a deprotonation process. From UV–Vis titration in DMSO, it could be observed that sensor L1 displayed an isosbestic point at 378 nm and a new absorption band at 446 nm, leading to a deprotonated form. Sensor L1 has a stronger interaction with fluoride ions than with other anions. Therefore, sensor L1 can be used as a fluoride sensor.

Supplementary Materials

The following are available online at https://www.mdpi.com/article/10.3390/cryst11060671/s1, Figure S1: 1H NMR spectrum of sensor L1 in DMSO-d6.

Author Contributions

Conceptualization, methodology, funding acquisition and writing—original draft, B.W.; methodology, and writing, P.J.; writing, and methodology, T.D.; methodology, S.S. and K.C. All authors have read and agreed to the published version of the manuscript.

Funding

The authors thank the Kasetsart University Research and Development Institute and the Center of Excellence for Innovation in Chemistry (PERCH–CIC), the Ministry of Higher Education, Science, Research and Innovation.

Institutional Review Board Statement

Not applicable.

Informed Consent Statement

Not applicable.

Data Availability Statement

Not applicable.

Acknowledgments

The authors would like to thank the Department of Chemistry, Faculty of Science, Kasetsart University for supporting on certain facilities and equipment.

Conflicts of Interest

The authors declare no conflict of interest.

References

  1. Hein, R.; Beer, P.D.; Davis, J.J. Electrochemical Anion Sensing: Supramolecular Approaches. Chem. Rev. 2020, 120, 1888–1935. [Google Scholar] [CrossRef] [PubMed]
  2. Li, Z.; Rao, C.; Chen, L.; Fu, C.; Zhu, T.; Chen, X.; Liu, C. Addition of α-Cyanomethylpyridine to Naphthalimide via Trifluoromethyl-Directed CH Functionalization: Cyanide Sensing in Aqueous Media. J. Org. Chem. 2019, 84, 7518–7522. [Google Scholar] [CrossRef]
  3. Xiao, Y.; Chu, W.-K.; Ng, C.-O.; Cheng, S.-C.; Tse, M.-K.; Yiu, S.-M.; Ko, C.-C. Design and Synthesis of Luminescent Bis(isocyanoborato) Rhenate(I) Complexes as a Selective Sensor for Cyanide Anion. Organometallics 2020, 39, 2135–2141. [Google Scholar] [CrossRef]
  4. Guo, C.; Sun, S.; He, Q.; Lynch, V.M.; Sessler, J.L. Pyrene-Linked Formylated Bis(dipyrromethane): A Fluorescent Probe for Dihydrogen Phosphate. Org. Lett. 2018, 20, 5414–5417. [Google Scholar] [CrossRef]
  5. Choi, S.-J.; Yoon, B.; Lin, S.; Swager, T.M. Functional Single-Walled Carbon Nanotubes for Anion Sensing. ACS Appl. Mater. Interfaces 2020, 12, 28375–28382. [Google Scholar] [CrossRef]
  6. Jo, Y.; Chidalla, N.; Cho, N.-G. Bis-ureidoquinoline as a Selective Fluoride Anion Sensor through Hydrogen-Bond Interactions. J. Org. Chem. 2014, 79, 9418–9422. [Google Scholar] [CrossRef] [PubMed]
  7. Qiu, Q.; Chen, H.; You, Z.; Feng, Y.; Wang, X.; Wang, Y.; Ying, Y. Shear Exfoliated Metal–Organic Framework Nanosheet-Enabled Flexible Sensor for Real-Time Monitoring of Superoxide Anion. ACS Appl. Mater. Interfaces 2020, 12, 5429–5436. [Google Scholar] [CrossRef] [PubMed]
  8. Singh, H.; Devi, M.; Jena, N.; Iqbal, M.M.; Nailwal, Y.; De Sarkar, A.; Pal, S.K. Proton-Triggered Fluorescence Switching in Self-Exfoliated Ionic Covalent Organic Nanosheets for Applications in Selective Detection of Anions. ACS Appl. Mater. Interfaces 2020, 12, 13248–13255. [Google Scholar] [CrossRef]
  9. Tretyakova, N.Y.; Lebedev, A.T.; Petrosyan, V.S. Degradetive Pathways for Aqueous Chlorination of Orcinol. Envion. Sci. Technol. 1994, 28, 606–613. [Google Scholar] [CrossRef] [PubMed]
  10. Bao, X.; Zhou, Y.; Song, B. Recognition and Sensing Propeties a Quinazonyl Aminothiourea-Based Anion Receptor in Non-Aqueous and Aqueous CH3CH-DMSO Medium. Sens. Actuators B Chem. 2012, 171–172, 550–555. [Google Scholar] [CrossRef]
  11. Joo, T.Y.; Singh, N.; Lee, G.W.; Jang, D.O. Benzimidazole-Based Ratiometric Fluorescent Receptor for Selective Recognition of Acetate. Tetrahedron Lett. 2007, 48, 8846–8850. [Google Scholar] [CrossRef]
  12. Kwon, J.Y.; Jang, Y.J.; Kim, S.K.; Lee, K.-H.; Kim, J.S.; Yoon, J. Unique Hydrogen Bonds between 9-Anthracenyl Hydrogen and Anions. J. Org. Chem. 2004, 69, 5155–5157. [Google Scholar] [CrossRef]
  13. Li, Q.; Wu, Y.; Liu, Y.; Shangguan, L.; Shi, B.; Zhu, H. Rationally Designed Self-Immolative Rotaxane Sensor Based on Pillar[5]arene for Fluoride Sensing. Org. Lett. 2020, 22, 6662–6666. [Google Scholar] [CrossRef]
  14. Kim, Y.-J.; Kwak, H.; Lee, S.J.; Lee, J.S.; Kwon, H.J.; Nam, S.H.; Lee, K.; Kim, C. Urea/Thiourea-Based Colorimetric Chemosensors for the Biologically Important Ions: Efficient and Simple Sensors. Tetrahedron 2006, 62, 9635–9640. [Google Scholar] [CrossRef]
  15. Li, Y.; Li, J.; Lin, H.; Shao, J.; Cai, Z.-S.; Lin, H. A Novel Colorimetric Receptor Responding AcO− Anions based on an Azo Derivative in DMSO and DMSO/water Solution. J. Lumin 2010, 130, 466–472. [Google Scholar] [CrossRef]
  16. Ling, L.; Hu, J.; Zhang, H. Ferrocene Containing N-tosylhydrazones as Optical and Electrochemical Sensors for Hg2+, Cu2+ and F Ions. Tetrahedron 2019, 75, 2472–2481. [Google Scholar] [CrossRef]
  17. Muwal, P.K.; Nayal, A.; Jaiswal, M.K.; Pandey, P.S. A Dipyrromethane based Receptor as a Dual Colorimetric Sensor for F and Cu2+ Ions. Tetrahedron Lett. 2018, 59, 29–32. [Google Scholar] [CrossRef]
  18. Gautham, B.U.; Narayana, B.; Sarojini, B.K.; Manjunatha, J.G.; Suresh, N.K. Colorimetric ‘Naked Eye’ Sensor for Fluoride Ion based on Isatinhydrazones via Hydrogen Bond Formation: Design, Synthesis and Characterization ascertained by Nuclear Magnetic Resonance, Ultraviolet–Visible, Computational and Electrochemical studies. Inorg. Chem. Commun. 2020, 121, 108216. [Google Scholar] [CrossRef]
  19. Chen, W.; Guo, C.; He, Q.; Chi, X.; Lynch, V.M.; Zhang, Z.; Su, J.; Tian, H.; Sessler, J.L. Molecular Cursor Caliper: A Fluorescent Sensor for Dicarboxylate Dianions. J. Am. Chem. Soc. 2019, 141, 14798–14806. [Google Scholar] [CrossRef] [PubMed]
  20. Reena, V.; Suganya, S.; Velmathi, S. Synthesis and anion binding studies of azo-Schiff bases: Selective colorimetric fluoride and acetate ion sensors. J. Fluor. Chem. 2013, 153, 89–95. [Google Scholar] [CrossRef]
  21. Yu, X.-F.; Xiao, B.; Cheng, J.; Liu, Z.-B.; Yang, X.; Li, Q. Theoretical Design of Near-Infrared Fluorescent Sensor for F Anion Detection Based on 10-Hydroxybenzo[h]quinoline Backbone. ACS Omega 2019, 4, 10516–10523. [Google Scholar] [CrossRef] [Green Version]
  22. Lv, T.-T.; Ju, C.-G.; Liu, B.-N.; Ren, X.-H.; Shan, G.-S.; Jia, T.-Z. Determination of Orcinol Glucoside by LC-MS in Curculigo Orchiioides and Its Application to a Pharmacokinetic Study. Rev. Bras. Farmacogn. 2019, 29, 744–748. [Google Scholar] [CrossRef]
  23. Rautenberg, M.; Bhattacharya, B.; Akhmetova, I.; Emmerling, F. Mechanochemical and Solution Syntheses of Two Novel Cocrystals of Orcinol with Two N,N′-Dipyridines: Structural Diversity with Varying Ligand Flexibility. J. Mol. Struct. 2020, 1217, 128303. [Google Scholar] [CrossRef]
  24. Kanekar, Y.; Basha, K.; Duche, S.; Gupte, R.; Kapat, A. Regioselective Synthesis of Phenanthrenes and Evaluation of their Anti-Oxidant based Anti-Inflammatory Potential. Eur. J. Med. Chem. 2013, 67, 454–463. [Google Scholar] [CrossRef] [PubMed]
  25. Krishna, B.R.; Thummuri, D.; Naidu, V.G.M.; Ramakrishna, S.; Mallavadhani, U.V. Synthesis of Some Novel Orcinol based Coumarin Triazole Hybrids with Capabilities to Inhibit RANKL-Induced Osteoclastogenesis through NF-κB Signaling Pathway. Bioorg. Chem. 2018, 78, 94–102. [Google Scholar] [CrossRef]
  26. Pham, P.J.; Hernandez, R.; French, W.T.; Estill, B.G.; Mondala, A.H. A Spectrophotometric Method for Quantitative Determination of Xylose in Fermentation Medium. Biomass Bioenergy 2011, 35, 2814–2821. [Google Scholar] [CrossRef]
  27. Monde, K.; Satoh, H.; Nakamura, M.; Tamura, M.; Takasygi, M. Organochloride Compounds from a Terrestrial Higher Plant: Structure and Origin of Chlorinated Orcinol Derivatives from Diseased Bulbs of Lilium Maximowiczii. J. Nat. Prod. 1998, 61, 913–921. [Google Scholar] [CrossRef]
  28. Mukherjee, A.; Grobelny, P.; Thakur, T.S.; Desiraju, G.R. Polymorphs, Pseudopolymorphs, and Co-Crystals of Orcinol: Exploring the Structural Landscape with High Throughput Crystallography. Cryst. Growth Des. 2011, 11, 2637–2653. [Google Scholar] [CrossRef]
  29. Singh, A.; Nishith, U.; Trivedi, D.R. Spectroscopic Studies of Colorimetric Receptors for Detection of Biologically Important Inorganic F−, AcO− and H2PO4− Anions in Organo-Aqueous Medium: Real-Life Application. Inorg. Chem. Commun. 2020, 115, 107874. [Google Scholar] [CrossRef]
  30. Erdemir, S.; Kocyigit, O.; Alici, O.; Malkondu, S. ‘Naked-Eye’ Detection of F Ions by Two Novel Colorimetric Receptors. Tetrahedron Lett. 2013, 54, 613–617. [Google Scholar] [CrossRef]
  31. Bruker, S. APEX3, SAINT and SADABS; Bruker AXS Inc.: Madison, WI, USA, 2016. [Google Scholar]
  32. Spek, A.L. PLATON SQUEEZE: A Tool for the Calculation of the Disordered Solvent Contribution to the Calculated Structure Factors. Acta Cryst. 2015, C71, 9–18. [Google Scholar]
  33. Sheldrick, G.M. SHELXT—Integrated Space-Group and Crystal-Structure Determination. Acta Cryst. 2015, A71, 3–8. [Google Scholar] [CrossRef] [PubMed] [Green Version]
  34. Sheldrick, G.M. Crystal Structure Refinement with SHELXL. Acta Cryst. 2015, C71, 3–8. [Google Scholar]
  35. Macrae, C.F.; Bruno, I.J.; Chisholm, J.A.; Edgington, P.R.; McCabe, P.; Pidcock, E.; Rodriguez-Monge, L.; Taylor, R.J.; van de Streek, J.; Wood, P. Mercury CSD 2.0—New Features for the Visualization and Investigation of Crystal Structures. J. Appl. Crystallogr. 2008, 41, 466–470. [Google Scholar] [CrossRef]
  36. Wen, Y.-H.; Li, X.-M.; Xu, L.-L.; Tang, X.-F.; Zhang, S.-S. 2-Chloro-N-(4-nitrophenyl)acetamide. Acta Cryst. 2006, E62, o4427–o4428. [Google Scholar] [CrossRef]
  37. Deka, B.; Sarma, R.J. Concentration Dependent Colour Switching of Tryptophan-Derived 3,5-dinitrobenzamide Ligands in the Presence of Fluoride Anions. Sens. Actuators B Chem. 2014, 197, 321–325. [Google Scholar] [CrossRef]
  38. Okudan, A.; Erdemir, S.; Kocyigit, O. ‘Naked-Eye’ Detection of Fluoride and Acetate Anions by Using Simple and Efficient Urea and Thiourea based Colorimetric Sensors. J. Mol. Struct. 2013, 1048, 392–398. [Google Scholar] [CrossRef]
  39. Peng, X.; Wu, Y.; Fan, J.; Tian, M.; Han, K. Colorimetric and Ratiometric Fluorescence Sensing of Fluoride: Tuning Selectivity in Proton Transfer. J. Org. Chem. 2005, 70, 10524–10531. [Google Scholar] [CrossRef]
  40. Zou, L.; Yan, B.; Pan, D.; Tan, Z.; Bao, X. A Colorimetric and Absorption Ratiometric Anion Sensor Based on Indole & Hydrazide Binding Units. Spectrochim. Acta Part A Mol. Biomol. Spectrosc. 2015, 148, 78–84. [Google Scholar]
  41. Wang, C.; Li, G.; Zhang, Q. A Novel Heteroacene, 2-(2,3,4,5-tetrafluorophenyl)-1H-imidazo[4,5-b]phenazine as a Multi-Response Sensor for F Detection. Tetrahedron Lett. 2013, 54, 2633–2636. [Google Scholar] [CrossRef]
Scheme 1. Synthetic pathway of sensor L1.
Crystals 11 00671 sch001
Figure 1. The molecular structure of sensor L1 with atom labeling and 50% probability displacement ellipsoids.
Crystals 11 00671 g001
Figure 2. The strong hydrogen bonds of N–H∙∙∙O and C–H∙∙∙O and the weak C–H∙∙∙C hydrogen bond. Hydrogen bonds are shown as dashed blue lines.
Crystals 11 00671 g002
Figure 3. (a) The crystal structure packing along the a-axis showing interaction between adjacent molecules only in the direction of x, y + 1, z; (bd) the packing of the crystal structure in different directions.
Crystals 11 00671 g003
Figure 4. The visible color changes in sensor L1 in DMSO solution (5.0 × 10⁻³ M) upon addition of 4 equiv. of anions in form of TBA salts: from left to right (a) free sensor L1; (b) F; (c) Cl; (d) Br; (e) CH3COO; (f) C6H5COO; and (g) H2PO4.
Crystals 11 00671 g004
Figure 5. UV–Vis absorption spectra of sensor L1 (5 × 10⁻⁵ M) in DMSO upon addition of F in the range of 0 to 20 equivalents.
Crystals 11 00671 g005
Figure 6. UV–Vis absorption spectra of sensor L1 (5 × 10⁻⁵ M) in DMSO upon addition of (a) CH3COO and (b) H2PO4 in the range of 0–20 equivalents.
Crystals 11 00671 g006
Figure 7. UV–Vis absorption spectra sensor L1 (5 × 10⁻⁵ M) in DMSO upon the addition of 20 equivalents of various anions.
Crystals 11 00671 g007
Figure 8. Job’s plot of sensor L1 with fluoride ions.
Crystals 11 00671 g008
Figure 9. 1H NMR spectra of sensor L1: (A) in DMSO-d6 (5 × 10⁻³ M) upon addition of 4 equivalents of (B) F, (C) Cl, (D) Br, (E) CH3COO, (F) C6H5COO, and (G) H2PO4.
Crystals 11 00671 g009
Figure 10. 1H NMR titration spectra of sensor L1: (A) in DMSO-d6 (5 × 10⁻³ M) upon addition of (B) F 0.5 equiv, (C) F 1.0 equiv, (D) F 2.0 equiv, (E) F 3.0 equiv, and (F) F 4.0 equiv.
Crystals 11 00671 g010
Figure 11. Normalized absorbance at 430 nm of sensor L1 with various concentrations of F ions.
Crystals 11 00671 g011
Table 1. Crystal data and structure refinement for Sensor L1.
CompoundSensor L1
CCDC Number1420420
Empirical FormulaC21H26N2O5
Formula Weight386.44
Temperature296
Wavelength (Å)0.71073
Crystal Systemmonoclinic
Space GroupP21
a (Å)9.7080(6)
b (Å)5.3052(3)
c (Å)19.8563(13)
α (°)90
β (°)98.554(2)
γ (°)90
Volume /Å31011.28(11)
Z2
Density (calculated) (g/cm3)1.269
Absorption Coefficient (mm−1)0.091
F(000)412.0
Crystal Size (mm3)0.26 × 0.14 × 0.14
Theta Range for Data Collection (°)6.224 to 52.792
Index Ranges−10 ≤ h ≤ 12, −6 ≤ k ≤ 6, −24 ≤ l ≤ 24
Reflections Collected12,231
Independent Reflections4117 [Rint = 0.0402]
Max. and Min. Transmission0.7454 and 0.6568
Data/Restraints/Parameters4117/1/255
Goodness-of-fit on F21.066
Final R Indices [I > 2sigma(I)]R1 = 0.0437, wR2 = 0.0873
R Indices (all data)R1 = 0.0733, wR2 = 0.0976
Largest Diff. Peak and Hole0.15/−0.14 e Å−3
Table 2. Hydrogen-bond geometry (Å, °).
D–H∙∙∙AD–HH∙∙∙AD∙∙∙AD–H∙∙∙A
N1–H1···O3i0.862.373.096(3)143
C15–H15···O3i0.9302.6363.178117.88
C16–H16B···C1i0.9702.8823.793156.87
C8–H8B···C10ii0.9692.8883.764150.69
Symmetry code: i: x, y + 1, z, ii: −1 − x, −1/2 + y, −1 − z.
Table 3. Selected bond length (Å) and bond angle of sensor L1.
ParametersBond Length (Å)ParametersBond Length (Å)
O1–C11.384(3)C5–C61.393(4)
O1–C81.404(3)C5–C71.513(4)
O2–C31.363(3)C8–C91.505(4)
O2–C161.435(4)C10–C111.385(4)
O3–C91.214(3)C10–C151.391(4)
O4–N21.218(4)C11–C121.378(4)
O5–N21.208(4)C12–C131.374(4)
Atom–atom–atomAngle (/°)Atom–atom–atomAngle (/°)
C1–O1–C8116.6(2)O3–C9–N1124.3(2)
C3–O2–C16117.6(2)O3–C9–C8119.4(2)
C9–N1–C10126.0(2)N1–C9–C8116.3(2)
O4–N2–C13117.3(3)C11–C10–N1122.1(2)
O5–N2–O4123.9(3)C11–C10–C15119.3(2)
O5–N2–C13118.8(3)C15–C10–N1118.6(2)
O1–C1–C2–C3−179.6(3)C4–C5–C6–C1−1.2(4)
O1–C1–C6–C5179.5(2)C6–C1–C2–C30.0(4)
O1–C8–C9–O3−163.6(3)C7–C5–C6–C1179.5(3)
O1–C8–C9–N117.7(3)C8–O1–C1–C2−160.3(2)
O2–C3–C4–C5177.0(3)C8–O1–C1–C620.1(4)
O2–C16–C17–C18−176.9(3)C9–N1–C10–C11−29.2(4)
O4–N2–C13–C12179.1(3)C9–N1–C10–C15151.6(3)
O4–N2–C13–C140.3(5)C10–N1–C9–C30.8(4)
O5–N2–C13–C12−2.4(4)C10– N1–C9–C8179.4(2)
Table 4. Selected chemical shift assignments of sensor L1.
Chemical Shifts (ppm)Assignments
10.64NH Proton at Amide Group
8.24 and 7.91CH Protons
(aromatic protons at nitroaniline)
6.40CH Protons
(aromatic protons at 3,5-dihydroxy toluene)
4.73CH2 Protons at Methyl Group
Publisher’s Note: MDPI stays neutral with regard to jurisdictional claims in published maps and institutional affiliations.

