Abstract
For the present work, calcite nanocrystals were grown by annealing precursors at 500 °C. These precursors were obtained by three different thermal schemes. Among these schemes, two involve heating at 100 °C for 16 h and 16 + 24 h, respectively. In the third scheme, heating was performed at 100 °C for 16 h, followed by annealing at 300 °C for 24 h. X-ray diffraction studies, followed by Fourier transform infrared and Raman spectroscopic studies, exhibited the formation of calcite phase of calcium carbonate. Transmission electron microscopy showed that particle sizes of synthesized calcite nanocrystals were in the range of 25–40 nm. Onsets of shape change were also observed with different thermal schemes, using these measurements. X-ray absorption spectroscopy envisaged that the coordination numbers of Ca-O and Ca-Ca shell were not influenced by the thermal schemes; however, bond lengths of these shells were modified. This study in the near edge region evidenced the manifestation of a local electronic structure of calcite when kept in an open environment, depending upon different thermal schemes.
1. Introduction
In recent years, research activities have focused on developing naturally occurring materials in the laboratory [1,2]. These activities not only pave a way to synthesize them by desired shape and size but, also, offer an understanding towards the growth mechanism of these materials [3]. One such material is calcite, a form of calcium carbonate [4,5,6], which has received significant attention in this context.
Developing suitable methods for precise control over size [7,8] and approaches towards growth inhibitors are the most appealing aspects of this material [9]. Thus, numerous studies are available investigating size, shape, and growth behavior by microscopic techniques [10,11]. Another issue in this material is related to its structural stability during synthesis and post-synthesis processes [12,13]. During synthesis, amorphous calcium carbonate grows either in a hydrated [14] or unhydrated form [15]. However, crystalline carbonate may grow either in the calcite or varsanite phase [16]. These phases may be either hydrated or unhydrated, depending upon thermal treatment. Recently, another crystalline form was observed in calcium carbonate, which was known as calcium carbonate hemihydrate [17,18]. These studies envisage that the structure of this material is highly sensitive to synthesis treatment [19,20,21].
Researchers also have studied the effect of fatty acids [22], water [23,24], alcohol [24,25], and oil [26] on the surface of calcite crystals. Thus, the surface chemistry of this material has immense potential to improve its utilization in applications affected by the nature of solvent [27,28]. Calcite surfaces are transformed to vaterite, a polymorph of calcium carbonate, when placed in a humid environment [29,30]. Calcite surfaces are extremely sensitive, even to the environments in which they are kept; hence, the purpose of this study is to explore the behavior of calcite nanocrystals when kept in an open environment.
X-ray diffraction (XRD) measurements are best for obtaining information regarding long-range crystalline order in calcium carbonate [31]; however, techniques such as Raman and Fourier transform infrared (FTIR) spectroscopy are able to provoke Ca/C-O vibrations in this material [16,32]. These studies also shed light on the space group associated with crystal structure.
Surface changes strongly depend on the nature of the local atomic/electronic structure of the materials; hence, investigations emphasizing this aspect will pave a way to understanding their behavior under these conditions. X-ray absorption spectroscopy (XAS) is a well-proven tool for investigating the local atomic structure of calcium carbonate under different conditions [33,34].
Thus, this work investigates long-range structural order, local atomic, and electronic structure by modifying the thermal schemes for synthesizing nanocrystals. Attention is given to depicting the nature of these crystals by NEXAFS measurements when kept in an open environment for longer durations.
2. Materials and Methods
Ca(NO3)2·4H2O (AR Grade) was used as starting material to form calcite nanocrystals (CN). The precursor was thermally treated at 3 different conditions before annealing at 500 °C [18]. Procedures for synthesizing these nanocrystals were given in the following schematic (Figure 1). Depending upon the synthesis scheme S1, S2 and S3, these nanocrystals were denoted as CNS1, CNS2, and CNS3.
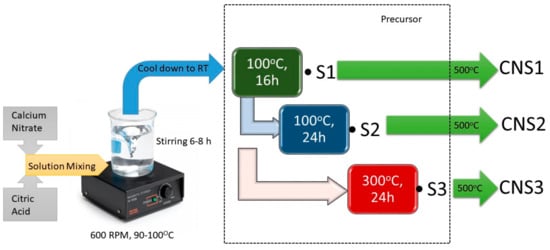
Figure 1.
Synthesis of calcite nanocrystals CNS1, CNS2 and CNS3 using thermal schemes S1, S2 and S3.
XRD measurements were performed at D8 ADVANCE (Bruker, Berlin, Germany) X-ray diffractometer using Cu Kα (λ = 1.54148 Å) radiation. Graphic program DIAMOND was employed to draw the unit cell [35]. The GSAS-EXPGUI program was used for the Rietveld structure refinement [36]. High-resolution electron microscopic study for the selected material was performed using a FEI Tecnai F20 G2 (Thermo Fisher Scientific, Landsmeer, The Netherlands) transmission electron microscope (TEM) with an operating voltage of 150 kV. Raman Spectra of these nanocrystals were measured using a Raman Spectrometer (InVia Confocal Raman Microscope, Renishaw, Gloucestershire, UK). The operating wavelength for the measurement is 532 nm. FTIR spectra of these nanocrystals were performed using a Nicolet iS10 FT-IR Spectrometer (Thermo Fisher Scientific, Waltham, MA, USA).
XAS measurements were performed at 1D XRS KIST-PAL beamline in fluorescence mode [37]. This beamline utilized a bending magnet as a source of radiation. The energy resolution (∆E/E) and photon flux were 2 × 10⁻⁴ and 1011 photon/s, respectively. Near edge, X-ray absorption fine structure (NEXAFS) measurements were carried out at 10D XAS KIST beamline in total electron yield (TEY) mode at different durations [38]. For these measurements, nanocrystals CNS1, CNS2, and CNS3 were supported on the Indium foil and placed onto a copper plate sample holder with the help of carbon tape.
To investigate the effect of moisture, these nanocrystals on the same sample holder were kept in an open environment for almost a year, and NEXAFS spectra were measured at several intervals for these nanocrystals. These measurements were performed at 0, 35, 75, 210, and 440 days after synthesis. An additional measurement for these crystals was carried out after a long time by placing them in a capped bottle.
3. Results and Discussion
3.1. Crystal Structure of Calcite Nanocrystals
Calcite belongs to the rhombohedral structure, having a space group of (Figure 2a). Figure 2b shows refined XRD patterns for the synthesized nanocrystals.
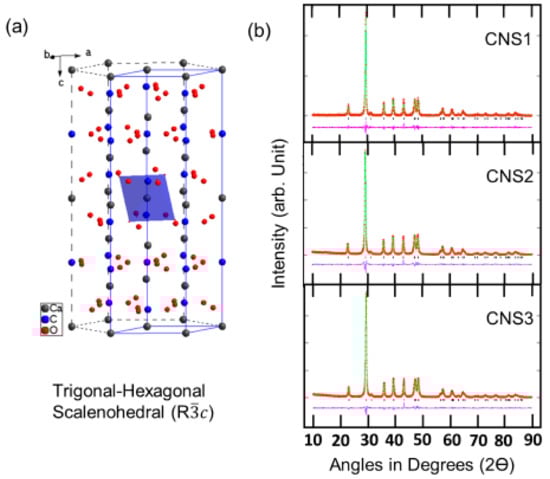
Figure 2.
(a) Unit cell corresponding to R3c space group; (b) Rietveld refinement of X-ray diffraction patterns of CNS1, CNS2, and CNS3 nanocrystals.
Both the experimental and refined patterns are in close agreement with each other. Thus, all the peaks in the patterns belong to the crystalline phase shown in Figure 2a [39]. Unit cell parameter a is 4.98, 4.99, and 4.99 Å for CNS1, CNS2, and CNS3. The parameter ‘c’ is for 17.13, 17.14, and 17.12 Å for these nanocrystals, respectively (Table S1).
The most intense peak of these XRD patterns is used to estimate crystallite size (D) from the following relation [40].
where λ is the wavelength of radiation used and θ is the diffraction angle corresponding to the most intense peak. The estimated crystallite sizes are 25, 23, and 23 nm for CNS1, CNS2, and CNS3.
Raman spectra for these nanocrystals are measured in the range (190–4000 cm−1) and are shown in Figure S1. These spectra show the presence of a Raman band of small intensity, positioned around 1680 cm−1. Previous studies report a sharp band around 1085 cm−1, corresponding to A1g mode in the Raman spectrum of calcite crystal [41,42]. Hence, these spectra in a relatively narrow range (1800–900 cm−1) are shown in Figure 3a for a better visualization of band characteristics of calcite crystal. Small signatures (rectangle region) are observed for the bands occurring a 1085 cm−1. This band in all spectra is shown as insets after background subtraction. A minor but sharp band can be clearly recognized for CNS1 that diminishes for CNS2 and CNS2. The presence of this band is associated with the calcite phase [41,42]. Further attention is given to the broad encircled region (1300–1400 cm−1) in the spectra of all nanocrystals. This feature, too, diminishes for CNS1, CNS2 and CNS3. Anderson reported a band of around 1388 cm−1 for CO2 dissolved in water [43]. Thus, this region may be due to contaminated CO2-like species during synthesis.
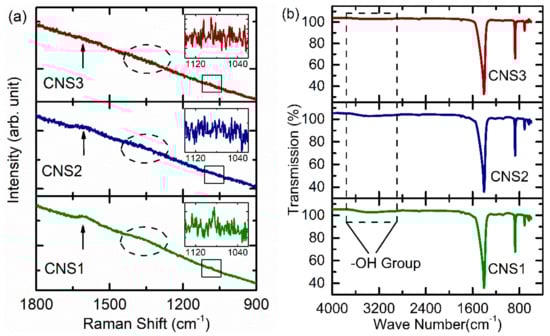
Figure 3.
(a) Raman and (b) FTIR spectra of calcite nanocrystals, CNS1, CNS2 and CNS3. Insets in Figure 3a shows the background subtracted regions highlighted by rectangles.
A visual inspection of these spectra shows that band at 1680 cm−1 (shown by arrow) is distinguishable for all nanocrystals. Raman band at 1680 cm-1 signifies the presence of -OH vibrations [44] and is associated with the hydrated nature of formed calcite. It is clear that it has negligible intensity for CNS3, showing that annealing at a higher temperature is able to produce unhydrated calcite. We further analyzed the FTIR spectra of these nanocrystals to confirm the behavior of the Raman band at 1680 cm−1. These spectra for CNS1, CNS2, and CNS3 are shown in Figure 2b. The broad bands appearing in the range of 3100–3600 cm−1 are associated with -OH modes of water species or absorbed moisture in the inorganic materials [45,46]. A careful inspection shows that the intensity of this band follows the trend of CNS1 > CNS2 > CNS3. This is associated with the thermal treatment given to the precursor. In the case of CNS1, the precursor was obtained at 100 °C for 16 h; however, thermal treatment was increased to 40 h for CNS2. Thus, longer thermal treatment helps to remove water from these nanocrystals. In the case of CNS3, the annealing sequence was 16 h heating at 100 °C, followed by heating at 300 °C for 24 h. Partial heating at higher temperatures helps to grow these nanocrystals free from H2O-like species. Thus, thermal treatment given to the precursor is fostered to control the attached water species with nanocrystals, as can be seen from both Raman and FTIR spectroscopic studies. Bands appearing at 1350 cm−1 are associated with the C-O vibration of calcium carbonate. This band is consistent and seems not to be influenced by the various thermal schemes. Other bands in the FTIR spectra for CNS1, CNS2, and CNS3 are observed at 873, 712, and 636 cm−1 (Table S2). These bands are the characteristics of the calcite phase of calcium carbonate [15,47,48].
3.2. Particle Size and Shape Investigations
Figure 4 shows the results obtained from high resolution transmission electron microscope (HRTEM) investigations of these nanocrystals. In Figure 4a, TEM micrographs reveal that each nanocrystal contains crystals of different morphology. Most of the particles have spherical shapes; however, some particles with cuboid shapes are also observed (Figure 4a). Particle shape is highlighted either by rectangular or circle region. A number of researchers have observed these kinds of shapes for calcite nanocrystals. Detailed investigations on morphological aspects have been carried out by analyzing these micrographs at different magnifications. HRTEM Images shown at different magnifications reveal particles having clear boundaries for the particles CNS1 (Figure S2), CNS2 (Figure S3), and CNS3 (Figure S4). Figure 4b shows the size distribution curves for CNS1, CNS2, and CNS3. The estimated particle sizes are 29 ± 25, 37 ± 25, and 27 ± 23 nm, for CNS1, CNS2, and CNS3, respectively.
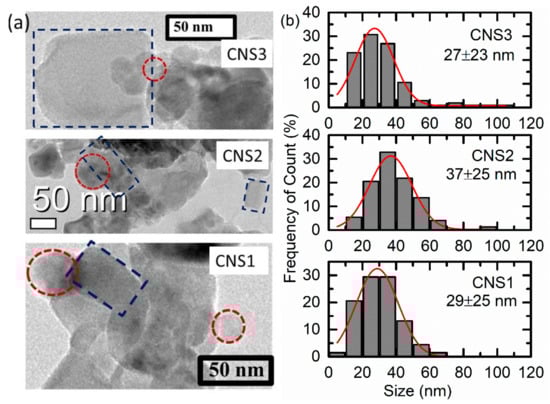
Figure 4.
(a) Shape overview, and (b) size distribution of CNS1, CNS2, and CNS3.
Selected area diffraction (SAD) patterns of CNS1, CNS2 and CNS3 are shown in Figure 5. Ring-like patterns are observed in the SAD patterns of all nanocrystals. This is associated with the polycrystalline nature of grown crystals, which is consistent with the results obtained from the XRD study (Figure 2). Rings corresponding to (012), (104), (110), (11–3), and (202) crystal planes are mentioned in the SAD patterns.
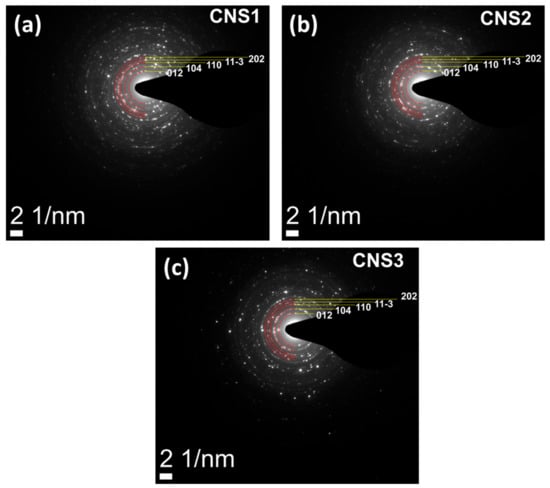
Figure 5.
Selected area diffraction patterns of (a) CNS1, (b) CNS2, and (c) CNS3.
3.3. Atomic Structure
To elucidate the role of various thermal schemes on local atomic structure of these nanocrystals, XAS spectra are analyzed (Figure 6). Figure 6a shows the XANES spectra of the CNS1, CNS2, and CNS3 nanocrystals. The main edge, Eo, estimated from these spectra occurs at 4042.7 ± 0.4 eV for CNS1, which remains same within experimental error for CNS2 and CNS3 (Table S3). These spectra exhibit the presence of the spectral features A1, A2, A3, and A4, centered at 4049.4 ± 0.4, 4060.9 ± 0.4, 4078.4 ± 0.4, and 4093.4 ± 0.4 eV (Table S3). This shows Ca2+ ions have the same crystallographic environment in these nanocrystals [49,50,51]. Brinza et al. reported a minor pre-edge structure and a shoulder around 4039 eV and 4046 eV [49]. In the present case, the intensity of the pre-edge region (encircle region) is non-significant. Furthermore, the shoulder, S, is less clear. This may be due to the low resolution of the beamline [37].
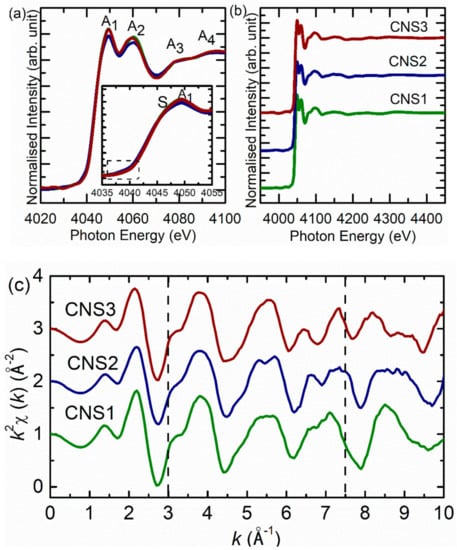
Figure 6.
(a) XANES and (b) EXAFS and (c) k-weight EXAFS spectra for CNS1, CNS2 and CNS3. Inset Figure 6a shows the edge-jump.
To depict the information on the atomic structure, these measurements were extended to the wide energy range and shown in Figure 6b. EXAFS spectra of CNS1, CNS2, and CNS3 nanocrystals are analogs to each other. Figure 6c shows k-weight EXAFS spectra of these nanocrystals. k-oscillations in the range 3–7.5 Å−1 exhibit slight modification for these nanocrystals. In this range, two oscillations occur at 3.5 and 5.6 Å−1. There is modulation of splitting with thermal schemes for oscillation around 5.6Å−1. Other major changes are observed for oscillation occurring at 7.4 Å−1. This oscillation occurs at a slightly low value for CNS1 compared to other nanocrystals. For CNS1, oscillation around this shows splitting, which increases for CNS2 and separates into two clear, well-defined oscillations for CNS3. These changes are associated with modifications in atomic structure caused by different thermal treatments.
To obtain an understanding of this modified behaviour, EXAFS spectra in the k-range of 3.5–7.5 Å−1 are simulated. The simulated non-phase corrected Fourier transforms of EXAFS spectra are shown in Figure 7a. Simulation parameters are collated in Table S4. The coordination number for Ca-O reduces with annealing temperature and attains a value close to six (Table S4). This value of CN is possessed by the calcite phase of calcium carbonate [49,50]. Ca-O and Ca-Ca bond distance change with the change in thermal treatment (Figure 6b).
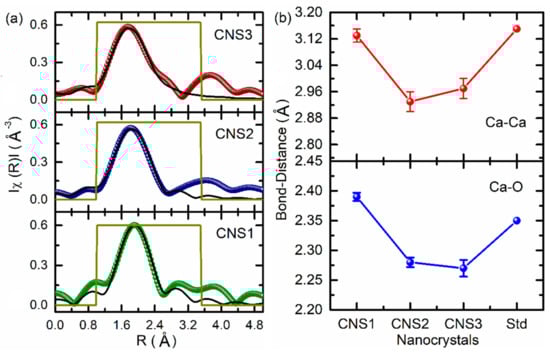
Figure 7.
(a) Non-phase corrected simulated Fourier transform of EXAFS spectra; (b) Ca-O and Ca-Ca bond lengths of CNS1, CNS2 and CNS3 nanocrystals.
3.4. Electronic Structure
Figure 8 shows NEXAFS spectra measured at O K, and Ca L spectra for CNS1, CNS2, and CNS3 nanocrystals, for the material stored in a capped bottle. O K-edge spectra for these crystals exhibit spectral features centered around 536, 538, 544, and 551 eV in the post-edge (Figure 8a). Post-edge spectral features are analogs that are reported for as-synthesized materials, as discussed in previous work from our group [19,38,52]. Similar behavior is observed for the spectral feature in the pre-edge region of these spectra (Figure 8a).
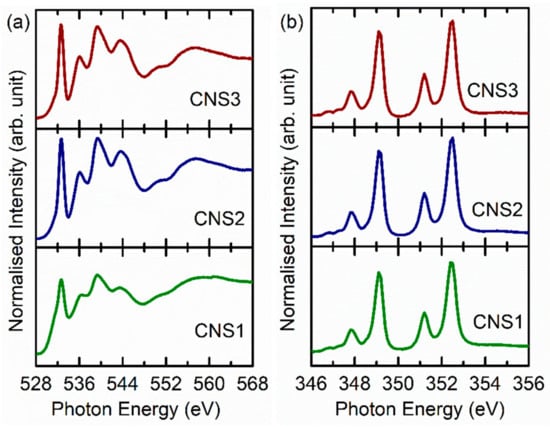
Figure 8.
(a) O K-edge, and (b) Ca L-edge NEXAFS spectra of CNS1, CNS2 and CNS3 nanocrystals.
The spectral features centered at 347, 349, 351 and 353 eV are observed in Ca L-edge spectra of these nanocrystals (Figure 8b). Thus, both the O K-edge and Ca L-edge spectra reflect the characteristics of the calcite phase [19,38,52]. This envisages that the local electronic structure remains unaffected when these nanocrystals are placed not in direct contact with the open environment.
As mentioned earlier, the ultimate objective of this work is to attain an understating of changes occurring at the atomic level when kept in an open environment; hence, these changes are investigated by performing NEXAFS measurements at several durations. To obtain more concrete information, Ca L-edge spectra of these nanocrystals at 0 (after synthesis), 35, 75, 210, and 440 days are measured for CNS1 (Figure S5), CNS2 (Figure S6), and CNS3 (Figure S7). These spectra exhibit the same spectral features for different durations, as can be seen in Supplementary Figures S5–S7. O K-edge spectrum is sensitive to external environmental influences [53]; thus, these spectra for CNS1, CNS2 and CNS3 at various days are shown in Figure 9. It is clear that, among these nanocrystals, CNS3 is greatly influenced by moisture absorbed from the environment.
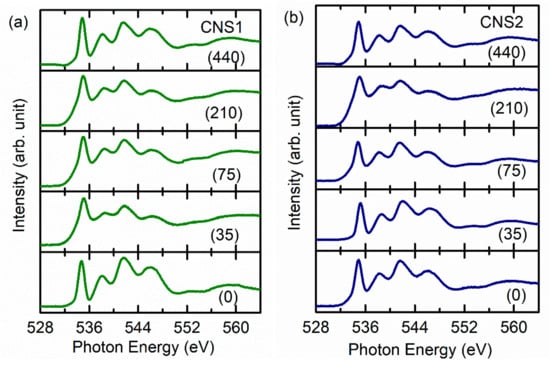
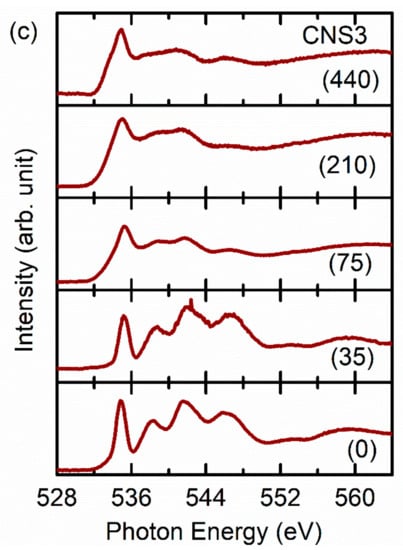
Figure 9.
O K-edge NEXAFS spectra of (a) CNS1, (b) CNS2, and (c) CNS3. Numerals 0, 35, 75, 210, and 440 are the number of days to which nanocrystals were exposed to an open environment.
This behavior is associated with the surface reconstruction caused by the absorbed molecules from the environment on the particle surfaces [29,30,54]. The adsorption process not only depends on the surface energy but also on the energy of an adsorbed molecule. In the case of the calcite crystal, surface energy differs on different surfaces [55,56,57,58]. Moreover, for the given calcite, the value of surface energy varies from 0.5–0.7 J/m2, which shows a strong dependence on the processing parameters [59,60,61]. Thus, synthesis schemes affect surface energy, which influences the interaction of adsorbed species’ surface behavior. This causes a modification in local electronic structure, depending upon the thermal schemes, as evidenced from the NEXAFS study (Figure 9).
4. Conclusions
In conclusion, we have investigated the local atomic and electronic structure of calcite nanocrystals as a function of various thermal schemes which have opted to form precursors. The calcite phase of synthesizing materials was confirmed by X-ray diffraction measurements followed by Raman and FTIR spectroscopic measurements. Transmission electron microscopic study on these nanocrystals shows the change of particle shape owing to various thermal schemes. X-ray absorption spectroscopic study reveals that both coordination number and bond distance for Ca-O and Ca-Ca bonds in these nanocrystals attains their values close to common calcite. The bond-lengths of Ca-O and Ca-Ca bonds in these nanocrystals are affected by thermal schemes and associated with atomic rearrangement owing to different thermal energy. NEXAFS spectral features in O K-edges spectra exhibit changes that depend on duration and thermal scheme. This may be due to the different surface energy of nanocrystals obtained by three schemes, which affects the interaction of these nanocrystals within the environment.
Supplementary Materials
The following are available online at https://www.mdpi.com/article/10.3390/cryst11050490/s1, Figure S1: Raman Spectra of CNS1, CNS2 and CNS3; Figure S2: TEM micrographs of CNS1 at different magnifications; Figure S3: TEM micrographs of CNS2 at different magnifications; Figure S4: TEM micrographs of CNS3 at different magnifications; Figure S5: Ca L-edge spectra measured at different durations for CNS1; Figure S6: Ca L-edge spectra measured at different durations for CNS2; Figure S7: Ca L-edge spectra measured at different durations for CNS3; Table S1: Crystallographic data obtained from Rietveld refinement of calcite nanocrystals; Table S2: Bands observed in the FTIR spectra of calcite nanocrystals; Table S3: Main edge, Eo and positions of spectral features A1, A2, A3, A4 and in eV for different nanocrystals; Table S4. Coordination number (N), Bond-distance (R), Debye-Waller factor (σ2), energy-correction (εo) and R-factor for calcite nanocrystals.
Author Contributions
Conceptualization, J.P.S. and V.S.; methodology, J.P.S., S.-H.K. and C.-H.S.; software, J.P.S., A.K.P. and V.S.; validation, S.L., J.P.S. and K.-H.C.; formal analysis, V.S. and S.-O.W.; investigation, J.P.S.; resources, K.-H.C.; data curation, J.P.S. and V.S.; writing—original draft preparation, V.S.; writing—review and editing, J.P.S.; visualization, S.L.; supervision, K.-H.C.; project administration, K.-H.C.; funding acquisition, K.-H.C. and S.L. All authors have read and agreed to the published version of the manuscript.
Funding
This research was funded by KOREA INSTITUTE OF SCIENCE AND TECHNOLOGY, SEOUL, REPUBLIC OF KOREA, grant number KIST 2V09070” and “The APC was funded by KIST2V09070”. This research was also supported by the MOTIE (Ministry of Trade, Industry & Energy (10080526) and KSRC (Korea Semiconductor Research Consortium) support program for the development of a future semiconductor device, and the National Research Foundation of Korea (NRF), with grant funded by the Korean government (MSIT) (Grant number: 2020M3H4A3081917).
Institutional Review Board Statement
Not applicable.
Informed Consent Statement
Not applicable.
Data Availability Statement
Supplementary Information is available.
Conflicts of Interest
Authors declare no conflict of interest.
References
- Xie, J.; Ping, H.; Tan, T.; Lei, L.; Xie, H.; Yang, X.-Y.; Fu, Z. Bioprocess-inspired fabrication of materials with new structures and functions. Prog. Mater. Sci. 2019, 105, 100571. [Google Scholar] [CrossRef]
- Carniato, F.; Gatti, G.; Bisio, C. An overview of the recent synthesis and functionalization methods of saponite clay. New J. Chem. 2020, 44, 9969–9980. [Google Scholar] [CrossRef]
- Krajewska, B. Urease-aided calcium carbonate mineralization for engineering applications: A review. J. Adv. Res. 2018, 13, 59–67. [Google Scholar] [CrossRef]
- Jones, B. Review of aragonite and calcite crystal morphogenesis in thermal spring systems. Sediment. Geol. 2017, 354, 9–23. [Google Scholar] [CrossRef]
- Aquilano, D.; Bruno, M.; Pastero, L. Impurity effects on habit change and polymorphic transitions in the system: Aragonite–Calcite–Vaterite. Cryst. Growth Des. 2020, 20, 2497–2507. [Google Scholar] [CrossRef]
- Toffolo, M.B.; Ricci, G.; Caneve, L.; Kaplan-Ashiri, I. Luminescence reveals variations in local structural order of calcium carbonate polymorphs formed by different mechanisms. Sci. Rep. 2019, 9, 16170. [Google Scholar] [CrossRef]
- Palmqvist, N.G.M.; Nedelec, J.-M.; Seisenbaeva, G.A.; Kessler, V.G. Controlling nucleation and growth of nano-CaCO3 via CO2 sequestration by a calcium alkoxide solution to produce nanocomposites for drug delivery applications. Acta Biomateri-Alia 2017, 57, 426–434. [Google Scholar] [CrossRef] [PubMed]
- Oiso, T.; Yamanaka, S. Template-free synthesis and particle size control of mesoporous calcium carbonate. Adv. Powder Technol. 2018, 29, 606–610. [Google Scholar] [CrossRef]
- Nielsen, M.R.; Sand, K.K.; Rodriguez-Blanco, J.D.; Bovet, N.; Generosi, J.; Dalby, K.N.; Stipp, S.L.S. Inhibition of Calcite Growth: Combined Effects of Mg2+and SO42−. Cryst. Growth Des. 2016, 16, 6199–6207. [Google Scholar] [CrossRef]
- Dobberschutz, S.; Nielson, M.R.; Sand, K.K.; Civioic, R.; Bovet, N.; Stip, S.L.S.; Andersson, M.P. the mechanisms of crystal growth inhibition by organic and inorganic inhibitors. Nat. Commun. 2018, 9, 1578. [Google Scholar] [CrossRef]
- Rodriguez-Navarro, C.; Cara, A.B.; Elert, K.; Putnis, C.V.; Ruiz-Agudo, E. Direct Nanoscale Imaging Reveals the Growth of Calcite Crystals via Amorphous Nanoparticles. Cryst. Growth Des. 2016, 16, 1850–1860. [Google Scholar] [CrossRef]
- Teir, S.; Eloneva, S.; Fogelholm, C.-J.; Zevenhoven, R. Stability of calcium carbonate and magnesium carbonate in rainwater and nitric acid solutions. Energy Convers. Manag. 2006, 47, 3059–3068. [Google Scholar] [CrossRef]
- Chen, X.; Achal, V. Effect of simulated acid rain on the stability of calcium carbonate immobilized by microbial carbonate precipitation. J. Environ. Manag. 2020, 264, 110419. [Google Scholar] [CrossRef]
- Bushuev, Y.G.; Finney, A.R.; Rodger, P.M. Stability and structure of hydrated amorphous calcium carbonate. Cryst. Growth Des. 2015, 15, 5269–5279. [Google Scholar] [CrossRef]
- Tsao, C.; Yu, P.T.; Lo, C.H.; Chang, C.K.; Wang, C.H.; Yang, Y.W.; Chan, J.C.C. Anhydrous amorphous calcium carbonate (ACC) is structurally different from the transient phase of biogenic ACC. Chem. Comm. 2019, 55, 6946–6949. [Google Scholar] [CrossRef]
- Sarkar, A.; Mahapatra, S. Synthesis of all crystalline phases of anhydrous calcium carbonate. Cryst. Growth Des. 2010, 10, 2129–2135. [Google Scholar] [CrossRef]
- Zou, Z.; Habraken, W.J.E.M.; Matveeva, G.; Jensen, A.C.S.; Bertinetti, L.; Hood, M.A.; Sun, C.-Y.; Gilbert, P.U.P.A.; Polishchuk, I.; Pokroy, B.; et al. A hydrated crystalline calcium carbonate phase: Calcium carbonate hemihydrate. Science 2019, 363, 396–400. [Google Scholar] [CrossRef] [PubMed]
- Grocholski, B. Hydrous CaCO3 gets a new structure. Science 2019, 363, 360. [Google Scholar] [CrossRef]
- Singh, J.P.; Ji, M.-J.; Shim, C.-H.; Kim, S.O.; Chae, K.H. Effect of precursor thermal history on the formation of amorphous and crystalline calcium carbonate. Particuology 2017, 33, 29–34. [Google Scholar] [CrossRef]
- Jimoh, O.A.; Ariffin, K.S.; Bin Hussin, H.; Temitope, A.E. Synthesis of precipitated calcium carbonate: A review. Carbonates Evaporites 2018, 33, 331–346. [Google Scholar] [CrossRef]
- Lam, R.S.K.; Charnock, J.M.; Lennie, A.; Meldrum, F.C. Synthesis-dependant structural variations in amorphous calcium carbonate. CrystEngComm 2007, 9, 1226–1236. [Google Scholar] [CrossRef]
- Loste, E.; Díaz-Martí, E.; Zarbakhsh, A.; Meldrum, F.C. Study of Calcium Carbonate Precipitation under a Series of Fatty Acid Langmuir Monolayers Using Brewster Angle Microscopy. Langmuir 2003, 19, 2830–2837. [Google Scholar] [CrossRef]
- Gomari, K.R.; Hamouda, A. Effect of fatty acids, water composition and pH on the wettability alteration of calcite surface. J. Pet. Sci. Eng. 2006, 50, 140–150. [Google Scholar] [CrossRef]
- Cooke, D.J.; Gray, R.J.; Sand, K.K.; Stipp, S.L.S.; Elliott, J.A. Interaction of ethanol and water with the {1014} surface of calcite. Langmuir 2010, 26, 14520–14529. [Google Scholar] [CrossRef]
- Bovet, N.; Yang, M.; Javadi, M.S.; Stipp, S.L.S. Interaction of alcohols with the calcite surface. Phys. Chem. Chem. Phys. 2014, 17, 3490–3496. [Google Scholar] [CrossRef]
- Rao, A.; Kumar, S.; Annink, C.; Le-Anh, D.; Ayirala, S.C.; Alotaibi, M.B.; Siretanu, I.; Duits, M.H.; Yousef, A.A.; Mugele, F. Mineral Interfaces and Oil Recovery: A Microscopic View on Surface Reconstruction, Organic Modification, and Wettability Alteration of Carbonates. Energy Fuels 2020, 34, 5611–5622. [Google Scholar] [CrossRef]
- Kellermeier, M.; Melero-García, E.; Glaab, F.; Klein, R.; Drechsler, M.; Rachel, R.; García-Ruiz, J.M.; Kunz, W.; García-Ruiz, J.M. Stabilization of Amorphous Calcium Carbonate in Inorganic Silica-Rich Environments. J. Am. Chem. Soc. 2010, 132, 17859–17866. [Google Scholar] [CrossRef]
- Bodnarchuk, M.S.; Heyes, D.M.; Breakspear, A.; Chahine, S.; Edwards, S.; Dini, D. Response of calcium carbonate nanopar-ticles in hydrophobic solvent to pressure, temperature, and water. J. Phys. Chem. C 2015, 119, 16879–16888. [Google Scholar] [CrossRef]
- He, H.; Yang, J.; Huang, W.; Cheng, M. Influence of Nano-Calcium Carbonate Particles on the Moisture Absorption and Mechanical Properties of Epoxy Nanocomposite. Adv. Polym. Technol. 2018, 37, 1022–1027. [Google Scholar] [CrossRef]
- Baltrusaitis, J.; Grassiana, V.H. Calcite (101¯4) surface in humid environments. Surf. Sci. 2009, 603, L99–L104. [Google Scholar] [CrossRef]
- Ramakrishna, C.; Thenepalli, T.; Ahn, J.W. Evaluation of Various Synthesis Methods for Calcite-Precipitated Calcium Car-bonate (PCC) Formation. Korean Chem. Eng. Res. 2017, 55, 279–286. [Google Scholar]
- Sun, J.; Wu, Z.; Cheng, H.; Zhang, Z.; Frost, R.L. A Raman spectroscopic comparison of calcite and dolomite. Spectrochim. Acta Part A Mol. Biomol. Spectrosc. 2014, 117, 158–162. [Google Scholar] [CrossRef]
- Avaro, J.; Moon, E.M.; Rose, J.; Rose, A.L. Calcium coordination environment in precursor species to calcium carbonate mineral formation. Geochim. Cosmochim. Acta 2019, 259, 344–357. [Google Scholar] [CrossRef]
- Sowrey, F.E.; Skipper, L.J.; Pickup, D.M.; Drake, K.O.; Lin, Z.; Smith, M.E.; Newport, R.J. Systematic empirical analysis of calcium–oxygen coordination environment by calcium K-edge XANES. Phys. Chem. Chem. Phys. 2004, 6, 188–192. [Google Scholar] [CrossRef]
- Pennington, W.T. DIAMOND—Visual crystal structure information system. J. Appl. Crystallogr. 1999, 32, 1028–1029. [Google Scholar] [CrossRef]
- Toby, B.H. EXPGUI, a graphical user interface for GSAS. J. Appl. Crystallogr. 2001, 34, 210–213. [Google Scholar] [CrossRef]
- Lee, I.J.; Yu, C.J.; Yun, Y.D.; Lee, C.S.; Seo, I.D.; Kim, H.Y.; Lee, W.W.; Chae, K.H. Construction of X-ray scattering and X-ray absorption fine structure beamline at the Pohang Light Source. Rev. Sci. Instrum. 2010, 81, 026103. [Google Scholar] [CrossRef]
- Singh, J.P.; Lim, W.C.; Won, S.O.; Kim, S.O.; Chae, K.H. Synthesis and Local Electronic Structure of Calcite Nanoparticles. J. Nanosci. Nanotechnol. 2016, 16, 11429–11433. [Google Scholar] [CrossRef]
- Graf, D.L. Crystallographic tables for the rhombohedral carbonates. Am. Mineral. 1961, 46, 1283–1316. [Google Scholar]
- Khaenamkaew, P.; Manop, D.; Tanghengjaroen, C.; Na Ayuthaya, W.P. Effect of Temperature Treatment on Electrical Property, Crystal Structures and Lattice Strains of Precipitated CaCO3 Nanoparticles. Mater. Res. 2019, 22, 20190461. [Google Scholar] [CrossRef]
- Dufresne, W.J.B.; Rufledt, C.J.; Marshall, C.P. Raman spectroscopy of the eight natural carbonate minerals of calcite structure. J. Raman. Spectroscopy. 2018, 49, 1999–2007. [Google Scholar] [CrossRef]
- Krishnamurti, D. The Raman spectrum of calcite and its interpretation. Proc. Math. Sci. 1957, 46, 183–202. [Google Scholar] [CrossRef]
- Anderson, G.R. The Raman Spectra of Carbon Dioxide in Liquid H2O and D2O. J. Phys. Chem. 1977, 81, 273–276. [Google Scholar] [CrossRef]
- Carey, D.M.; Korenowski, G.M. Measurement of the Raman spectrum of liquid water. J. Chem. Phys. 1998, 108, 2669–2675. [Google Scholar] [CrossRef]
- Al-Hosney, H.A.; Grassian, V.H. Water, sulfur dioxide and nitric acid adsorption on calcium carbonate: A transmission and ATR-FTIR study. Phys. Chem. Chem. Phys. 2005, 7, 1266–1276. [Google Scholar] [CrossRef]
- Pramanik, S.; Ghosh, S.; Roy, A.; Mukherjee, A.K. Biomineralization in human pancreas: A combined infra-red-spectroscopy, scanning electron microscopy, x-ray Rietveld analysis, and thermogravimetric study. J. Mater. Res. 2016, 3, 328–336. [Google Scholar] [CrossRef]
- Thriveni, T.; Ahn, J.W.; Ramakrishna, C.; Ahn, Y.J.; Han, C. Synthesis of nano precipitated calcium carbonate by using a carbonation process through a closed loop reactor. J. Korean Phys. Soc. 2016, 68, 131–137. [Google Scholar] [CrossRef]
- Vagenas, N.V.; Gatsouli, A.; Kontoyannis, C.G. Quantitative analysis of synthetic calcium carbonate polymorphs using FT-IR spectroscopy. Talenta 2003, 59, 831–836. [Google Scholar] [CrossRef]
- Brinza, L.; Schofield, P.F.; Hodson, M.E.; Weller, S.; Ignatyev, K.; Geraki, K.; Quinn, P.D.; Mosselmans, J.F.W. Combining µXANES and µXRD mapping to analyse the heterogeneity in calcium carbonate granules excreted by the eartphworm Lum-bricus terrestris. J. Synchrotron Radiat. 2014, 21, 235–241. [Google Scholar] [CrossRef]
- Sarret, G.; Isaure, M.-P.; Marcus, M.A.; Harada, E.; Choi, Y.-E.; Pairis, S.; Fakra, S.; Manceau, A. Chemical forms of calcium in Ca,Zn- and Ca,Cd-containing grains excreted by tobacco trichomes. Can. J. Chem. 2007, 85, 738–746. [Google Scholar] [CrossRef]
- Hayakawa, S.; Hajima, Y.; Qiao, S.; Namatame, H.; Hirokawa, T. Characterization of Calcium Carbonate Polymorphs with Ca K Edge X-ray Absorption Fine Structure Spectroscopy. Anal. Sci. 2008, 24, 835–837. [Google Scholar] [CrossRef]
- Singh, V.; Singh, J.P.; Shim, C.H.; Lee, S.; Chae, K.H. Local electronic structure of calcite Investigated using X-ray absorp-tion spectroscopy at different span of time. J. Nanosci. Nanotech 2020, 20, 6713–6717. [Google Scholar] [CrossRef] [PubMed]
- Singh, J.P.; Ji, M.-J.; Kumar, M.; Lee, I.-J.; Chae, K.H. Unveiling the nature of adsorbed species onto the surface of MgO thin films during prolonged annealing. J. Alloy. Compd. 2018, 748, 355–362. [Google Scholar] [CrossRef]
- Zhang, M.; Li, J.; Zhao, J.; Cui, Y.; Luo, X. Comparison of CH4 and CO2 Adsorptions onto Calcite(10.4), Aragonite(011)Ca, and Vaterite(010)CO3 Surfaces: An MD and DFT Investigation. ACS Omega 2020, 5, 11369–11377. [Google Scholar] [CrossRef]
- Rohl, A.L.; Wright, K.; Gale, J.D. Evidence from surface phonons for the (2 × 1) reconstruction of the (10-14) surface of calcite from computer simulation. Am. Mineral. 2003, 88, 921–925. [Google Scholar] [CrossRef]
- Roberto, M.F.; Marco, B.; Dino, A. Effect of the Surface Relaxation on the Theoretical Equilibrium Shape of Calcite. The [001] Zone. Cryst. Growth Des. 2010, 10, 4096–4100. [Google Scholar] [CrossRef]
- Aquilano, D.; Bruno, M.; Massaro, F.R.; Rubbo, M. Theoretical Equilibrium Shape of Calcite. 2. [441] Zone and Its Role in Biomineralization. Cryst. Growth Des. 2011, 11, 3985–3993. [Google Scholar] [CrossRef]
- Bruno, M.; Massaro, F.R.; Prencipe, M.; Aquilano, D. Surface reconstructions and relaxation effects in a centre-symmetrical crystal: The {00.1} form of calcite (CaCO3). CrystEngComm 2010, 12, 3626–3633. [Google Scholar] [CrossRef]
- De Leeuw, N.H.; Parker, S.C. Surface structure and morphology of calcium carbonate polymorphs calcite, aragonite, and vaterite: An atomistic approach. J. Phys. Chem. B 1998, 102, 2914–2922. [Google Scholar] [CrossRef]
- Sekkal, W.; Zaoui, A. Nanoscale analysis of the morphology and surface stability of calcium carbonate polymorphs. Sci. Rep. 2013, 3, srep01587. [Google Scholar] [CrossRef]
- Bano, A.M.; Rodger, P.M.; Quigley, D. New insight into the stability of CaCO3 surfaces and nanoparticles via molecular simula-tion. Langmuir 2014, 30, 7513–7521. [Google Scholar] [CrossRef] [PubMed]


Publisher’s Note: MDPI stays neutral with regard to jurisdictional claims in published maps and institutional affiliations. |
© 2021 by the authors. Licensee MDPI, Basel, Switzerland. This article is an open access article distributed under the terms and conditions of the Creative Commons Attribution (CC BY) license (https://creativecommons.org/licenses/by/4.0/).