Article

Crystallization Process and Site-Selective Excitation of Nd3+ in LaF3/NaLaF4 Sol–Gel-Synthesized Transparent Glass-Ceramics

1
Instituto de Cerámica y Vidrio (CSIC), Campus de Cantoblanco, 28049 Madrid, Spain
2
CELLS-ALBA Synchrotron Light Source, Carrer de la Llum 2-26, Cerdanyola del Valles, 08290 Barcelona, Spain
3
Departamento de Física Aplicada, Escuela Superior de Ingeniería, Universidad del País Vasco (UPV-EHU), 48013 Bilbao, Spain
4
Centro de Física de Materiales, (UPV/EHU-CSIC), San Sebastian, 48013 Bilbao, Spain
5
Donostia International Physics Center DIPC, San Sebastian, 20018 Gipuzkoa, Spain
*
Author to whom correspondence should be addressed.
Crystals 2021, 11(5), 464; https://doi.org/10.3390/cryst11050464
Submission received: 31 March 2021 / Revised: 16 April 2021 / Accepted: 19 April 2021 / Published: 22 April 2021
(This article belongs to the Special Issue Glass-Ceramics: Improving Glass Properties through Crystallization)

Abstract

:
In this study, transparent oxyfluoride glass-ceramics (GCs) with NaLaF4 nanocrystals (NCs) were prepared by the sol–gel method for the first time. Three different molar ratios of La(CH3COO)3/Na(CH3COO) were used to obtain the GCs, which were sintered at 450, 550 and 650 °C for 1 min. X-ray diffraction (XRD) was employed to follow the evolution of the xerogel during the heat treatments and to study crystal growth for the three temperatures. In all cases, the LaF3 crystalline phase was present, but crystallization of NaLaF4 was only promoted at 650 °C. Thermogravimetric and thermodifferential analysis (TGA-DTA) and Fourier transform infrared spectroscopy (FTIR) were used to analyze the crystallization process. High-resolution transmission electron microscopy (HRTEM) was employed to confirm NaLaF4 crystallization and determine the size distribution. The incorporation of Nd3+ ion into NaLaF4 and LaF3 nanocrystals was confirmed by site-selective emission and excitation spectra. The Nd3+ emission intensities in both phases depend not only on the NaLaF4/LaF3 ratio but also on their emission efficiencies.

Graphical Abstract

1. Introduction

In recent years, transparent oxyfluoride glass-ceramics have attracted considerable attention due to their widespread application in scintillators, phosphors, photovoltaics and solid-state lasers [1,2,3]. In particular, rare-earth (RE) fluoride crystals are excellent hosts for up- and down-conversion luminescence associated with their unique characteristics, such as their low lattice phonon energy (lower than 500 cm−1) [4,5]. The short lifetime of the SiO2 glass matrix, due to its high phonon energy, is compensated with the incorporation of the RE-fluoride nanocrystals. The final material combines the excellent mechanical and chemical properties of the glass with the luminescence of the crystalline phases [6].
The NaLnF4 (Ln = Y, Gd, La and Lu) series acts as a host material with excellent physical and chemical stability, as well as low phonon energy. Moreover, the multisite nature of the crystalline structure imparts high efficiency in light emission [7,8]. In comparison with conventional lanthanides, such as Y or Gd, NaLaF4 has the lowest phonon energy (290 cm−1) with a potentially higher up-conversion efficiency due to its non-radiation transitions [9]. It is a difficult challenge to obtain a single NaLaF4 nanocrystal phase because the strong La3+–F ionic bond favors precipitation of LaF3 phase, which has significantly lower free energy of formation than NaLaF4 [9,10,11]. A mechanism to improve the crystallization of NaLaF4 involves doping with rare-earth ions, which helps to stabilize the alkaline fluorides when its crystallization competes with that of other phases, such as LaF3 [12,13].
Recently, transparent glass-ceramics containing NaLaF4 as the only crystalline phase enclosed in a SiO2-enriched barrier have been synthesized by a conventional melting technique at 1600 °C, using LaF3 as a precursor. However, very low crystalline fractions, around 5 wt.%, were reported to maintain the transparency after crystallization at 520 °C [14,15]. Controllable LaF3/NaLaF4 crystallization by melt-quenching has also been reported recently; however, increasing the content of NaLaF4 active phase was not achieved [16,17].
Alternative techniques have been proposed to avoid the drawbacks of melt-quenching, which involve reducing high-temperature fluoride loss. The sol–gel method (SG), based on the hydrolysis and polycondensation of metal salts or metal alkoxide precursors in a solvent, is a cheap and low-temperature technique that allows fine control of the chemical composition of glass-ceramic materials. SG also permits the incorporation of optical active particles or molecules into the glass matrix [18]. An important contribution regarding the preparation of sol–gel oxyfluoride glass-ceramics was made by Fujihara et al. by employing trifluoracetic acid (TFA) as a precursor of oxyfluoride GCs for the first time [19]. This process allows for the formation of fluoride nanocrystals instead of a random dispersion of La3+ ions in the SiO2 matrix. To date, sol–gel preparation of different oxyfluoride glass-ceramics doped with REs has proven suitable for controlling the synthesis and crystallization processes [19,20,21,22], with promising optical results [23,24,25,26,27] and unique location of the RE dopants in the fluoride host. However, the preparation of oxyfluoride of NaLaF4 by an SG route has not yet been reported. The main objective of this work is to gain a first insight into the synthesis and optical properties of NaLaF4 with a view to its application in the field of photonics. To this end, SiO2-NaLaF4 GCs doped with Nd3+ were prepared using different heat treatment conditions and varying the precursor ratios. Site-selective emission and excitation spectra allow the emission of Nd3+ in the crystalline phases to be identified.

2. Materials and Methods

2.1. Synthesis of 80SiO2-20NaLaF4/LaF3 Sols

Three sols containing 20 mol% of NaLaF4 and LaF3 as active phases were prepared using tetraethyl orthosilicate (TEOS), ethanol (EtOH), acidulated water H2O (0.1M HCl), trifluoracetic acid (TFA), lanthanum acetate La(CH3COO·nH2O)3 and Na(CH3COO) as precursors. First, a Na/La solution was prepared mixing the corresponding precursors in molar ratios 1La(CH3COO)3:XNa(CH3COO):5EtOH:4H2O:5TFA (X = 0.95, 1.2 and 1.5) followed by stirring for 2 h at 40 °C in a glycerin bath under refrigeration. Separately, the SiO2 sols were prepared by mixing 3.5EtOH:1TEOS:2H2O (0.1M HCl) with constant stirring for 2 h at room temperature.
Finally, three different SiO2-NaLaF4/LaF3 sols were prepared depending on the employed Na(CH3COO)/La(CH3COO)3 molar ratio; the labels employed for the different samples are listed in Table 1.
All SiO2-NaLaF4/LaF3 sols were doped with 0.1 mol% of Nd3+ by incorporating neodymium acetate in the Na/La solutions.

2.2. Preparation of Doped and Undoped 80SiO2-20(NaLaF4/LaF3) Glass-Ceramics

Bulk samples were prepared using the undoped Sol-0.95 sol and 0.1Nd3+-doped Sol-0.95, Sol-1.2 and Sol-1.5 sols. All the sols were first filtered into a Petri dish, sealed with parafilm, and then dried at 50 °C for 4–7 days to obtain the xerogel.
Self-supported layers of composition 80SiO2-20NaLaF4/LaF3 glass-ceramics (labeled GC-0.95) were obtained from the Sol-0.95 xerogel after heat treatment at different temperatures from 450 to 650 °C for 1 min using a heating rate of 10ºC/min. Subsequently, 0.1Nd3+-doped 80SiO2-20NaLaF4/LaF3 glass-ceramics, labelled as Nd-GC-0.95, Nd-GC-1.2 and Nd-GC-1.5, were obtained from Sol-0.5, Sol-1.2 and Sol-1.5 xerogels, respectively, after heat treatment at 650 °C for 1 min using a heating rate of 10 °C/min. Both xerogels and the glass-ceramics were then milled for further characterization.

2.3. Characterization

Thermogravimetric analysis (TGA) and differential thermal analysis (DTA) were performed using an SDT Q600-TA instrument to study the thermal transformation of the powder on the Sol-0.95 xerogel. The sample was heated from 25 °C to 800 °C with a heating rate of 10 °C/min under an inert atmosphere (Ar).
X-ray diffraction (XRD) was employed to identify the crystalline phases of the powders for Nd-GC-0.95, Nd-GC-1.2 and Nd-GC-1.5 samples using an X-ray powder diffractometer (D8 advance, Bruker) working with CuKα1 radiation (λ = 1.5406 Å). The diffraction patterns were acquired in the range 10° ≤ 2θ ≤ 70°. The size of the nanocrystals (NCs) was estimated from the Scherrer equation:
D h k l = k λ β 2 b 2 c o s θ
where Dhkl is the calculated crystallite size, k = 0.94 for spherical crystals, θ is the Bragg angle and β is the full width at half maximum intensity of the peak (FWHM). To determine the weight ratios of NaLaF4 and LaF3 phases, Rietveld refinement was performed with the Fullprof program using interpolation of points to model the background. [28].
Fourier transform infrared spectra (FTIR) was recorded employing a Perkin-Elmer 100 FT-IR instrument in the range 4000–450 cm−1, with a resolution of 4 cm−1.The microstructure of the GC-0.95, GC-1.2 and GC-1.5 samples was analyzed with a high-resolution transmission electron microscope (HRTEM, JOEL JEM-2100F, Akishima, Tokyo, Japan) operating at 200 kV. The sample was prepared by dispersing a fine powder of sample in ethanol and then depositing some drops onto the carbon-enhanced copper grid.

2.4. Optical Characterization

Site-selective steady-state emission and excitation spectra were recorded by exciting the samples with a continuous wave (cw) Ti:sapphire ring laser (0.4 cm−1 linewidth) in the 770–920 nm spectral range. The fluorescence was analyzed with a 0.25 m monochromator; the signal was detected by an extended IR Hamamatsu H10330A-75 photomultiplier and amplified by a standard lock-in technique.

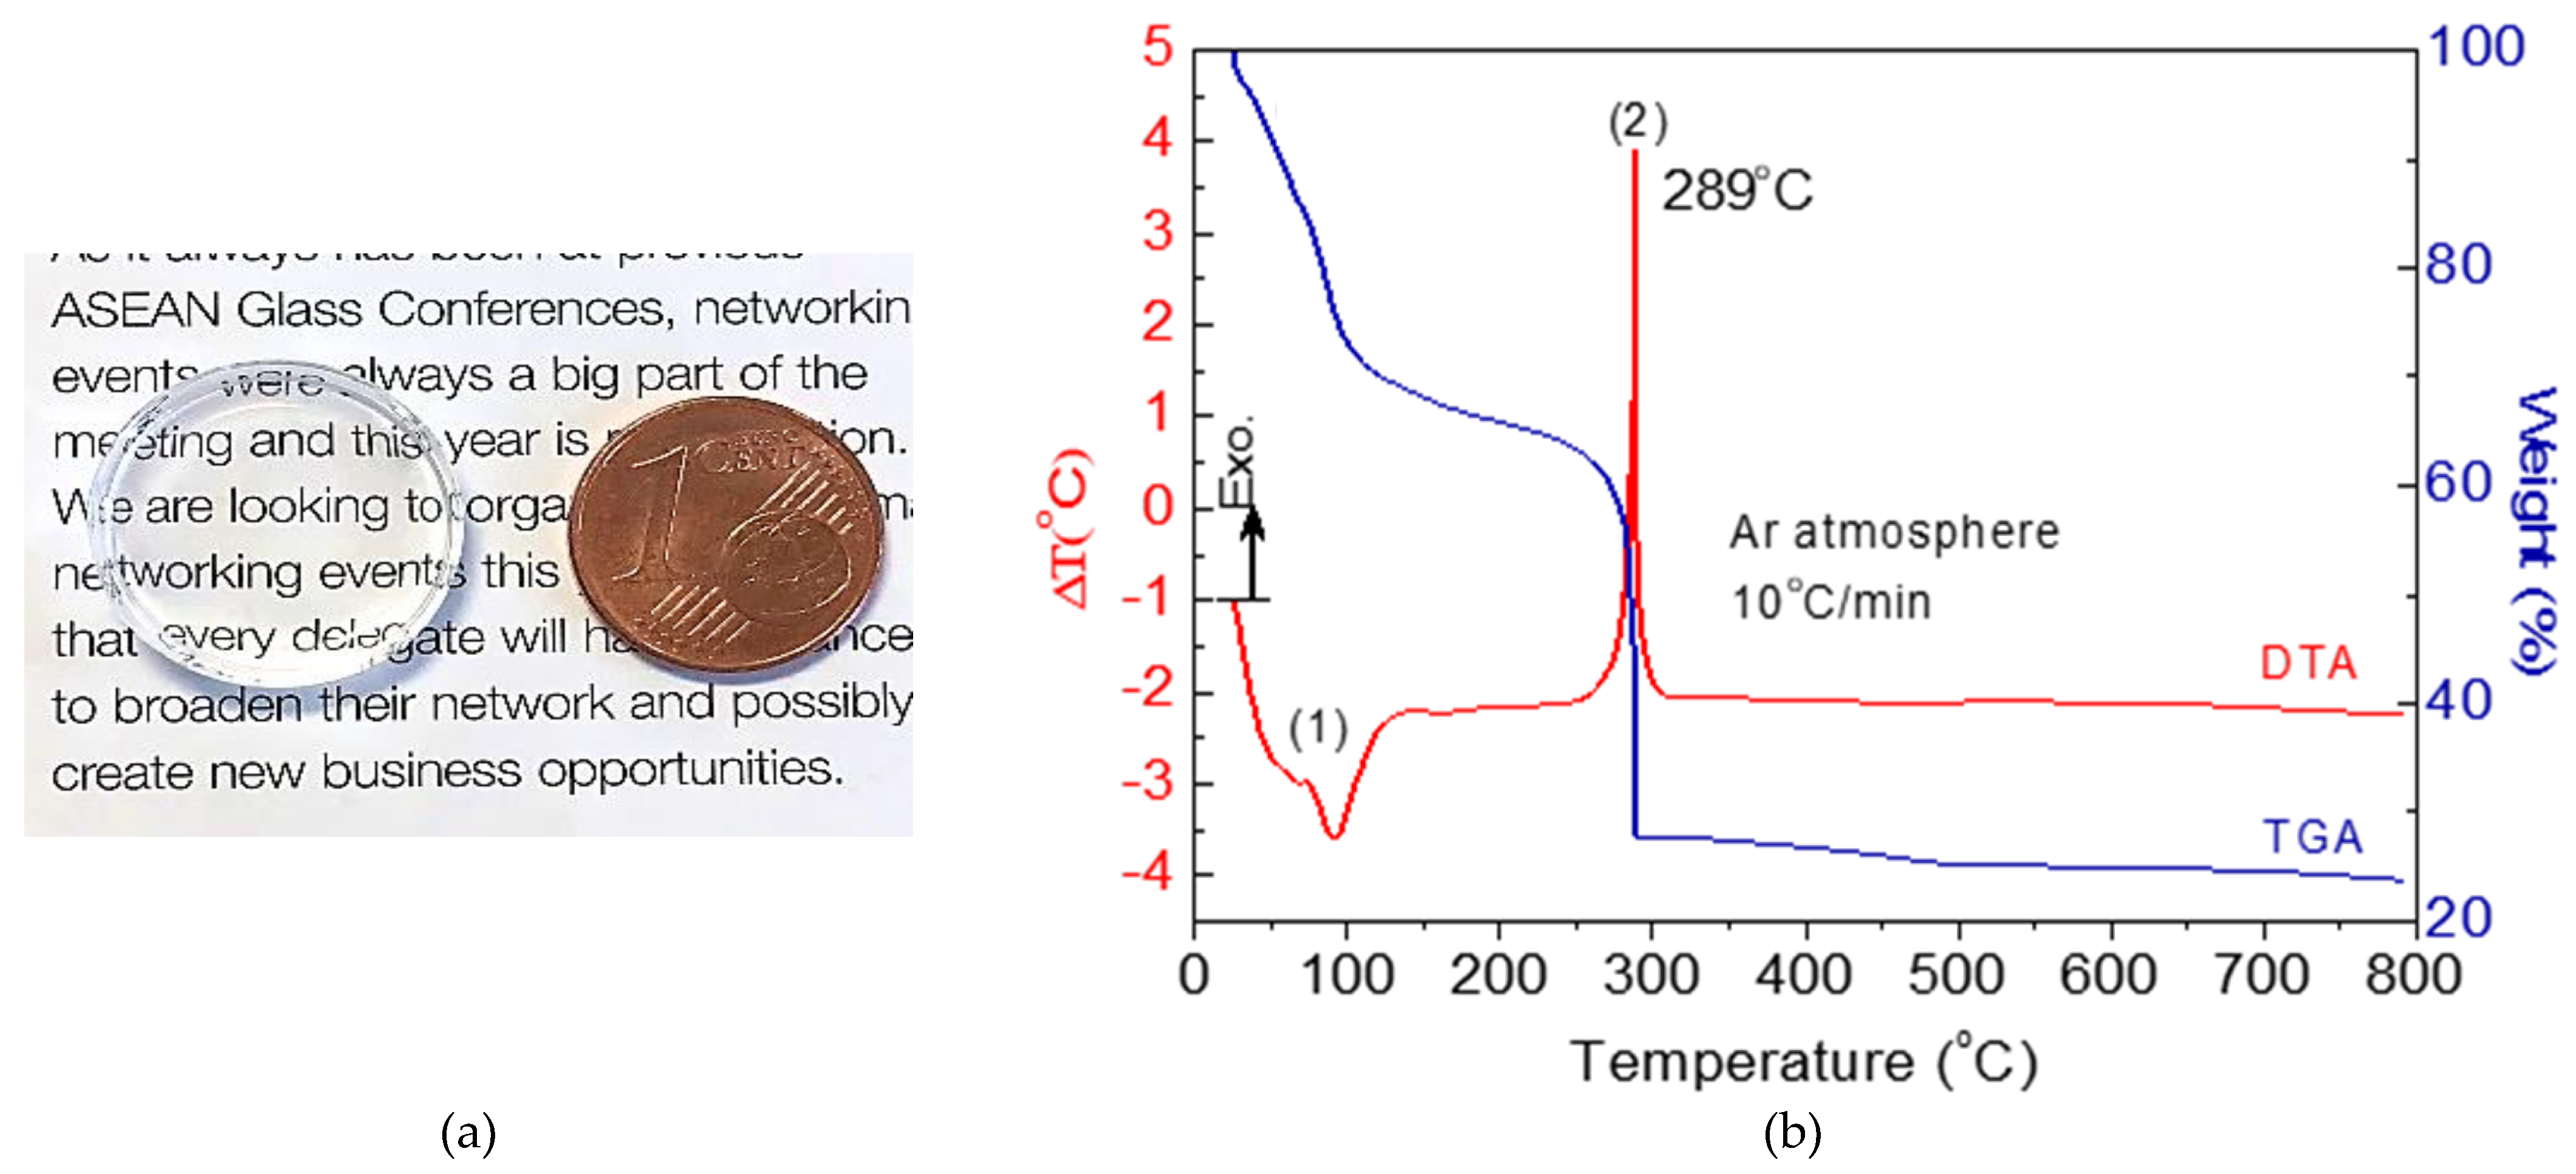
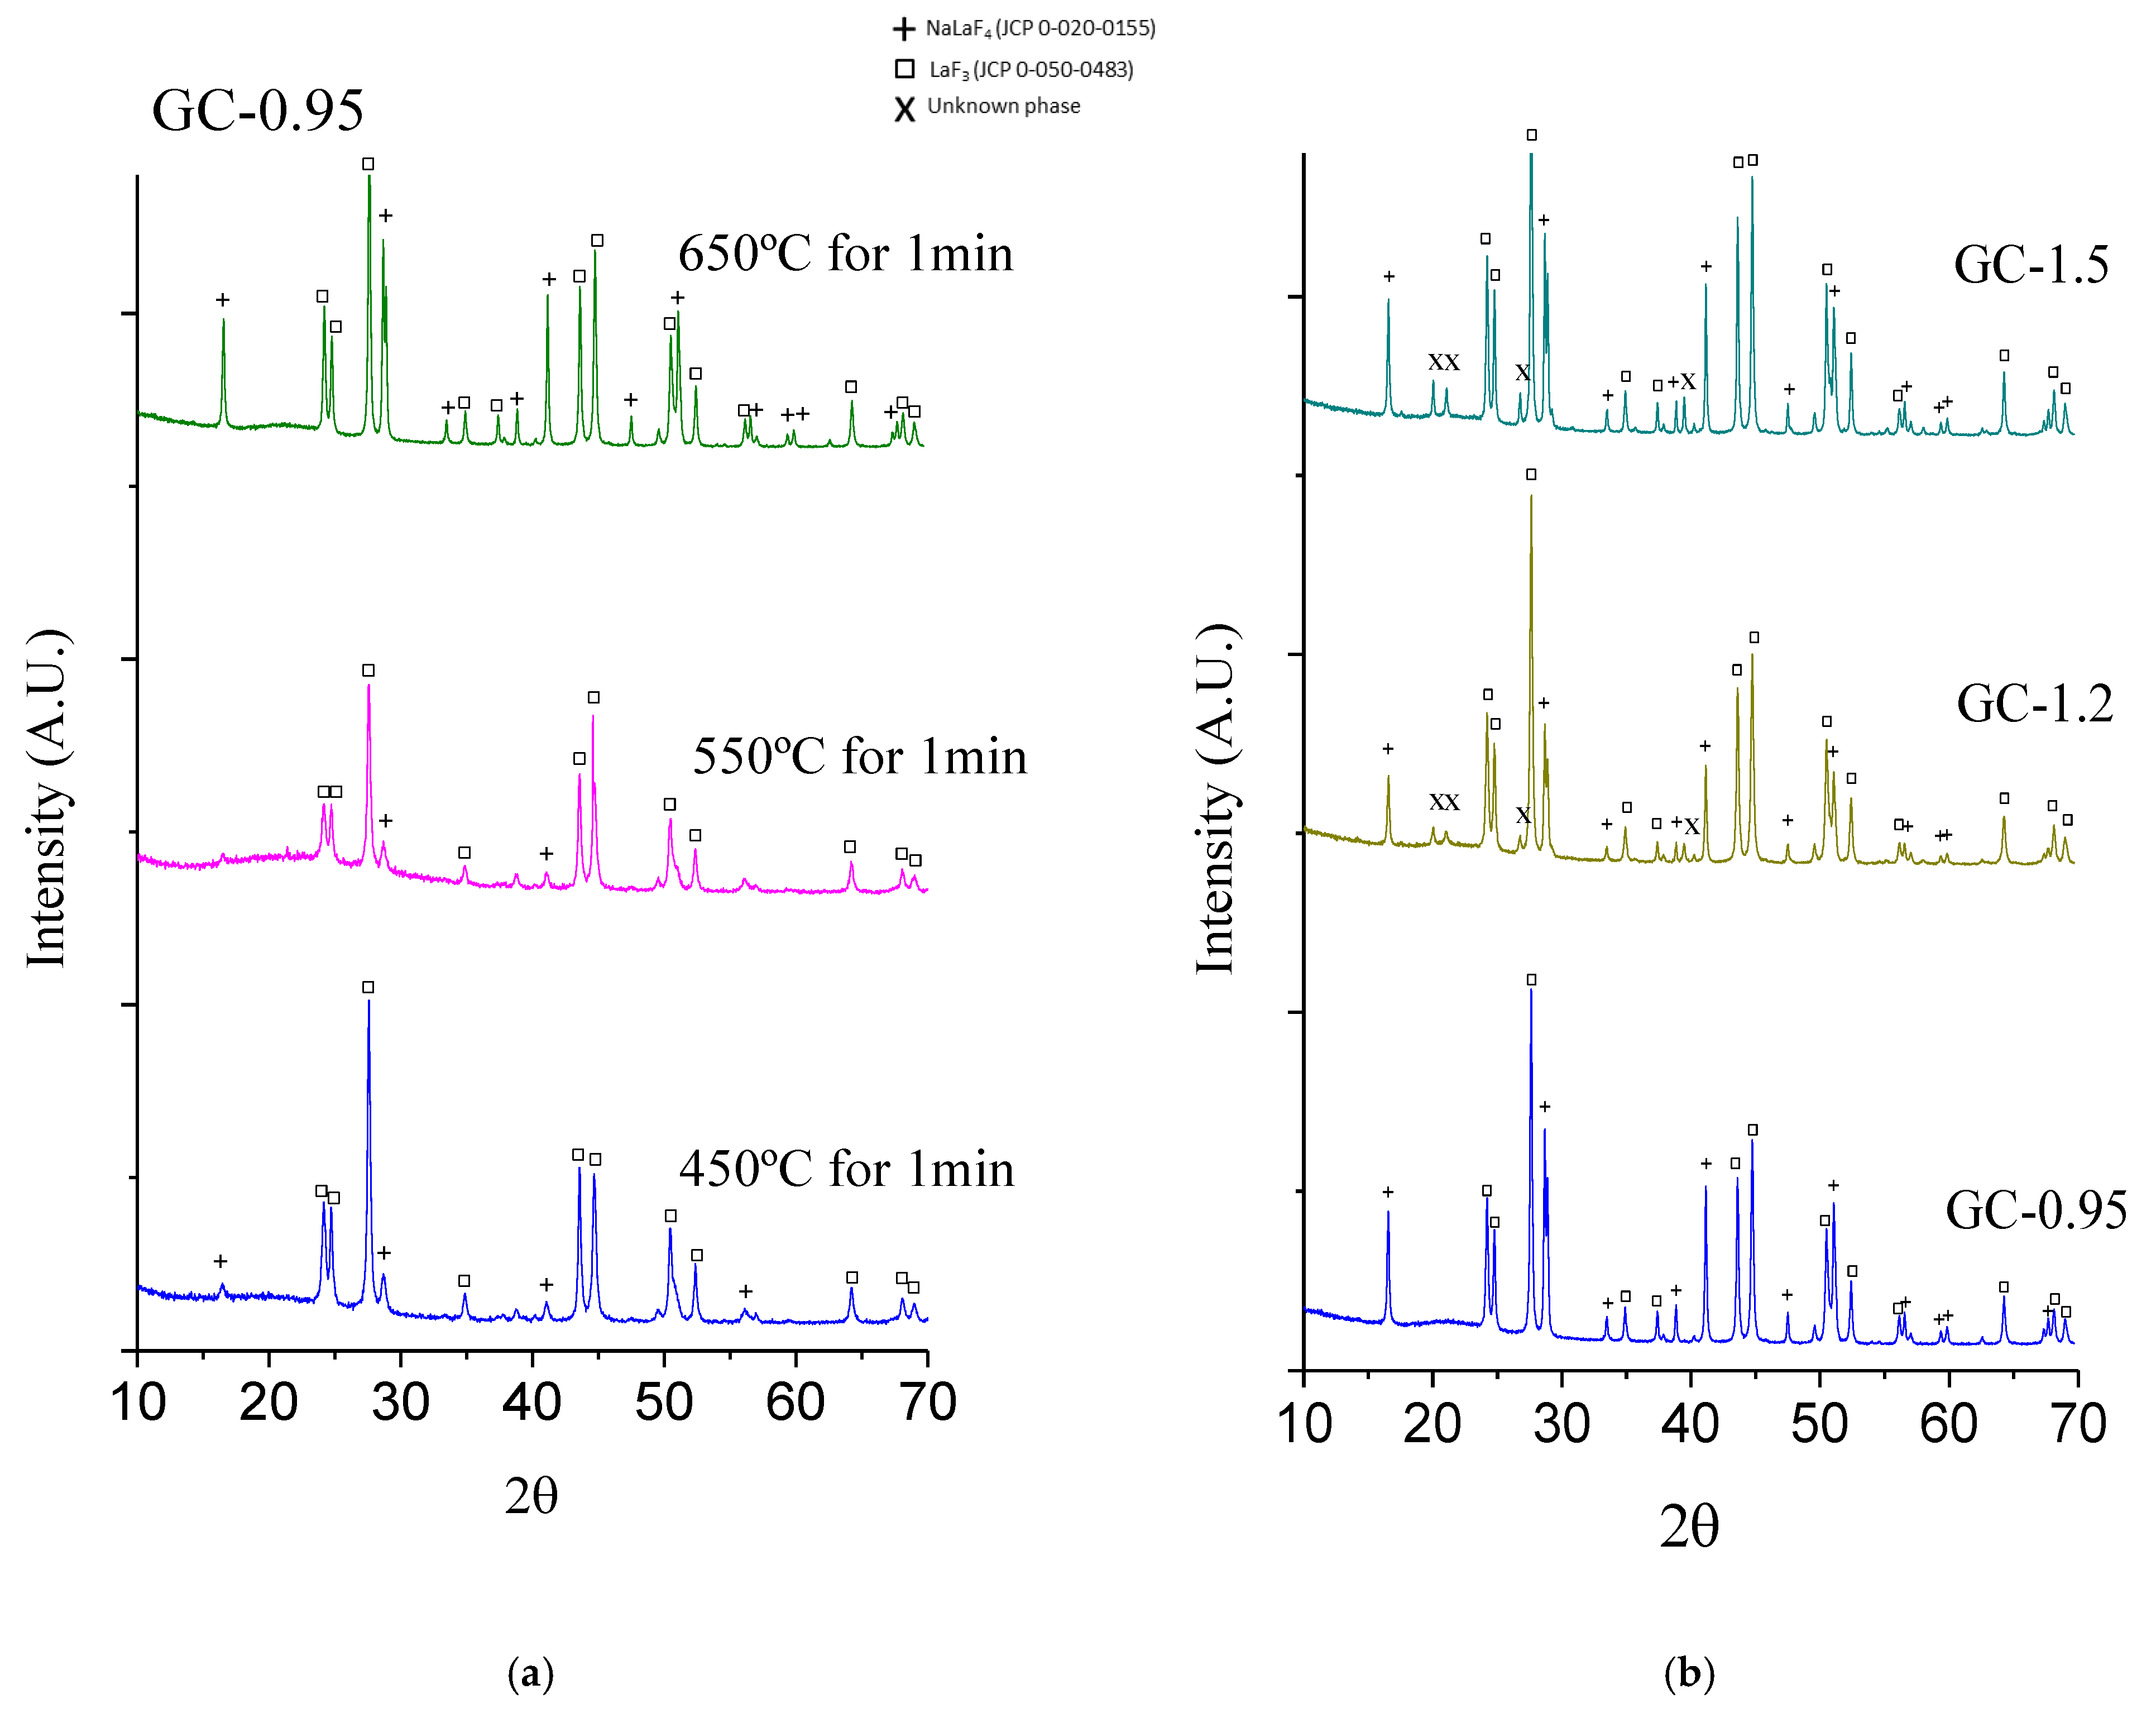
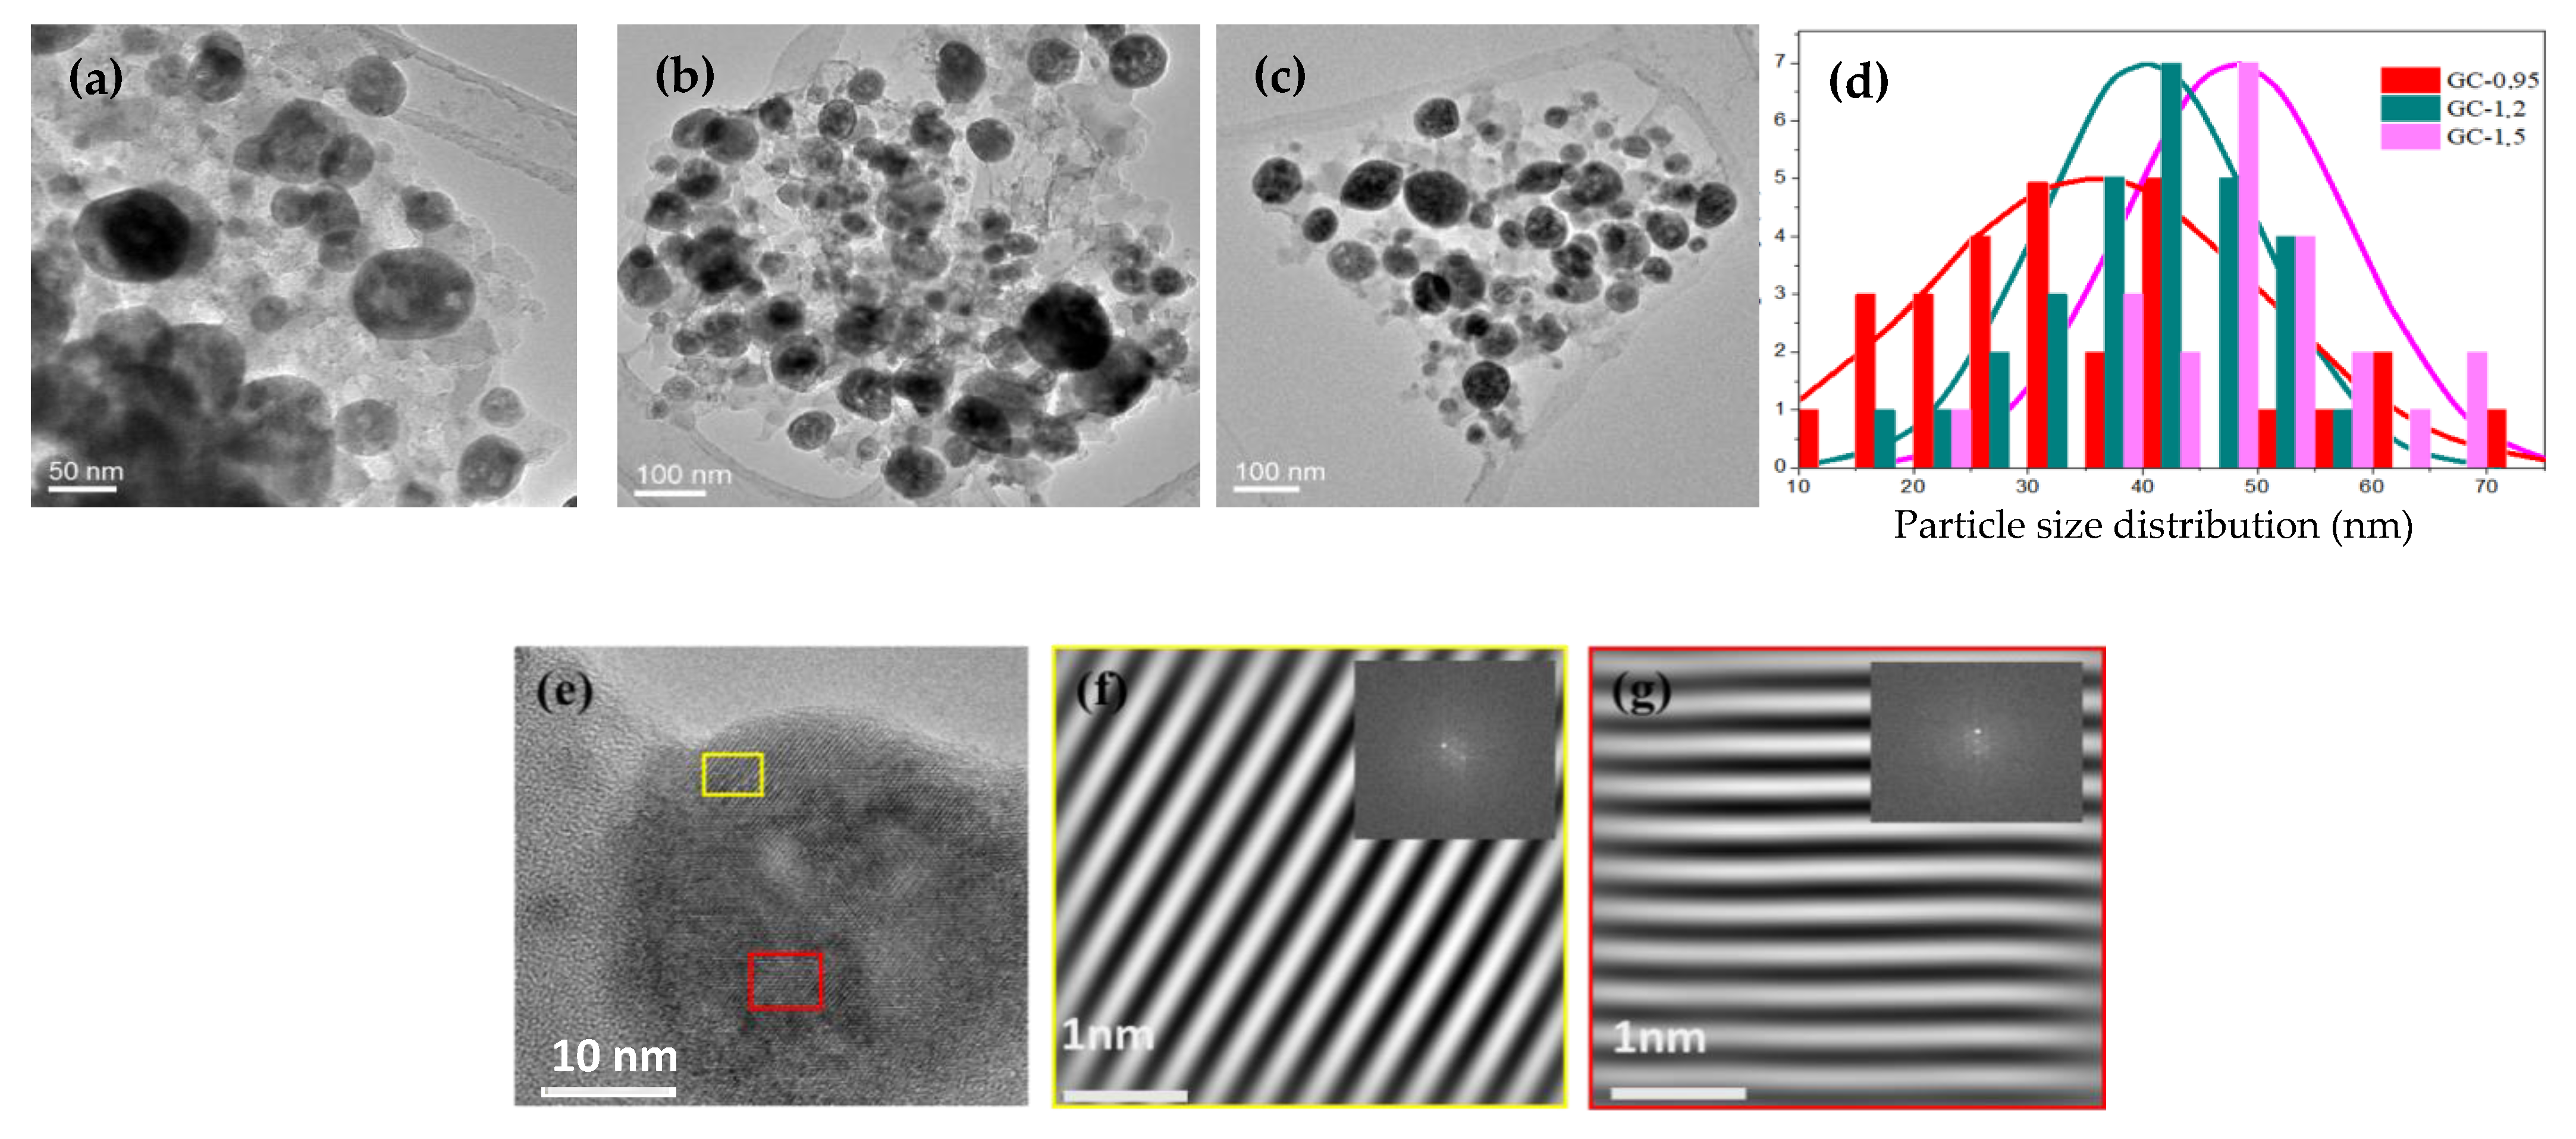
3. Results and Discussion

Transparent, homogeneous, and stable sols were obtained from Sol-0.95, Sol-1.2 and Sol-1.5 sols. After drying at 50 °C, xerogels of 20 mm in diameter were successfully obtained (Figure 1a). All samples are transparent to view when evaluated on paper, indicating high quality; suitable long-term stability was also observed.
The thermal behavior of Sol-0.95 xerogel was evaluated by DTA-TGA (Figure 1b) under an Ar atmosphere at a heating rate of 10 °C/min. In general, a two-stage thermal degradation profile was observed in the temperature range between (1) 80–110 °C and (2) 300 °C. The first interval corresponds with an endothermic peak and a weight loss of 30% attributable to desorption of water and solvent removal. The second degradation step, accompanied by an exothermic peak around 300 °C and a weight loss of 40%, is related to the chemical decomposition and further crystallization of fluorides. The decomposition of La(CF3COO)3 (obtained during the chemical reaction between lanthanum(III) acetate and TFA) occurred together with the crystallization of LaF3, as previously reported [27]. Although crystallization does not generally involve mass loss, in the case of GCs prepared by SG, the chemical reactions between the TFA and lanthanide salts occurred concomitantly with crystallization, such that significant mass loss also took place. In this case, crystallization of NaLaF4 and LaF3 occurred simultaneously because no additional peaks were observed in the plot.
The crystallization process differs from that reported for GCs prepared by melt-quenching. De Pablos-Martín et al. [14] and Elts et al. [17] reported the crystallization of pure NaLaF4 during the heat treatment of a melt-quenched glass, finding an exothermic peak between 600 and 700 °C [14,17]. These authors attributed the high crystallization temperature of the NaLaF4 to the increase in viscosity during glass formation, inhibiting atom diffusion and crystal growth and producing a resistance to crystallization. On synthesis by SG, this drawback did not occur, and fluoride crystallization took place at the same time as the precursor reaction.
Figure 2a shows the XRD patterns for 0.1Nd3+ GC-0.95 bulk samples treated at 450, 550, and 650 °C for 1 min. Peaks associated with hexagonal NaLaF4 phase (JCPDS-file number 50-0155) and LaF3 (JCPDS-file number 32-0483) were clearly identified at all treatment temperatures. However, at 450 °C, a preferential crystallization of LaF3 phase was observed, confirming that precipitation of LaF3 requires a lower free energy of formation compared to NaLaF4. Upon increasing temperature, NaLaF4 crystallization was promoted and, at 650 °C, the maximum NaLaF4 crystal fraction was reached. The LaF3 and NaLaF4 nanocrystal sizes for GC-0.95 samples were both around 35 nm, as estimated using the Scherrer equation (Equation (1)). It was not possible to determine the nanocrystal size of NaLaF4 at 450 and 550 °C due to the low resolution of the diffraction peaks. However, the NaLaF4 nanocrystals appeared to be larger than those of LaF3. XRD confirms that crystallization is achieved in the sol–gel materials with only one minute of heat treatment. It was previously reported that longer treatment times do not augment the crystal fraction [29]. Further characterization was performed on GCs treated at 650 °C for 1min.
The effect of the Na/La molar ratio was analyzed by XRD (Figure 2b), employing Rietveld refinement to calculate the weight percent fraction of crystallized NaLaF4 and LaF3 (Table 2). Additional peaks of NaF were observed for all samples. In addition to NaF, an unidentified phase was observed in both GC-1.2 and GC-1.5; the intensity of the most intense peak of the additional phase (I) as a percentage of the most intense peak of the pattern (Imax) was ~5% in both cases. An optimum Na/La molar ratio of the crystalline phase was found, which corresponds to the maximum formation of NaLaF4 (46.2 wt.%) compared to LaF3 (53.8 wt%). Although an increase in NaLaF4 content is expected when increasing the Na/La ratio, this was not observed (Table 2). XRD (Figure 2b) showed that the decrease in NaLaF4 content was accompanied with a higher content of an unidentified phase, likely associated with the remaining sodium.
On the other hand, crystallite sizes for GCs obtained for different NaCH3COO/LaCH3COO3 molar ratios, also calculated with the Scherrer equation, indicated that, up to a ratio of NaCH3COO/LaCH3COO3 = 1.2, the size remained constant, with greater crystallites observed for NaLaF4 in comparison to LaF3 (Figure 2c). Upon increasing the La concentration to 59.8 wt% (GC-1.5), the crystallites of both phases grew to the range 45–48 nm. The calculated crystallite sizes are significantly greater than those reported by the melt-quenching technique (smaller than 25 nm) but are similar in size to the nanoparticles obtained outside the glass matrix in aqueous media [9,14].
The FTIR spectra of Sol-0.95 xerogel and GC-0.95 glass-ceramic treated at 650 °C for 1 min are shown in Figure 3. The spectrum of the xerogel shows absorption bands at 460, 800 and 1080 cm−1 associated with stretching, bending and out-of-plane Si–O–Si bonds of SiO2, respectively [28,29]. Some bands corresponding to TFA and acetate precursors appeared between 1400 and 1750 cm−1. In addition, a broad band from 2800 to 3760 cm−1 was present in the xerogel spectrum, associated with O–H and C–H groups of the ethanol and water formed during condensation [30]. The peaks associated with TFA, acetate and water disappeared in the spectrum of the GC-0.9 glass-ceramic, and the bands corresponding to Si–O–Si increased in intensity. The band at 460 cm−1, observed in the spectrum of the GC-0.95 glass-ceramic, is attributed to vibration of fluorine in the crystal lattice, consistent with crystallization. A broad band between 900 and 1400 cm−1, associated with tetrafluoride compounds, provides further evidence of NaLaF4 crystallization [31,32].
Microstructural characterization of the GC-0.9, GC-1.2 and GC-1.5 glass-ceramics heat treated at 650 °C for 1 min was performed by HRTEM (Figure 4a–c). Spherical nanoparticles of various sizes were identified, indicating their different nature. The average nanoparticle size is shown in Figure 4d, where an increase in average size with increasing Na/La molar ratio may be observed, in accordance with the crystallite sizes determined by XRD. Although the size of the crystals is similar to that described for particles synthesized in aqueous media, the spherical shape of the SG-synthesized particles differs to the tubular shape reported previously in the literature.
The observed d-spacings of 0.31 and 0.32 nm are consistent with the lattice spacing of planes (101) in hexagonal NaLaF4 (JCP 00-20-0155) and (111) in LaF3 (JCP 0-050-0483), respectively.
The presence of Nd3+-doped LaF3 and NaLaF4 nanocrystals was also confirmed by site-selective laser spectroscopy. The 4F3/24I11/2 laser transition was measured at room temperature for the GC-0.95/1.2/1.5 samples heat treated at 650 °C for 1 min by exciting with a Ti-sapphire laser at different wavelengths in resonance with the 4I9/24F5/2,2H9/2 absorption band. As an example, Figure 5 shows the normalized emission spectra for the GC-0.95 sample obtained under excitation at 786 and 792 nm. These excitation wavelengths correspond to Nd3+ ions in LaF3 and NaLaF4 crystalline phases, respectively [33,34]. The spectrum obtained under excitation at 786 nm presents well-resolved peaks at around 1036, 1040, 1047, 1058 and 1063 nm, which is in agreement with the emission of Nd3+ in LaF3 nanocrystals [34]. Under 792 nm excitation, the spectrum shows a main peak at around 1055 nm, together with a less intense one at 1049 nm, which corresponds to the Nd3+ emission in the hexagonal NaLaF4 crystalline phase. In addition to this emission, weak peaks at 1036 and 1040 nm were also observed due to the spectral overlapping of the spectra of both crystalline phases.
The emission spectra are similar for the three GC samples, with the only difference being the relative intensity of the Nd3+ emission in the two crystalline phases, which depends on the molar relation of both phases. Assuming that 786 and 792 nm correspond to excitations of Nd3+ ions in the LaF3 and NaLaF4 nanocrystals, respectively, the highest intensity for the Nd3+ emission in LaF3 corresponds to the GC-1.2 sample in agreement with the higher LaF3 content of this sample. Figure 6 shows the emission spectra for the three GC samples.
These results are confirmed by the excitation spectra corresponding to the 4I9/24F5/2, 4F3/2 transitions obtained by collecting the luminescence at two different wavelengths. Figure 7 shows, as an example, the normalized excitation spectra of the GC-1.2 sample performed in the 770–890 nm spectral range on collecting the luminescence at 1040 and 1055 nm (the emission peaks corresponding to Nd3+ emission in LaF3 and NaLaF4 crystalline phases respectively). As observed in the spectrum obtained by collecting the luminescence at 1040 nm, the 4I9/24F5/2 band is composed of several peaks at 786, 790, 792, 796 and 800 nm. The peaks at 786, 790, 796 and 800 nm correspond to Nd3+ in the LaF3 nanocrystals, whereas the one at 792 nm can be attributed to Nd3+ in the NaLaF4 crystalline phase. Moreover, the 4I9/24F3/2 transition presents two peaks at 859 and 862 nm, corresponding to Nd3+ emission in LaF3 nanocrystals, together with another peak at 864.5 nm attributable to NaLaF4 nanocrystals. The presence of excitation peaks from both crystalline phases is due to the spectral overlapping of both emissions at 1040 nm (Figure 5 and Figure 6). The excitation spectrum obtained by collecting the luminescence at 1055 nm presents two main peaks for the 4I9/24F5/2 band at 792 and 801 nm, which correspond to Nd3+ in the NaLaF4 crystalline phase. The 4I9/24F3/2 transition shows the two expected Stark components of the 4F3/2 level in a well-defined crystal field site. However, the high-energy component superimposes the peak at 859 nm corresponding to the LaF3 nanocrystals.
It is worth noting that despite the lower crystalline fraction of the tetrafluoride phase compared to that of LaF3, Nd3+ emission is much more efficient in NaLaF4 due to its higher emission cross-section [35,36].

4. Conclusions

Nd3+-doped SiO2-NaLaF4 GCs with the presence of LaF3 were successfully obtained for the first time by sol–gel after heat treatment in the range 450–650 °C for 1 min. Lower temperatures did not produce significant quantities of NaLaF4, but LaF3 crystallized for all heat treatment temperatures. Both phases also appeared for different relations of precursors; however, deficiency of Na in the precursors generated the maximum percentage of NaLaF4 in the final GCs. ATD, FTIR and XRD confirmed the presence of LaF3 and NaLaF4 phases in the GCs, and the HRTEM images confirm the crystal sizes obtained by XRD, which tended to increase upon increasing the Na/La molar ratio in the precursors.
As in other GCs prepared by SG, the chemical reactions between the TFA and lanthanide salts occurred concomitantly with crystallization. Moreover, NaLaF4 and LaF3 crystallization took place at the same time as the precursor reaction. Site-selective excitation and emission spectra performed for the 4I9/24F3/2/4F5/2 transitions confirm the presence of Nd3+ ions inside both LaF3 and NaLaF4 crystalline phases for all GC samples. Notwithstanding the more abundant LaF3 phase in the GC samples, the most efficient emission corresponds to Nd3+ located in the NaLaF4 crystalline phase. The luminescence results also show that the highest Nd3+ emission intensity in the LaF3 phase corresponds to the GC-1.2 sample, in accordance with its higher LaF3 content.

Author Contributions

Investigation, M.E.C., J.L., G.G., A.D., G.C.M., R.B., J.F. and Y.C.; supervision, G.G., A.D., R.B. and Y.C.; writing—original draft, M.E.C. and J.L.; writing—review and editing, M.E.C., G.G., A.D., G.C.M., R.B., J.F. and Y.C. All authors have read and agreed to the published version of the manuscript.

Funding

The authors acknowledge financial support from MINECO under projects MAT2017-87035-C2-1-P/-2-P (AEI/FEDER, UE), and Basque Government PIBA2018-24. This article is a part of the dissemination activities of the project FunGlass, which has received funding from the European Union’s Horizon 2020 research and innovation program under grant agreement No 739566.

Institutional Review Board Statement

Not applicable.

Informed Consent Statement

Not applicable.

Data Availability Statement

Not applicable.

Conflicts of Interest

The authors declare that there is no conflict of interest.

References

  1. Babu, P.; Lavín, M.; Rodríguez-Mendoza, U.R.; Seo, J.H.; Krishanaiahd, K.V.; Venkatramuef, V. Quantum cutting and near-infrared emissions in Ho3+/Yb3+ codoped transparent glass-ceramics. J. Lumin. 2020, 226, 117424. [Google Scholar] [CrossRef]
  2. Pan, J.; Xu, R.; Tian, Y.; Li, K.; Hu, L.; Zhang, J. 2.0μm Emission properties of transparent oxyfluoride glass ceramics doped with Yb3+–Ho3+ ions. Opt. Mater. 2010, 32, 1451–1455. [Google Scholar] [CrossRef]
  3. Gorni, G.; Velázquez, J.J.; Mosa, J.; Mather, G.C.; Serrano, A.; Vila, M.; Castro, G.R.; Bravo, D.; Balda, R.; Fernández, J.; et al. Transparent Sol-Gel Oxyfluoride Glass-Ceramics with High Crystalline Fraction and Study of RE Incorporation. Nanomaterials 2019, 9, 530. [Google Scholar] [CrossRef] [Green Version]
  4. Nie, L.; Shen, Y.; Zhang, X.; Wang, X.; Liu, B.; Wang, Y.; Pan, Y.; Xie, X.; Huang, L.; Huang, W. Selective synthesis of LaF3 and NaLaF4 nanocrystals via lanthanide ion doping. J. Mater. Chem. C 2017, 5, 9188–9193. [Google Scholar] [CrossRef]
  5. Wang, F.; Liu, X. Multicolor Tuning of Lanthanide-Doped Nanoparticles by Single Wavelength Excitation. Acc. Chem. Res. 2014, 47, 1378–1385. [Google Scholar] [CrossRef]
  6. Fujihara, S. Sol-Gel Processing of Fluoride and Oxyfluoride Materials. In Handbook of Sol-Gel Science and Technology; Springer International Publishing: Cham, Switzerland, 2018; pp. 333–359. [Google Scholar]
  7. Sarakovskis, A.; Krieke, G.; Doke, G.; Grube, J.; Grinberga, L.; Springis, M. Comprehensive study on different crystal field environments in highly efficient NaLaF4:Er3+ upconversion phosphor. Opt. Mater. 2015, 39, 90–96. [Google Scholar] [CrossRef]
  8. Aebischer, A.; Hostettler, M.; Hauser, J.; Krämer, K.; Weber, T.; Güdel, H.U.; Bürgi, H.-B. Structural and Spectroscopic Characterization of Active Sites in a Family of Light-Emitting Sodium Lanthanide Tetrafluorides. Angew. Chem. Int. Ed. 2006, 45, 2802–2806. [Google Scholar] [CrossRef]
  9. Chen, B.; Ren, B.; Wang, F. Cs+-Assisted Synthesis of NaLaF4 Nanoparticles. Chem. Mater. 2019, 31, 9497–9503. [Google Scholar] [CrossRef]
  10. Wang, X.; Zhuang, J.; Peng, Q.; Li, Y. A general strategy for nanocrystal synthesis. Nat. Cell Biol. 2005, 437, 121–124. [Google Scholar] [CrossRef] [PubMed]
  11. Yi, G.S.; Lee, W.B.; Chow, G.M. Synthesis of LiYF4, BaYF5, and NaLaF4 optical nanocrystals. J. Nanosci. Nanotechnol. 2007, 7, 2790–2794. [Google Scholar] [CrossRef] [PubMed]
  12. Rao, L.; Lu, W.; Ren, G.; Wang, H.; Yi, Z.; Liu, H.; Zeng, S. Monodispersed LaF3 nanocrystals: Shape-controllable synthesis, excitation-power-dependent multi-color tuning and intense near-infrared upconversion emission. Nanotechnology 2014, 25, 65703. [Google Scholar] [CrossRef] [PubMed]
  13. Wang, F.; Han, Y.; Lim, C.S.; Lu, Y.; Wang, J.; Xu, J.; Chen, H.; Zhang, C.; Hong, M.; Liu, X. Simultaneous phase and size control of upconversion nanocrystals through lanthanide doping. Nat. Cell Biol. 2010, 463, 1061–1065. [Google Scholar] [CrossRef] [PubMed]
  14. Martin, A.D.P.; Mather, G.; Muñoz, F.; Bhattacharyya, S.; Höche, T.; Jinschek, J.; Heil, T.; Durán, A.; Pascual, M. Design of oxy-fluoride glass-ceramics containing NaLaF4 nano-crystals. J. Non-Cryst. Solids 2010, 356, 3071–3079. [Google Scholar] [CrossRef]
  15. Krieke, G.; Sarakovskis, A.; Springis, M. Upconversion luminescence of Er3+/Yb3+ and their role in the stabilization of cubic NaLaF4 nanocrystals in transparent oxyfluoride glass ceramics. J. Non-Cryst. Solids 2018, 481, 335–343. [Google Scholar] [CrossRef]
  16. Peng, Y.; Zhong, J.; Li, X.; Chen, J.; Zhao, J.; Qiao, X.; Chen, D. Controllable competitive nanocrystallization of La3+-based fluorides in aluminosilicate glasses and optical spectroscopy. J. Eur. Ceram. Soc. 2019, 39, 1420–1427. [Google Scholar] [CrossRef]
  17. Elsts, E.; Krieke, G.; Rogulis, U.; Smits, K.; Zolotarjovs, A.; Jansons, J.; Sarakovskis, A.; Kundzins, K. Rare earth doped glass–ceramics containing NaLaF4 nanocrystals. Opt. Mater. 2016, 59, 130–135. [Google Scholar] [CrossRef]
  18. Cruz, M.E.; Castro, Y.; Durán, A. Glasses and Glass-Ceramics Prepared by Sol–Gel. In Reference Module in Materials Science and Materials Engineering; Elsevier: Amsterdam, The Netherlands, 2020. [Google Scholar]
  19. Fujihara, S.; Mochizuki, C.; Kimura, T. Formation of LaF3 microcrystals in sol–gel silica. J. Non-Cryst. Solids 1999, 244, 267–274. [Google Scholar] [CrossRef]
  20. Secu, C.E. Up-conversion luminescence of Er3+/Yb3+ co-doped LiYF4 nanocrystals in sol-gel derived oxyfluoride glass-ceramics. J. Non-Cryst. Solids 2015, 426, 78–82. [Google Scholar] [CrossRef]
  21. Pawlik, N.; Szpikowska-Sroka, B.; Goryczka, T.; Pisarski, W.A. Photoluminescence investigation of sol-gel glass-ceramic materials containing SrF2:Eu3+ nanocrystals. J. Alloys Compd. 2019, 810, 151935. [Google Scholar] [CrossRef]
  22. Ding, M.; Lu, C.; Bai, W.; Yuan, Y.; Ji, Z. Transparent sol-gel glass ceramics containing B-NaYF4/Er3+ nanocrystals: Structure, upconversion luminiscent properties and optical thermometry behavior. Ceram. Int. 2018, 44, 16379–16387. [Google Scholar] [CrossRef]
  23. Velázquez, J.; Mosa, J.; Gorni, G.; Balda, R.; Fernández, J.; Durán, A.; Castro, Y. Novel sol-gel SiO2-NaGdF4 transparent nano-glass-ceramics. J. Non-Cryst. Solids 2019, 520, 119447. [Google Scholar] [CrossRef]
  24. Velázquez, J.J.; Rodríguez, V.D.; Yanes, A.C.; Del-Castillo, J.; Méndez-Ramos, J. Increase in the Tb3+ green emission in SiO2–LaF3 nano-glass-ceramics by codoping with Dy3+ ions. J. Appl. Phys. 2010, 108, 113530. [Google Scholar] [CrossRef]
  25. Zhou, K.; Zhu, J.; Zeng, J.; Liu, J. Effect of heat treatment on structure and up-conversion emission of Er3+-doped GaF3/InF3 based fluoride glasses. Rare Met. 2011, 30, 121–125. [Google Scholar] [CrossRef]
  26. Yang, P.; Song, C.F.; Lü, M.K.; Yin, X.; Zhou, G.J.; Xu, D.; Yuan, D.R. The luminiscence of PbS nanoparticles embedded in sol-gel silica glass. Chem. Phys. Lett. 2001, 345, 429–434. [Google Scholar] [CrossRef]
  27. Reisfeld, R. Prospects of sol-gel technology towards luminiscent materials. Opt. Mater. 2001, 16, 1–7. [Google Scholar] [CrossRef]
  28. Rodriguez-Carvajal, J. Recent advances in magnetic structure determinarion by neutro powder diffraction. J. Phys. 1993, 192, 55–69. [Google Scholar]
  29. Orcel, G.; Phalippou, J.; Hench, L.L. Structural changes of silica xerogels during low temperature dehydration. J. Non-Cryst. Solids 1986, 88, 114–130. [Google Scholar] [CrossRef]
  30. Gorni, G.; Pascual, M.J.; Caballero, A.; Velazquez, J.J.; Mosa, J.; Castro, Y.; Durán, A. Crystallization mechanism in sol-gel oxyfluoride glass-ceramics. J. Non-Cryst. Solids 2018, 501, 145–152. [Google Scholar] [CrossRef]
  31. Lepoutre, S.; Boyer, D.; Fujihara, S.; Mahiou, R. Structural and optical characterizations of sol–gel based composites constituted of LiGdF4:Eu3+ nanocrystallites dispersed into a silica matrix. J. Mater. Chem. 2009, 19, 2784–2788. [Google Scholar] [CrossRef]
  32. Velázquez, J.J.; Mosa, J.; Gorni, G.; Balda, R.; Fernández, J.; Pascual, L.; Durán, A.; Castro, Y. Trasnparent SiO2-GdF3 sol-gel nano-glass ceramics for optical applications. J. Sol-Gel Sci. Technol. 2019, 89, 322–332. [Google Scholar] [CrossRef]
  33. Gorni, G.; Velazquez, J.J.; Mather, G.C.; Durán, A.; Chen, G.; Sundararajan, M.; Balda, R.; Fernández, J.; Pascual, M.J. Selective exitation in transparent oxyfluoride glass-ceramics doped with Nd3+. J. Eur. Ceram. Soc. 2017, 37, 1695–1706. [Google Scholar] [CrossRef] [Green Version]
  34. Hong, J.Q.; Zhang, L.H.; Zhang, P.X.; Wang, Y.Q.; Hang, Y. Growth, optical characterization and evaluation of laser properties of Nd:LaF3 crystal. J. Alloys Compd. 2015, 646, 706–709. [Google Scholar] [CrossRef]
  35. Zhao, C.C.; Hang, Y.; Zhang, L.H.; He, X.M.; Yin, J.G.; Li, R.; Yu, T.; Chen, W.B. Crystal growth, spectroscopic characterization, andcontinuous wave laser operation of Nd3+-doped LiLuF4 crystal. Laser Phys. Lett. 2011, 8, 263–268. [Google Scholar] [CrossRef] [Green Version]
  36. Lage, M.M.; Franklin, M.M.; Jean-Yves, G.; Moreira, R.L. Optical phonon modes and crystal structure of NaLaF4 single crystals. J. Appl. Phys. 2006, 99, 053510. [Google Scholar] [CrossRef]
Figure 1. (a) Photograph of dried Sol-0.95 xerogel at 50 °C/24 h and (b) DTA and TGA in argon atmosphere of Sol-0.95 xerogel sample.
Crystals 11 00464 g001
Figure 2. XRD pattern of (a) GC-0.95 treated with different temperatures for 1 min, (b) GC-0.95/1.2/1.5 treated at 650 °C for 1 min and (c) average crystallite size calculated with the Scherrer equation for SG-0.95/1.2/1.5 treated at 650 °C for 1 min.
Crystals 11 00464 g002aCrystals 11 00464 g002b
Figure 3. FTIR analysis of Sol-0.95 xerogel and GC-0.95 glass-ceramic thermally treated at 650 °C for 1 min with a rate of 10 °C/min.
Crystals 11 00464 g003
Figure 4. HRTEM of samples (a) GC-0.95, (b) GC-1.2 and (c) GC-1.5 treated at 650 °C for 1 min; (d) particle size distribution for samples shown in Figure 4a–c; (e) HRTEM micrograph of GC-0.95 and transmission electron micrograph of (f) lattice plane of NaLaF4 in the (101) direction with a distance of 0.31nm and (g) lattice plane of LaF3 in the (011) direction with a distance of 0.32 nm.
Crystals 11 00464 g004
Figure 5. Room-temperature-normalized emission spectra of the 4F3/24I11/2 laser transition obtained under excitation at 786 (black) and 792 nm (red) for the GC-0.95 sample doped with 0.1 mol% of Nd3+.
Crystals 11 00464 g005
Figure 6. Room-temperature emission spectra of the 4F3/24I11/2 laser transition obtained under excitation at 786 (black) and 792 nm (red) for (a) GC-0.95, (b) GC-1.2, and (c) GC-1.5 samples doped with 0.1 mol% of Nd3+.
Crystals 11 00464 g006
Figure 7. Room-temperature-normalized excitation spectra obtained by collecting the luminescence at 1040 and 1055 nm for the GC-1.2 sample doped with 0.1 mol% of Nd3+(*) symbols correspond to LaF3 crystalline phase.
Crystals 11 00464 g007
Table 1. Identification of SiO2-NaLaF4/LaF3 sols depending on the molar ratio of Na/La precursors used.
SiO2-NaLaF4/LaF3 solsNa(CH3COO):La(CH3COO)3
Sol-0.950.95:1
Sol-1.21.2:1
Sol-1.51.5:1
Table 2. Relation of NaLaF4 and LaF3 phases in 80SiO2-20NaLaF4/LaF3 GCs treated at 650 °C for 1 min estimated by Rietveld refinement (normalized to 100%).
GC Samplewt%
NaLaF4LaF3
GC-0.9546.253.8
GC-1.231.668.4
GC-1.540.259.8
Publisher’s Note: MDPI stays neutral with regard to jurisdictional claims in published maps and institutional affiliations.

