Abstract
In this study, we proposed a preliminary kinetic model applied to the carbonation process of fresh lime with the intention to realize a diagnostic tool for aged fresco paintings. The model can be useful, in particular, in the fields of conservation and restoration of ancient lime wall paintings. The dating procedure was achieved through the analysis of 1064 nm excited Raman spectra collected on artificially aged lime samples in addition to ancient samples taken from literature and covering a period of two thousand years. The kinetic model was developed monitoring the concentration of emitting defective centers related to the intensity of 780 cm−1 calcium hydroxide band as a function of the time and depth. This preliminary model shows how Raman spectroscopy, especially NIR micro-Raman, is advantageous for diagnostics and conservation in the cultural heritage field.
1. Introduction
Fresco technique boasts ancient origin in centuries of history [1]. It was already known during the Aegean civilization, and the oldest surviving fresco paint is dated as approximately in 1600 B.C. The technique was also used by Greeks, Etruscans, Romans, and during the middle-ages. As shown by numerous and famous artworks, the fresco was one of the most employed painting techniques.
The fresco is one of the most durable painting arts because the pigment is linked to the lime wall when the latter is still wet [2,3]. The drying process is related to the carbonation of calcium hydroxide, the main component of the substrate. Calcium hydroxide, well-known by the term “hydrated lime”, reacts with the carbon dioxide, taken from air and water, leading to the formation of calcium carbonate. We can summarize the process with the following Equation (1):
The kinetics of carbonation process were studied by several authors. Camerini et al. [4] suggested a kinetic model based on surface boundary nucleation followed by growth and penetration in depth: the carbonation starts on the surface of the particles (grain boundary nucleation) and grows along the particles surface, eventually covering them; finally, carbonated regions coalesce from adjacent particles. Montes-Hernandez et al. [5] studied the carbonation process of commercial lime in high pressure-temperature conditions and proposed a carbonation model described by a pseudo-second-order kinetic model. They noted also the earlier formation of amorphous CaCO3 followed by calcite. Later on, they examined the intensity variation of OH-stretching band in the absorption spectrum during the carbonation process, obtaining a good agreement with the proposed pseudo-second-order model [6]. In addition, Rodriguez-Navarro [7] studied the carbonation process of nano-limes in humid air at room temperature. In this case, the carbonation process involves the initial formation of amorphous calcium carbonate before the final calcite. The model proposed was a first order kinetic. In [8], the carbonation of Ca(OH)2 in humid N2 was studied at 60–90 °C, and it was well described by an asymptotic equation assuming chemical reaction control and considering the surface formation of calcium carbonate clusters on calcium hydroxide pores. In our previous study [9], we proposed a kinetic model retrieved by using the relative intensity variation between the Raman band of calcite (I1087) and the defective band related to calcium hydroxide (I780) recorded in the Raman spectrum under 1064 nm excitation wavelength. The band located at 780 cm−1 was indeed attributed to luminescence phenomena of interstitial defects whose formation was discussed with reference to the calcite vibration fingerprint.
The proposed model is based on the idea that the defect centers, responsible for the luminescence phenomena, are largely reactive to the environmental CO2 and lead to the formation of calcite clusters. To monitor the reaction, we performed a thermal treatment of lime samples in the 90–500 °C range, and we studied the relative intensity variation of the two bands in a period of 90 days. According to the model (Equation (2)), the starting population of defect is expressed by the R0 value, whilst the number of defects at time t is expressed by the Rt value). Then, by monitoring the number of available centers at a certain time (Rt) with respect to the starting population R0, we are able to evaluate the fraction of emitting centers under carbonation during the time. On the other hand, the carbonation degree α at time t will be the maximum amount of carbonation phase after a long period minus the emitting centers still available at time t. The expression is reported below:
The obtained model is a first order kinetics dominated by two parameters: τ, the characteristic time of the process and γ, the maximum carbonation relative value (obtained experimentally).
The reported first order kinetic model was obtained by the analysis of experimental lime after proper thermal treatments and could be in principle exploited to date a fresco paint from the evaluated carbonation degree. To achieve this goal, which is the aim of the present manuscript for dating and restoration purposes, some further consideration on the lime production and the diffusion of CO2 inside it is required. In the fresco technique, fresh lime is present in the wall in a sequence of layers called respectively: “velo” or “intonachino” (known as plaster) with variable thickness ranging between 100 and 400 µm, “arriccio” and “rinzaffo” (parts of mortar) reaching a thickness of some centimetres. As reported in the literature, the carbonation process occurs in the whole wall due to diffusion of CO2 inside the wall frame, and this phenomenon should be taken into account to develop a more sophisticated kinetic model. In fact, carbonation starts with the diffusion of dissolved CO2 molecules in pore water of wall paste [10], and then the formation of calcium carbonate from calcium hydroxide is observed. The result of this reaction is to alter the chemical composition of the concrete, which reduces pH and can lead to conditions which may cause the corrosion of reinforcing steel within the concrete [11]; in particular, the carbonation process of the calcium hydroxide in concrete can reduce the pH of concrete to values less than 9 [12]. The carbonation of lime inside a wall is related to the diffusion process of the carbon dioxide. The carbonation process starts at the surface (which is in direct contact with air) and penetrates slowly into the wall interior, resulting in a function of depth. The carbonation slows down in depth; then, the reduction of pH (due to the increasing of carbonate phase) is itself a function of depth, conditioning the strength and durability of the painting. This is the reason why the carbonation process in concrete and how CO2 diffuses inside the wall layers are strongly studied in building construction [10,13,14,15]. The diffusion of CO2 in walls depends on many factors, such as CO2 concentration, porosity, and moisture inside the plaster and mortar, that affect gas transport properties within the wall structure. At the end of carbonation reaction, water is produced, and it further affects the diffusion of CO2 and humidity [16] inside the wall layers. Thus, due to the intrinsic interdependence of each parameter in the diffusion process, any analytical model for the prediction of carbonation is intrinsically complex and should be based on a nonlinear scheme [10]. Several experimental studies on concrete carbonation under outdoor and indoor conditions were carried out and they agreed with the hypotheses that depth of carbonation is directly proportional to the square root of the ageing time of the wall [17,18,19]. Different mathematical formulations were developed to model CO2 diffusion in concrete and the effect on the carbonation process, the most accredited one being the following Equation (3) [15,20]:
where Xc is the carbonation depth [m] at time t [s], DCO2 is the effective diffusion coefficient of carbon dioxide [m2/s], [CO2] is the molar concentration of carbon dioxide in the atmosphere in contact with the wall layers [mol/m3], and [Ca(OH)2] is the molar concentration of calcium hydroxide in the wall [mol/m3]. The expression of the effective CO2 diffusion coefficient is DCO2 = Φ(1−S1)ϑDair,CO2; it depends on the diffusion coefficient of carbon dioxide in the air (Dair,CO2), the wall porosity Φ, the water saturation degree S1, and a parameter used to model the material tortuosity (ϑ). CO2 concentration is one of the most important parameters of carbonation in a deep layer: under low CO2 concentration (2–20%), the increase of carbonation depth was found to be higher than in the case of high concentration exposure. The reason is mainly due to the microstructure change caused by concrete carbonation, which makes the surface layer denser, thus lowering the rate of CO2 diffusion into wall layers [14].
The carbonation process of lime on painted walls is a crucial phenomenon in fresco artworks, and it is of paramount importance in the conservation field to consider it both for diagnostic and dating purposes. The aim of this work consists of developing a dating model for frescoes and wall paintings using information on carbonation processes in relation to the 780 cm−1 luminescence band of calcium hydroxide. There are already other methods for dating mortars and plaster, such as radiocarbon dating, which is the most considered at the moment [21]. However, in addition to its destructive character [22], it shows different dating problems due to the presence of carbonate impurities [23,24] or delayed hardening and reactivation of binder calcite [25]. Taking into account that these kinds of artworks are in most cases unmovable, unique, and unrepeatable relics, the use of a portable, non-invasive, and non-destructive technique, such as Micro Raman spectroscopy, is the choice of election. Indeed, the exploitation of a portable Near Infrared (NIR) μ-Raman technique revealed high potential in its usefulness in a cultural heritage field [26,27,28,29], and it was previously proposed to study the aging model of ancient paper [30] and pigments [31]. In addition, in the present case, since the 780 cm−1 band is observed only under 1064 nm excitation, NIR μ-Raman analysis is the perfect tool to extract the required information.
2. Materials and Methods
2.1. Experimental Set-Up
2.1.1. Raman Measurements
NIR micro Raman scattering measurements were carried out in back scattering geometry with the 1064 nm line of an Nd:YAG laser. Measurements were performed in air at room temperature with a compact spectrometer B&WTEK (B&WTEX, Newark, DE, USA) i-Raman Ex integrated system with a spectral resolution of less than 8 cm−1. The spectra were collected with different acquisition times between 20 s and 80 s and power excitation between 20 and 40 mW concentrated in a spot of 0.3 mm2 on the surface through the BAC151B Raman Video Micro-Sampling System (B&WTEX, Newark, DE, USA) equipped with a 20× Olympus objective to select the area on the samples.
High resolution micro Raman scattering measurements were obtained in back scattering geometry through the confocal system SOL Confotec MR750 equipped with Nikon Eclipse Ni microscope (SOL Instruments Ltd, Minsk, Belarus). Raman spectra were gathered by using, as an excitation wavelength, the 785 nm line, IO MatchBox series laser diode (Integrated Optics, Vilnius, Lithuania). The system is equipped with four gratings (150, 600, 1200, and 1800 grooves/mm), which can be selected depending on the measurement requirements. The grating with 1800 grooves/mm was used to obtain a resolution of 0.2 cm−1.
Experimental points are determined as the average of 10 measurements with a standard deviation of about 10%.
2.1.2. X-ray Diffraction Measurements
XRD analysis was obtained by a diffractometer Rigaku Ultima IV (Rigaku, Tokyo, Japan). The XRD pattern was collected using as excitation the Cu-Kα (40 KV, 40 mA), varying the angle θ in the range 10°–60° with resolution of 0.2° step/s. Obtained patterns were analyzed by EVA database in order to identify all the phases present in the starting material.
2.1.3. DTA/TG Measurements
DTA/TG measurements (see in Supplementary Materials) were performed through the system PerkinElmer TGA7-DSC7 (PerkinElmer, Waltham, MA, USA) varying the temperature in a controlled ramp of 10 °/min. The analyses were performed in N2 and O2 atmosphere ranging the temperature from 25 °C to 600 °C. Isothermal DTA/TG in N2 and O2 atmosphere was executed keeping the samples for 1 h at 200 °C, simulating the same experimental condition of proposed synthetic samples.
2.2. Sample Preparation
2.2.1. Samples Used for Ageing Process
CaCO3 powders were obtained by crushing pure commercial calcite stone (Sigma Aldrich, 99.95% Suprapur® grade). The samples were calcinated at 1000 °C for 2 h in order to obtain CaO powders. The product was then wetted with distilled water and mixed to complete the reaction. Finally, the obtained Ca(OH)2 was heated at different temperatures (90–200–300–400) for 1 h.
2.2.2. Samples Used to Evaluate the Carbonation in Depth
Marble stone powders were heated to 1000 °C for 2 h. Distilled water was added to CaO compound in the stoichiometric ratio 1:1 and dried at 60 °C for 1 h. Then, it was ground with mortar and pestle, the obtained powder was heated in oven at 200 °C for 1 h inside a large container in order to expose a large thin layer of powder and to produce a homogeneous luminescent band in all the powder (the luminescent band obtained after a heated treatment involves only a superficial layer of 1.5 mm). Then, the treated material t was compacted adding distilled water (1:1) to form a cylindrical shape with a height of 1 cm and radius of 2.5 cm. The edges were carefully isolated from CO2 absorption with an impermeable coating.
2.2.3. A List of Samples Used for a Natural Aged Model, Taken from Experimental Works Found in Literature
The collected spectra were digitized and managed for applying the kinetic model. Two samples were experimentally studied by the authors:
- Palazzo Farnese fresco (ca. 500 years old) [32];
- Sala Vaccarini wall paintings (ca. 400 years old) [33];
- Entombment of Christ’ fresco, ca. 1175 AD (ca 800 years old) [34];
- Lime walls of Southwell Minster (ca. 750 years old) [34];
- Winchester Cathedral fragment of wall painting (ca. 875 years old) [35];
- Sherborne Abbey fragment of all painting (ca. 850 years old) [35];
- Ermita de San Pelayo fresco (ca. 900 years old) [36];
- Palace at Jerico (ca. 2100 year old) [37];
- Romano-British wall-paintings (ca. 1850 years old) [38];
- Monastery of San Baudelio (1000 years old) [39];
- San Giuseppe Church’ s fresco dated around 1750–1850 (ca. 220 years ago) [40]—Experimental study.
- Branice Castel fragment (ca. 400 years old) [41];
- Amorites civilization wall painting fragment from Tell Atchana escavation—Ashmolean Museum Oxford (ca. 3500 years old) [42]—Experimental study.
2.2.4. Ca(OH)2 Reference Sample
Ca(OH)2 powder was acquired from Sigma Aldrich (≥95.0%, 3% CaCO3).
3. Results and Discussion
In order to propose an aging model for lime wall paints exploiting the above-mentioned first order kinetics to evaluate literature and experimental data, some crucial aspects and possible sources of error need to be preliminarily investigated. Among the others, the choice of a common R0, the evaluation of the sampling depth, and the history of each sample are the most important. Each of these factors can heavily influence the estimated age of an artwork through the final alpha-value. In the following, we propose how each aspect can be dealt with.
The first step is to apply Equation (2) to naturally aged frescoes, so that we collected spectra of frescoes and wall paints from literature, spanning a time interval of various centuries. As already stated, we calculated the Rt-value of an artwork as the intensity ratio between luminescent band at 780 cm−1 (1160–1170 nm) and the calcite band at 1087 cm−1. To estimate the Rt-value of each artwork, we considered its declared age. A detailed procedure of Rt extraction from Raman spectra is reported in the Supplementary Materials with related statistical error propagation. The correct evaluation of the carbonation degree α (see Equation (1)) stems from the choice of a common R0-value for all the artworks. In principle, the R0-value would be proportional to the storage/settling time of the lime used and then it could depend on the manufacturing procedure of each ancient civilization. The points used for developing the model belong to different historical periods with different syntheses procedures, so they could have different R0. In order to demonstrate the importance of assuming a R0 common value, simulations of the carbonation degree as a function of R0 are reported in Figure 1. The increase in R0 leads to a decrease in the characteristic time of the curve (tau). Then, at high R0 values, the carbonation degree reaches its maximum faster, showing that fits with R0 value greater than 7 are useful to analyze a shorter time range (500 years), whilst lower values of R0 allow the analysis of a larger time range.
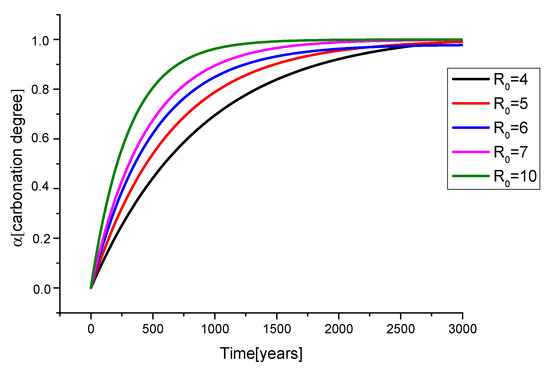
Figure 1.
First order kinetic model calculated at different R0.
We can remedy this problem by determining an average theoretical R0 from literature data by plotting Rt-values as a function of the time (Figure 2). According to Equation (1), and assuming the term γ = 1 (i.e., all the possible superficial centres are completely carbonated at the end of the process), we get the following Equation (4):
where τ is the characteristic time of the process.
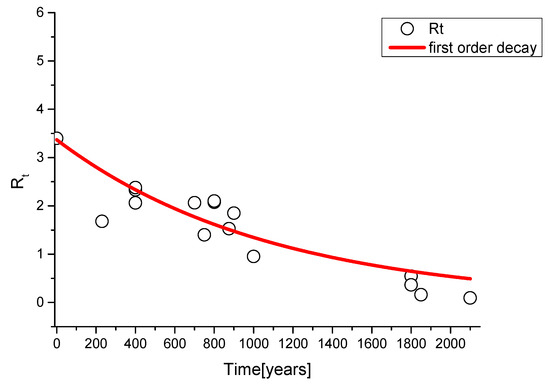
Figure 2.
First order decay fit to obtain an average R0 value from literature points.
The operated fit returns an average R0 value of (3.4 ± 0.3). This value is in very good agreement with the experimental R0(ind) of modern industrial calcium hydroxide (3.3 ± 0.3, vide infra), realized with synthesis processes very similar to ones of ancient civilization.
Indeed, contemporary production of calcium hydroxide in the construction industry follows the consolidated settling/storage process explained, for example, by Vitruvius in [43,44], being the common procedures to obtain calcium hydroxide by the natural process based on the storage/settling of the material for a period ranging within nine months and two years. The complete formation mechanism of this defective phase, in a natural process, is not completely understood. Actually, a storage/settling in an aqueous medium produces the formation of amorphous Ca(OH)2 [45], and in an air medium, carbonation. Then, the production of this defective band is still an object of study. Thus, the value R0(ind) = 3.3 could be considered a reasonable choice because it is in agreement with the average R0-value obtained from the previous analysis.
The industrial calcium hydroxide R0(ind) was obtained as the average ratio of the spectrum bands collected in different points of the powder (see Figure 3a) and can be used in the Equation (5) (naturally aged model) to extract the characteristic time of the the carbonation process from the literature data:
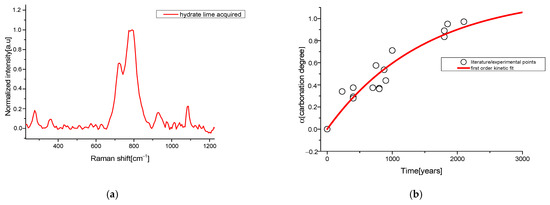
Figure 3.
(a) 1064 nm—Raman spectrum of calcium hydroxide acquired; traces of calcite are present; (b) first order kinetics applied on data taken from literature and experimental data.
The fit obtained from these α values is shown in Figure 3b and provides a characteristic time τ = (1490 ± 400) years (the asymptotic γ value was set to 1, assuming that, according to the age of each reported artwork, the carbonation process was completed).
Although the calculated tau seems to be very large for fresco paintings, we remind readers that it represents the characteristic time associated with the carbonation of the only defective phase of carbon hydroxide present in the sample and not to the overall amount. In addition, according to the literature [3,46,47], the natural carbonation reaction in a fresco could be very slow, because of the decreasing of surface porosity, shielding effect associated with external carbonated layers and the presence of carbonated core-shell systems of calcium hydroxide grains.
The reported fit assures that the model is able to date frescoes and wall paintings belonging to different historical ages. To improve its validity, we need to also consider how the carbonation process proceeds in depth. With this purpose, a study on the depth-dependence of the carbonation process is necessary because sampling at different depths can lead to large differences on the estimated carbonation degree of an artwork. As already reported [37,38], analyzed points of a fresco could be taken on the surface or on substrate layers, when, for example, examining the spectra from a wall paints; in addition, optical objectives with a high depth of field collects signals from many layers below the surface. These facts can affect the fits proposed in Figure 1 and Figure 3, possibly providing an explanation for the discrepancy of some points with the model curve.
To perform this study, we needed to recreate a sample which presented not only similar characteristics of natural lime but also an aging speed compatible with a laboratory scale time. The artificial aging was performed by thermal treatment in the 90–400 °C range, a synthetic procedure adopted in our previous study, to achieve the same starting degree of defective calcium hydroxide and to study their kinetics within an affordable laboratory time scale. We were able to reproduce the carbonation process and the consequent variation of the luminescence phenomena with artificial lime samples by heat treatment, obtaining R0 values as a function of the temperature (within a variable range of 0.3 and 32), and we exploited it to study the carbonation process on the surface [9]. The variation of R0 values is due to a different production of defectivities with respect to the carbonate phase. Now, we need to map the thermal treatments to natural aging applying the model to the evaluation of the carbonation process in depth. To this purpose, among the samples realized at different temperatures, we selected the one heated at 200 °C, whose measured R0 value of (4.7 ± 0.6) is the most similar one to the R0(ind) (Figure 4).
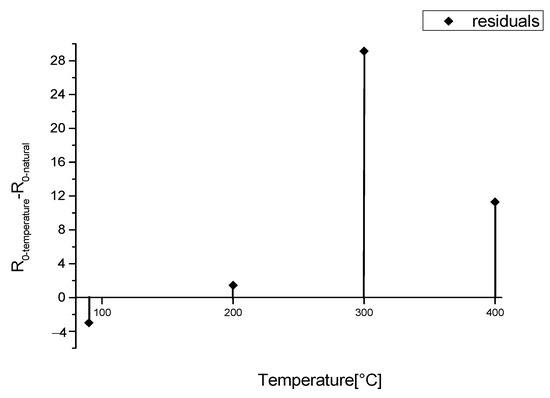
Figure 4.
Difference between R0-values obtained from artificial aged models heated at different temperatures (R0-temperature) and the R0-value of natural aged model (R0-natural).
In addition, to carry out the evaluation of the carbonation process along the depth, we need to calibrate our previous kinetics models to the heat treatments. Therefore, we estimated a conversion factor from the ratio between the natural and artificial characteristic times as indicated in Equations (6) and (7):
The same procedure can also be applied to map all the artificially aged samples (at 90–300–400 °C), as follows:
In our previous work [9], the γ parameter related to the relative amount of carbonation did not reach the asymptotic value of 1. Assuming that the luminescent band is related only to a hydrated phase instead of a carbonated one, it is reasonable that, after a long time, the entire amount of starting portlandite will naturally convert into calcite and that band may disappear. Therefore, we set γ = 1 in the calibration equation. Finally, we can write the calibration Equation (8):
leading to the curves reported in Figure 5.
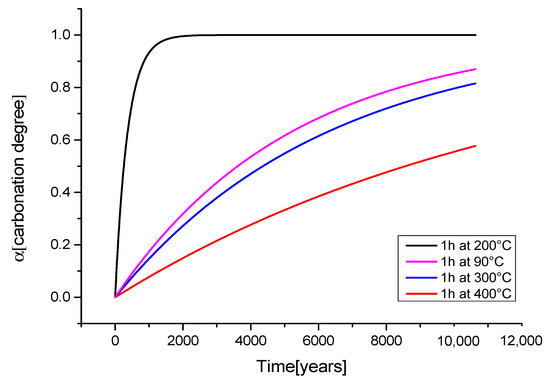
Figure 5.
Calibrated fits using τeq to obtain aging kinetic models pre-treated for 1 h at different temperatures.
To validate the aging process by thermal treatment, we measured the XRD patterns and the high-resolution Raman spectra of the heated samples. As reported in Figure 6a,b, no other phases of the compounds are detected, revealing that the heating procedure does not modify our samples. This is confirmed by vibrational spectra, where we observed that the heat treatment slightly affects the position and shape of Raman peaks, due to a possible small structural variation (inset of Figure 6c).
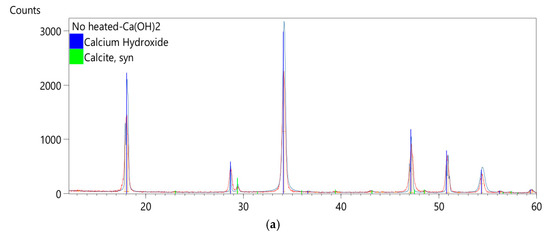
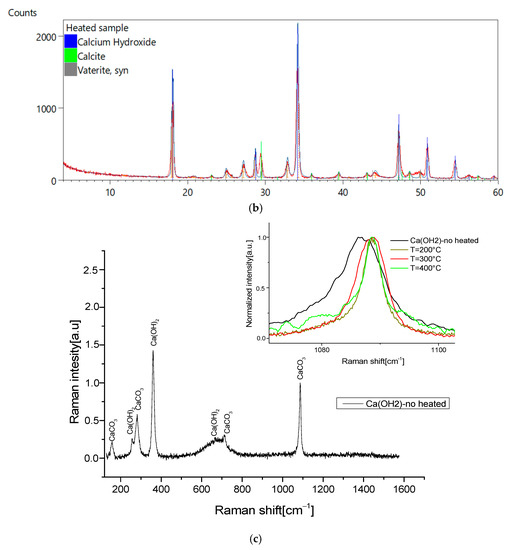
Figure 6.
(a) XRD pattern of calcium hydroxide after synthesis; (b) XRD pattern of calcium hydroxide after 200 °C-heated exposed to air for 20 days; (c) 785 nm high resolution Raman spectra of synthesized Calcium hydroxide exposed to air for 20 days; inset, the comparison between the no-heated and heated calcium hydroxide 785-Raman spectra, details of the 1087 cm−1 band.
DTA/TG analyses executed in the N2 and O2 atmosphere confirm these results. There are more details in the Supplementary Materials. Finally, to analyze the carbonation process as a function of the sample depth, the measurements performed in progressive depths were taken over 18 days, with step of 2–3 days, down to a depth of 4 mm from the surface. This procedure aims to correlate the progressive diffusion of CO2 inside the sample, producing different kinetics of carbonation, to the effect of ageing connected to the same carbonation as proposed before.
As evidenced in Figure 7, the first order kinetic model accurately describes the carbonation process also in depth, but for the 4 mm case (Figure 7a) where a linear trend is recorded. We can explain this effect considering that the carbonation slows down as it proceeds in depth because of many concurrent factors such as the increasing of RH%, a low content of CO2 available, etc. Thus, after 20 days, we are able to appreciate only the linear range of the model (first part). The other reported curves (between 0 mm and 3 mm) do show the same trend and are successfully described by the model (the characteristic time of each curve is reported in Table 1).
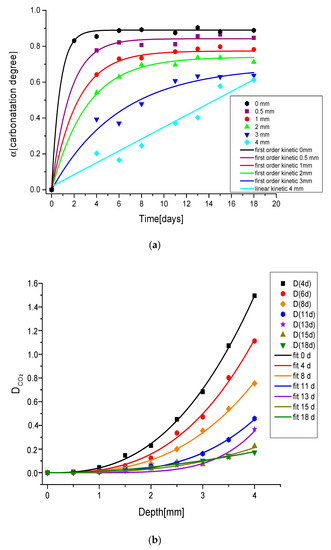
Figure 7.
(a) Kinetic model in depth for a sample heated at 200 °C, (b) diffusion coefficient for unit of [CO2] in a sample heated at 200 °C as a function of carbonation depth at different days of air exposure.

Table 1.
Fit parameters of the carbonation curve in depth.
Our results can be further exploited to evaluate the diffusion of carbon dioxide (DCO2) and verify Equation (3) (Figure 7b). If we assume that the ratio of Ca(OH)2 and CO2 concentration is expressed by Raman derived Rn values, since the CO2 diffusion produces only the carbonation process, we can retrieve the relationship between CO2 diffusion and depth from the experimental data. As reported in the figure, the data are well fitted by a square law relationship, confirming the hypothesis of Equation (3). The diffusion parameter increases remarkably with depth during the first week of analysis, then it changes slowly. Moreover, CO2 diffusion is proportional to sample porosity, to the water degree (related to RH) and the sample tortuosity [15,20]. From this point of view, a possible explanation of the increasing trend with depth could reside in the porosity variation. In fact, with the carbonation process, the porosity of the medium decreases causing a gradient as a function of the depth [48]. In addition, the enhancement of RH causes an increase in the volume fraction of the pores occupied by water, thus leading to a reduction of the diffusion parameter [49,50,51]. With the intention to validate the model, the exposed results need to be validated with an accurate study where the composition at single depth is determined. A further work is under progress where the DTA/TG between room temperature and 1000 °C will be performed for this purpose.
Factors Conditioning the Model and Accuracy
Many factors are involved in the carbonation rate, and, as reported in the previous figure, it is clear that carbonation measurements are strongly related to the sampling depth in a fresco. Actually, the observed kinetics associated with the sample depth can affect our dating model, especially considering the sampling procedure. We can define a “depth-parameter” related to the experimental sampling procedures, to account for surface erosion, corrosion, crack formation or substrate measurements with different objectives or in different layers of fresco. To consider this source of uncertainty in our model, we considered a depth parameter of about 0.5 mm and thus the values reported in Table 1 for the 0.5 mm depth. This assumption is justified by considering that the characteristic time of 0.5 mm is twice the one of 0 mm and that condition is sufficient to cause a considerable uncertainty. The results are shown in Figure 8a where previous data are once again considered with the addition of two new sets of experimental data to further discuss the model. Those samples, shown in Figure 8b,c, are characterized by peculiar conservation conditions, so that they can represent a stress test for our model. It is clear, indeed, that the two new sets do not follow the dating model, or, reversing the sentence, the reported data display that the known age of the samples and the estimated one largely differ because of the conservation conditions. One of the new samples belongs to a fresco of the San Giuseppe Church (realized around the end of the 18th century). The estimated carbonation degree is 250 years older than its real age (230 years old). The second sample belongs to a Sumerian wall painting dated around the second to first millennium B.C. It shows a carbonation degree comparable with an age of 700 years old in our model. As already stated, these data fall out of the model curve because of the conservation conditions.
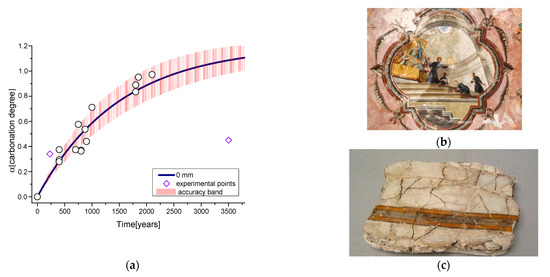
Figure 8.
(a) Final kinetic model (0 mm) with accuracy band (red); literature points (circles); experimental points (rhombuses); (b) San Giuseppe fresco; (c) Amorite civilization wall painting fragment from Tell Atchana excavation (ca. 3500 years old).
In the first case, the location of the fresco can explain the discrepancy. It was painted in the vault of the Sacristy, typically illumined with candles so that the carbon dioxide and smoke produced from the candles, as testified by the superficial blackening of the paint and by Raman analysis [40], could have sped up the carbonation process of the fresco. In the second case, the fragment remained buried until a few decades ago, thus largely slowing down its carbonation process. These two examples illustrate that the dating procedure is a delicate one because many external factors could affect the carbonation process here accounting for dating purposes. Among the others, one should always consider water infiltration, indoor and outdoor exposure, restoration interventions or burial conditions, which could affect, as demonstrated here, the evaluation of the sample aging.
To conclude, applying the dating procedure from this preliminary model, the age of a sample can be evaluated starting from the Equation (9) (obtained from Equation (2)):
which presents, at the moment, an accuracy of 40% in relation to all the factors mentioned before. For more details about values and error of time t, we refer to the Supplementary Materials. Important improvements can be obtained by (1) reducing the tau-error related to the literature points used in the text; and (2) increasing the experimental sampling procedure (focus) to determine the Rt parameter and then the carbonation grade alpha. Despite the accuracy being not so good, it is not so far from other methods like radiocarbon. If we consider the no-destructivity of this technique, we retain in any case a good result.
4. Conclusions
In this work, by using the information obtained with NIR-Raman spectroscopy applied to calcium hydroxide, the carbonation process of ancient wall paintings taken from literature and from experimental samples was exploited to achieve a preliminary dating model for frescoes. The model is based on the variation in relative intensity ratio of two bands: the 780 cm−1 band (excitation at 1064 nm) ascribed to luminescence defects in calcium hydroxide and the 1087 cm−1 band ascribed to vibrations of the carbonated phase. In order to explain one of the possible discrepancy factors of the model, a study of the carbonation process as a function of the depth in a synthesized calcium hydroxide sample was executed. The aim of this study was to improve and set a validity region of our starting model. We determined an accuracy band as the semi-region between the surface and 500 μm of depth curves, comparable with the variable sampling depth with 1064 nm-Raman source on a painted surface.
Supplementary Materials
The following are available online at https://www.mdpi.com/2073-4352/11/3/257/s1.
Author Contributions
Conceptualization, D.C. and F.A.P.; methodology, F.A.P., P.C.R., R.C.; validation, D.C.; formal analysis, F.A.P.; investigation, F.A.P.; data curation, F.A.P.; writing—original draft preparation, F.A.P.; writing—review and editing, C.M.C.; supervision, D.C., C.M.C. All authors have read and agreed to the published version of the manuscript.
Funding
This research received no external funding.
Institutional Review Board Statement
Not applicable.
Informed Consent Statement
Not applicable.
Data Availability Statement
Not applicable.
Acknowledgments
The authors thank Silvana Maria Grillo for valuable assistance and discussions in the XRD analyses. The authors thank Giulia Rossella Delpiano for the DTA/TG analysis. The authors thank Paul Collins and the Ashmolean Museum of Oxford for the analysis performed on some experimental samples. The authors also thank the Reviewers and the Editors for all comments and suggestions, which helped them to improve the quality of the article.
Conflicts of Interest
The authors declare no conflict of interest.
References
- Linn, R.; Cline, E.H.; Yasur-Landau, A. Technological study of Middle Bronze Age painted plaster fragments from the Canaanite Palace of Tel Kabri, Israel—Materials and painting techniques. J. Archaeol. Sci. Rep 2017. [Google Scholar] [CrossRef]
- Horgnies, M.; Darque-Ceretti, E.; Bayle, M.; Gueit, E.; Aucouturier, M. An exceptionally perennial surface artwork: Fresco on lime or on cement. Surf. Interface Anal. 2014. [Google Scholar] [CrossRef]
- Piovesan, R.; Mazzoli, C.; Maritan, L.; Cornale, P. Fresco and lime-paint: An experimental study and objective criteria for distinguishing between these painting techniques. Archaeometry 2012. [Google Scholar] [CrossRef]
- Camerini, R.; Poggi, G.; Chelazzi, D.; Ridi, F.; Giorgi, R.; Baglioni, P. The carbonation kinetics of calcium hydroxide nanoparticles: A Boundary Nucleation and Growth description. J. Colloid Interface Sci. 2019. [Google Scholar] [CrossRef]
- Montes-Hernandez, G.; Renard, F.; Geoffroy, N.; Charlet, L.; Pironon, J. Calcite precipitation from CO2-H2O-Ca(OH)2 slurry under high pressure of CO2. J. Cryst. Growth 2007. [Google Scholar] [CrossRef]
- Montes-Hernandez, G.; Pommerol, A.; Renard, F.; Beck, P.; Quirico, E.; Brissaud, O. In situ kinetic measurements of gas-solid carbonation of Ca(OH)2 by using an infrared microscope coupled to a reaction cell. Chem. Eng. J. 2010. [Google Scholar] [CrossRef]
- Rodriguez-Navarro, C.; Elert, K.; Ševčík, R. Amorphous and crystalline calcium carbonate phases during carbonation of nanolimes: Implications in heritage conservation. CrystEngComm 2016. [Google Scholar] [CrossRef]
- Shih, S.M.; Ho, C.S.; Song, Y.S.; Lin, J.P. Kinetics of the reaction of Ca(OH)2 with CO2 at low temperature. Ind. Eng. Chem. Res. 1999. [Google Scholar] [CrossRef]
- Pisu, F.A.; Chiriu, D.; Ricci, P.C.; Carbonaro, C.M. Defect Related Emission in Calcium Hydroxide: The Controversial Band at 780 cm−1. Crystals 2020, 10, 266. [Google Scholar] [CrossRef]
- Tongaria, K. A Review on Carbonation of Concrete and Its Prediction Modelling. J. Environ. Nanotechnol. 2018. [Google Scholar] [CrossRef]
- McPolin, D.O.; Basheer, P.A.; Long, A.E. Carbonation and pH in Mortars Manufactured with Supplementary Cementitious Materials. J. Mater. Civ. Eng. 2009. [Google Scholar] [CrossRef]
- Behnood, A.; Van Tittelboom, K.; De Belie, N. Methods for measuring pH in concrete: A review. Constr. Build. Mater. 2016, 105, 176–188. [Google Scholar] [CrossRef]
- Ji, Y.S.; Wu, M.; Ding, B.; Liu, F.; Gao, F. The experimental investigation of width of semi-carbonation zone in carbonated concrete. Constr. Build. Mater. 2014. [Google Scholar] [CrossRef]
- Cui, H.; Tang, W.; Liu, W.; Dong, Z.; Xing, F. Experimental study on effects of CO2 concentrations on concrete carbonation and diffusion mechanisms. Constr. Build. Mater. 2015. [Google Scholar] [CrossRef]
- Younsi, A.; Turcry, P.; Aït-Mokhtar, A.; Staquet, S. Accelerated carbonation of concrete with high content of mineral additions: Effect of interactions between hydration and drying. Cem. Concr. Res. 2013. [Google Scholar] [CrossRef]
- Lagerblad, B. Carbon Dioxide Uptake during Concrete Life Cycle—State of the Art; CBI Report; Swedish Cement and Concrete Research Institute: Stockholm, Sweden, 2005. [Google Scholar]
- Papadakis, V.G.; Vayenas, C.G.; Fardis, M.N. Fundamental modeling and experimental investigation of concrete carbonation. ACI Mater. J. 1991. [Google Scholar] [CrossRef]
- Nagataki, S.; Ohga, H.; Kim, E.K. Effect of Curing Conditions on the Carbonation of Concrete with Fly Ash and the Corrosion of Reinforcement in Long-Term Tests. In Proceedings of the Publication SP; American Concrete Institute: Farmington Hills, MI, USA, 1986. [Google Scholar]
- Nagataki, S.; Mansur, M.A.; Ohga, H. Carbonation of Mortar in Relation to Ferrocement Construction. ACI Mater. J. 1988. [Google Scholar] [CrossRef]
- Powers, T.C. A Discussion of Cement Hydration in Relation to the Curing of Concrete. Highw. Res. Board Proc. 1948, 27, 178–188. [Google Scholar]
- Ringbom, Å.; Lindroos, A.; Heinemeier, J.; Sonck-Koota, P. 19 Years of Mortar Dating: Learning from Experience. Radiocarbon 2014. [Google Scholar] [CrossRef]
- Nawrocka, D.; Michniewicz, J.; Pawlyta, J.; Pazdur, A. Application of radiocarbon method for dating of lime mortars. Geochronometria 2005, 24, 109–115. [Google Scholar]
- Urbanová, P.; Boaretto, E.; Artioli, G. The State-of-the-Art of Dating Techniques Applied to Ancient Mortars and Binders: A Review. Radiocarbon 2020. [Google Scholar] [CrossRef]
- Vecchiattini, R.; Pesce, G.L.; Quarta, G.; Calcagnile, L. Sampling problems in the radiocarbon dating of old mortars and plasters with the “pure lime lumps ” technique. Built Herit. 2013, 2013, 1066–1074. [Google Scholar]
- Lindroos, A.; Ringbom, Å.; Heinemeier, J.; Hajdas, I.; Olsen, J. Delayed Hardening and Reactivation of Binder Calcite, Common Problems in Radiocarbon Dating of Lime Mortars. Radiocarbon 2020. [Google Scholar] [CrossRef]
- Chiriu, D.; Ricci, P.C.; Scattini, M.; Polcaro, A.; D’Andrea, M.; Richard, S.; Qader, A.A.; Carbonaro, C.M. Portable NIR Raman microspectroscopy investigation on Early Bronze IV pottery (2500–1950 BCE) from Khirbat Iskandar, Jordan. Vib. Spectrosc. 2018. [Google Scholar] [CrossRef]
- Chiriu, D.; Ricci, P.C.; Carbonaro, C.M.; Nadali, D.; Polcaro, A.; Mocci, F. Drying oil detected in mid-third Millennium B.C. Mesopotamian clay artifacts: Raman spectroscopy and DFT simulation study. Microchem. J. 2016. [Google Scholar] [CrossRef]
- Chiriu, D.; Ricci, P.C.; Cappellini, G. Raman characterization of XIV–XVI centuries Sardinian documents: Inks, papers and parchments. Vib. Spectrosc. 2017. [Google Scholar] [CrossRef]
- Chiriu, D.; Ricci, P.C.; Carbonaro, C.M.; Nadali, D.; Polcaro, A.; Collins, P. Raman identification of cuneiform tablet pigments: Emphasis and colour technology in ancient Mesopotamian mid-third millennium. Heliyon 2017. [Google Scholar] [CrossRef] [PubMed][Green Version]
- Chiriu, D.; Ricci, P.C.; Cappellini, G.; Salis, M.; Loddo, G.; Carbonaro, C.M. Ageing of ancient paper: A kinetic model of cellulose degradation from Raman spectra. J. Raman Spectrosc. 2018. [Google Scholar] [CrossRef]
- Chiriu, D.; Pala, M.; Pisu, F.A.; Cappellini, G.; Ricci, P.C.; Carbonaro, C.M. Time through colors: A kinetic model of red vermilion darkening from Raman spectra. Dye Pigment. 2021. [Google Scholar] [CrossRef]
- Edwards, H.G.M.; Gwyer, E.R.; Tait, J.K.F. Fourier Transform Raman analysis of paint fragments from biodeteriorated Renaissance frescoes. J. Raman Spectrosc. 1997. [Google Scholar] [CrossRef]
- Barone, G.; Bersani, D.; Coccato, A.; Lauwers, D.; Mazzoleni, P.; Raneri, S.; Vandenabeele, P.; Manzini, D.; Agostino, G.; Neri, N.F. Nondestructive Raman investigation on wall paintings at Sala Vaccarini in Catania (Sicily). Appl. Phys. A Mater. Sci. Process. 2016. [Google Scholar] [CrossRef]
- Edwards, H.G.M.; Farwell, D.W. The conservational heritage of wall paintings and buildings: An FT-Raman spectroscopic study of prehistoric, Roman, mediaeval and Renaissance lime substrates and mortars. Proc. J. Raman Spectrosc. 2008, 39, 985–992. [Google Scholar] [CrossRef]
- Edwards, H.G.M.; Brooke, C.J.; Tait, J.K.F. Fourier transform Raman spectroscopic study of pigments from english mediaeval wall paintings. J. Raman Spectrosc. 1997. [Google Scholar] [CrossRef]
- Villar, S.E.J.; Edwards, H.G.M.; Medina, J.; Perez, F.R. Raman spectroscopic analysis of mediaeval wall paintings in the Palencia region, Spain. Proc. J. Raman Spectrosc. 2006, 37, 1078–1085. [Google Scholar] [CrossRef]
- Edwards, H.G.M.; Farwell, D.W.; Rozenberg, S. Raman spectroscopic study of red pigment and fresco fragments from King Herod’s Palace at Jericho. J. Raman Spectrosc. 1999. [Google Scholar] [CrossRef]
- Edwards, H.G.M.; Middleton, P.S.; Jorge Villar, S.E.; De Faria, D.L.A. Romano-British wall-paintings II: Raman spectroscopic analysis of two villa sites at Nether Heyford, Northants. Anal. Chim. Acta 2003. [Google Scholar] [CrossRef]
- Edwards, H.G.M.; Rull, F.; Vandenabeele, P.; Newton, E.M.; Moens, L.; Medina, J.; Garcia, C. Mediaeval pigments in the monastery of San Baudelio, Spain: A Raman spectroscopic analysis. Appl. Spectrosc. 2001. [Google Scholar] [CrossRef]
- Chiriu, D.; Desogus, G.; Pisu, F.A.; Fiorino, D.R.; Grillo, S.M.; Ricci, P.C.; Carbonaro, C.M. Beyond the surface: Raman micro-SORS for in depth non-destructive analysis of fresco layers. Microchem. J. 2019, 104404. [Google Scholar] [CrossRef]
- Kaszowska, Z.; Malek, K.; Staniszewska-Slezak, E.; Niedzielska, K. Raman scattering or fluorescence emission? Raman spectroscopy study on lime-based building and conservation materials. Spectrochim. Acta Part A Mol. Biomol. Spectrosc. 2016. [Google Scholar] [CrossRef] [PubMed]
- Yener, K.A. Re-examining and Re-imaging the Past: The Wooley and Yener Excavations at Alalakh. In The Forgotten Kingdom: Archaeology and Photography at Ancient Alalakh; Akar, M., Maloigne, H., Eds.; Koc University Press: Istanbul, Turkey, 2014. [Google Scholar]
- Wetmore, M.N.; Vitruvius; Morgan, M.H. Vitruvius: The Ten Books on Architecture. Class. Wkly. 1916. [Google Scholar] [CrossRef]
- Dix, B. The manufacture of lime and its uses in the western roman provinces. Oxf. J. Archaeol. 1982. [Google Scholar] [CrossRef]
- Rodriguez-Navarro, C.; Hansen, E.; Ginell, W.S. Calcium hydroxide crystal evolution upon aging of lime putty. J. Am. Ceram. Soc. 1998. [Google Scholar] [CrossRef]
- Galan, I.; Glasser, F.P.; Baza, D.; Andrade, C. Assessment of the protective effect of carbonation on portlandite crystals. Cem. Concr. Res. 2015. [Google Scholar] [CrossRef]
- Oriols, N.; Salvadó, N.; Pradell, T.; Butí, S. Amorphous calcium carbonate (ACC) in fresco mural paintings. Microchem. J. 2020. [Google Scholar] [CrossRef]
- Zhang, Q. Mathematical modeling and numerical study of carbonation in porous concrete materials. Appl. Math. Comput. 2016. [Google Scholar] [CrossRef]
- Papadakis, V.G.; Vayenas, C.G.; Fardis, M.N. A reaction engineering approach to the problem of concrete carbonation. AIChE J. 1989. [Google Scholar] [CrossRef]
- Papadakis, V.G.; Vayenas, C.G.; Fardis, M.N. Physical and chemical characteristics affecting the durability of concrete. ACI Mater. J. 1991. [Google Scholar] [CrossRef]
- Papadakis, V.G.; Vayenas, C.G.; Fardis, M.N. Experimental investigation and mathematical modeling of the concrete carbonation problem. Chem. Eng. Sci. 1991. [Google Scholar] [CrossRef]
Publisher’s Note: MDPI stays neutral with regard to jurisdictional claims in published maps and institutional affiliations. |
© 2021 by the authors. Licensee MDPI, Basel, Switzerland. This article is an open access article distributed under the terms and conditions of the Creative Commons Attribution (CC BY) license (http://creativecommons.org/licenses/by/4.0/).