Abstract
We report on the 3D precipitation, using a direct laser writing approach, of highly fluorescent silver clusters in a Eu3+-doped silver-containing zinc phosphate glass. Micro-spectroscopy of fluorescence emission shows the ability to continuously adjust the local tri-chromatic coordinates in the CIE (Commission Internationale de l’Éclairage) chromaticity diagram between red and white colors, thanks to the laser-deposited dose and resulting tunable combination of emissions from Eu3+ and silver clusters. Moreover, continuous-wave and time-resolved FAST-FLIM spectroscopies showed a significant enhancement of the fluorescence emission of Eu3+ ions while being co-located with UV-excited laser-inscribed silver clusters. These results demonstrate the ability to perform efficient resonant non-radiative energy transfer from excited silver clusters to Eu3+, allowing such energy transfer to be highly localized on demand thanks to laser inscription. Such results open the route to 3D printing of the rare earth ions emission in glass.
1. Introduction
Photonics has been clearly identified as a key enabling technology. The development of such penetrating technology relies on its ability to integrate and miniaturize components and devices. Therefore, the development of innovative materials together with the fabrication processes remain a central issue. Glass materials have shown, thanks to the development of fiber technology, for instance, that they are excellent candidates for optical applications. New solutions should be found for the enhancement and promotion of 3D architectures. This requires developing intense local physical effects that could be structured in 3D. Direct laser writing offers numerous solutions for shaping and inscribing functionality in glass [1]. Moreover, designed glass compositions can offer additional possibility for implementing multiple functionalities, such as luminescence, for instance [2]. Structuring efficient emissions in various spectral range remains an important challenge. This last decade, we demonstrated that femtosecond direct laser writing (DLW) in a high optical quality photosensitive silver-containing zinc phosphate glass allows for implementing a 3D fluorescent structure formed by the aggregation of silver ions and silver atoms within the glass volume [3], which could be a solution for perennial three-dimension high-density data storage [4,5,6,7]. The cluster exhibits a broad excitation spectrum from 280 nm up to at least 550 nm. This local precipitation of silver clusters is preceded by the localized creation of a space charge separation at the root of a perennial high-amplitude (~108–9 V/m) static electric field, leading to the local breaking of centrosymmetry and thus allowing for an efficient electric field-induced second-harmonic generation (χ(2)eff~0.8 pm/V) [8,9]. Moreover, the spatial structuring of the incident laser beam led us to achieve the first demonstration of bulk structuring by means of optical vortex-induced DLW [10], locally producing correlative optical contrast in terms of silver cluster fluorescence, and of effective second-order nonlinear optical properties. Despite the high repetition rate of the laser/glass interaction to produce the silver clusters, the associated irradiation regime is indeed an athermal regime for which energy deposition at the voxel interaction is very moderate [11,12]. This results in a very limited local temperature increase (100 °C or less) so that temperature remains much below the glass transition temperature in the specific irradiation regime that leads to silver cluster creation [11,12]. Finally, these innovative laser-induced multi-scale structures were tuned into silver metallic nano-crystallites by means of thermal annealing, creating a composite metal-dielectric material with plasmonic properties [13]. The local formation of various types of molecular silver clusters (labeled Agmn+, such as in ref [13]) by DLW was recently shown to be partially or fully inhibited by original dual-color DLW with the co-illumination of a CW UV beam with the fs IR structuring beam, opening interesting potentialities in terms of super-resolution DLW [14]. The co-doping of glasses with both rare earth ions and noble metal ions has been increasingly reported [15,16,17,18] for optoelectronic devices such as white light emitting diodes, three-dimensional displays, and solar cells [15,17,18,19,20]. Indeed, efficient energy transfer between silver species and europium ions was described and achieved in various materials such as glasses and zeolite materials [15,16,21,22,23,24,25,26]. In glasses, in addition to the traditional melt technique to incorporate silver species with rare ions, different methods of preparation have been described, such as the ion-exchange processes. The modification of the quantum yield of fluorescence emission has been described thanks to the presence of silver clusters and silver nanoparticles [15]. An enhancement of the rare earth emission by energy transfer from silver clusters to Eu3+ ions has been observed in various matrices, such as in silicate [22,23] or borate [27].
In most of the investigations, there was no control of the spatial distribution of the rare earth ions’ emissions and the 3D organization of the luminescent structure was not considered. In the specific case of photonic integrated circuits, the issue of the 3D organization of robust luminescent structure is crucial. The goal is thus not solely the efficiency of the luminescent structure, but also the engineering of a luminescent 3D photonic structure. It requires one to be able to foster locally efficient transfer or enhancement mechanisms between noble ion-based aggregates and rare earth ions, for instance between silver species and europium ions.
In this article, we report on the co-doping of a silver-doped zinc phosphate glass with europium Eu3+ rare earth ions and the 3D structure of the luminescent properties. The absorption, excitation, and emission properties of the pristine co-doped glasses are investigated, and micro-luminescence properties are characterized after femtosecond laser direct writing and the local precipitation of fluorescent silver clusters. The origin of the interaction between the silver clusters and the europium ions is investigated in order to elucidate the potential contributions of radiative and non-radiative transfers. A local field enhancement effect due to hypothetical formation of metallic nanoparticles is also discussed.
2. Experimental Section
2.1. Glass Synthesis and Sample Preparation
The europium-doped silver-containing zinc phosphate glass with the composition 99.2[54.1 PO5/2/37 ZnO/1.4 GaO3/2/7.5 AgO1/2] − 0.8 Eu2O3 (mol. %) was prepared using classical melt/quench technique using platinum crucible. After annealing at 30 °C below the glass transition temperature, the glass is cut to 1 mm thick sample with typically 1 cm lateral dimensions and polished to optical quality. Hereafter, the co-doped glass sample is referred to as PZnAg:Eu. For nanoparticle development effect investigation, the glass was heat-treated at 400 °C, typically 20 °C above the glass transition temperature, for 30 min.
2.2. Transmission, Excitation and Emission Spectroscopies
The transmission spectroscopy was performed with a Carry 500 (differential transmission spectrometer from Varian (Agilent, Santa Clara, CA, USA) from 250 to 800 nm. The excitation and emission spectroscopies were performed with a SPEX Jobin Yvon fluorescence spectrometer equipped with double monochromator and Peltier cooled PMT (Horiba Jobin Yvon Gmbh, Haching, Germany).
2.3. Femtosecond Direct Laser Writing
DLW was performed using a Ytterbium fs oscillator (T-pulse 200, 9.1 MHz, 390 fs at 1030 nm, Amplitude Systèmes, Pessac, France), focused with a microscope objective (M Plan Apo NIR, 20× NA 0.4, Mitutoyo, Kawasaki, Japan). The transmitted irradiances were controlled by an acousto-optic modulator, enabling focused energies up to 100 nJ and associated focused irradiances up to 20 TW/cm2. The positioning and displacement of the sample were performed with a high-precision 3D translation stage (XMS-50 stages, Micro-Contrôle Spectra Physics, Beaune-la-Rolande, France). A laser–matter interaction matrix was performed, by producing 18 structured squares, each composed of 10 lines of 100 μm spaced by 10 μm, associated to 6 irradiances spanning from 2 to 6.7 TW/cm2, and 3 translation speeds of 10, 50 and 100 μm/s, respectively, corresponding to the local accumulation of 3.1 × 10⁶, 6.2 × 10⁶, and 3.1 × 10⁵ pulses.
2.4. Absorption Micro-Spectroscopy of the Structured Sample
Transmission measurements were performed in bright-field using a ‘CRAIC Technologies’ microscope equipped with a Xenon lamp and a condenser as a white light source and with a spectrometer equipped with CCD. A conjugated 10× magnification microscope objective was used to collect the transmitted light through the laser-induced structures. For such micro-transmission measurements, the reference spectrum was recorded through the pristine glass, exactly in the same geometrical conditions for the measurement through the laser-induced structures, which excludes any artifacts from distinct collection issues. As a consequence, the resulting transmission measurements gave direct experimental access to the local differential micro-extinction due to the laser-induced structures. Such a local differential micro-extinction, interpreted in terms of a linear absorption coefficient, is a spatially averaged value over a 50 × 50 μm2 surface, successively overlapping each of the 100 × 100 μm2 laser-induced structures.
2.5. Fluorescence Micro-Spectroscopy of the Structured Sample
Fluorescence spectrum measurements were performed in an epi-collection scheme, with a high spectral resolution micro-spectrometer (LabRAM HR800 from Jobin-Yvon, (Horiba Jobin Yvon GmbH, Haching, Germany) with a 150 grooves/cm grating for the spectral dispersion of the fluorescence in the near-UV and visible region) for three different conditions. First, a 325 nm excitation with a UV He-Cd laser source (30 mW, TEM 00, Kimmon, Tokyo, Japan) was focused with a UV-enhanced Cassegrain objective (36 × NA 0.5), and fluorescence was collected over the range of 330–750 nm. Second, a 405 nm excitation with a near-UV laser diode (100 mW, TEM00, OBIS from COHERENT, Santa Clara, CA, USA) was focused with an Olympus refractive objective (100 × NA 0.9), and fluorescence was collected over the range of 450–750 nm. Finally, a 532 nm excitation with a laser diode (100 mW, TEM00, monomode, Coherent, Santa Clara, CA, USA) was focused with the same Olympus refractive objective (100 × NA 0.9), and fluorescence was collected over the range of 550–750 nm. Great care was taken to provide spectrally corrected fluorescence spectra for each of the three conditions.
2.6. Time-Resolved Fluorescence Micro-Spectroscopy of the Structured Sample
The fluorescence lifetime imaging microscopy (FLIM) analysis was performed with a Picoquant MT200 microscope equipped with two MPD single photon avalanche diodes (SPADs) and a PicoHarp300 timing board for time-correlated single photon counting (TCSPC) operation. The pulsed laser source was a frequency-doubled 6 ps coherent MIRA 900 laser, tuned at 435 nm, with a repetition rate set to 4.75 MHz via an acousto-optic pulse picker. The laser was reflected to a 100 × 1.40NA oil objective (UPLSAPO100XO, Olympus, Tokyo, Japan) by an 80%T/20%R spectrally flat beam splitter, and the fluorescence was collected by the same objective and transmitted by the same beam splitter to the confocal optics and detector after excitation light was rejected by a band-pass filter (HQ510/80 with a 470–550 nm transmitted spectral window, Chroma Technologies, Rockingham, VT, USA). The laser was scanned by means of a piezoelectric stage in a grid pattern of 156 nm steps and 0.6 ms/pixel. The shown FLIM images were calculated using the so-called “FAST-FLIM” algorithm, where for each pixel, the reported lifetime was calculated as the first statistical momentum of the histogram distribution of the single photon arrival times, minus a reference time taken at the onset of the decay curve. Note that the shown FLIM images include both temporal and intensity information of the collected fluorescence, as the color code depicts the FAST-FLIM average arrival times on the one hand and the brightness levels depicts the number of collected events on the other hand. Alternatively, curve fitting with a multi-exponential model was performed on decays with better statistics, corresponding to the binning of pixels of larger regions of interest. In the latter case, tail fitting could be applied thanks to the shortness of the instrumental response function (about 40 ps FWHM).
3. Results and Discussion
3.1. Photoluminescence in Bulk Glass
The absorption spectrum in the range 250–800 nm obtained for the PZnAg-Eu glass is shown in Figure 1. The UV edge is around 270 nm mainly due to silver ions absorption as previously observed for silver ions containing zinc phosphate glass [28]. Additional characteristic absorption bands of Eu3+ ions are observed at 318, 362, 380, 393, 464 and 526 nm assigned to the transition from the ground state 7F0 to excited states 5H3, 5D4, 5G2, 5L6, 5D2 and 5D1, respectively. There is no evidence of Eu2+ formation in the glasses and no absorption band above 300 nm, which could be attributed to surface plasmon resonance or silver cluster species such as (Ag2)+ or (Ag3)2+, for instance.
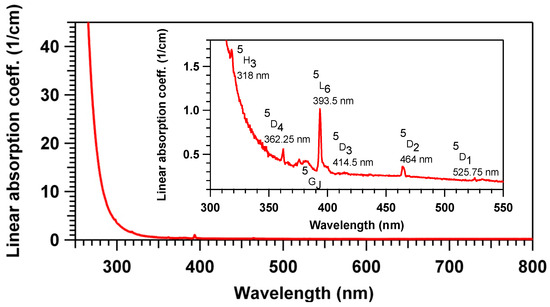
Figure 1.
Linear absorption coefficient of the pristine PZnAg:Eu glass, mostly showing the UV cut-off due to the silver ion insertion below 300 nm, as well as the much weaker and narrow 4f–4f transition lines of the Eu3+ ions (see insert).
Fluorescence spectroscopy have been measured under different UV excitation wavelengths to investigate the emission properties of silver and Eu3+ ions, and the results are shown in Figure 2a. Under 235 nm excitation, two broad emission bands are observed due to two different intrinsic environments of silver with peak emission at 290 (site A) and 380 nm (site B), as well as the characteristics emissions of the 4f–4f transitions of Eu3+: 5D0-7Fj (J = 0–6). The site A emission is assigned to Ag+ ions with the 3DJ→1S0 transition, while site B emission is assigned to (Ag+)2 pairs with the S1, T1→S0 transition [29]. Note that the considered silver ion concentration makes site B largely preponderant compared to site A [2]. Note also that emission spectra of Figure 2a emitted with the present PZnAg:Eu glass are highly similar to that reported for a very close composition of PZnAg (without Europium insertion) in Figure 2 from Petit et al. [2]: this makes us confident that there is no significant existence of broadband Eu2+ emission in the visible range in the present paper in the pristine glass (nor in the laser-induced modifications). With the increase in the excitation wavelength to 260 nm, almost exclusively site B emission as well as the characteristic emission of Eu3+ are observed. Excitation at UV light about 235 nm or 260 nm, promotes the electron to the excited state of both sites A and B, or site B, respectively. Thus, the excited electrons can relax to the ground state radiatively, but also non-radiatively, including relaxation paths involving energy transfers to the neighboring Eu3+ ions. The occurrence of energy transfer from silver sites to Eu3+ ions is favored by the energy level accordance between the excited states of the silver sites with the 5L6 level of Eu3+ ions. Under excitation at 365 nm, only the line-shape characteristics emissions of the Eu3+ transitions at 578, 590, 612, 652, and 702 nm, corresponding to the Eu3+ ions emission 5D0→7FJ (J = 0–4), are observed.
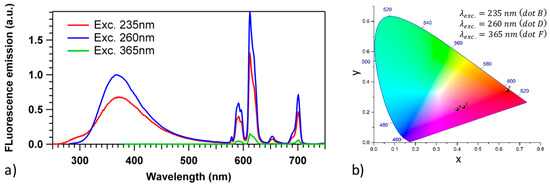
Figure 2.
(a) Fluorescence emission spectroscopy of the pristine PZnAg:Eu sample for three distinct excitation wavelengths, showing two broad emission bands of two distinct environments of the silvers ions, labeled site A (exc. 235 nm and em. 290 nm, lower amplitude) and site B (exc. 260 nm and em. 380 nm, larger amplitude), as well as the emission of the 4f–4f transitions from the 5D0 level of the Eu3+ ions (left). Note that the excitation at 365 nm is selective of the Eu3+ excitation, compared to the excitation of the Ag+ ions. (b) International Commission on Illumination (CIE) chromaticity diagram of the pristine PZnAg:Eu sample for three distinct excitation wavelengths.
Based on the photoluminescence spectra of the glasses presented in Figure 2, the colors of samples under the three distinct excitations at 235, 260, and 365 nm were characterized by International Commission on Illumination (CIE) chromaticity diagram (Figure 2b). The colors shift from purplish pink to red with the increase in excitation wavelength from 235 to 365 nm, which demonstrates that the luminescence color can be systematically tuned by changing the excitation wavelength.
The photoluminescence excitation spectra are shown in Figure 3. By monitoring the emission at 290 nm (site A), a broad excitation band centered at 230 nm is observed, attributed to Ag+ ion. At 340 nm (site B), two overlapping broad excitation bands are observed, centered at 230 and 260 nm, from the Ag+ ion and (Ag+)2 pairs, respectively. When monitoring the Eu3+ emissions at 612 or 700 nm, besides the two broad excitation bands of silver originating from the energy transfer of Ag+ ions and (Ag+)2 pairs energy transfer to the rare earth ions, several characteristic f–f transitions’ sharp lines are observed. Under UV light, Ag+ ions and (Ag+)2 pairs can be excited to the 3Dj and S1 energy levels, respectively, and then the non-radiative S1→S0 and 3DJ→S0 transitions may transfer the excitation energy non-radiatively to Eu3+ ions, with such populated Eu3+ excited levels leading then to the observed typical Eu3+ fluorescent emission. Such non-radiative energy transfer is understood as a non-radiative resonant relaxation from the silver species (donor) to the Eu3+ ions (acceptor), without any electron transfer. Indeed, the overlapping of excitation bands evidences the potential ability of energy transfer from silver ionic species to the Eu3+ ions. Furthermore, no fluorescence emission signature of Eu2+ ions was observed, which corroborates the absence of electron transfer in the present energy transfer.
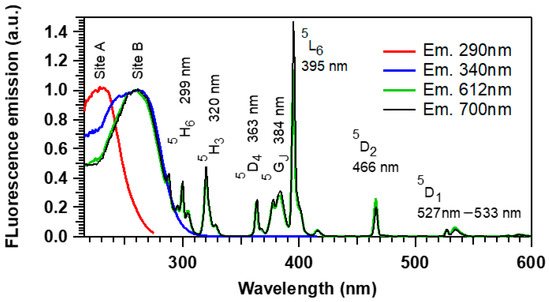
Figure 3.
Fluorescence excitation spectroscopy of the pristine PZnAg:Eu sample for three distinct emission wavelengths, showing two broad excitation bands of two distinct environments of the silvers ions, labeled site A (exc. 235 nm and em. 290 nm) and site B (exc. 260 nm and em. 380 nm), as well as the excitation of the 4f–4f transitions of the Eu3+ ions.
3.2. Direct Laser Writing of Fluorescence Structures
Figure 4a shows a wide-field fluorescence microscopy image of coil patterns obtained by DLW for PZnAg:Eu glass sample motion with controlled speed from 10 to 100 µm/s (corresponding to C, B and A lines), and for different irradiances from 4.0 to 6.7 TW cm−2 (labeled columns 3, 4, 5 and 6). These patterns allow for investigating the influence of the laser parameters in the silver clusters growth and their interaction with the Eu3+ ions. A high-resolution confocal image for excitation 435 nm (obj. 100× NA1.4) is given in Figure 4b, showing the detailed distribution of the fluorescent double-line structure produced by several laser passes. These double lines correspond to the formation of parallel planes containing the silver clusters at the border of the voxel of interaction. This phenomenon has been described in detail elsewhere [4].
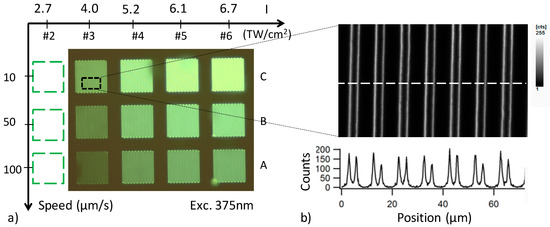
Figure 4.
Laser–matter interaction matrix: (a) wide-field fluorescence microscopy (Objective (obj.) 20× NA0.4, excitation at 375 nm), revealing the laser-induced fluorescence of the 100 × 100 µm2 patterns after DLW; (b) confocal microscopy imaging (oil obj. 100× NA1.4, excitation 435 nm, collection from 470 to 550 nm), zooming in on part of the pattern C3 (10 µm/s, 4 TW/cm2), revealing in detail the fluorescent double-line structure inscribed at each laser pass: insert below, the image shows the 1D horizontal cross-section of the high-resolution image along the dashed line.
Micro-absorptions measurements were performed in transmission mode both in a pristine area of the glass and in structures zones over a 50 × 50 μm2 surface giving a direct experimental access to the local differential micro-absorption due to the laser-induced structures. They are presented in Figure 5a,b for speeds of 10 and 100 µm/s, respectively. These spectra were decomposed by Gaussian contributions. Two contributions are observed around 335 nm (3.7 eV) and around 285 nm (4.35 eV). These two contributions increase in intensity with the irradiance and decrease in intensity with the speed. As can be seen, the relative intensity of these two bands are modulated by the dose deposition indicating that several centers are formed during the DLW process. The strongest dose tends to favor the absorption band around 335 nm (3.7 eV).
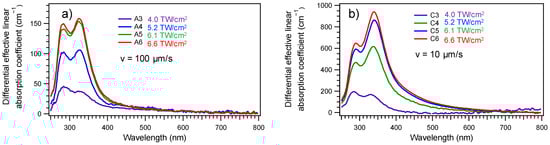
Figure 5.
Micro-absorption spectroscopy of the laser–matter interaction matrix for laser-induced squares, observed with a 50 × 50 μm2 field of view, showing the spatially averaged differential linear absorption coefficient with respect to the pristine glass, revealing the creation and growth of two mains absorption bands (typically centered at 335 (3.7 eV) and 285 nm (4.35 eV), depending on irradiation conditions) with respect to the laser irradiance at constant speed translations of (a) 10 and (b) 100 μm·s−1. Note that the differential effective linear absorption coefficient results from the laser-structured pattern transmission with respect to that of the pristine glass, so that the differential effective linear absorption coefficient corresponds to the additional absorption coefficient resulting from the laser-induced modifications: the differential effective linear absorption coefficient of the pristine glass is thus 0 cm−1 over the full spectrum, by definition.
The micro-emission spectroscopy of laser-induced silver clusters are presented in Figure 6 for two different excitations wavelengths at 325 and 405 nm as a function of the sample motion velocity for 6.75 TW.cm−2 irradiance (Figure 6a,c) and as a function of the irradiance for a fixed sample motion velocity of 10 µm/s (Figure 6b,d).
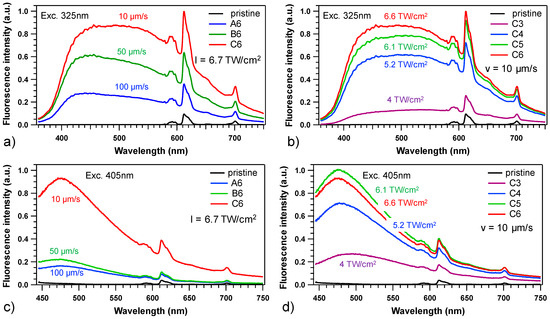
Figure 6.
Micro-emission fluorescence spectroscopy of the laser/matter interaction matrix for some laser-induced squares. Excitation at 325 nm (reflective obj. 36×, NA 0.4): (a) dependence on sample translation velocity (irradiance = 6.7 TW/cm2), and (b) dependence on irradiance (translation velocity = 10 μm/s). Excitation at 405 nm (refractive obj. 100×, NA 0.9): (c) dependence on sample translation velocity (irradiance = 6.7 TW/cm2), and (d) dependence on irradiance (translation velocity = 10 μm/s).
At 325 nm (Figure 6a,b), the emission spectra consist of two major contributions: one broad emission ranging from 400 to 700 nm attributed to silver nanoclusters and sharp emission peaks within the 575 to 715 nm region assigned to Europium ions. The decrease in sample velocity (Figure 6a) and the increase in the irradiance (Figure 6d) corresponding to a rise in the deposited dose promote the increase in the broad emission band intensity assigned to the formation of Agmn+ species and also promote the emission of the europium ions. The most intense emission of Eu3+ around 612 nm is attributed to the hypersensitive electric dipole transition (5D0→7F2). This emission is strongly influenced by the chemical environment of the Eu3+ ions in the host network. On the other hand, the 5D0→7F1 transition occurs via the magnetic dipole mechanism and its intensity is not sensitive to the chemical environment of Eu3+ ions. Therefore, the emission intensity ratio of these two transitions can be used to highlight a site evolution of the rare earth ion. In the present case, one can notice that the spectral shape of the 4f–4f transition remains constant and the intensity ratio between the 5D0→7F2 and 5D0→7F1 also remains at a constant value of 4.1 ± 0.1. Thus, an absence of major modification of the chemical environment at the vicinity of the Eu3+ after DLW can be assumed.
Micro-fluorescence emission spectra demonstrate interesting behavior in terms of display and colorimetry. Indeed, the fluorescence emission analysis under UV excitation at 325 nm and associated projection in the XYZ tri-chromatic coordinates in the CIE chromaticity diagram shows that the chromatic coordinates can be continuously controlled in 3D by means of laser irradiation, namely from red (almost pristine glass with quasi-null action of the laser inscription) to white light emission, as shown in Figure 7. In the case of the largest irradiances (I = 6.7 TW/cm2 for patterns A6, B6 and C6 depicted in Figure 7a), the trichromatic coordinates get very localized in the white emission domain whatever the three used velocities suggesting that the broadband silver cluster emission dominates the reddish contribution of Eu3+ ions in the resulting tri-chromatic behavior. Similarly, in the case of the lowest velocity v = 10 µm/s (namely, the largest number of cumulated pulses with patterns C3 to C6 depicted in Figure 7c), the deposited dose is also high enough to produce enough efficient fluorescent silver clusters to overcome the Eu3+ emission and dominate the resulting tri-chromatic behavior. However, a larger velocity of 50 µm/s tends to limit the amount of silver clusters and its fluorescence emission amplitude, locally allowing for controlling the tri-chromatic coordinates between the initial red coordinates of the pristine glass and the white light emission of the silver clusters, as shown between points B2 and B3 in Figure 7b. Such measurements result from micro-luminescence in confocal microscopy, so that they are measured at the silver cluster positions. By adjusting the probed volume of the material on the one hand, and by fixing the filling rate of silver cluster (typically with the inter-distance between successive laser passes in a given plane, or by producing thick multi-plane patterns) on the other, one can fully control the continuous evolution of the measured tri-chromatic coordinate between red to white emission. This thus suggests the ability to perform the localized 3D inscription of emitting areas with tunable tri-chromatic coordinates, which goes beyond the spatially homogeneous control of the tri-chromatic coordinates means of selecting different fluorescence excitation wavelengths, as shown in Figure 2b (from the pristine Eu3+-based red emission to a pinkish emission resulting from the red Eu3+ ion emission and the blue Ag+ ion emission in the pristine glass). Laser inscription thus allows an additional experimental parameter to tune the 3D localized tri-chromatic coordinates.
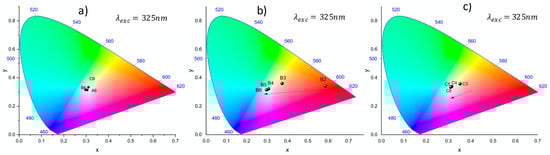
Figure 7.
CIE chromaticity diagram of the laser/matter interaction matrix for some laser-induced squares with excitation at 325 nm. (a) Sample velocity dependence for the highest laser irradiance of 6.7 TW/cm2; (b) laser irradiance dependence for the intermediate sample velocity of 50 µm/s; and (c) laser irradiance dependence for the lowest sample velocity of 10 µm/s.
To further investigate the energy transfer from silver clusters to Eu3+ ions, time-resolved spectroscopy of silver nanocluster emission was obtained for the PZnAg and PZnAg:Eu glasses, for a collection over the 470–550 nm spectral range and using a pulsed excitation (6 ps, 4.75 MHz) at 435 nm. The collected fluorescence predominantly corresponds to that of silver clusters, because Eu3+ ions show no emission in this spectral range and because Ag+ ions of the glass matrix show negligible fluorescence excitation. In these conditions, Figure 8a,b show the FAST-FLIM images for the laser inscribed patterns, where the color code and the brightness depict the pixel-to-pixel FAST-FLIM average lifetime and the associated fluorescence intensity, respectively. For both the PZnAg and PZnAg:Eu glasses, the FAST-FLIM images corroborate the double-line spatial distribution of laser-induced fluorescent silver clusters, as shown in Figure 4. The intensity weighted FAST-FLIM lifetime histograms were extracted from Figure 8a,b, and are reported in Figure 8c. These histograms clearly show the mean lifetime shortening of the silver cluster excited states in the presence of Eu3+ ions, with a typical peak value of the histograms occurring at a shorter lifetime of 1.94 ns for the PZnAg:Eu glass, compared to the 2.44 ns lifetime for the PZnAg glass. This supports the hypothesis of a quenching by energy transfer from these clusters to the neighboring Eu3+ ions which directly affects the emission rate of the cluster emission. Figure 8c also reveals a lower emission intensity of silver clusters in the presence of Eu3+ ions, such partial emission quenching being also consistent with nonradiative energy transfer by resonant energy transfer from silver clusters to Eu3+ ions. By properly taking into account the normalization with the incident pump intensity at 435 nm for both histograms of Figure 8c, the corresponding time-integrated intensity of both PZnAg and PZnAg:Eu glasses led to the intensity quenching of the silver cluster emission. Note that such global intensity quenching includes any sources of quenching, namely the energy transfers at play towards the Eu3+ ions but also other possible phenomena whose contributions will be discussed below.
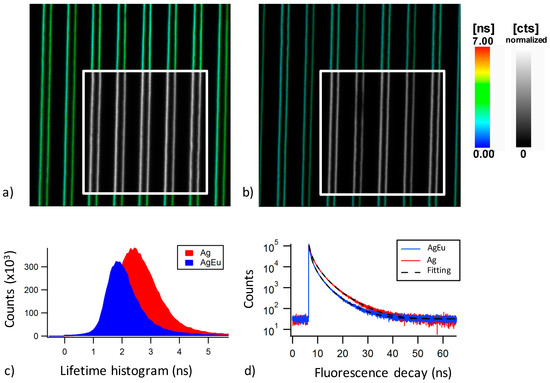
Figure 8.
(a) Composite image of the laser-induced pattern C3 (10 µm/s, 4 TW/cm2) in the PZnAg glass depicting a color image of the laser that provides the pixel-by-pixel mean lifetime retrieved by FAST-FLIM algorithm (see color bar from 0 to 7 ns), as well as a grey-scale inset image (see color bar from 0 to 255 counts) that provides the fluorescence intensity; (b) same composite image FLIM and fluorescence intensity for the PZnAg:Eu glass; (c) intensity-weighted lifetime histograms for the PZnAg and PZnAg:Eu glasses obtained from the FLIM images depicted in Figure 8a,b, respectively; and (d) normalized fluorescence decays of both the PZnAg and PZnAg:Eu glasses and their ideal respective fittings with a four independent exponential decay model. All data were obtained with a 435 nm pulse excitation of 6 ps at 4.75 MHz, and a collection over the 470–550 nm range.
As the fluorescence emission of the silver clusters corresponds to a broadband multi-band emission that covers the whole visible range and depends on laser irradiation parameters, the fluorescence lifetime was also evaluated with a multiple exponential decay model in the sub-ns and ns range. As detailed in the experimental section, curve fitting with a multi-exponential decay model was performed on decays with better statistics, corresponding to the binning of pixels of larger regions of interest. As shown in Figure 8d, optimal time decay fitting was achieved with a four-exponential model with the adjusted amplitudes and time constants being reported in the Table 1. Such non-usual fitting appeared to be necessary, and sufficient, to correctly fit the experimental decay with respect to standard acceptable statistical parameters. However, it is not attempted thereby to attribute each component to a precise population of emitters. This fitting is exclusively used to determine the average decay time, taking into account the statistical characteristics of single photon counting. The addition of components would not be meaningful, leading to covariance of the fitting parameters. Other models were not taken into consideration, since the estimation of an average value was sufficient in the context of this study, in order to characterize energy transfer efficiency. Still, the used model demonstrates that the complexity of lifetime decay of the system under investigation requires at least four typical decay times, but reality may be even more complex with additional, much shorter decay times.

Table 1.
Fitting parameters with a four-exponential decay time model.
Based on the fitting results from the table, the intensity-weighted average emission lifetime is of = 2.44 ns for the PZnAg glass, and it decreases down to 1.94 ns in the Eu3+-containing glass, in agreement with the lifetimes denoted by the peak positions of the histograms of Figure 8c. This result corroborates the occurrence of energy transfer from Agmn+ species levels to Eu3+ ions. According to the expected lifetime of europium Eu3+ in such glass, which is expected to be around a millisecond for the most intense emission around 612 nm, the collected decay measurement strictly corresponds to the silver cluster contribution.
To go further in the interpretation of energy transfers, based on the fitting results from Figure 8d and summarized in the table, the amplitude-weighted average emission lifetime was also estimated, leading to = 1.34 ns and to = 0.98 ns for the PZ:Ag and PZnAg:Eu glasses, respectively. The amplitude-weighted quenching rate of the emitting silver clusters can be estimated as . The comparison of the amplitude-weighted quenching rate with the intensity quenching rate helps in sorting the contributions of the emission quenching of the silver clusters. Indeed, the ratio indicates that 66% of the emission quenching of the silver clusters in presence of Eu3+ ions is actually due to energy transfer. In addition, the estimation indicates that 33% of the emission quenching of the silver clusters in the presence of Eu3+ ions stands for a lower concentrations of silver emitters, affecting the fluorescence intensities but not the lifetimes. This can reasonably be interpreted by a slightly lower efficiency of silver cluster production during the femtosecond laser writing process. Indeed, in the laser inscription stage, we observed that Eu3+ ions undergo multi-photon absorption and subsequent reddish fluorescence emission, which partially reduces the effective femtosecond laser intensity and thus completes the activation of the silver photochemistry and the associated creation and growth of silver clusters.
Regarding the europium emission intensity, the 612 nm Eu3+ emission increases up to 5-fold and to 3.5-fold for excitations at 325 and 405 nm, respectively (Figure 9a,b), indicating an energy transfer from silver species to Eu3+ ions [19,25,27]. The Eu3+ emission enhancement is clearly dependent on the excitation wavelength, as a larger efficiency is observed for an excitation at 325 nm. Such wavelength excitation dependence may be directly interpreted from Figure 5, with a more efficient excitation of silver clusters at 325 nm compared to 405 nm, leading thus to a more intense fluorescence emission and consequently to a larger amount of excited silver clusters compatible with resonant non-radiative energy transfers to Eu3+ ions. Still, the existence of various populations of distinct silver clusters created during DLW has been reported [13], showing a partially selective excitation with radiations at 325 or 405 nm which may also play a selective role in the observed energy transfer. Indeed, these distinct types of silver clusters may show distinct energy transfer efficiencies to the Eu3+ ions. The present spectroscopy cannot directly identify the nuclearities and associated stabilized redox charges of these silver species, nor their respective populations [13].
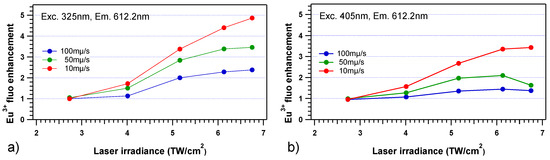
Figure 9.
Normalized amplitude of the micro-emission of the Eu3+ fluorescence with respect to the pristine glass at 612.2nm, (a) for a 325 nm excitation and (b) for a 405 nm excitation, respectively showing up to 5-fold and 3.5-fold emission enhancements.
According to the singlet-triplet energy level model of Agmn+ species proposed by Velazquez et al. [29] and to the results obtained from the photoluminescent excitation and emission spectra of the Eu3+ and Agmn+ species in the co-doped glass before and after laser–matter interaction, the energy transfer pathway was tentatively described in Figure 10. Under UV-visible light, Ag+ ions and Agmn+ species can be excited to the S1 and T2 energy levels, and then the S1→S0 and T2→S0 transitions may transfer the excitation energy to Eu3+ by relaxations, thus populating the 5H3 level and by non-radiatively relaxing from the 5D4 and 5L6 levels down to the 5D0 energy level. The subsequent radiative transitions from the 5D0 energy upper level leads to the visible Eu3+ emissions observed in Figure 2 and Figure 6. In addition, it is worth mentioning that the spin-forbidden transition of T2→S0 with relatively longer lifetime may mainly contribute to the above energy transfer processes. Still, at this level of description, the present spectroscopy cannot directly identify the mechanisms at play during the non-radiative resonant energy transfers; namely, one cannot directly discriminate between Dexter resonant energy transfers (DET) related to electron exchange operating at a very short scale (requirement of the wave function overlap) and Förster resonant energy transfers (FRET) related to dipole–dipole interactions spanning longer scales up to several nanometers typically (but highly sensitive to the solicited oscillation strength, which is known to be rather weak for the lanthanide ions) [30]. A balance between DET and FRET, both occurring simultaneously, may even exist. Such discrimination in the origin of the involved resonant energy transfer could further be addressed thanks to a set of glasses with various rare earth doping concentrations, which is beyond the scope of the present article.
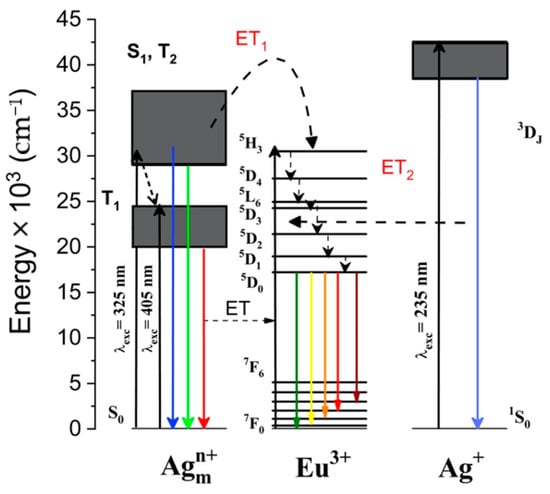
Figure 10.
Energy level diagram showing schematically the possible energy transfer processes from Agmn+ to Eu3+ (energy transfer labelled ET1), and from Ag+ to Eu3+(energy transfer labelled ET2), upon excitation in the ultraviolet or visible range, leading to silver species emissions but also the indirect excitation of Eu3+ and its emission in the visible.
Following the laser–matter interaction, a subsequent heat treatment performed at 400 °C (Tg +20 °C) for 30 min in the glass revealed the crystallization of plasmonic silver nanoparticles. Such plasmonic structure precipitation will not be described in detail in the present paper, as they were investigated earlier by Marquestaut et al. [13]. These plasmonic structures led to a quenching of the energy transfer between Ag species and Eu3+ ions, so that the enhancement of the Eu3+ emission was mostly cancelled after thermal treatment, as shown in Figure 11 for an excitation at 325 nm. Indeed, the Eu3+ emission enhancement ratio drops from 2.5- to 5-fold down to 1.2- to 1.8-fold (with an enhancement drop from 5-fold down to 1.2-fold for the highest laser-deposited dose from pattern C6). The precipitation of silver nanoparticles decreases the active population of silver clusters that can be excited and further transfer energy to Eu3+ ions, thus reducing the energy transfer ability. Additionally, such silver nanoparticles can also contribute to quenching the fluorescence emission of the remaining silver clusters, further reducing the probability of energy transfer to Eu3+ ions.
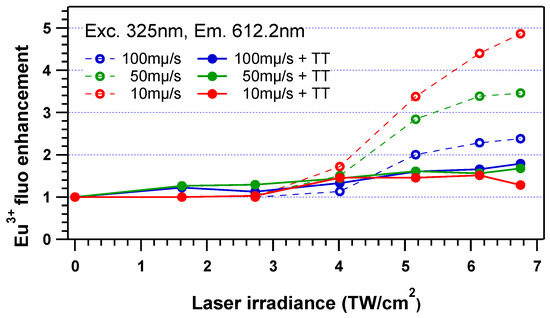
Figure 11.
Normalized amplitude of the micro-emission of the Eu3+ fluorescence with respect to the pristine glass at 612.2 nm, for a 325 nm excitation before (dashed line, empty dots) and after thermal heat treatment (TT) at 400 °C (Tg +20 °C) for 30 min, showing both the decrease in the Eu3+ fluorescence enhancement for high enough deposited laser doses (partial growth and subsequent destruction of populations of initially large silver clusters and correlative growth of metallic plasmonic silver NPs) also well as the minor but non-zero increase in the Eu3+ fluorescence enhancement for lower deposited laser doses (partial growth from laser-induced defects or from populations of initially small silver clusters towards larger silver clusters that show a better resonant energy transfer toward Eu3+ electronic levels.
4. Conclusions
Femtosecond laser inscription was achieved in a Eu3+-doped silver-containing zinc phosphate glass, demonstrating that the insertion of rare earth ions does not inhibit the photo-activation of silver chemistry. By means of micro-spectroscopy of fluorescence emission, tri-chromatic coordinates in the CIE chromaticity diagram were estimated, showing that such coordinates can be continuously controlled from the red light aspect dominated by the Eu3+ emission towards the white light aspect dominated by the silver cluster emission. This demonstrated the ability to perform a 3D-localized controlled modification of the local tri-coordinates thanks to the laser irradiation parameters. Compared to the pristine, Eu3+ emission in the structured region showed an increase up to 5-fold and to 3.5-fold for excitations at 325 and 405 nm, respectively. Such an enhancement is co-localized with the fluorescent laser-inscribed silver clusters, which suggests a resonant non-radiative energy transfer from excited silver clusters to Eu3+, thus allowing the fluorescence of the rare earth ion. FAST-FLIM imaging demonstrated the efficient resonant energy transfer from the silver clusters and to Eu3+ ions. The precipitation of metallic silver plasmonic nanoparticles in the silver cluster location, obtained following heat treatment above glass transition temperature, removes the enhancement of the Eu3+ emission. Femtosecond laser inscription in rare earth doped silver-containing glasses clearly demonstrates the effect of the silver cluster on the enhancement of europium ions and allows for writing 3D localized intense tunable emission patterns from red to white for a broad excitation spectrum in inorganic materials. This approach could be extended to other rare earth doped photosensitive glasses, including photo-thermo-refractive glasses [31], to promote 3D high-contrast luminescent patterns in various spectral ranges.
Author Contributions
Conceptualization, Y.P., L.C. and T.C.; methodology, Y.P., G.G., G.R., A.D.G., L.C. and T.C.; validation, Y.P., G.R., A.D.G., T.C.; formal analysis, Y.P., G.G., G.R., A.D.G., A.S.S.d.C., and T.C.; investigation, Y.P., G.G., G.R., J.-C.D., L.C. and T.C.; resources, Y.P., G.R., A.D.G., V.J., L.C. and T.C.; data curation, Y.P., G.G., G.R., J.-C.D., A.D.G., and T.C.; writing—original draft preparation, Y.P., G.G., and T.C.; writing—review and editing, Y.P., G.G., G.R., A.D.G., A.S.S.d.C., L.C. and T.C.; supervision, Y.P. and T.C.; project administration, Y.P. and T.C.; funding acquisition, Y.P., V.J., A.D.G., A.S.S.d.C., L.C. and T.C. All authors have read and agreed to the published version of the manuscript.
Funding
The project leading to this application has received funding from the European Union’s Horizon 2020 research and innovation program under the Marie Skłodowska-Curie grant agreement No 823941, as well as with financial support from French National Research Agency (ANR) in the frame of “the investments for the future” Programme IdEx Bordeaux—LAPHIA (ANR-10-IDEX-03-02) and ANR-19-CE08-0021-01, and from Région Nouvelle Aquitaine (project AAPR2020-2019-8193110).
Institutional Review Board Statement
Not applicable.
Informed Consent Statement
Not applicable.
Data Availability Statement
Not applicable.
Acknowledgments
G.R. and A.D.G. thank the University of Bordeaux, the Centre National de Recherche Scientifique (CNRS) and Région Nouvelle Aquitaine for financial support. A.S.S.d.C. and G.G. would like to acknowledge Fundação de Amparo à Pesquisa do Estado de São Paulo (FAPESP) for the CEPID research grant (2013/07793-6). G.G. is specially thankful to FAPESP for the postdoctoral fellowship (2018/03931-9).
Conflicts of Interest
The authors declare no conflict of interest.
References
- Gross, S.; Withford, M.J. Ultrafast-laser-inscribed 3D integrated photonics: Challenges and emerging applications. Nanophotonics 2015, 4, 332–352. [Google Scholar] [CrossRef]
- Petit, Y.; Danto, S.; Guérineau, T.; Khalil, A.A.; Le Camus, A.; Fargin, E.; Duchateau, G.; Bérubé, J.-P.; Vallée, R.; Messaddeq, Y.; et al. On the femtosecond laser-induced photochemistry in silver-containing oxide glasses: Mechanisms, related optical and physico-chemical properties, and technological applications. Adv. Opt. Technol. 2018, 7, 291–309. [Google Scholar] [CrossRef]
- Royon, A.; Petit, Y.; Papon, G.; Richardson, M.; Canioni, L. Femtosecond laser induced photochemistry in materials tailored with photosensitive agents [Invited]. Opt. Mater. Express 2011, 1, 866–882. [Google Scholar] [CrossRef]
- Bellec, M.; Royon, A.; Bourhis, K.; Choi, J.; Bousquet, B.; Treguer-Delapierre, M.; Cardinal, T.; Videau, J.-J.; Richardson, M.; Canioni, L. 3D Patterning at the Nanoscale of Fluorescent Emitters in Glass. J. Phys. Chem. C 2010, 114, 15584–15588. [Google Scholar] [CrossRef]
- Royon, A.; Bourhis, K.; Bellec, M.; Papon, G.; Bousquet, B.; Deshayes, Y.; Cardinal, T.; Canioni, L. Silver Clusters Embedded in Glass as a Perennial High Capacity Optical Recording Medium. Adv. Mater. 2010, 22, 5282–5286. [Google Scholar] [CrossRef] [PubMed]
- Canioni, L.; Bellec, M.; Royon, A.; Bousquet, B.; Cardinal, T. Three-dimensional optical data storage using third-harmonic generation in silver zinc phosphate glass. Opt. Lett. 2008, 33, 360–362. [Google Scholar] [CrossRef] [PubMed]
- Park, C.-H.; Petit, Y.; Canioni, L.; Park, S.-H. Five-Dimensional Optical Data Storage Based on Ellipse Orientation and Fluorescence Intensity in a Silver-Sensitized Commercial Glass. Micromachines 2020, 11, 1026. [Google Scholar] [CrossRef]
- Papon, G.; Petit, Y.; Marquestaut, N.; Royon, A.; Dussauze, M.; Rodriguez, V.; Cardinal, T.; Canioni, L. Fluorescence and second-harmonic generation correlative microscopy to probe space charge separation and silver cluster stabilization during direct laser writing in a tailored silver-containing glass. Opt. Mater. Express 2013, 3, 1855–1861. [Google Scholar] [CrossRef]
- Papon, G.; Marquestaut, N.; Petit, Y.; Royon, A.; Dussauze, M.; Rodriguez, V.; Cardinal, T.; Canioni, L. Femtosecond single-beam direct laser poling of stable and efficient second-order nonlinear optical properties in glass. J. Appl. Phys. 2014, 115, 113103. [Google Scholar] [CrossRef]
- Mishchik, K.; Petit, Y.; Brasselet, E.; Royon, A.; Cardinal, T.; Canioni, L. Patterning linear and nonlinear optical properties of photosensitive glasses by femtosecond structured light. Opt. Lett. 2015, 40, 201–204. [Google Scholar] [CrossRef]
- Smetanina, E.; Chimier, B.; Petit, Y.; Varkentina, N.; Hirsch, L.; Fargin, E.; Cardinal, T.; Canioni, L.; Duchateau, G. Modeling of Ring-Shaped Nanostructures Formation in Metal-Doped Oxide Glasses by Femtosecond Lasers. Phys. Rev. A 2016, 93, 013846. [Google Scholar] [CrossRef]
- Abou Khalil, A.; Bérubé, J.-P.; Danto, S.; Cardinal, T.; Petit, Y.; Canioni, L.; Vallée, R. Comparative study between the novel type A and the standard Type I refractive index change created by direct laser writing in silver containing glasses. Opt. Mater. Express 2019, 9, 2640–2651. [Google Scholar] [CrossRef]
- Marquestaut, N.; Petit, Y.; Royon, A.; Mounaix, P.; Cardinal, T.; Canioni, L. Three-Dimensional Silver Nanoparticle Formation Using Femtosecond Laser Irradiation in Phosphate Glasses: Analogy with Photography. Adv. Funct. Mater. 2014, 24, 5824–5832. [Google Scholar] [CrossRef]
- Petit, Y.; Mishchik, K.; Varkentina, N.; Marquestaut, N.; Royon, A.; Manek-Hönninger, I.; Cardinal, T.; Canioni, L. Dual-color control and inhibition of direct laser writing in silver-containing phosphate glasses. Opt. Lett. 2015, 40, 4134–4137. [Google Scholar] [CrossRef]
- Ma, R.; Gao, J.; Xu, Q.; Cui, S.; Qiao, X.; Du, J.; Fan, X. Eu2+ promoted formation of molecule-like Ag and enhanced white luminescence of Ag/Eu-codoped oxyfluoride glasses. J. Non-Cryst. Solids 2016, 432, 348–353. [Google Scholar] [CrossRef]
- Guo, Z.; Ye, S.; Liu, T.; Li, S.; Wang, D. SmF3 doping and heat treatment manipulated Ag species evaluation and efficient energy transfer from Ag nanoclusters to Sm3+ ions in oxyfluoride glass. J. Non-Cryst. Solids 2017, 458, 80–85. [Google Scholar] [CrossRef]
- Shi, Y.; Ye, S.; Yu, J.; Liao, H.; Liu, J.; Wang, D. Simultaneous energy transfer from molecular-like silver nanoclusters to Sm3+/Ln3+ (Ln = Eu or Tb) in glass under UV excitation. Opt. Express 2019, 27, 38159. [Google Scholar] [CrossRef]
- Malta, O.; Santa-Cruz, P.; De Sá, G.; Auzel, F. Fluorescence enhancement induced by the presence of small silver particles in Eu3+ doped materials. J. Lumin. 1985, 33, 261–272. [Google Scholar] [CrossRef]
- Liao, H.; Ye, S.; Shen, R.; Li, X.; Wang, D. Effective formation of Ag nanoclusters and efficient energy transfer to Yb3+ ions in borosilicate glasses for photovoltaic application. Mater. Res. Bull. 2019, 111, 113–117. [Google Scholar] [CrossRef]
- Lin, H.; Chen, D.; Yu, Y.; Zhang, R.; Wang, Y. Molecular-like Ag clusters sensitized near-infrared down-conversion luminescence in oxyfluoride glasses for broadband spectral modification. Appl. Phys. Lett. 2013, 103, 091902. [Google Scholar] [CrossRef]
- Shi, Y.; Ye, S.; Liao, H.; Liu, J.; Wang, D. Formation of luminescent silver-clusters and efficient energy transfer to Eu3+ in faujasite NaX zeolite. J. Solid State Chem. 2020, 285, 121227. [Google Scholar] [CrossRef]
- Zhao, J.; Yang, Z.; Yu, C.; Qiu, J.; Song, Z. Preparation of ultra-small molecule-like Ag nano-clusters in silicate glass based on ion-exchange process: Energy transfer investigation from molecule-like Ag nano-clusters to Eu3+ ions. Chem. Eng. J. 2018, 341, 175–186. [Google Scholar] [CrossRef]
- Ghafoor, M.; Sgibnev, Y.; Nikonorov, N.; Marasanov, D. Energy transfer between silver clusters and europium Eu3+ ions in photo-thermo-refractive glasses. In Proceedings of the Third International Conference on Applications of Optics and Photonics, Faro, Portugal, 8–12 May 2017. [Google Scholar]
- Vijayakumar, R.; Marimuthu, K. Luminescence studies on Ag nanoparticles embedded Eu3+-doped boro-phosphate glasses. J. Alloys Compd. 2016, 665, 294–303. [Google Scholar] [CrossRef]
- Wei, R.; Li, J.; Gao, J.; Guo, H. Enhancement of Eu3+ Luminescence by Ag Species (Ag NPs, ML-Ag, Ag+) in Oxyfluoride Glasses. J. Am. Ceram. Soc. 2012, 95, 3380–3382. [Google Scholar] [CrossRef]
- Guo, H.; Wang, X.; Chen, J.; Li, F. Ultraviolet light induced white light emission in Ag and Eu3+ co-doped oxyfluoride glasses. Opt. Express 2010, 18, 18900–18905. [Google Scholar] [CrossRef]
- Jiao, Q.; Wang, X.; Qiu, J.; Zhou, D. Effect of silver ions and clusters on the luminescence properties of Eu-doped borate glasses. Mater. Res. Bull. 2015, 72, 264–268. [Google Scholar] [CrossRef]
- Maurel, C.; Cardinal, T.; Bellec, M.; Canioni, L.; Bousquet, B.; Tréguer, M.; Videau, J.; Choi, J.; Richardson, M. Luminescence properties of silver zinc phosphate glasses following different irradiations. J. Lumin. 2009, 129, 1514–1518. [Google Scholar] [CrossRef]
- Velázquez, J.J.; Tikhomirov, V.K.; Chibotaru, L.F.; Cuong, N.T.; Kuznetsov, A.S.; Rodríguez, V.D.; Nguyen, M.T.; Moshchalkov, V.V. Energy level diagram and kinetics of luminescence of Ag nanoclusters dispersed in a glass host. Opt. Express 2012, 20, 13582–13591. [Google Scholar] [CrossRef]
- Medintz, I.; Hildebrandt, N. FRET—Förster Resonance Energy Transfer; Wiley-VCH Verlag GmbH & Co. KGaA: Weinheim, Germany, 2014. [Google Scholar]
- Marasanov, D.V.; Mironov, L.Y.; Sgibnev, Y.M.; Kolesnikov, I.E.; Nikonorov, N.V. Luminescence and energy transfer mechanisms in photo-thermo-refractive glasses co-doped with silver molecular clusters and Eu3+. Phys. Chem. Chem. Phys. 2020, 22, 23342–23350. [Google Scholar] [CrossRef]
Publisher’s Note: MDPI stays neutral with regard to jurisdictional claims in published maps and institutional affiliations. |
© 2021 by the authors. Licensee MDPI, Basel, Switzerland. This article is an open access article distributed under the terms and conditions of the Creative Commons Attribution (CC BY) license (http://creativecommons.org/licenses/by/4.0/).