Abstract
A three-dimensional finite element method (3D FEM) simulation was carried out using ABAQUS/Explicit software to simulate multi-pass processing by equal-channel angular pressing (ECAP) of a circular cross-sectional workpiece of a Cu-Zr alloy. The effective plastic strain distribution, the strain homogeneity and the occurrence of a steady-state zone in the workpiece were investigated during ECAP processing for up to eight passes. The simulation results show that a strain inhomogeneity was developed in ECAP after one pass due to the formation of a corner gap in the outer corner of the die. The calculations show that the average effective plastic strain and the degree of homogeneity both increase with the number of ECAP passes. Based on the coefficient of variance, a steady-state zone was identified in the middle section of the ECAP workpiece, and this was numerically evaluated as extending over a length of approximately 40 mm along the longitudinal axis for the Cu-Zr alloy.
1. Introduction
The fabrication of bulk ultrafine-grained (UFG) materials has been widely investigated over the last two decades due to the potential to produce metals with superior mechanical and physical properties. Several techniques are available for fabricating these materials, but major emphasis has been placed on the use of equal-channel angular pressing (ECAP), in which a sample is pressed through a die constrained within an internal channel that is bent through a sharp angle [1]. In this procedure, a shear strain is introduced as the sample passes through the bend in the channel, and this is a very effective severe plastic deformation (SPD) processing method for producing bulk UFG materials for use in engineering applications. In ECAP processing, the cross-section of the sample remains unchanged so that the pressing may be repeated for multiple passes in order to achieve the required strain level.
The equivalent plastic strain, ε, introduced in a single pass through the die is given by a relationship of the form [2]:
where Φ is the angle subtended by the two parts of the channel, and Ψ is the outer arc of curvature at the point of intersection of the two channels. The relationship in Equation (1) is therefore only a function of the die geometry, and it provides a very useful and simple procedure for estimating the average strain introduced during ECAP processing. Nevertheless, an understanding of the local strain distribution during ECAP processing is also important since the strain imposed during processing relates directly to the internal microstructure, and, ultimately, it characterizes the overall material properties.
The finite element method (FEM) is a powerful tool that can be used to understand the deformation behavior of a material during the ECAP process. Earlier works on FEM simulations of the ECAP process were carried out by using two-dimensional (2D) simulations [3,4,5,6,7,8,9]. In these 2D finite element models, plane strain conditions were generally assumed in order to calculate the effects of the die geometries, the processing conditions and the material properties on the deformation behavior and the inhomogeneity of the materials. However, 2D simulation is used for a billet with a square cross-section, and it is not generally applicable to the round cross-sectional workpieces that are used in ECAP when employing a solid die [10,11,12]. Recently, three-dimensional (3D) FEM simulations were effectively performed in an analysis of deformation behavior during the first pass of the ECAP process [10,11,13,14,15]. Nevertheless, there are only limited reports related to multi-pass ECAP processing using 3D FEM for circular cross-sectional workpieces, and all of these reports are directed at the deformation of aluminum and aluminum alloys [16,17,18].
Because of this deficiency, the present investigation was initiated in order to use a 3D FEM simulation to investigate the deformation behavior and homogeneity evolution of the multi-pass ECAP processing, up to eight passes, of a copper alloy of Cu-0.1 wt.% Zr with billets with circular cross-sections.
2. The Principles of Finite Element Simulations
The commercial software Abaqus/Explicit version 2016 [19] was used to simulate the multi-pass ECAP processing of the Cu-0.1 wt.% Zr alloy. The workpiece and the die geometry were modeled according to descriptions in earlier experiments conducted at University of Southern California (USC), USA [20,21]. Specifically, the workpiece was in the form of a cylindrical billet with a diameter of 10 mm and a length of 70 mm, and it was processed using a rigid solid die with a channel angle (Φ) of 110° and an outer corner angle (Ψ) of 20°. These angles were therefore used in the simulation.
Figure 1a shows a schematic representation of an ECAP assembly. For convenience in discussion, a local coordinate system was set as x, y and z axes. The plane normal to the x, y and z axes are henceforth designated the X-plane, Y-plane and Z-plane, respectively. Four points (1–4) were marked on the cross-section of the mid-length of the billet, and these points were used to monitor the accumulated equivalent strain during the ECAP processing as shown in Figure 1b. Consecutive passes of the ECAP processing were modeled using an interconnected multi-channel die corresponding to the equivalent of processing route BC, in which the billet is rotated by 90° around the longitudinal axis in the same sense between each pass [22] up to a total of 8 passes as illustrated in Figure 1c.
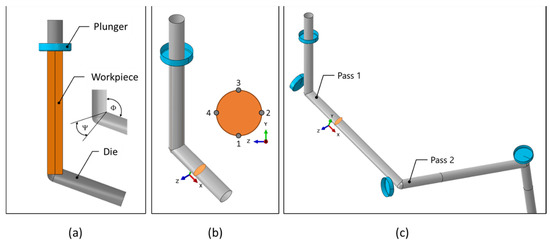
Figure 1.
Schematic illustration of the ECAP process: (a) an ECAP assembly, (b) four points marked on the mid-length of the billet and (c) an interconnected multi-channel die.
In the simulation, the overall behavior of the billet is taken as an elastic–plastic material. This model can describe the deformation behaviour of a material under severe plastic deformation during ECAP processing. To determine the material properties, the Cu-0.1 wt.% Zr billet was annealed as in earlier experimental work [20,21], and then the tensile testing was conducted. The stress–strain curve and the material properties used for the analysis are shown in Figure 2 and Table 1, respectively. The flow stress curve of the present material was determined until the maximum strain of 0.4 and the strain-hardening exponent was 0.68. However, during the ECAP process, the cumulative strain is expected to increase continuously with the number of passes. To numerically evaluate the cumulative strain beyond the limit of the flow stress curve, the flow stress is linear extrapolated from the end of the curve using a tangent line with a strain-hardening exponent of 0.68. The billet material was modeled with C3D8R (eight-node linear brick element). The die and punch were modeled as a rigid surface, and all simulations were performed with a pressing speed of 3 mm/s. The value of the friction coefficient between the die and the billet was assumed to be 0.1; this value is recommended when processing using MoS2. An arbitrary Lagrangian–Eulerian (ALE) adaptive remeshing and mass scaling was used for all simulations to prevent failure of the mesh due to large deformation and also to reduce the total computation time.
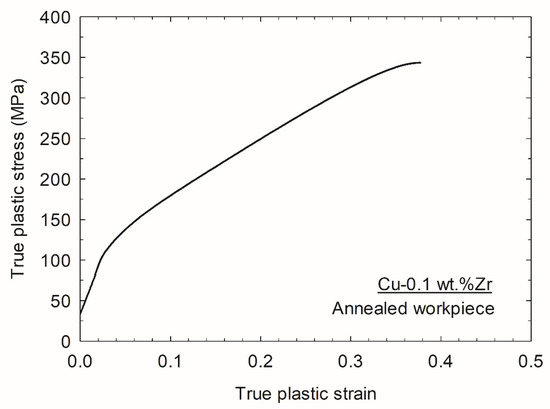
Figure 2.
Experimental true plastic stress–strain curve for the Cu-0.1% Zr alloy.

Table 1.
Material properties of an annealed specimen of Cu-0.1 wt.% Zr.
Before performing the simulation, a convergence test was carried out to assess the mesh sensitivity. Seven different numbers of elements, namely 1056, 1280, 1408, 2200, 3420, 5092 and 7680, were used to calculate the total strain energy. The relationship between the total strain energy and the numbers of elements was then plotted as shown in Figure 3. Based on the result in Figure 3, a mesh consisting of 2200 elements, with element sizes of 0.2–2.0 mm, was chosen in all simulations.
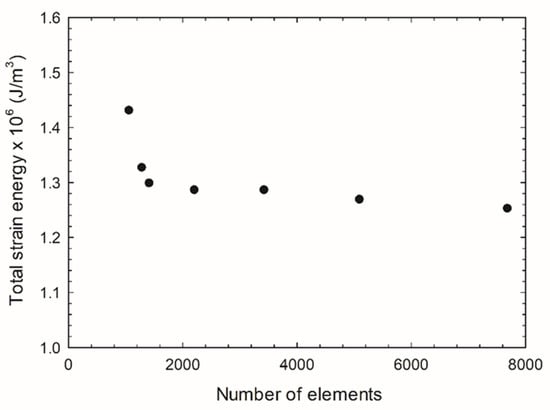
Figure 3.
Convergence test for different numbers of elements.
3. Results and Discussion
3.1. Equivalent Plastic Strain
The equivalent plastic strain during the pressing stroke was monitored through the four points located at the cross-sections of the mid-length of the workpiece as illustrated in Figure 1b. Figure 4 shows the variation in the equivalent plastic strain tracing through points 1 to 4 located on the cross-section of the mid-length of the billet as it passes through the die for one pass. As a general overview observation, the deformation behavior of the four points is similar to the deformation commencing after approximately 40% of the pressing stroke. Thereafter, the equivalent plastic strain increases rapidly when the billet is pressed through the intersection or deformation zone of the ECAP channel, corresponding to 50% of the stroke, and, finally, it remains steady during the subsequent ECAP process.
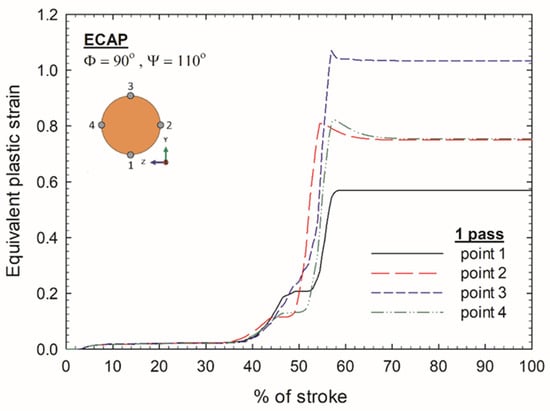
Figure 4.
Equivalent plastic strain variation tracing through points 1, 2, 3 and 4 located on the cross-section of the mid-length of the billet during ECAP processing through one pass.
On close inspection, there is a difference in the magnitude of the equivalent plastic strain at different points after one pass of ECAP. Thus, shortly after entering the intersection of the ECAP die, corresponding to approximately between 44% and 50% of the stroke, point 1 and point 3 located near the outer corner and inner corner of the die, respectively, have higher strains than those of points 2 and 4. This is because points 1 and 3 are deformed before points 2 and 4, but the local strains change with further pressing whereby each point reaches a peak value of strain and remains approximately constant after approximately 60% of the stroke. It is found that the highest equivalent plastic strain of ~1.04 occurs at point 3 located near the inner channel angle; the lowest of ~0.58 is at point 1 located near the outer corner of the die; and the strains at points 2 and 4 are identical at ~0.75, where this value lies between points 1 and 3. This result demonstrates the deformation inhomogeneity that exists in the billet after one pass of ECAP. Similar trends were observed in earlier research [23,24,25], in which deformation begins to take place at points near the outer and inner curves of the die, but the point near the outer curve has a lower deformation rate because it necessarily travels a longer distance.
The equivalent plastic strain distribution contours on the transverse cross-section (X-plane) and longitudinal section (Z-plane) through ECAP for one pass are plotted in Figure 5a,b, respectively. Figure 5a shows that the strain distribution varied along the vertical direction, in which the strain values at the bottom are lower than those at the top of the billet, while the strain distribution along the horizontal direction is reasonably uniform. The values of the equivalent plastic strain at the top, middle and bottom are consistent with the local strain at points 1–4 as observed during ECAP through one pass depicted in Figure 4. In addition, the strain distributions on the transverse cross-section are consistent with the microhardness distributions measured on the Cu-Zr alloy in an earlier study [20]. The low effective plastic strain at the bottom corresponds to an area of low microhardness, which verifies the results from the FE simulation.
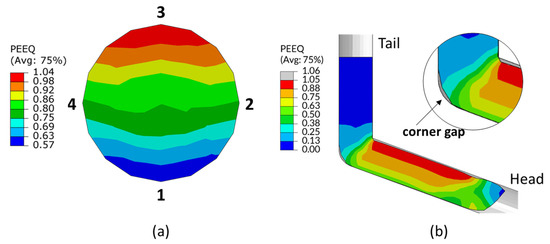
Figure 5.
Equivalent plastic strain distribution contours for (a) transverse cross-section and (b) longitudinal direction through ECAP for one pass.
In practice, the lower values of the equivalent plastic strain at the bottom of the workpiece in Figure 5a are associated with the formation of a corner gap between the die and the workpiece at the outer corner as observed in Figure 5b. As the corner gap is formed during pressing, the workpiece is no longer in contact with the die wall, and this leads to a lower degree of deformation and, consequently, to a lower imposed strain and a lower hardness.
The presence of a corner gap is usually found during the ECAP processing of strain-hardening materials. Thus, the formation of a corner gap at the outer corner of the ECAP channel was reported through experimental observations [5,12,26] and numerical modelling [11,12,17,24,27,28,29]. In a study based on using pure aluminum as a model material [26], an examination of the formation of the corner gap between a strain-hardening material and a quasi-perfect plastic material led to the conclusion that a larger corner gap is formed in the material with the higher strain-hardening rate. It was also pointed out that the less deformation at the outer corner was due to a bending effect more than a shearing effect [28]. Another study examined the equivalent plastic strain rate in the plastic deformation zone and showed that the strain rate at the bottom surface was lower than that at the top surface, and, in addition, the strain rate at the bottom surface decreased with increasing angle Ψ [17].
The evolution of the accumulative equivalent plastic strains for these four points in consecutive ECAP processing of up to eight passes was monitored and plotted as shown in Figure 6. Since each point was rotated by 90° according to processing route BC, the position of each point has a change of 90° in the channel leading to a change in the strain path and strain increment in consecutive passes. It is therefore obvious that the equivalent plastic strain of each point continued to increase with the increasing number of passes, but the increment in each point is different depending on the position of the point in the die for a given pass number. For example, after two passes, the strain increments of points 1, 2, 3 and 4 were 0.63, 0.87, 0.80 and 0.55, respectively. This means that the highest increment was found in point 2 because this point was rotated to the inner curve of the die. Conversely, the lowest increment occurred in point 4 because it was moved to the outer curve of the die. Similar results were also reported in a study of 6061 Al alloy in a circular cross-sectional ECAP process with a die angle (Φ) of 90° using route BC and a finite volume method (FVM) simulation [30].
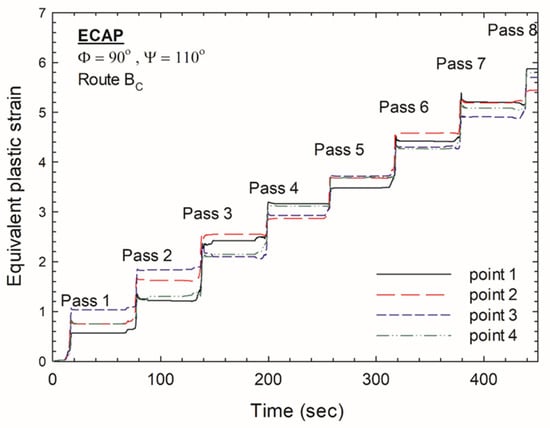
Figure 6.
Equivalent plastic strain variation tracing through points 1, 2, 3 and 4 located in the cross-section of the mid-length of the billet during ECAP processing up to a total of 8 passes.
The average equivalent plastic strain ( from the FE simulation was calculated by taking the average of the strain values over the cross-section at the mid-length of the billet, which were obtained by the following equation:
where n is the number of nodes in the cross-section, and is the equivalent plastic strains at node i. The average strain per pass was given earlier as Equation (1). Therefore, the average equivalent plastic strain obtained by simulation can be plotted as a function of the number of passes and compared directly to the analytical model dictated by Equation (1) using a die geometry of Φ = 110° and Ψ = 20° as shown in Figure 7. It is readily apparent that the average equivalent plastic strains from the simulation are very close to the analytical values calculated from Equation (1). This agreement validates the results obtained by the simulation. Figure 7 also shows that the average equivalent plastic strain increases with the increase in the pass number.
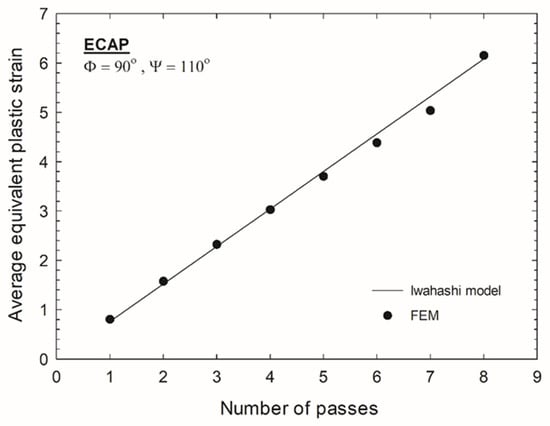
Figure 7.
Average FEM simulation and the calculated equivalent plastic strains using Equation (1) from [2].
3.2. Effect of Number of Passes on the Strain Homogeneity
In addition to the magnitude of the accumulated strain, the strain homogeneity is also important in the design of the ECAP process. In practice, the effect of ECAP passes on the overall strain homogeneity can be assessed directly by measuring the degree of inhomogeneity and noting that lower values indicate better homogeneity.
The degree of inhomogeneity can be quantified by two different methods: using an inhomogeneity index (Ci) or a coefficient of variance (). The inhomogeneity index (Ci) is based on the difference between two extreme strain values as defined by
where , and denote, respectively, the maximum, minimum and average of the equivalent plastic strain. By contrast, the coefficient of variance () uses the standard deviation, which depends on the distribution of strain considering the value of the strain at all nodes in the section as defined by
where is the standard deviation of the equivalent plastic strain. This latter value measures the amount of dispersion of the equivalent plastic strain at each node around the average strain as defined by
The strain distribution homogeneity for different passes during ECAP was determined using these two methods, where the inhomogeneity index (Ci) and the coefficient of variance () were estimated across the transverse section in the mid-length of the billet as shown in Figure 8. It is apparent that the values of the inhomogeneity index, Ci, are higher than the coefficient of variance, , for all conditions, and this is consistent with earlier reports [15,29]. This difference arises because Ci is based on the difference between the maximum and the minimum values, whereas is based on the distribution of strain for all nodes in the section. However, both Ci and give the same tendency whereby their values decrease as the pass number increases, and this is especially true in the earlier stage of deformation as in passes 1–3. However, after four passes, the degree of homogeneity exhibits no significant change because the strains at all nodes on the cross-section are taken into consideration for the coefficient of variance. Therefore, this was selected to represent the strain homogeneity of ECAP.
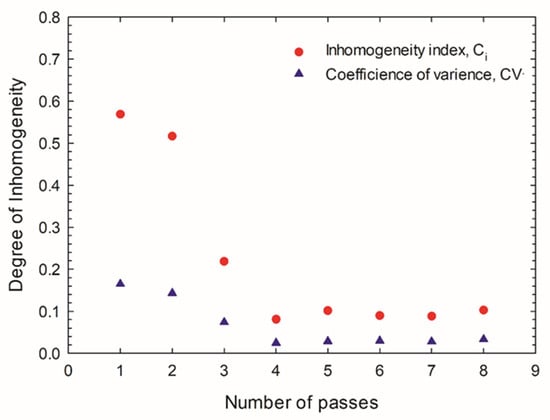
Figure 8.
Inhomogeneity in equivalent plastic strain indicated by the inhomogeneity index and by the coefficient of variance.
In processing by ECAP, a sample experiences intense plasticity as it is pressed through the region of the intersection of the two parts of the channel, where this may be denoted as the plastic deformation zone (PDZ). The evolution of strain homogeneity with the increment of the number of passes can be explained by the strain distribution within the PDZ at the intersection of the die channel as shown in Figure 9. The results demonstrate that the variation in the equivalent plastic strain distribution in the PDZ decreases as the pass number increases as, for example, by 0.13 to 0.88 for one pass and 5.10 to 5.70 for eight passes, and this results in the development of a reasonable degree of deformation homogeneity in consecutive passes.
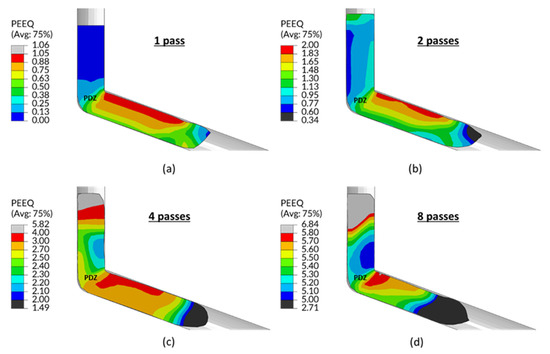
Figure 9.
Equivalent plastic strain distribution contours of the workpiece during ECAP processing at 60% of stroke: (a) 1 pass, (b) 2 passes, (c) 4 passes and (d) 8 passes.
3.3. The Steady-State Zone
The steady-state zone is the region along the billet axis where strain is relatively uniform. To define the steady-state zone in an ECAP workpiece, the transverse cross-sections were cut perpendicular to the pressing direction throughout the length of the workpiece as shown in Figure 10. Then, the average equivalent plastic strains and the coefficients of variance were calculated over the cross-sectional surface and plotted over the length of the workpiece through 1, 2, 4 and 8 passes of ECAP as shown in Figure 11a,b, respectively.
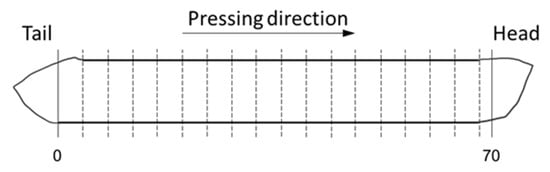
Figure 10.
Schematic illustration showing the cross-sections in the analysis for the steady-state zone.
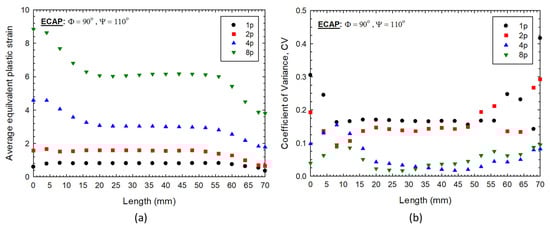
Figure 11.
The plots of (a) average equivalent plastic strains and (b) coefficients of variance on different cross-sections over the length of the workpiece for various numbers of passes.
Figure 11a shows that the average equivalent plastic strain increases with the increasing number of passes for all sections along the length of the workpiece. Moreover, during ECAP through one pass and two passes, the values of the average equivalent plastic strain are relatively constant along the length and decrease slightly near the front of the workpiece due to the lack of any constraint at the exit of the ECAP die. In consecutive passes with route BC, the maximum value of the average equivalent plastic strain lies at the back of the workpiece close to the load application point, and then it decreases with the distance away from the application point until it reaches a certain value and remains steady in the middle portion of the workpiece over a length of about 40 mm. It then becomes lower again near the front of the workpiece as is evident in the workpiece after ECAP for four and eight passes.
Figure 11b represents the degree of strain homogeneity in each cross-section over the length of the billet measured using the coefficient of variance, , where a lower value indicates a better degree of homogeneity. These results show that the coefficient of variance decreases as the number of passes increases, where the values for the workpieces after ECAP for four and eight passes are lower than 0.1. It is apparent that higher values of exist at the front and back of the workpiece within distances of about 15 mm from either end for all conditions.
Finally, Figure 12 shows the equivalent plastic strain distribution contours along the length of the workpiece through ECAP after different numbers of passes. An inspection shows that there is a significant variation in equivalent plastic strain from the bottom to the top of the workpiece after ECAP for one and two passes as shown in Figure 12a,b, but this variation is gradually eliminated with the increasing number of ECAP passes. From the results plotted in Figure 11 and Figure 12, it is concluded that the workpiece may be conveniently divided into three regions corresponding to the head, the intermediate steady-state zone and the tail. The steady-state zone is the region of reasonable homogeneity located between the non-uniformly deformed head at the front of the workpiece and the tail at the back of the workpiece. This is evident in Figure 12d, where the steady-state zone is clearly marked.
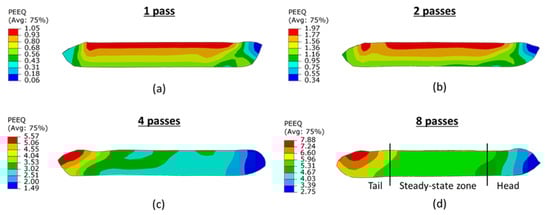
Figure 12.
Equivalent plastic strain distribution contours along the length of the workpiece through ECAP for (a) 1 pass, (b) 2 passes, (c) 4 passes and (d) 8 passes.
In this study, the length of the steady-state zone of the Cu-0.1 wt% Zr alloy after ECAP through eight passes is ~40 mm in the middle portion of the billet between the head and the tail. Minimizing the lengths of the non-uniform regions in the head and tail is of technological importance in order to maximize the length of the useful homogeneous portion of the ECAP sample. It was reported earlier that, if the angle Ψ is maintained constant, the non-uniform part in the head is longer in a strain-hardening material than that in a perfectly plastic material [8]. Furthermore, if the ECAP facility has a capability of applying back pressure, this will contribute to the uniformity of the metal flow during the ECAP operation because the application of back pressure increases the homogeneity and leads to a filling of the outer corner of the die so that the deformation zone becomes closer to that of a localized shear band [31,32,33].
The goal in the design of the ECAP process is to maximize the magnitude of the strain, to minimize the inhomogeneity and to minimize the force that is needed. In order to achieve these objectives, it is important to obtain an understanding of the effect of various parameters, including the die geometry, the material properties, the processing conditions and their interactions on the overall deformation behavior. The present investigation shows that the use of 3D FEM simulation provides an important contribution toward achieving a much improved understanding of the ECAP deformation process.
4. Conclusions
- A 3D FEM simulation was successfully used to investigate the deformation behavior of a circular cross-sectional workpiece of a Cu-Zr alloy during ECAP processing, with die angles of Φ = 110° and Ψ = 20°, up to a total of eight passes using processing route BC.
- The results show that strain inhomogeneity is present in the early stages of ECAP processing, in which a lower equivalent plastic strain occurs on the outer corner of the workpiece due to the formation of a corner gap in a representative strain-hardening material. However, this strain inhomogeneity decreases with the number of passes and becomes reasonably uniform after four passes of ECAP.
- The average equivalent plastic strains obtained from the cross-section in the mid-length of the workpiece after various passes is in very good agreement with the basic analytical model for ECAP, and this serves to verify the validity of the simulation results. The values of the average equivalent plastic strain tend to increase continuously with the increasing number of passes. In addition, the strain distributions on transverse cross-sections are in a good agreement with the microhardness values measured on the Cu-Zr alloy.
- The effect of pass number on the strain homogeneity was evaluated using the inhomogeneity index (Ci) and the coefficient of variance ), where a lower value means a higher homogeneity in the strain distribution. Both Ci and significantly decrease with up to four passes of ECAP, and, thereafter, they remain reasonably constant so that there is a potential in ECAP processing for achieving strain homogeneity after processing through a significant number of passes.
- Based on the coefficient of variance, it is concluded that, after pressing, the workpiece may be conveniently divided into three separate regions corresponding to the head, steady-state zone and the tail. In this study, the steady-state zone extends over approximately 40 mm in length along the longitudinal axis of the workpiece.
Author Contributions
Methodology, J.W.-N., N.N., C.K. and T.G.L.; validation, J.W.-N., N.N. and C.K.; investigation, J.W.-N., N.N. and C.K.; resources, J.W.-N., N.N., C.K. and T.G.L.; data curation, J.W.-N., N.N. and C.K.; writing—original draft preparation, J.W.-N., N.N. and C.K.; writing—review and editing J.W.-N., N.N., C.K. and T.G.L.; supervision, J.W.-N., N.N., C.K. and T.G.L.; funding acquisition, J.W.-N., C.K. and T.G.L. All authors have read and agreed to the published version of the manuscript.
Funding
The work was supported by the European Research Council under ERC Grant Agreement No. 267464-SPDMETALS, the KMITL Research Fund under Project Number KREF01590 and Thammasat Postdoctoral Fellowship under Project Number TUPD12/2564.
Data Availability Statement
The raw and processed data generated during this study will be made available upon reasonable request.
Acknowledgments
We appreciate the assistance of the staff in the Mechanical Engineering Laboratory in KMITL.
Conflicts of Interest
The authors declare no conflict of interest.
References
- Valiev, R.Z.; Langdon, T.G. Principles of equal-channel angular pressing as a processing tool for grain refinement. Prog. Mater. Sci. 2006, 51, 881–981. [Google Scholar] [CrossRef]
- Iwahashi, Y.; Wang, J.; Horita, Z.; Nemoto, M.; Langdon, T.G. Principle of equal-channel angular pressing for the processing of ultra-fine grained materials. Scr. Mater. 1996, 35, 143–146. [Google Scholar] [CrossRef]
- Li, S.; Bourke, M.A.M.; Beyerlein, I.J.; Alexander, D.J.; Clausen, B. Finite element analysis of the plastic deformation zone and working load in equal channel angular extrusion. Mater. Sci. Eng. A 2004, 382, 217–236. [Google Scholar] [CrossRef]
- Figueiredo, R.B.; Pinheiro, I.P.; Aguilar, M.T.P. The finite element analysis of equal channel angular pressing (ECAP) considering the strain path dependence of the work hardening of metals. J. Mater.Process. Technol. 2006, 180, 30–36. [Google Scholar] [CrossRef]
- Wei, W.; Nagasekhar, A.V.; Chen, G.; Tick-Hon, Y.; Wei, K.X. Origin of inhomogenous behavior during equal channel angular pressing. Scr. Mater. 2006, 54, 1865–1869. [Google Scholar] [CrossRef]
- Figueiredo, R.B.; Cetlin, P.R.; Langdon, T.G. The processing of difficult-to-work alloys by ECAP with an emphasis on magnesium alloys. Acta Mater. 2007, 55, 4769–4779. [Google Scholar] [CrossRef]
- Wei, W.; Zhang, W.; Wei, K.X.; Zhong, Y.; Cheng, G.; Hu, J. Finite element analysis of deformation behavior in continuous ECAP process. Mater. Sci. Eng. A 2009, 516, 111–118. [Google Scholar] [CrossRef]
- Balasundar, I.; Raghu, T. Effect of friction model in numerical analysis of equal channel angular pressing process. Mater. Des. 2010, 31, 449–457. [Google Scholar] [CrossRef]
- Yoon, S.C.; Jeong, H.-G.; Lee, S.; Kim, H.S. Analysis of plastic deformation behavior during back pressure equal channel angular pressing by the finite element method. Comp. Mater. Sci. 2013, 77, 202–207. [Google Scholar] [CrossRef]
- Suo, T.; Li, Y.; Guo, Y.; Liu, Y. The simulation of deformation distribution during ECAP using 3D finite element method. Mater. Sci. Eng. A 2006, 432, 269–274. [Google Scholar] [CrossRef]
- Basavaraj, V.P.; Chakkingal, U.; Kumar, T.S.P. Study of channel angle influence on material flow and strain inhomogeneity in equal channel angular pressing using 3D finite element simulation. J. Mater.Process. Technol. 2009, 209, 89–95. [Google Scholar] [CrossRef]
- Mahallawy, N.E.; Shehata, F.A.; Hameed, M.A.E.; Aal, M.I.A.E. 3D FEM simulations for the homogeneity of plastic deformation in Al–Cu alloys during ECAP. Mater. Sci. Eng. A 2010, 527, 1404–1410. [Google Scholar] [CrossRef]
- Su, C.W.; Lu, L.; Lai, M.O. 3D finite element analysis on strain uniformity during ECAP process. Mater. Sci. Technol. 2007, 23, 727–735. [Google Scholar] [CrossRef]
- Leo, P.; Cerri, E.; De Marco, P.P.; Roven, H.J. Properties and deformation behaviour of severe plastic deformed aluminium alloys. J. Mater.Process. Technol. 2007, 182, 207–214. [Google Scholar] [CrossRef]
- Basavaraj, V.P.; Chakkingal, U.; Kumar, T.S.P. Effect of geometric parameters on strain, strain inhomogeneity and peak pressure in equal channel angular pressing—A study based on 3D finite element analysis. J. Manufac. Process. 2015, 17, 88–97. [Google Scholar]
- Xu, S.; Zhao, G.; Luan, Y.; Guan, Y. Numerical studies on processing routes and deformation mechanism of multi-pass equal channel angular pressing processes. J. Mater.Process. Technol. 2006, 176, 251–259. [Google Scholar] [CrossRef]
- Cerri, P.; De Marco, P.; Leo, P. FEM and metallurgical analysis of modified 6082 aluminium alloys processed by multipass ECAP: Influence of material properties and different process settings on induced plastic strain. J. Mater. Process. Technol. 2009, 209, 1550–1564. [Google Scholar] [CrossRef]
- Djavanroodi, F.; Omranpour, B.; Ebrahimi, M.; Sedighi, M. Designing of ECAP parameters based on strain distribution uniformity. Prog. Nat. Sci. Mater. Int. 2012, 22, 452–460. [Google Scholar] [CrossRef] [Green Version]
- ABAQUS User’s Manual; ABAQUS Inc.: Palo Alto, CA, USA, 2016.
- Wongsa-Ngam, J.; Kawasaki, M.; Langdon, T.G. The development of hardness homogeneity in a Cu-Zr alloy processed by equal-channel angular pressing. Mater. Sci. Eng. A 2012, 556, 526–532. [Google Scholar] [CrossRef]
- Li, J.; Wongsa-Ngam, J.; Xu, J.; Shan, D.; Guo, B.; Langdon, T.G. Wear resistance of an ultrafine-grained Cu-Zr alloy processed by equal-channel angular pressing. Wear 2015, 326, 10–19. [Google Scholar] [CrossRef]
- Furukawa, M.; Iwahashi, Y.; Horita, Z.; Nemoto, M.; Langdon, T.G. The shearing characteristics associated with equal-channel angular pressing. Mater. Sci. Eng. A 1998, 257, 328–332. [Google Scholar] [CrossRef]
- Kim, J.K.; Kim, W.J. Analysis of deformation behavior in 3D during equal channel angular extrusion. J. Mater. Process. Technol. 2006, 176, 260–267. [Google Scholar] [CrossRef]
- Aal, M.I.A.E. 3D FEM simulations and experimental validation of plastic deformation of pure aluminum deformed by ECAP and combination of ECAP and direct extrusion. Trans. Nonferrous Met. Soc. China 2017, 27, 1338–1352. [Google Scholar] [CrossRef]
- Priel, E.; Mittelman, B.; Trabelsi, N.; Cohen, Y.; Koptiar, Y.; Padan, R. A computational investigation of equal channel angular pressing of molybdenum validated by experiments. J. Mater. Process. Technol. 2019, 264, 469–485. [Google Scholar] [CrossRef]
- Shan, A.; Moon, I.-G.; Ko, H.-S.; Park, J.-W. Direct observation of shear deformation during equal channel angular pressing of pure aluminum. Scr. Mater. 1999, 41, 353–357. [Google Scholar] [CrossRef]
- Kim, H.S.; Seo, M.H.; Hong, S.I. On the die corner gap formation in equal channel angular pressing. Mater. Sci. Eng. A 2000, 291, 86–90. [Google Scholar] [CrossRef]
- Luis-Pérez, C.J.; Luri-Irigoyen, R. Gastón-Ochoa, Finite element modelling of an Al–Mn alloy by equal channel angular extrusion (ECAE). D. J. Mater. Process. Technol. 2004, 153, 846–852. [Google Scholar] [CrossRef]
- Agwa, M.A.; Ali, M.N.; Al-Shorbagy, A. Optimum processing parameters for equal channel angular pressing. Mech. Mater. 2016, 100, 1–11. [Google Scholar] [CrossRef]
- Kim, W.J.; Namgung, J.C.; Kim, J.K. Analysis of strain uniformity during multi-pressing in equal channel angular extrusion. Scr. Mater. 2005, 53, 293–298. [Google Scholar] [CrossRef]
- Lapovok, R.Y. The role of back-pressure in equal channel angular extrusion. J. Mater. Sci. 2005, 40, 341–346. [Google Scholar] [CrossRef]
- Xu, C.; Xia, K.; Langdon, T.G. The role of back pressure in the processing of pure aluminum by equal-channel angular pressing. Acta Mater. 2007, 55, 2351–2360. [Google Scholar] [CrossRef]
- Xu, C.; Xia, K.; Langdon, T.G. Processing of a magnesium alloy by equal-channel angular pressing using a back-pressure. Mater. Sci. Eng. A 2009, 527, 205–211. [Google Scholar] [CrossRef]
Publisher’s Note: MDPI stays neutral with regard to jurisdictional claims in published maps and institutional affiliations. |
© 2021 by the authors. Licensee MDPI, Basel, Switzerland. This article is an open access article distributed under the terms and conditions of the Creative Commons Attribution (CC BY) license (https://creativecommons.org/licenses/by/4.0/).