
Bond Behavior of Recycled Fiber Recycled Concrete with Reinforcement after Freeze-Thaw Cycles

Abstract
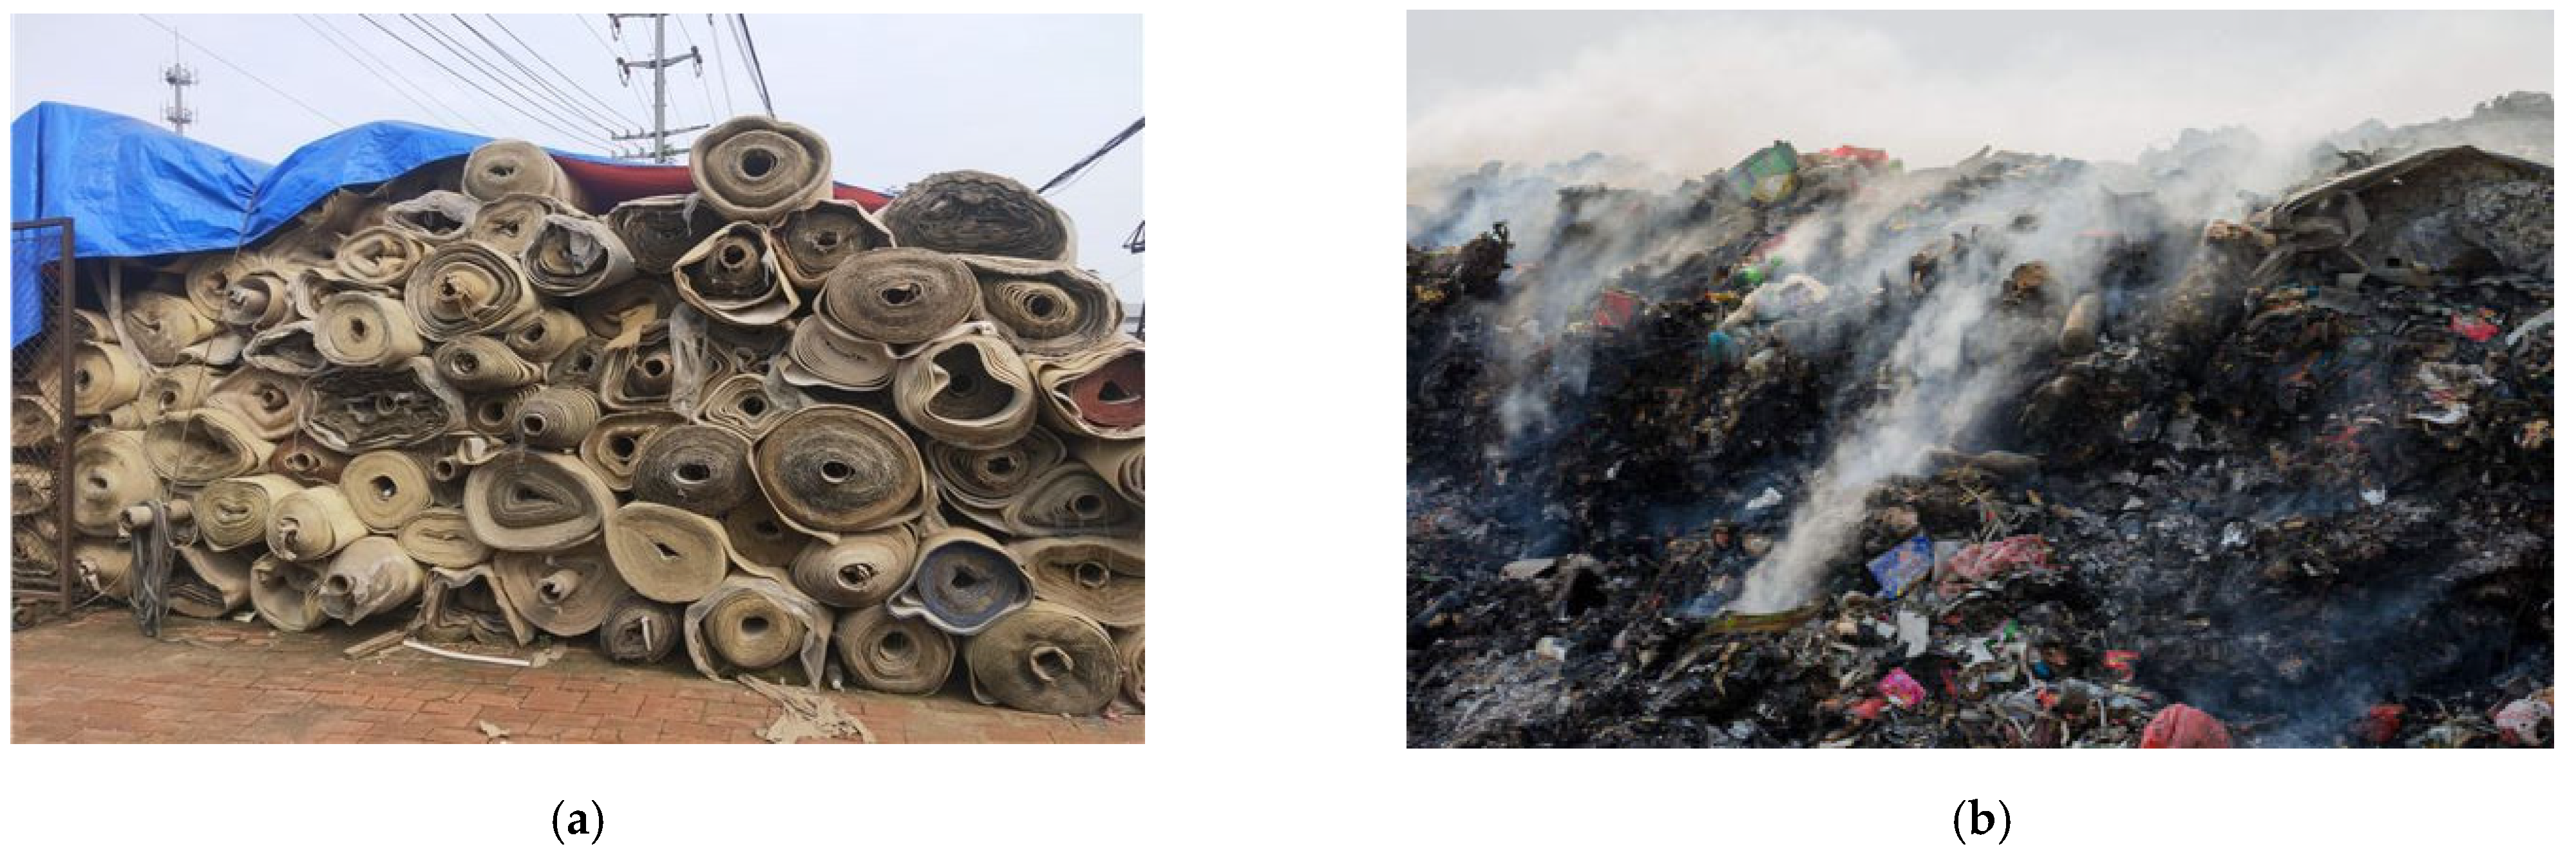
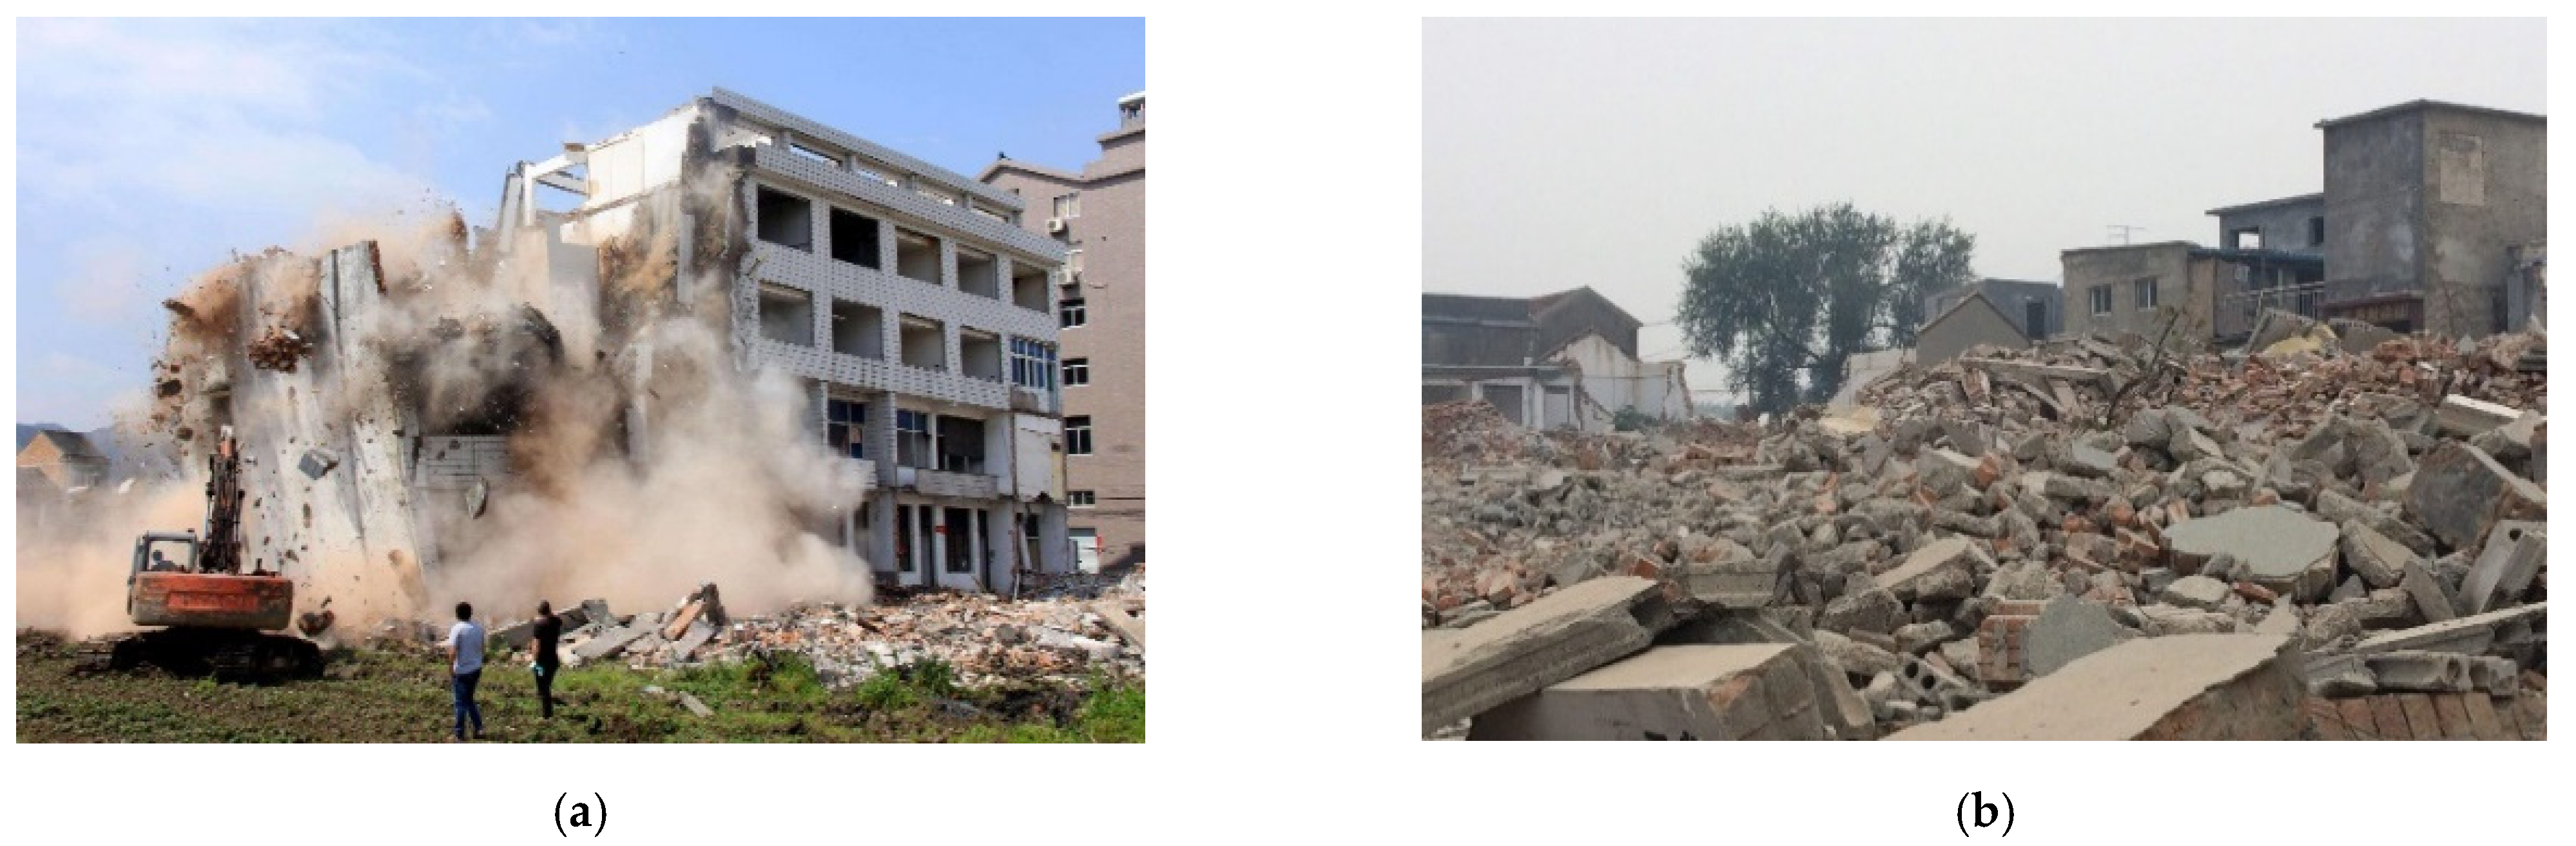
:1. Introduction
2. Materials and Methods
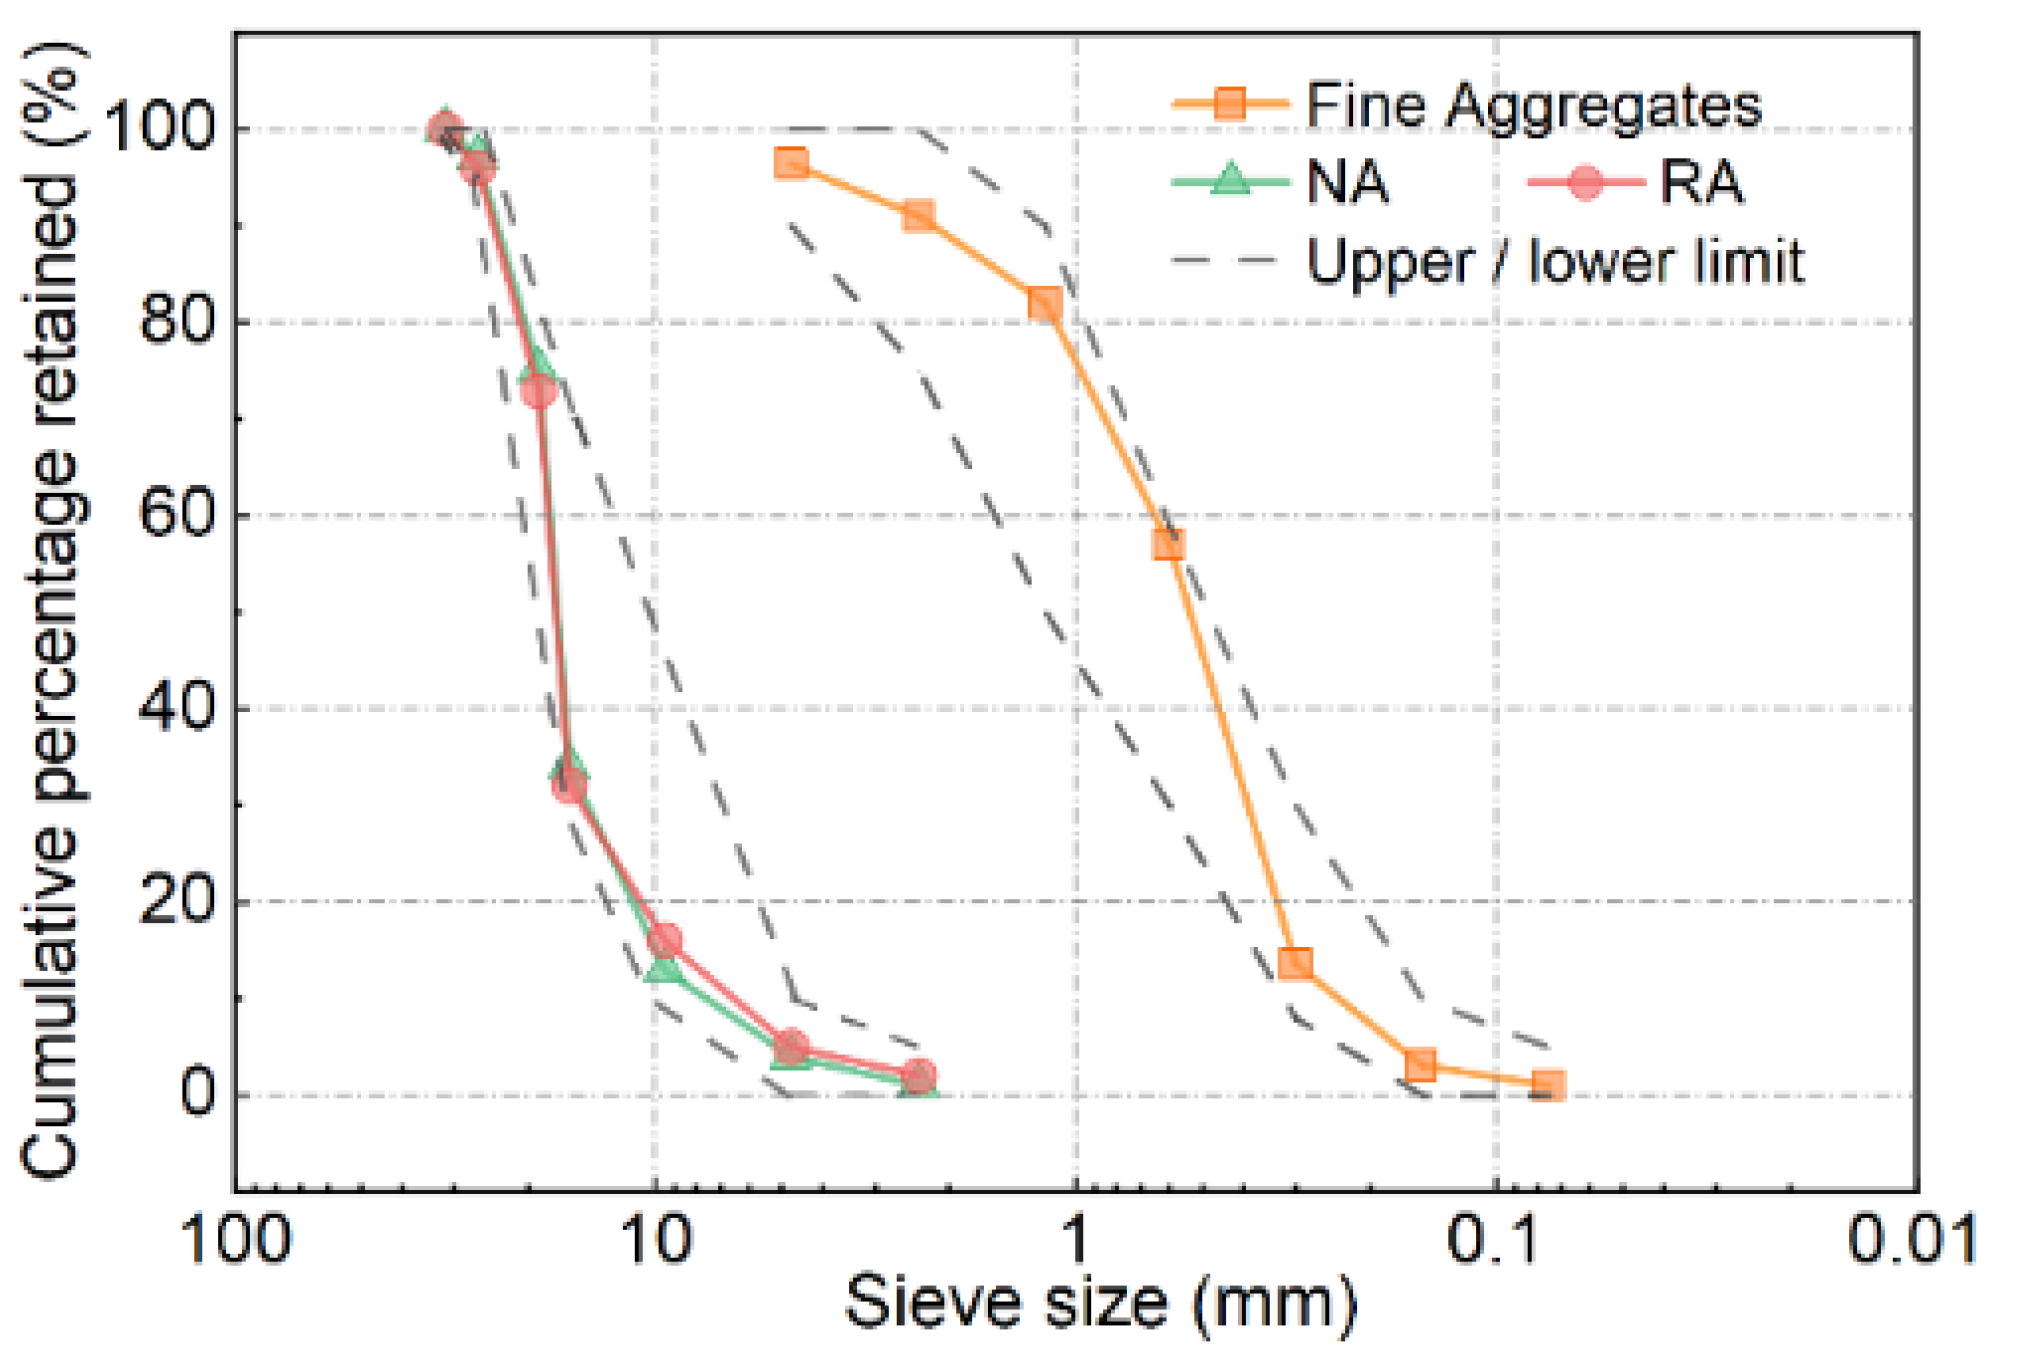
2.1. Materials
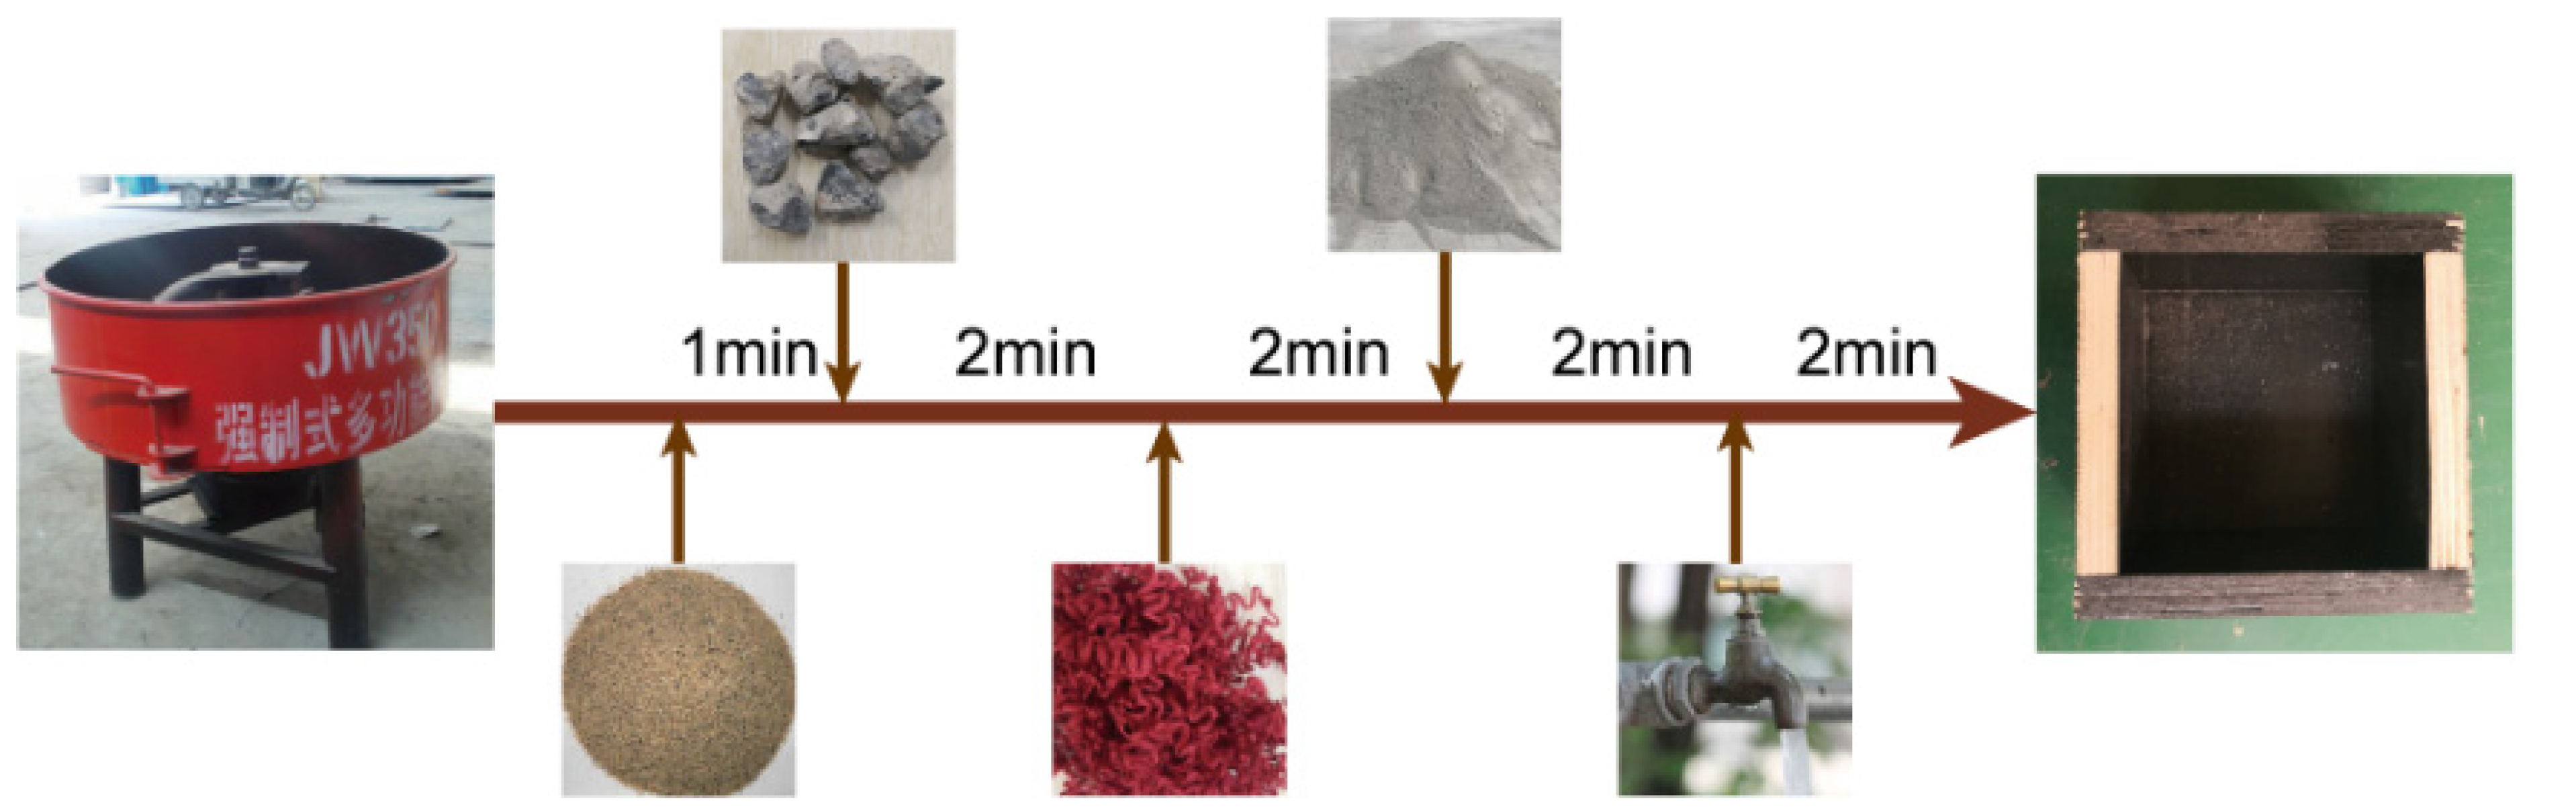
2.2. Concrete Mixture
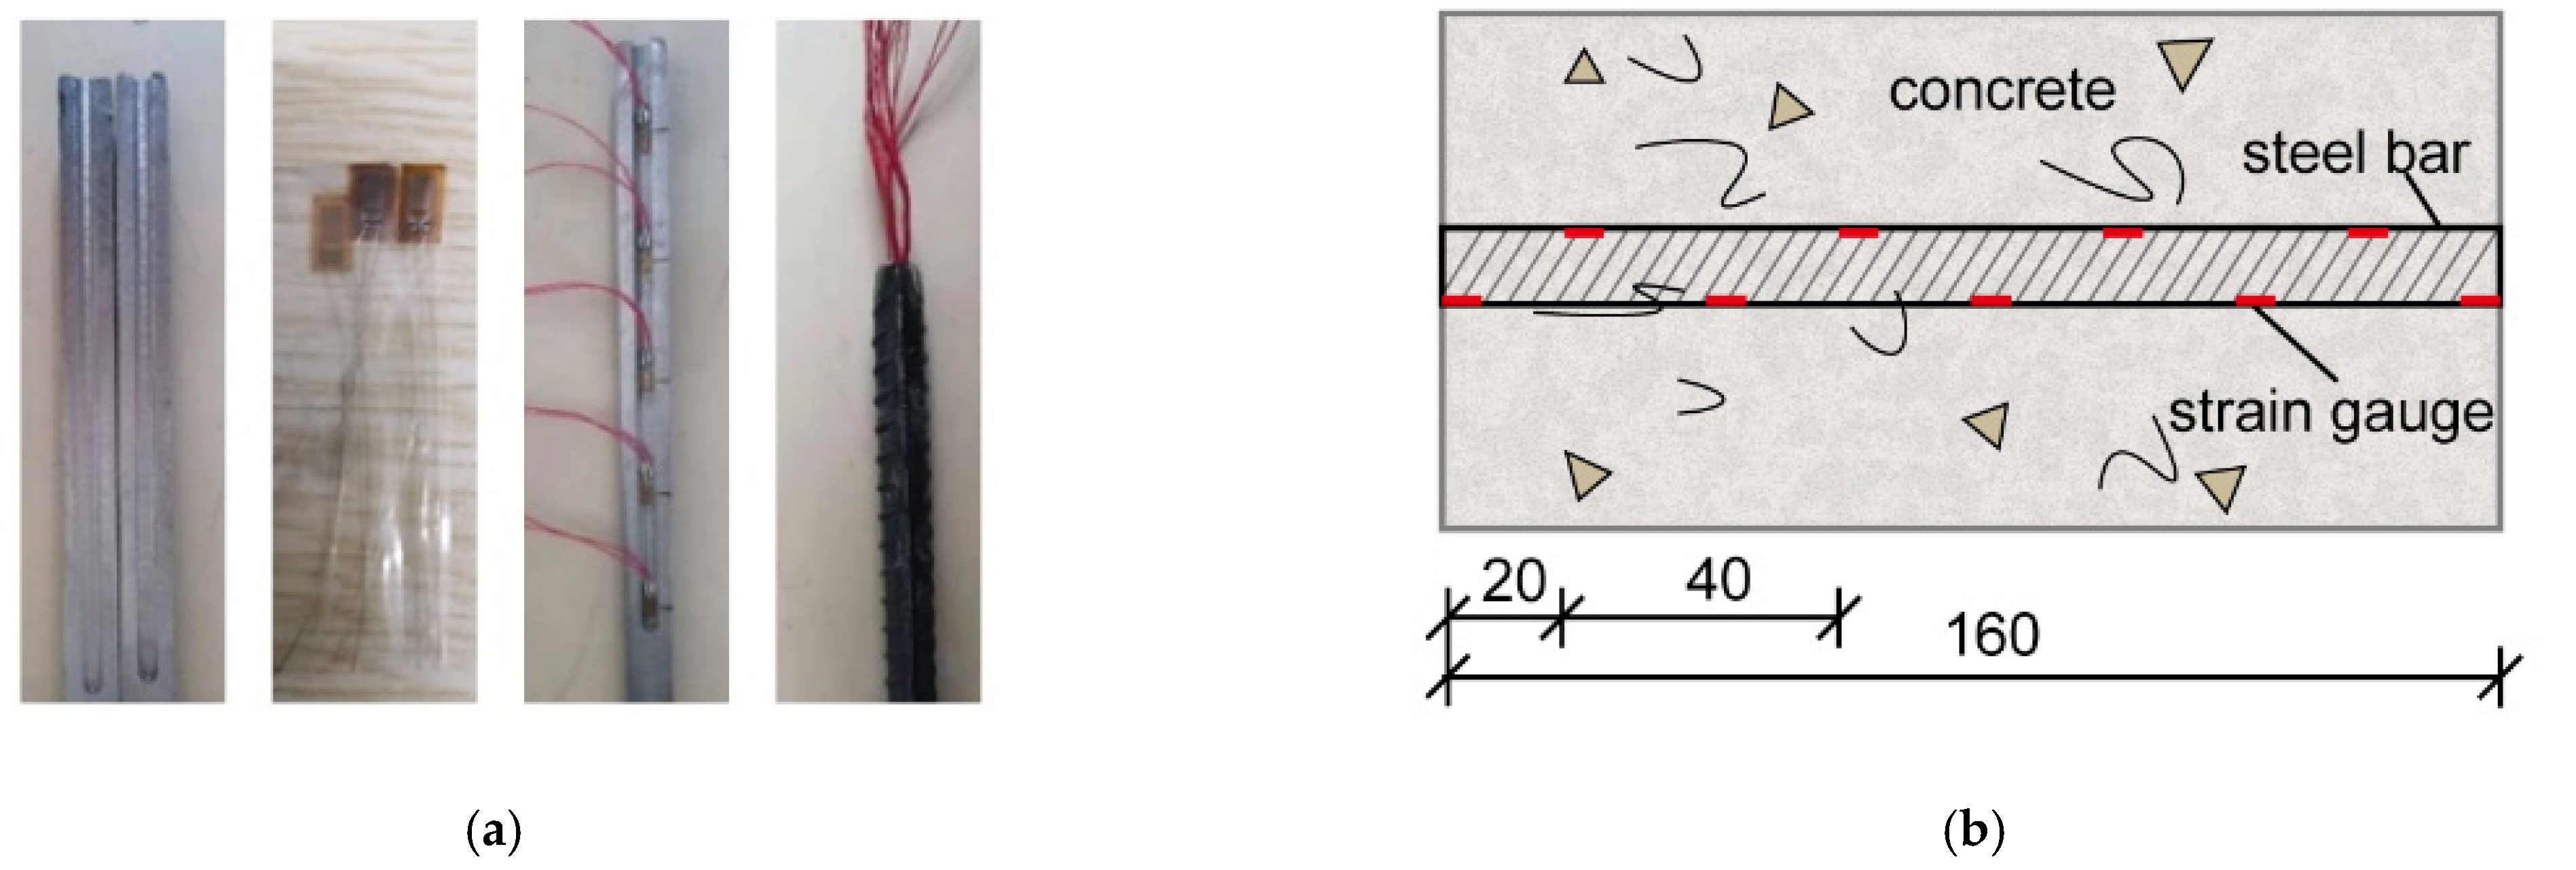
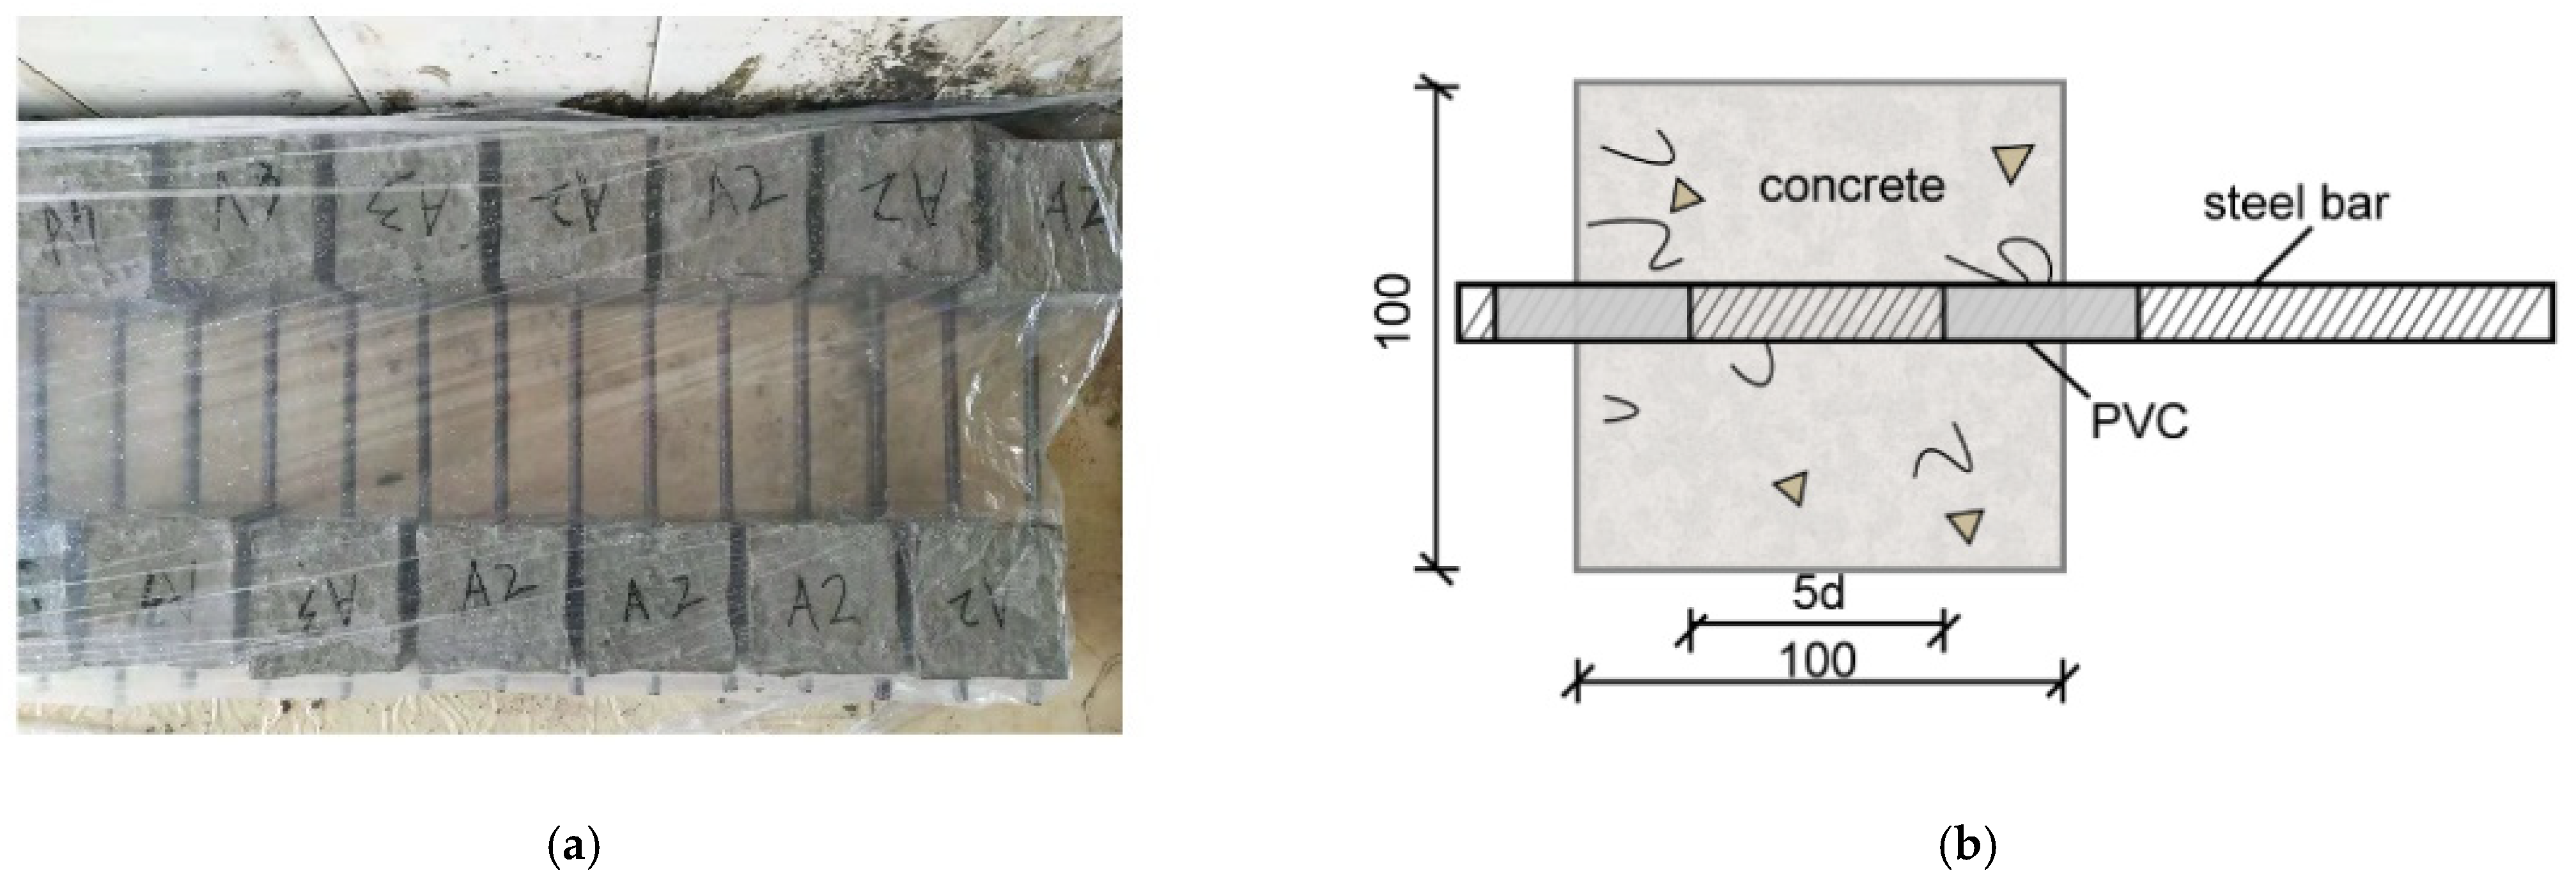
2.3. Test Specimens
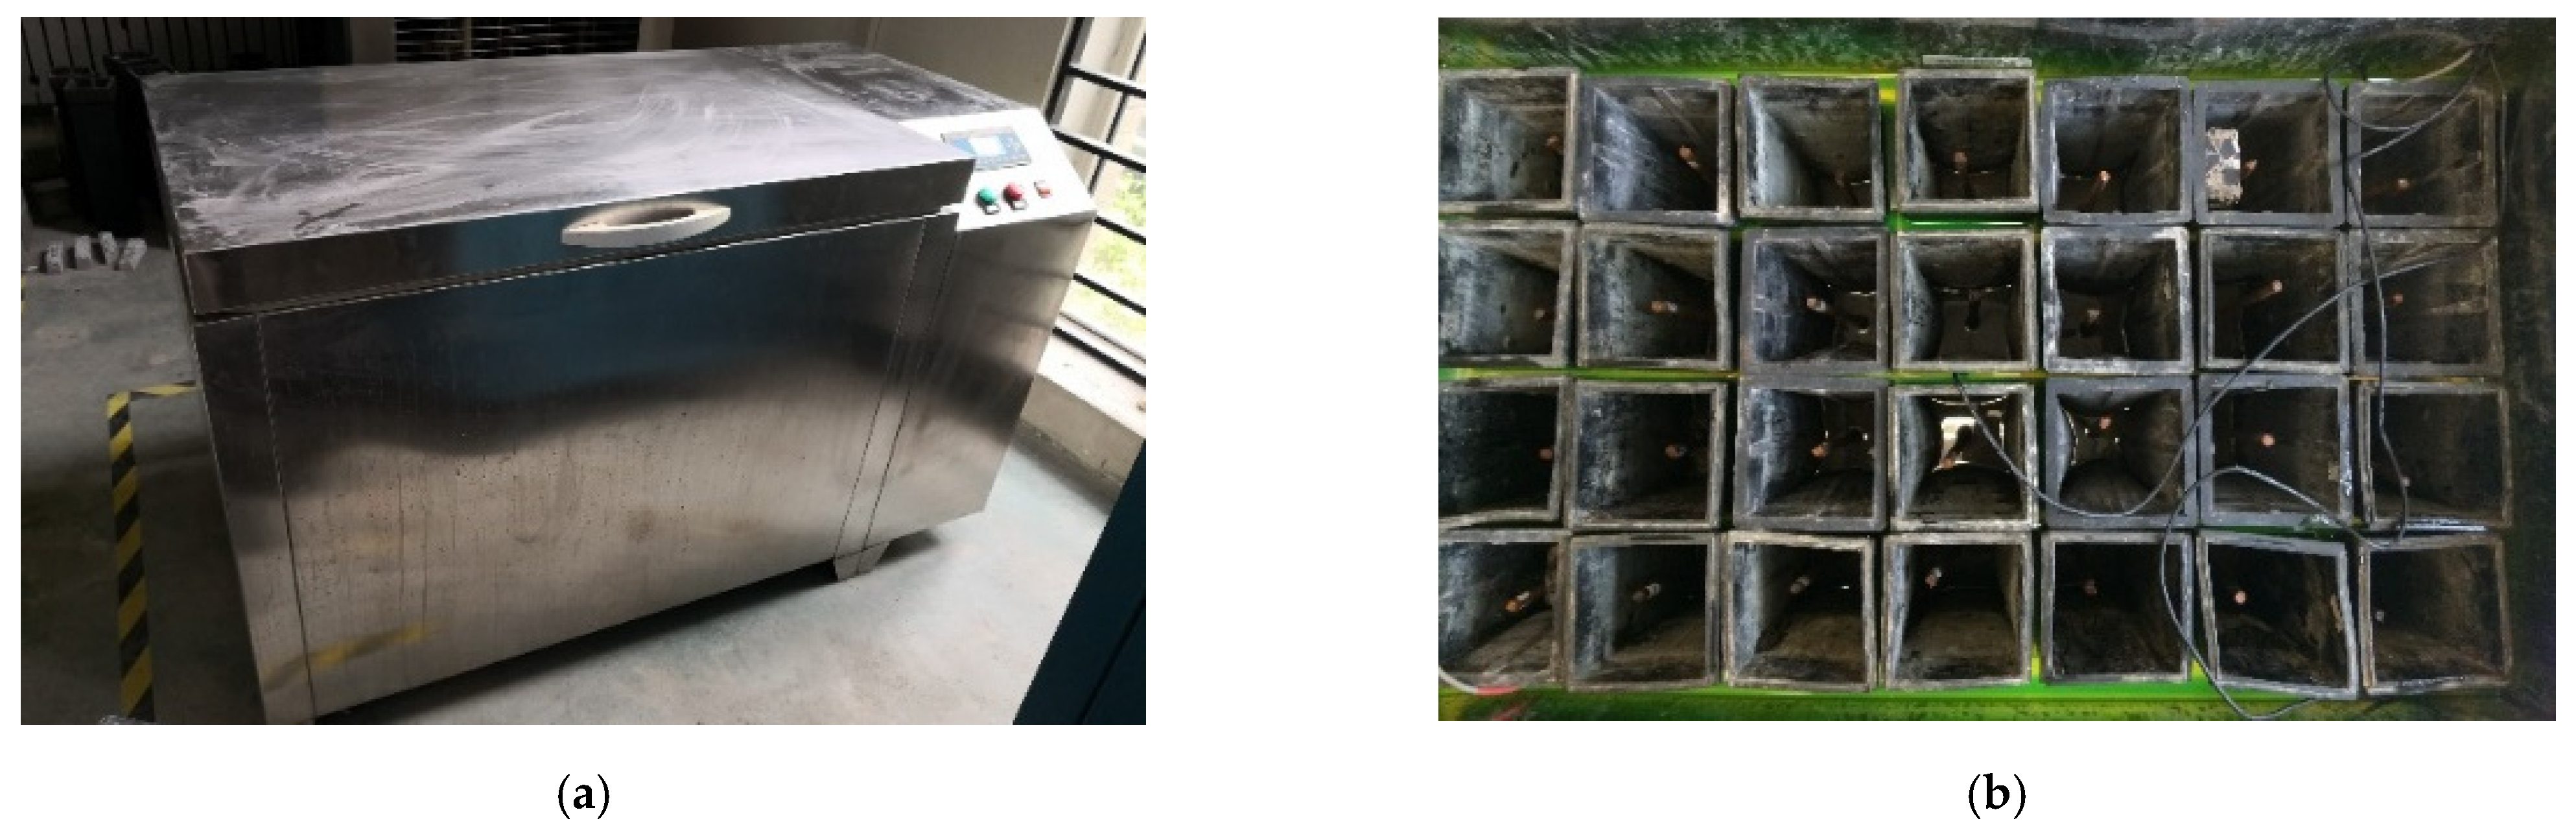
2.4. Rapid Freeze-Thaw Cycles Test
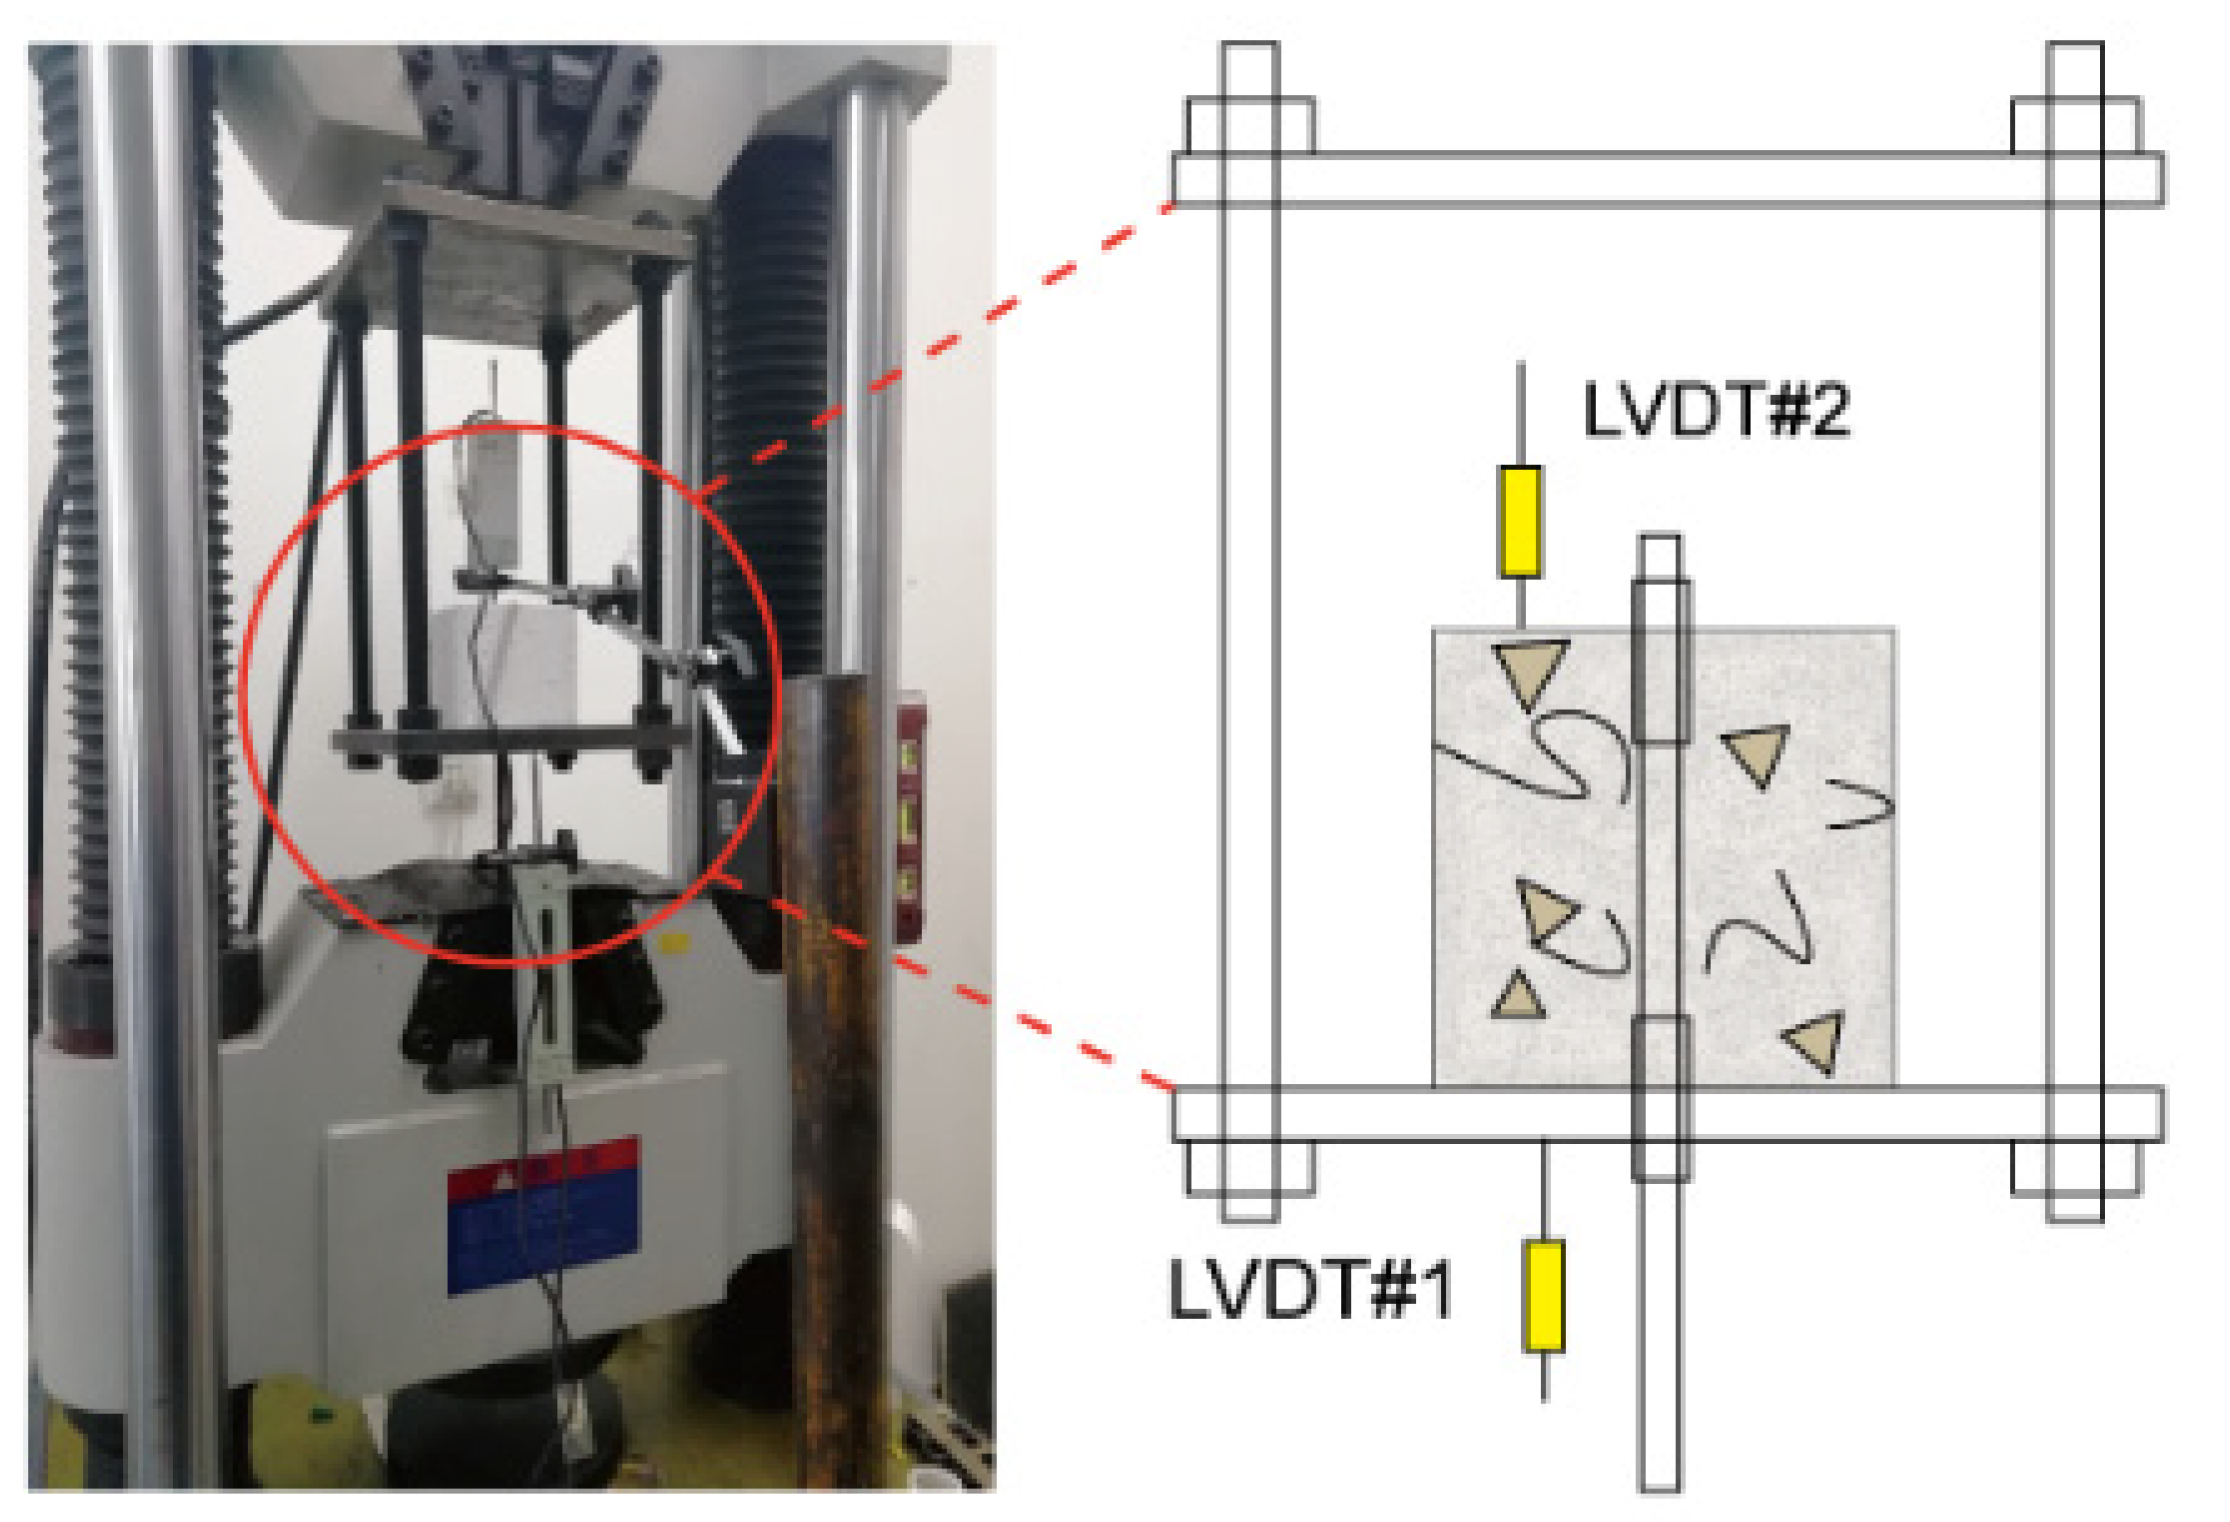
2.5. Pull-Out Test
3. Results
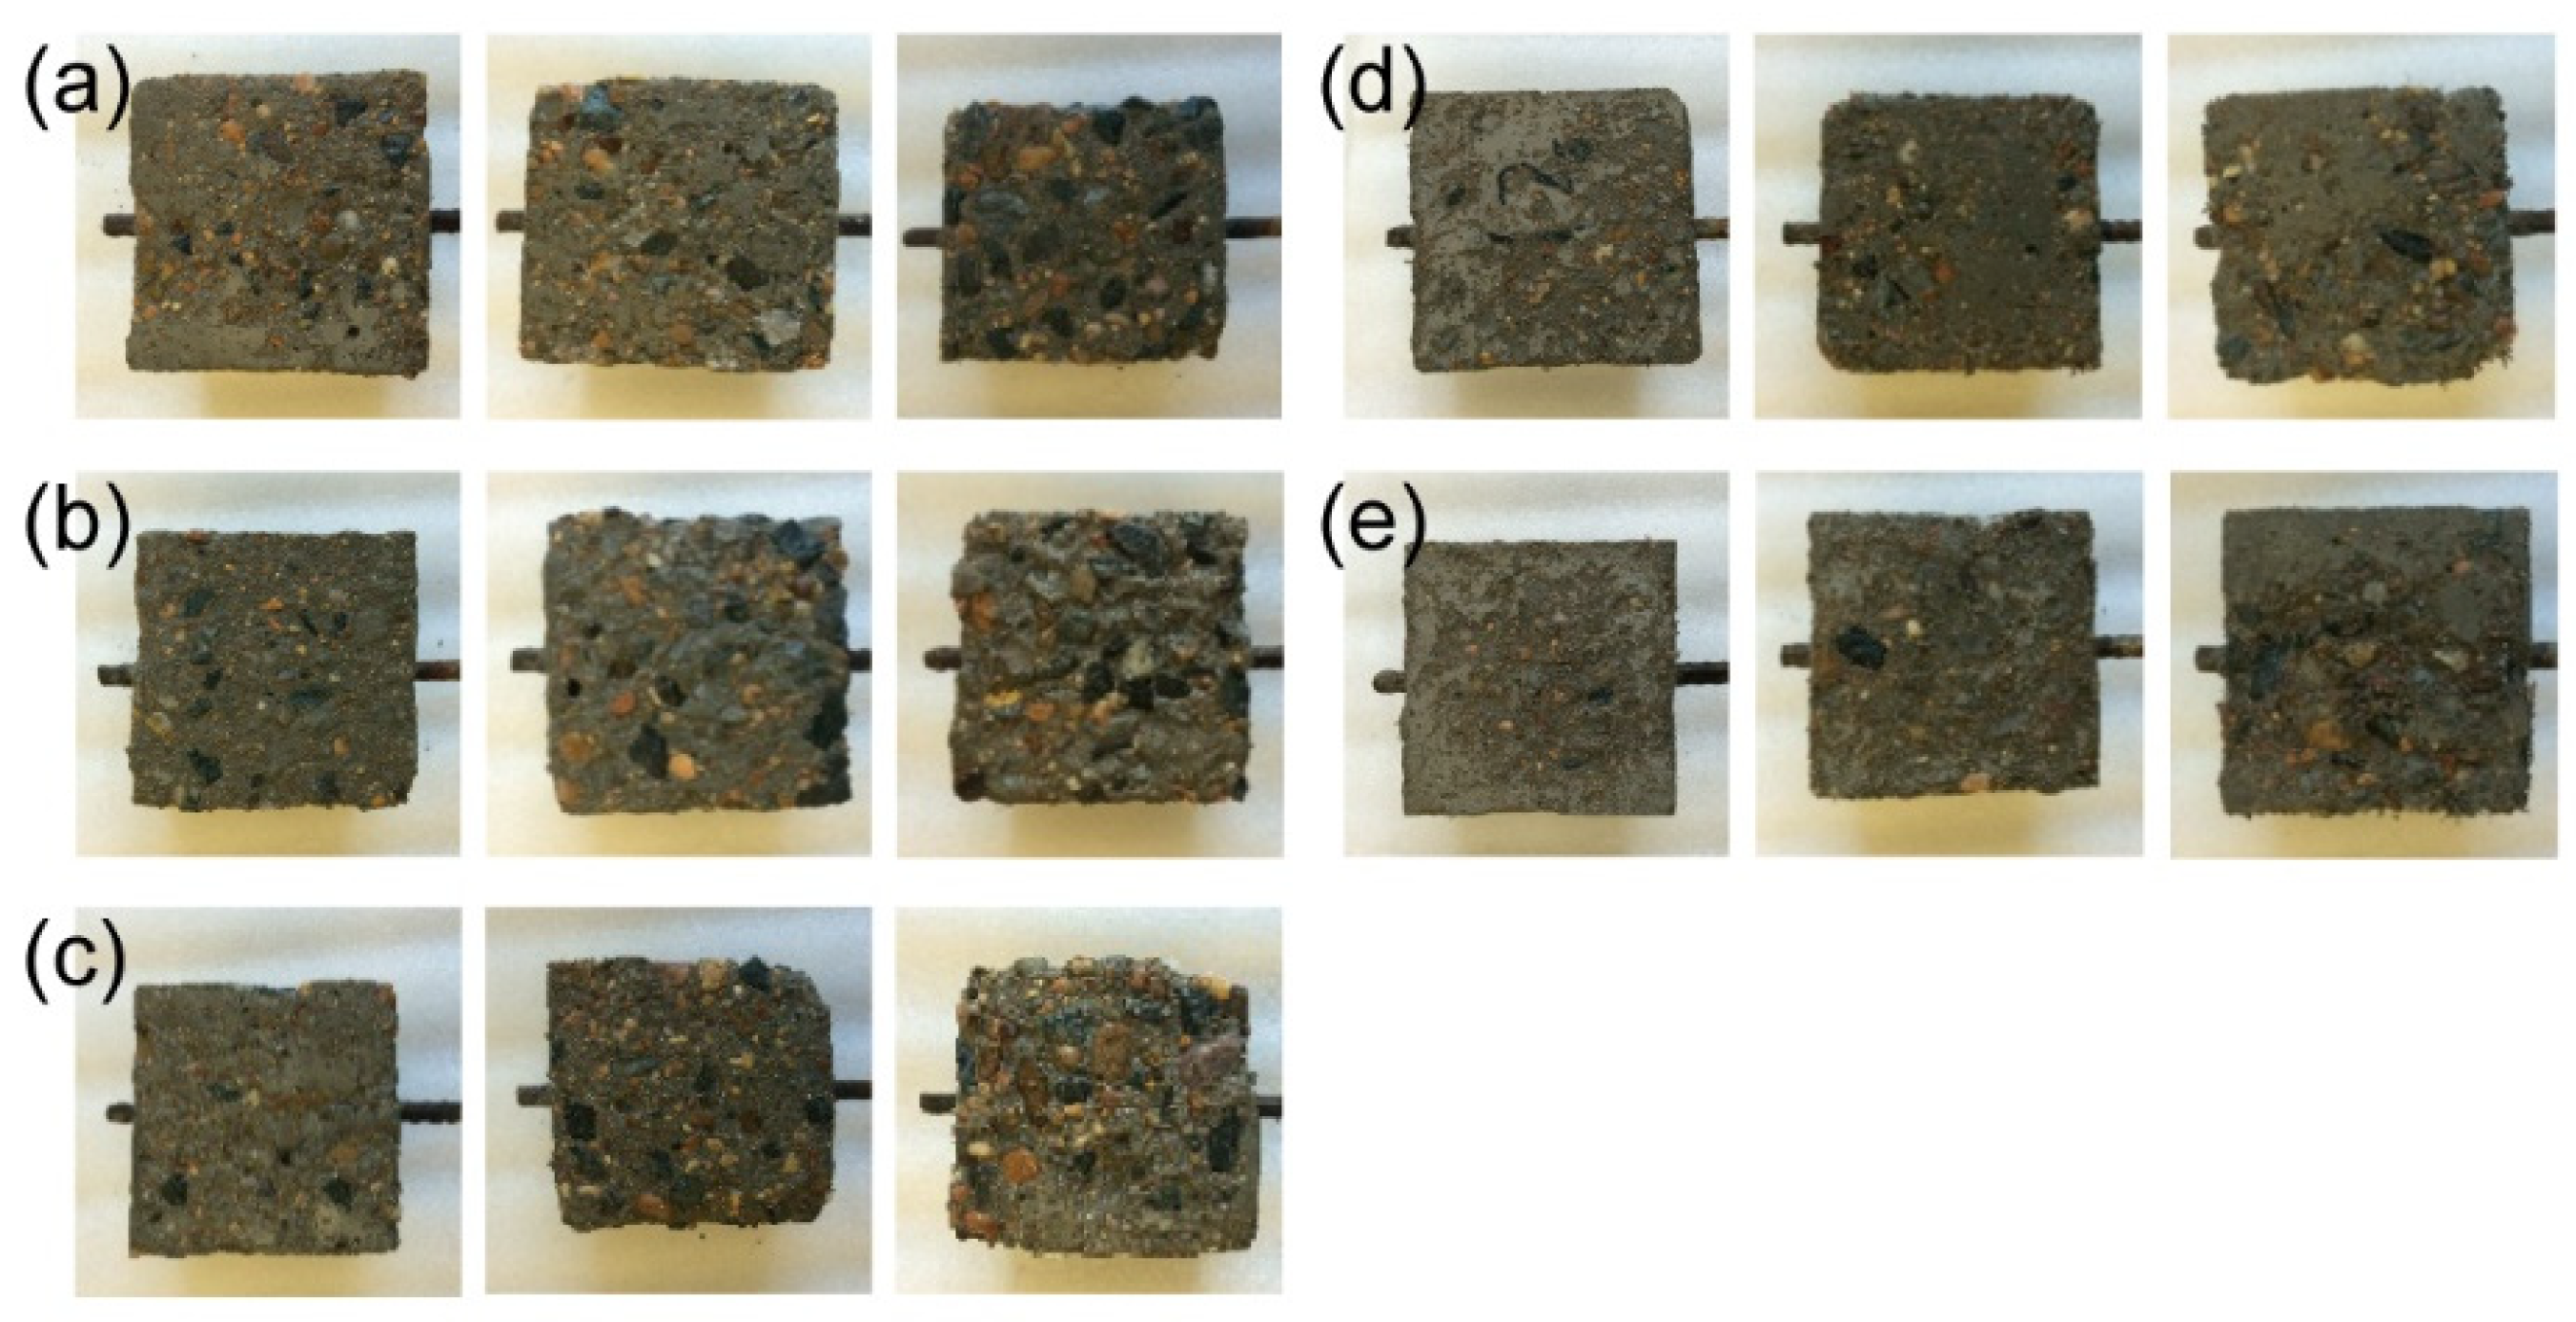
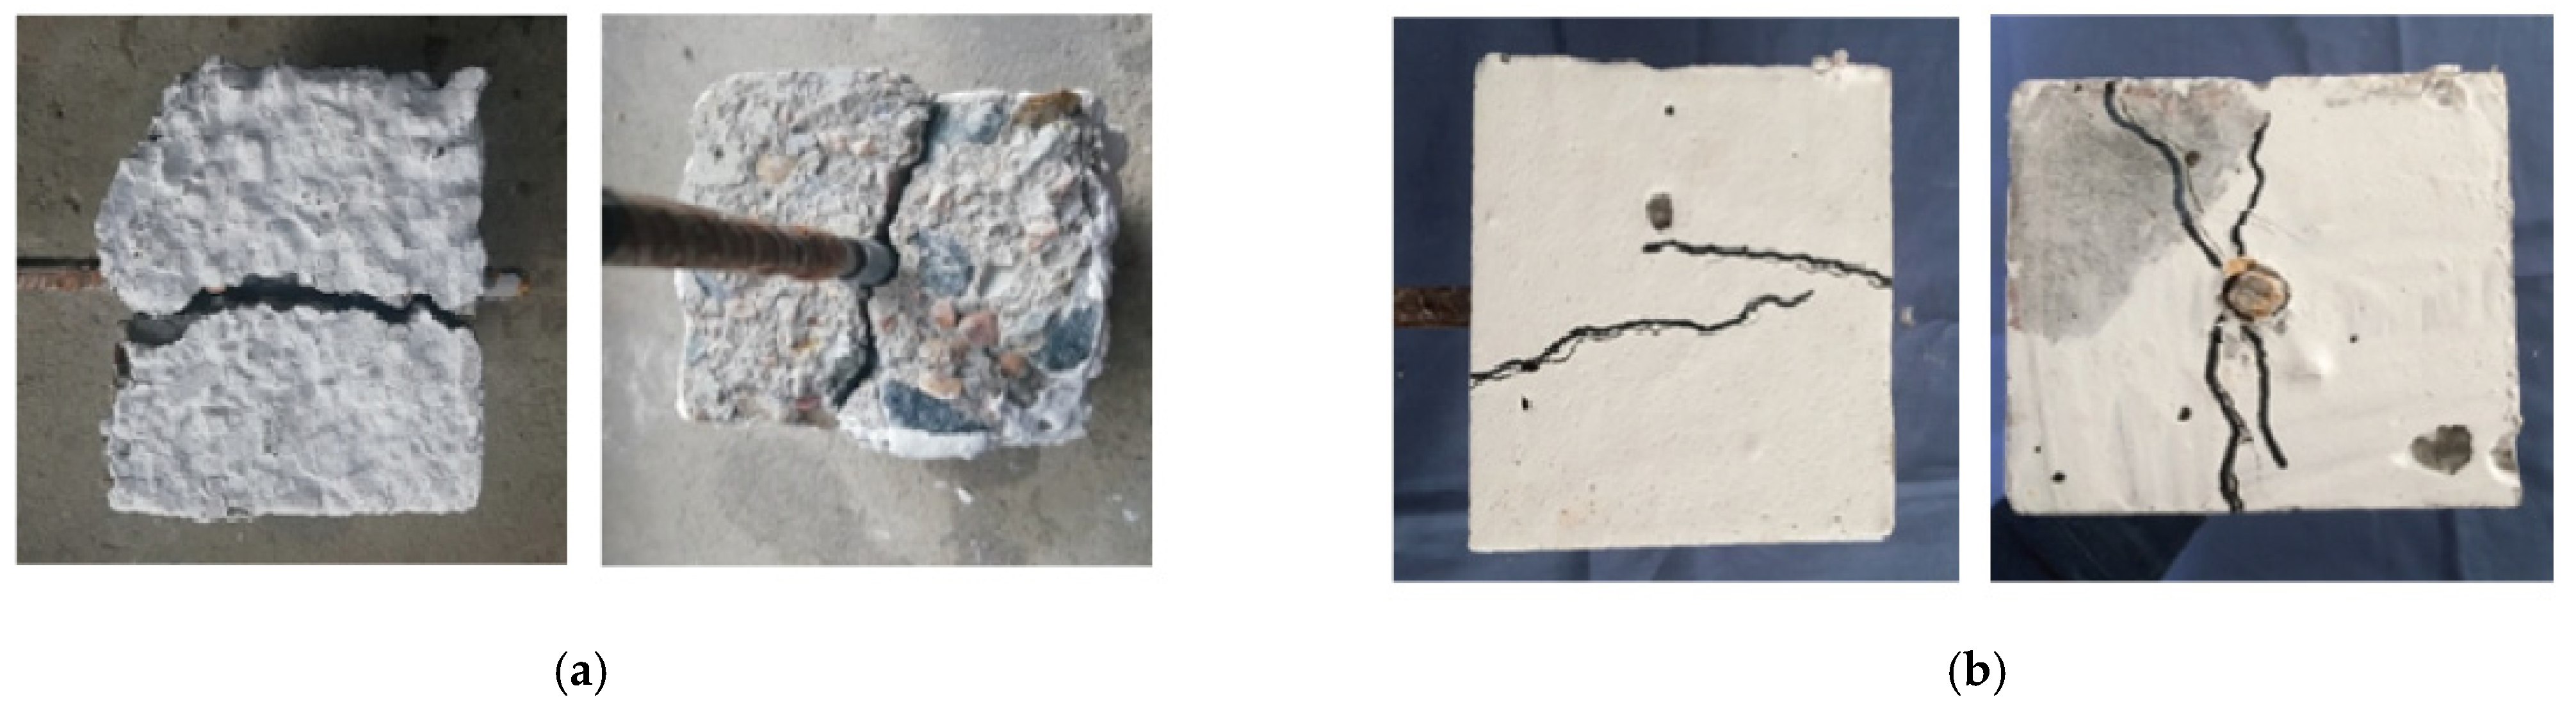
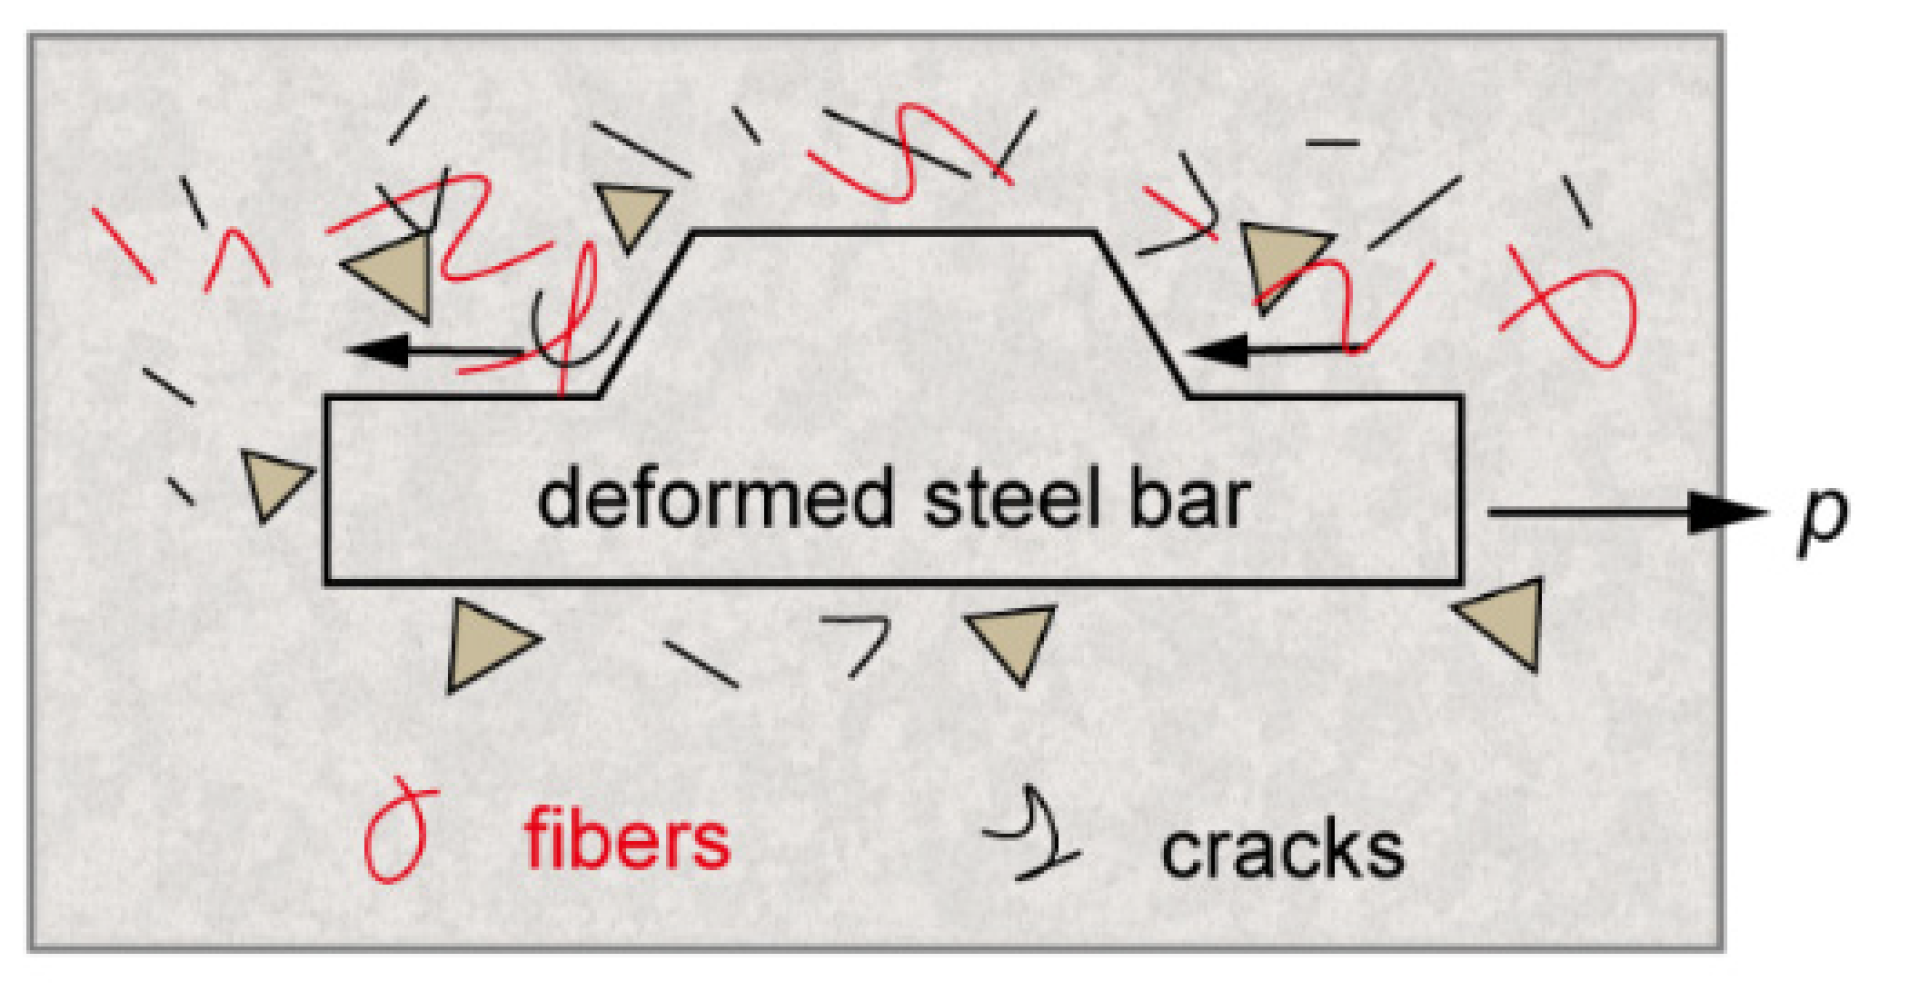
3.1. Failure Modes
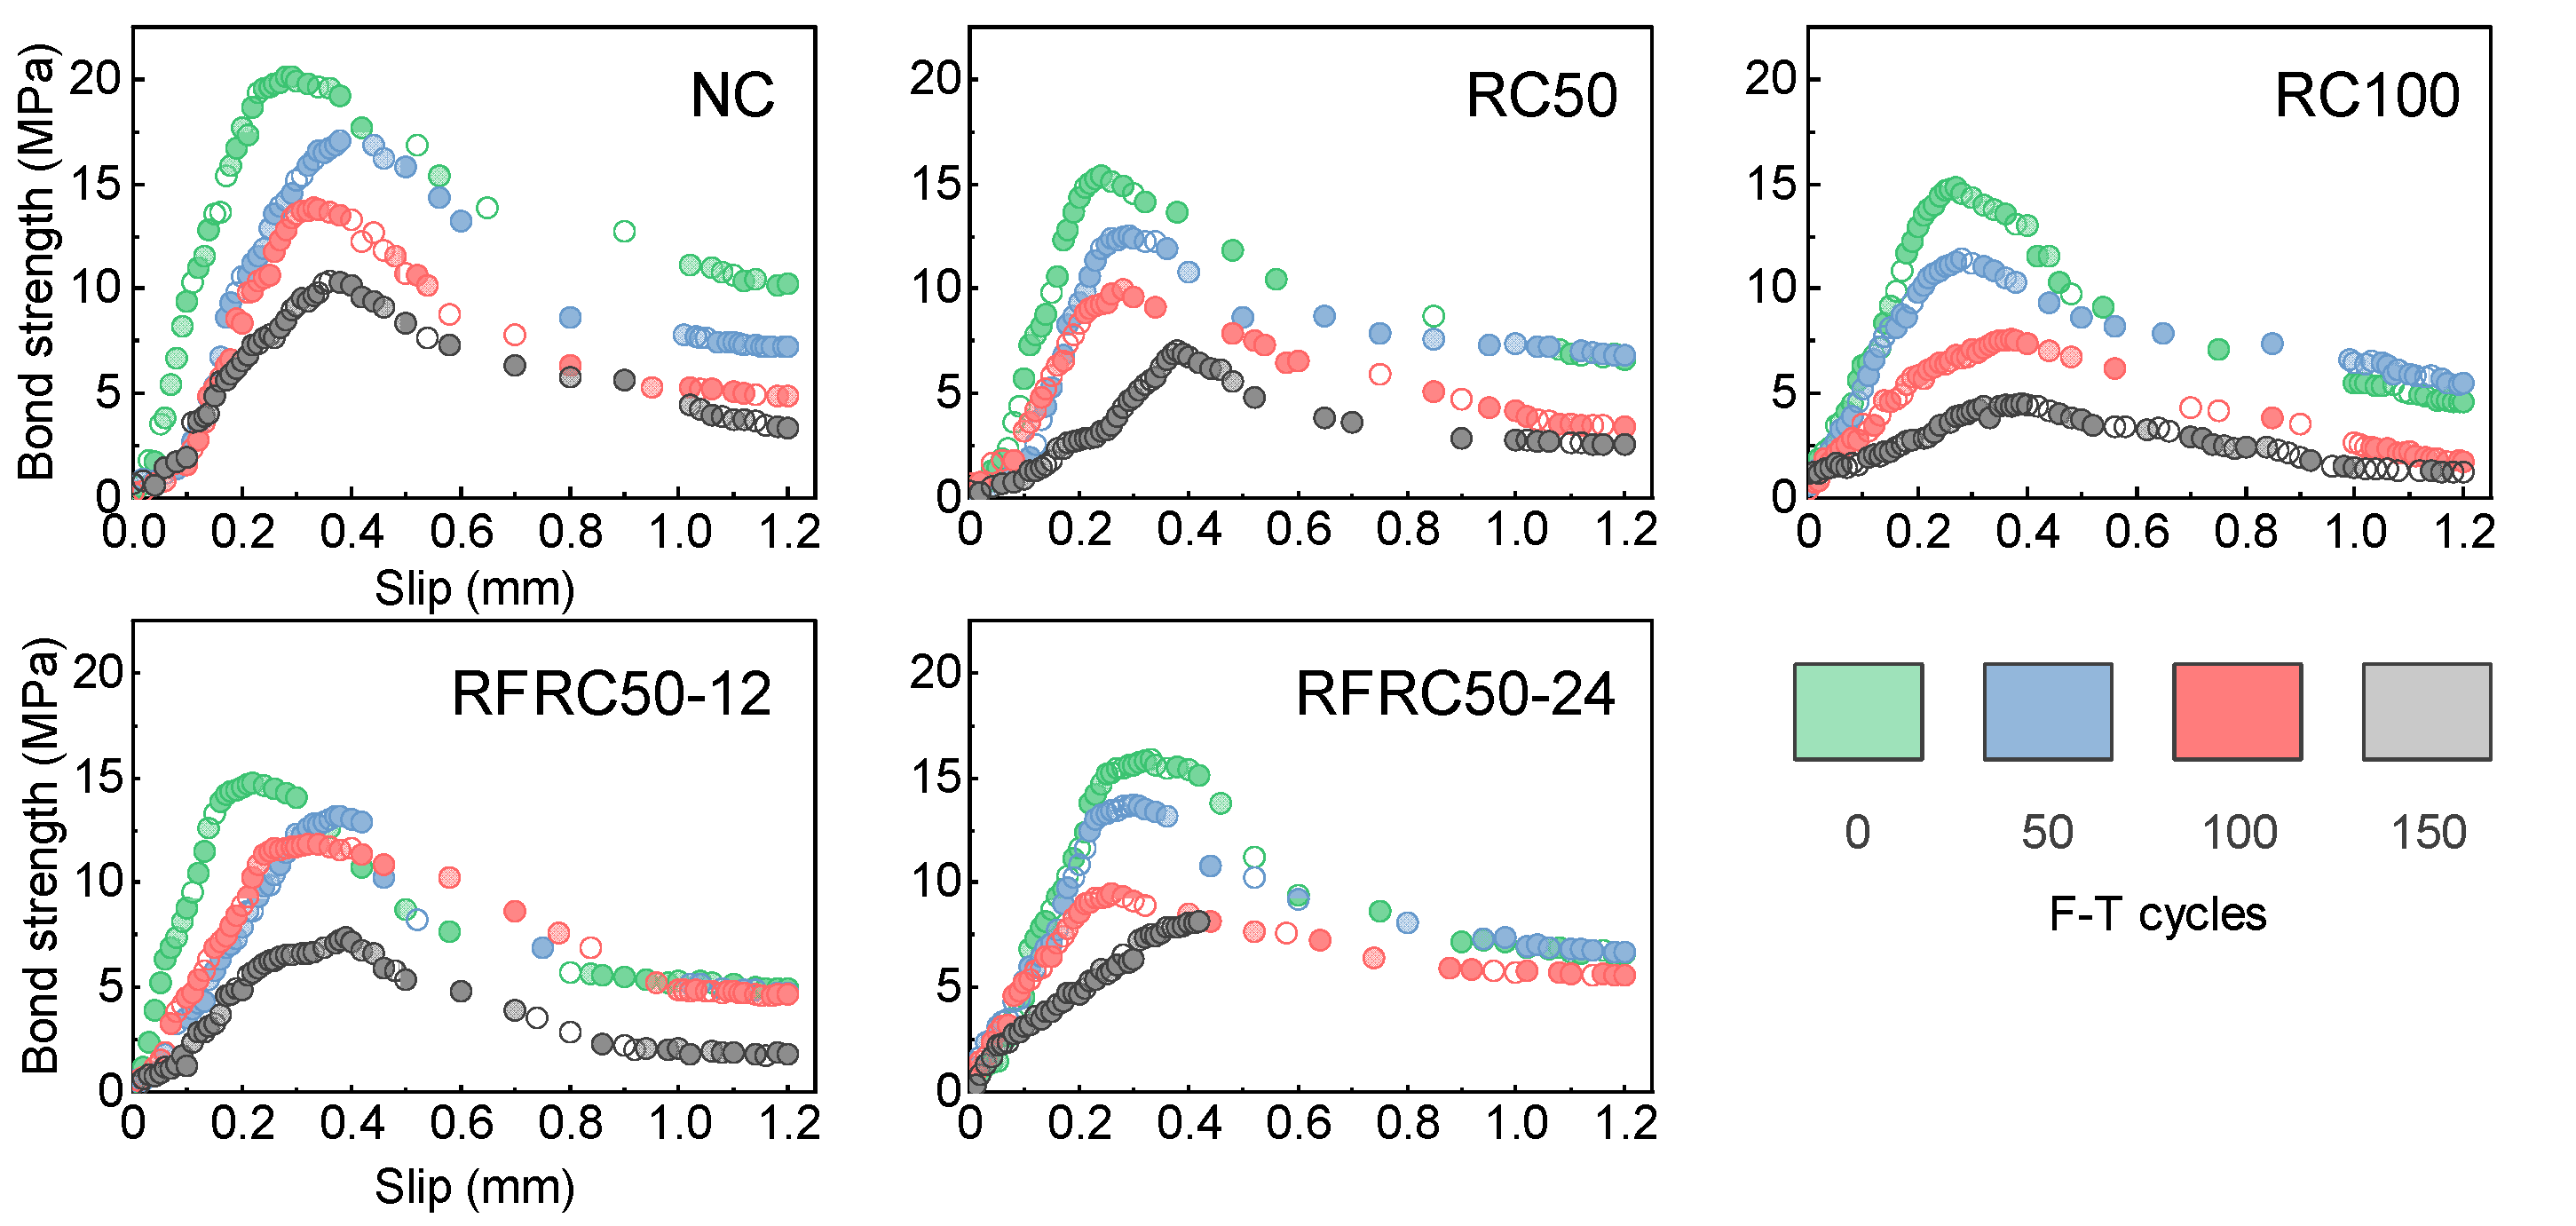
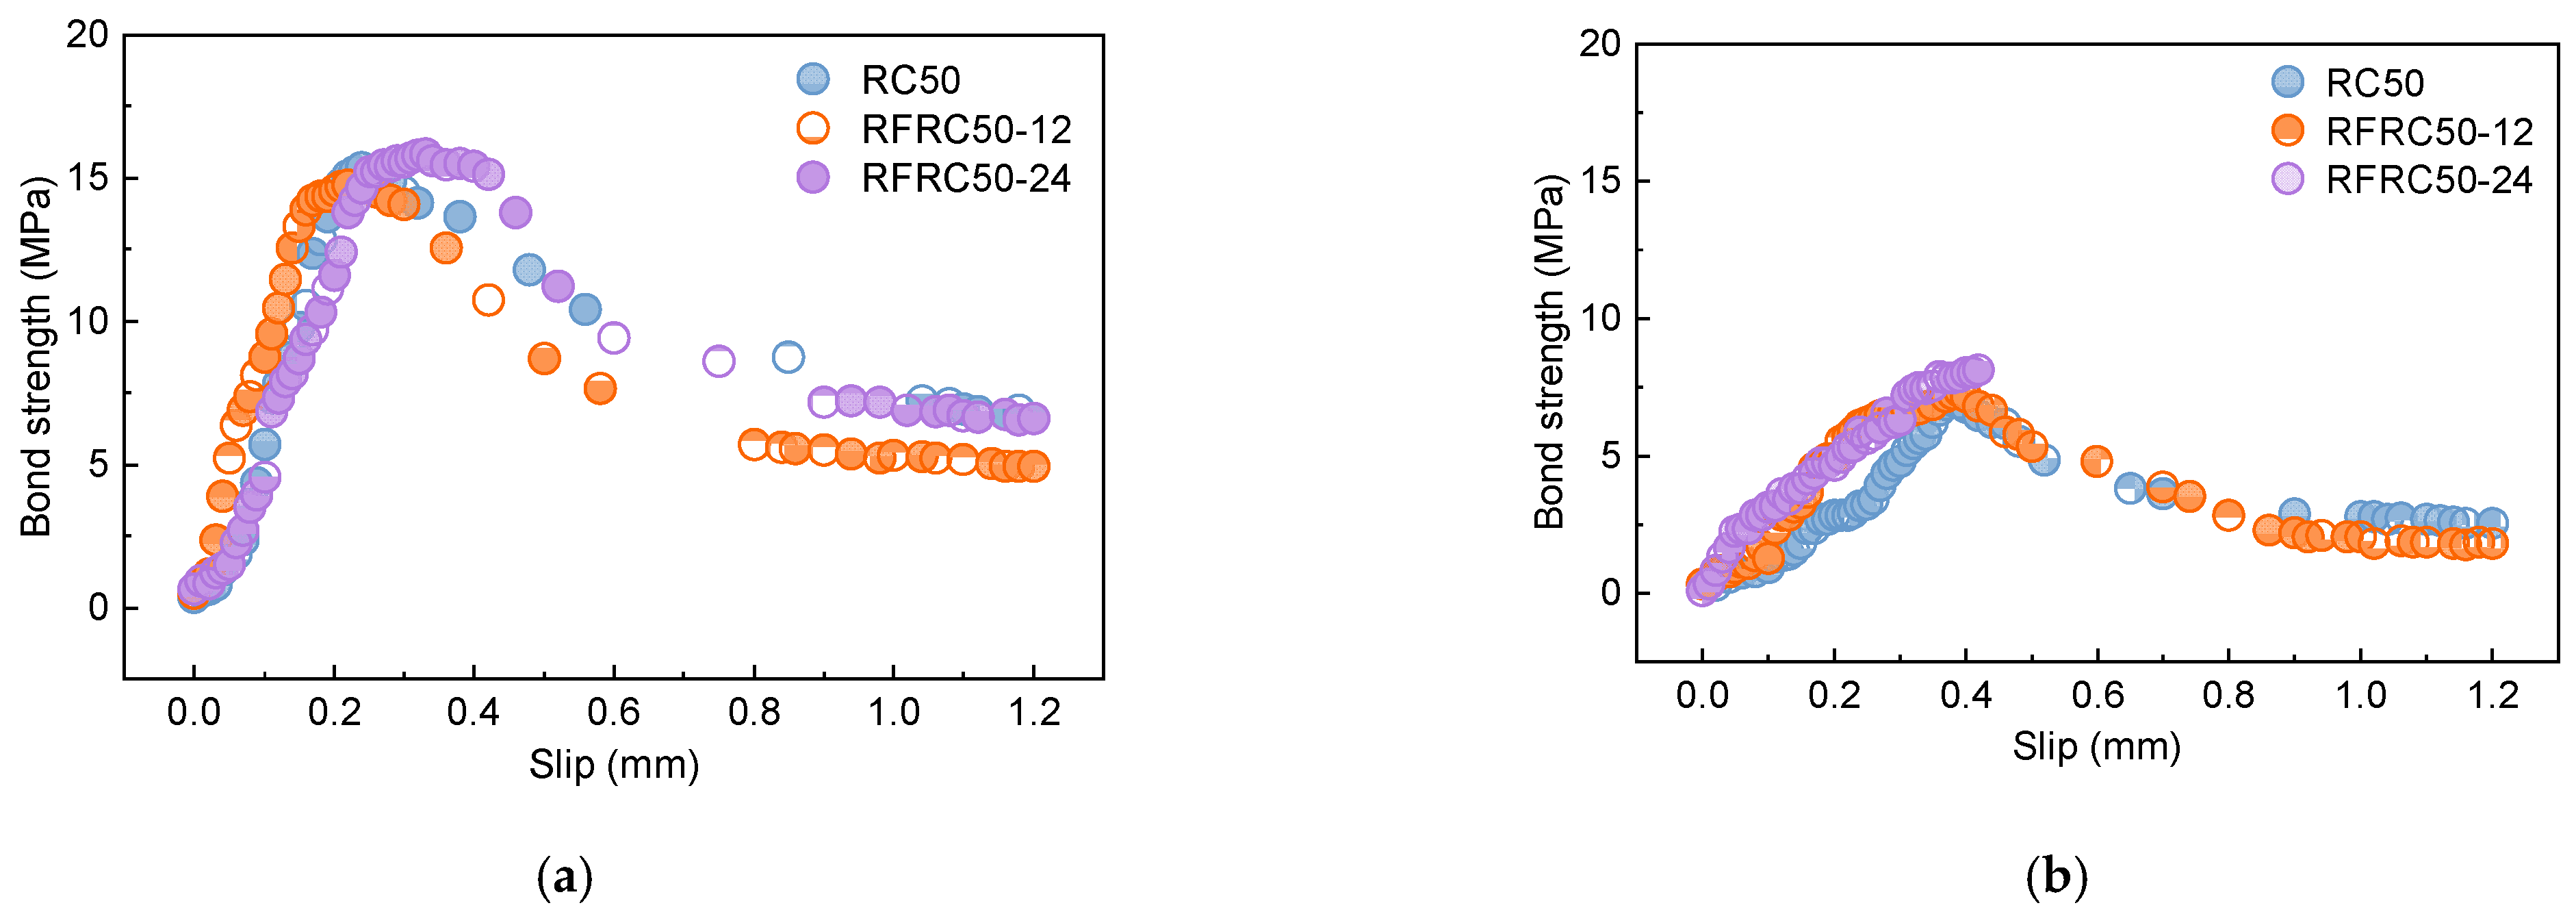
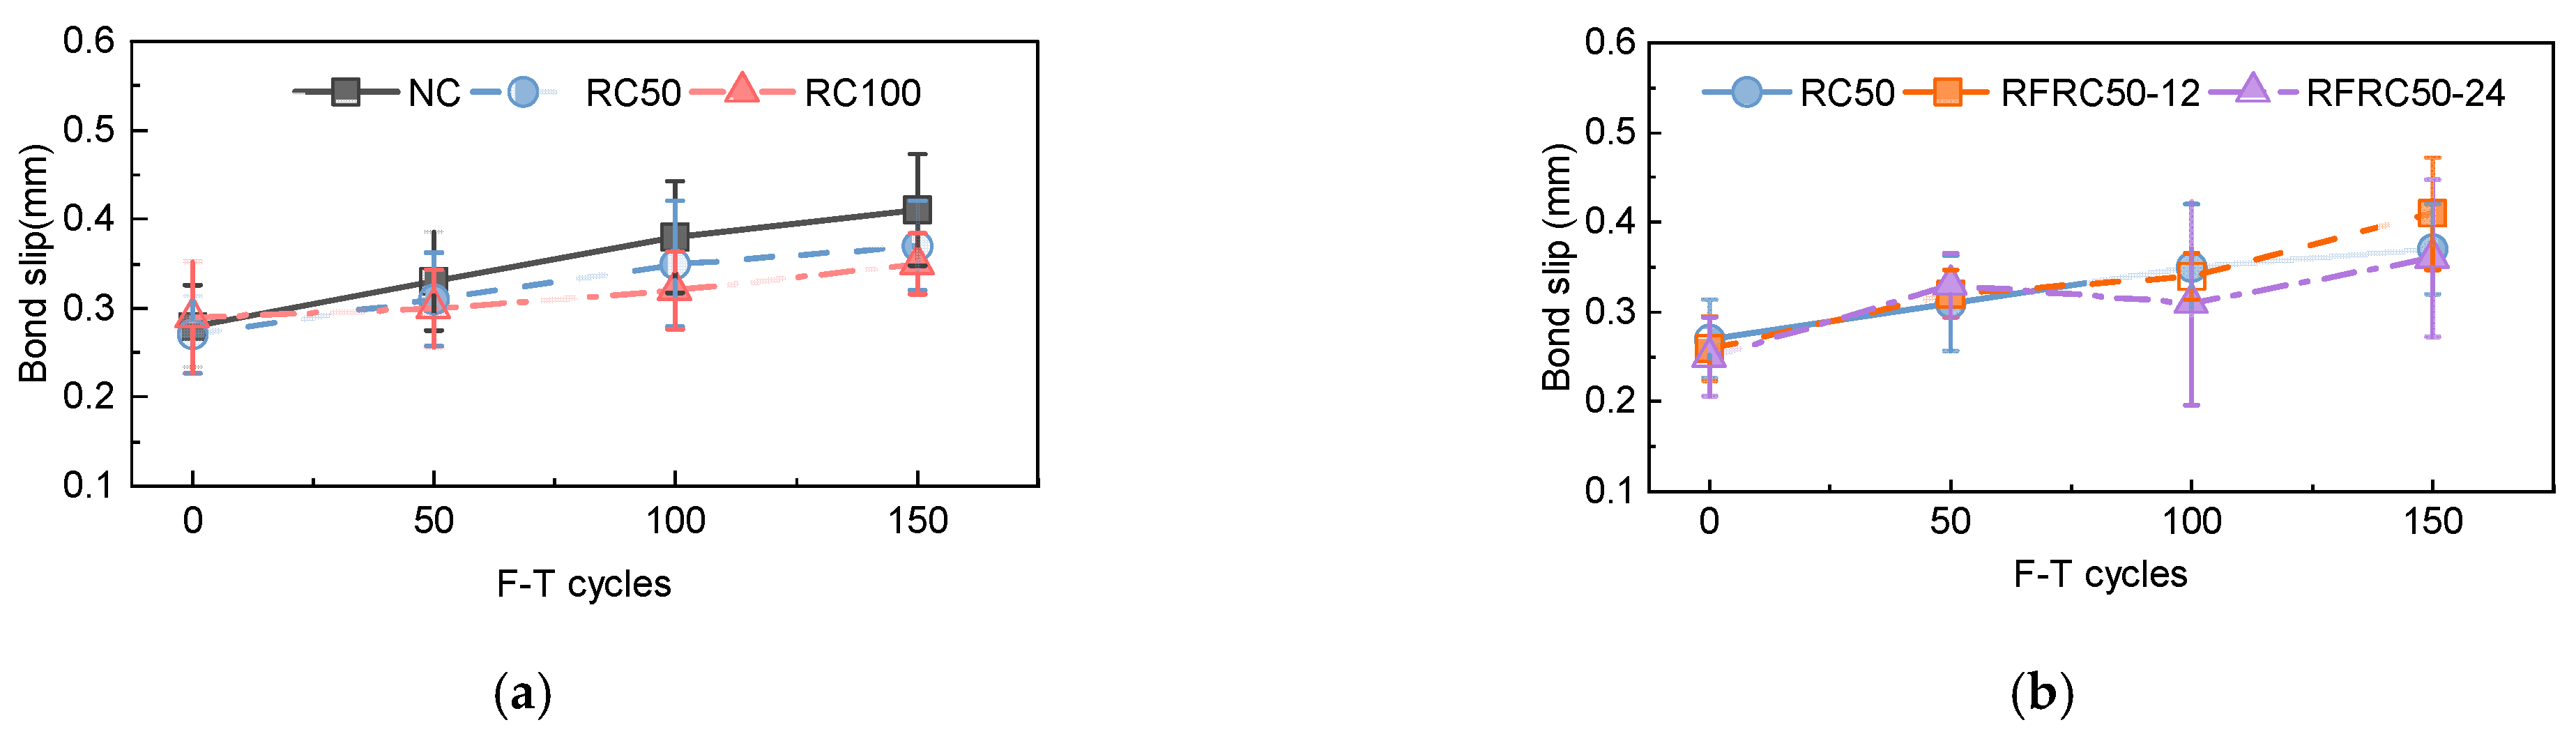
3.2. Bond Strength and Bond Slip
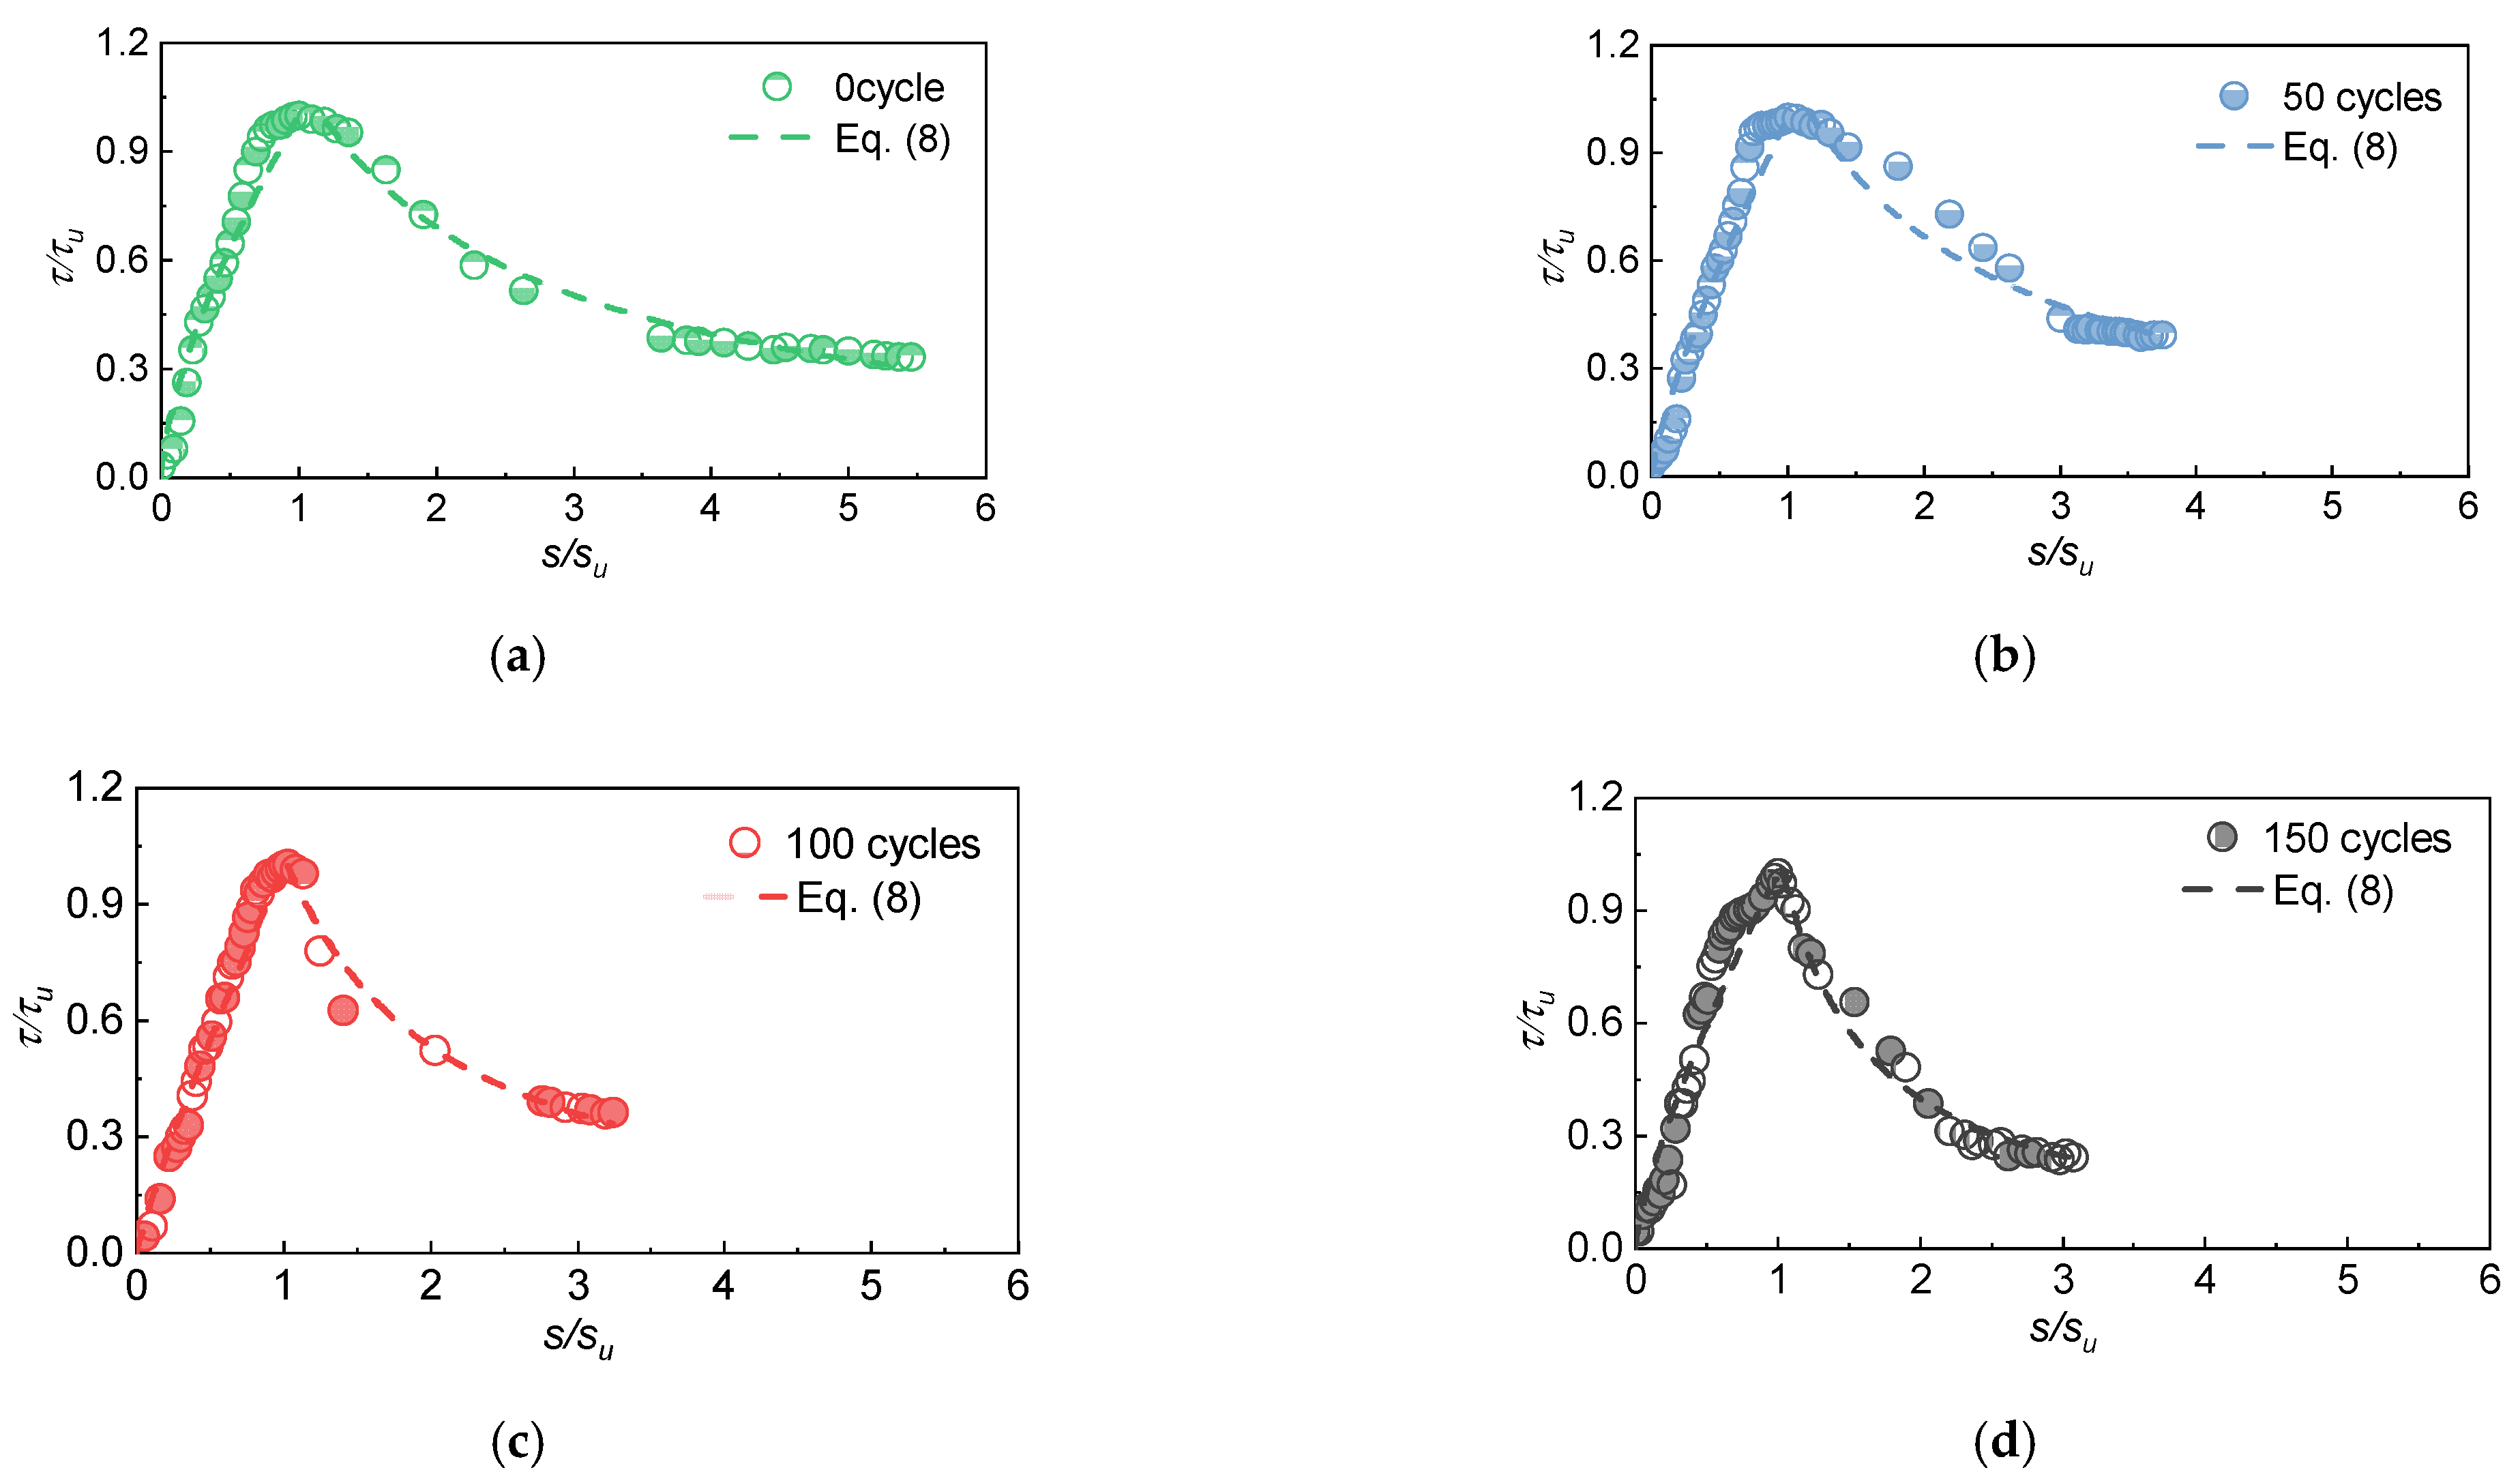
3.3. Bond-Slip Curves
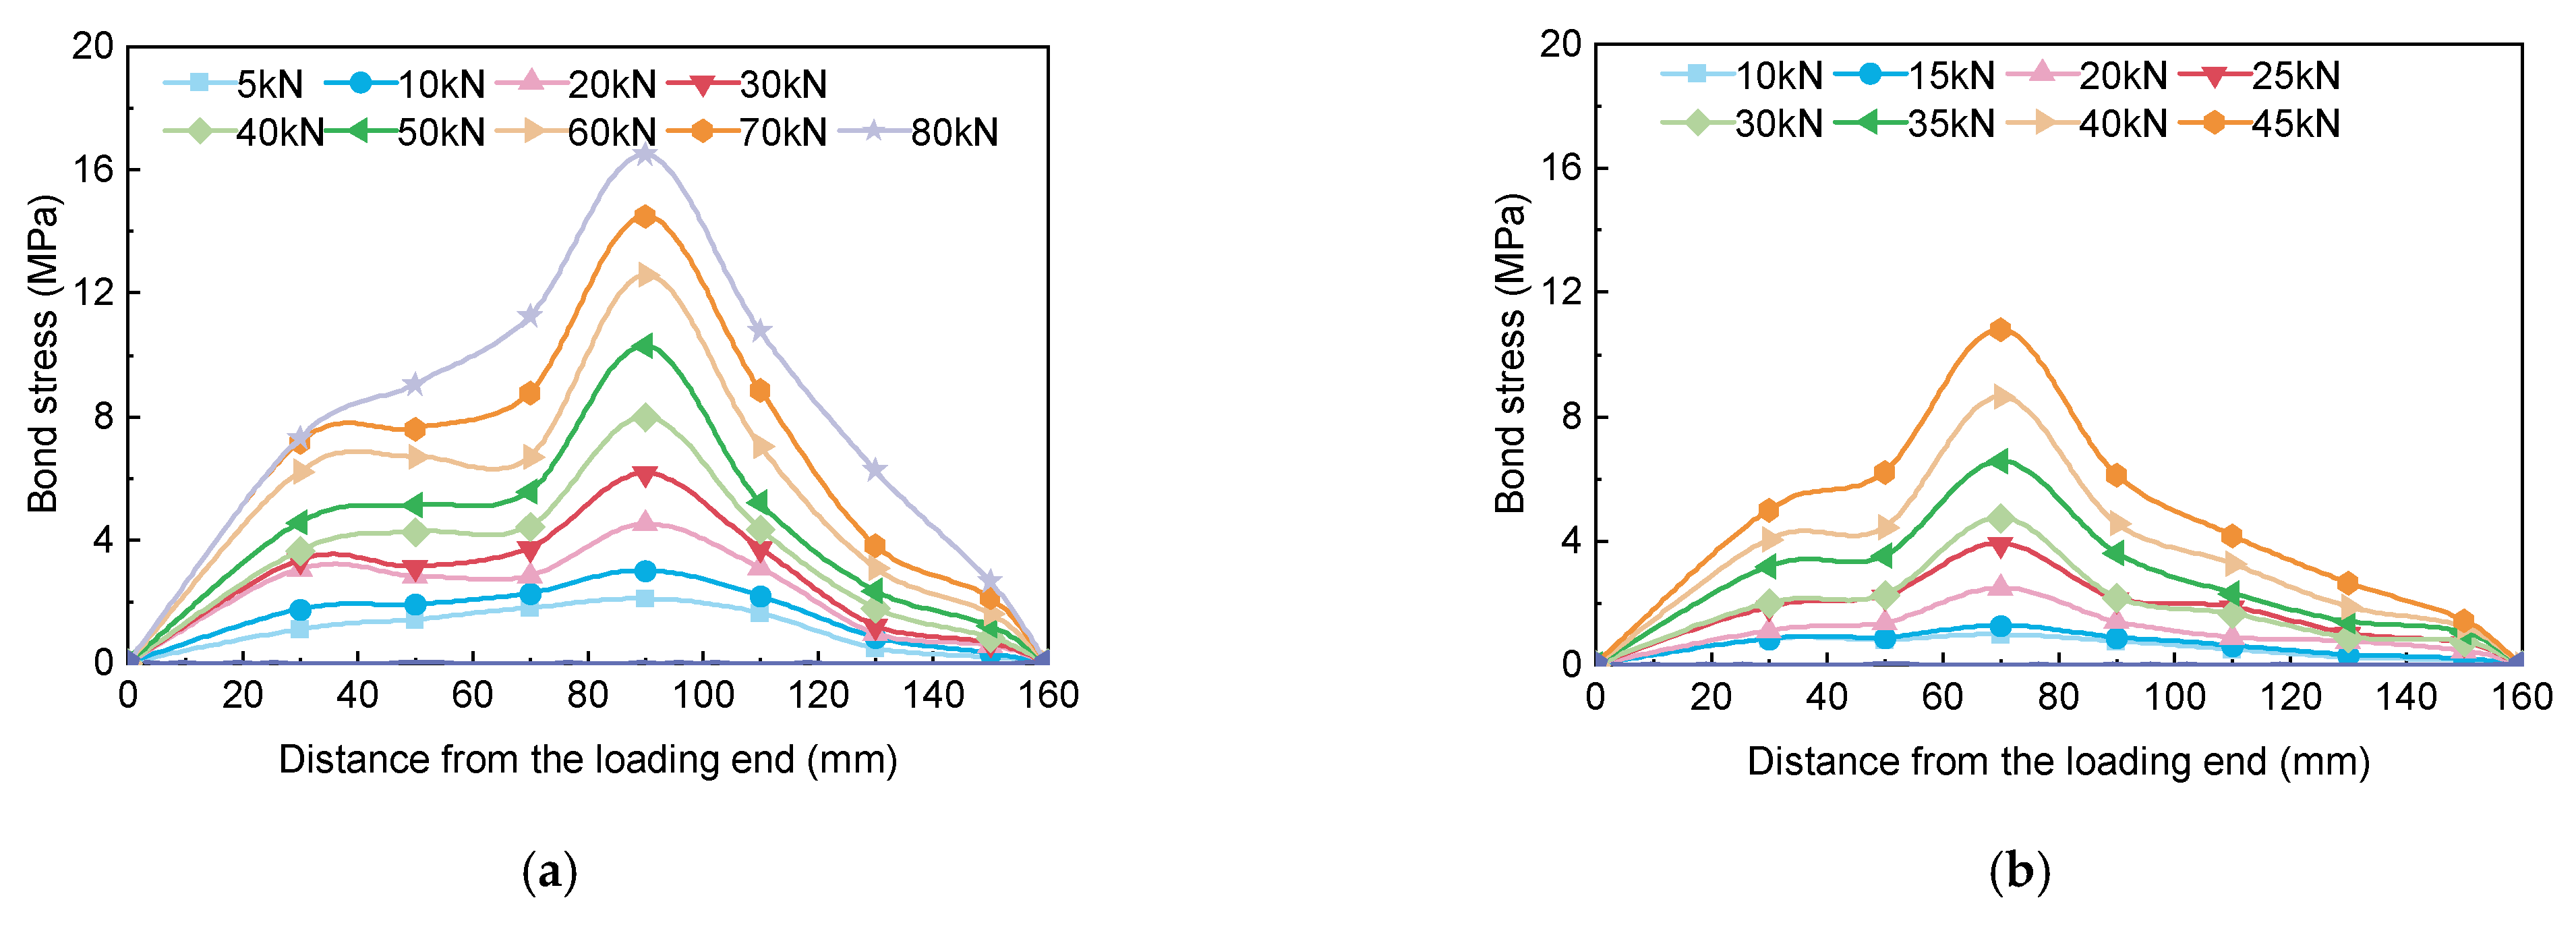
3.4. Bond Stress Distribution
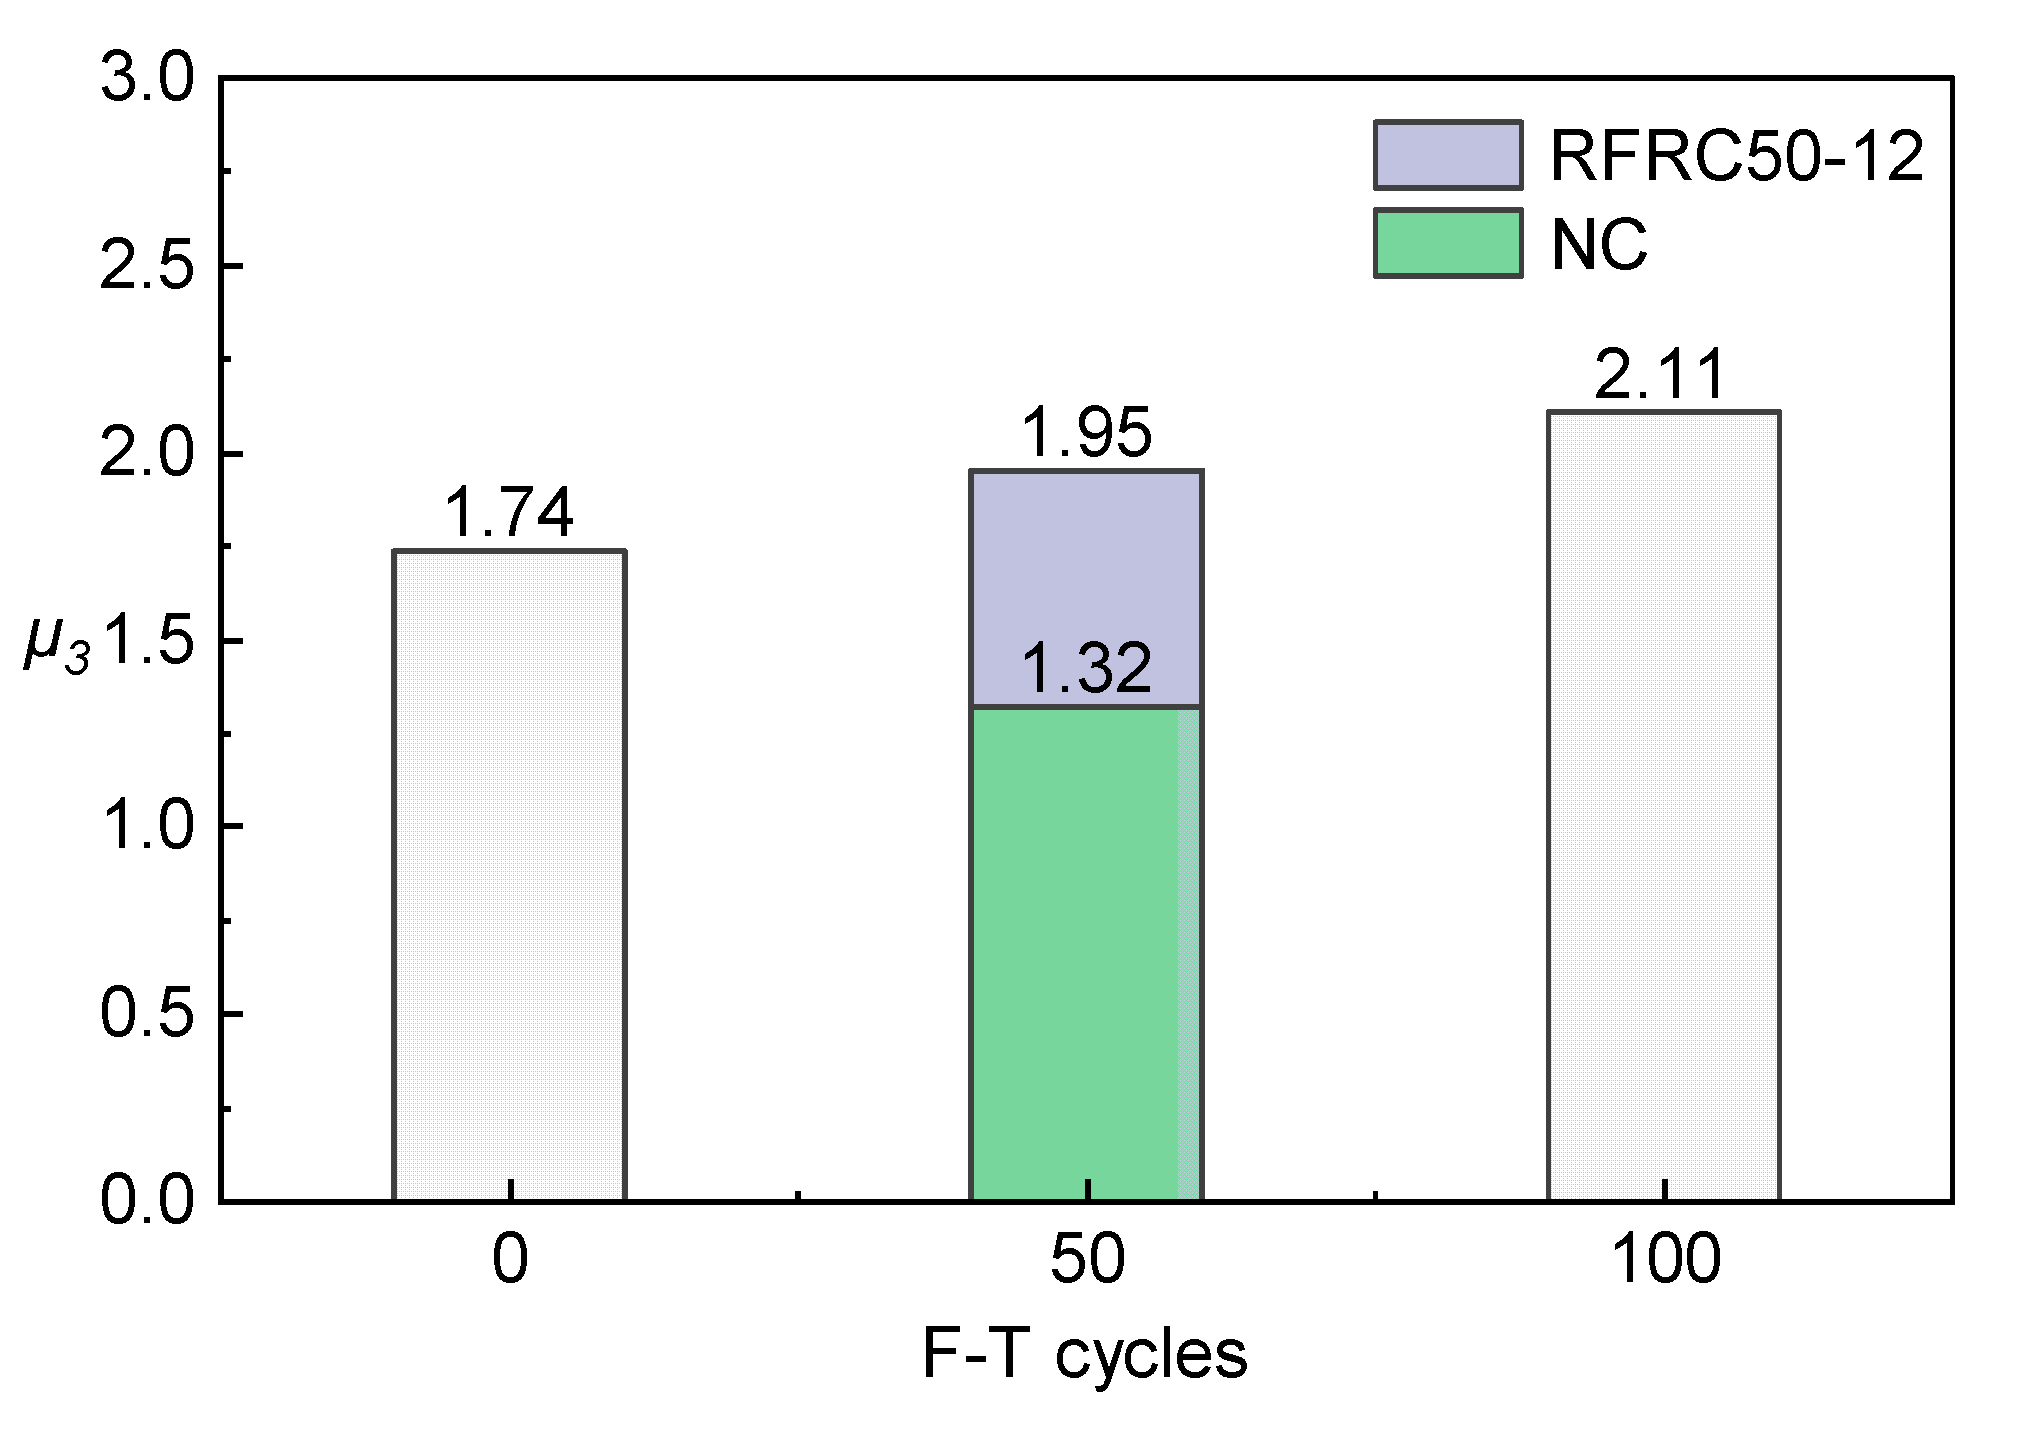
3.5. Freeze-Thaw Damage Mechanism of Bond Stress
3.6. Bond Stress-Slip Model for RFRC
4. Conclusions
- (1)
- The bond strength decreases as the number of F-T cycles increases, whether there are natural or recycled aggregates. For fixed F-T cycles, the bond strength loss of natural aggregates was less than that of recycled aggregate concrete. Compared with F-T cycles, the effect of recycled aggregates’ replacement rate on bond strength was not significant; RC50 bond strength is 95% of NC.
- (2)
- The addition of fibers slows down the generation and development of cracks, and it promotes the bond performance under F-T conditions and the optimal dosing of 0.12% in this test.
- (3)
- The NC bond stress distribution is bimodal, the recycled concrete bond-stress distribution is unimodal, that is, the addition of recycled aggregates increases the unevenness of the bond stress. Moreover, the pullout force increases, and the local stress concentration is obvious.
- (4)
- A simplified two-phase bond-slip model is proposed to characterize the bond performance between RFRC and reinforcement after F-T cycles, as it correlates well with the test results.
Author Contributions
Funding
Data Availability Statement
Conflicts of Interest
References
- Wang, F.; Wu, X.; Guo, C.; Song, W. Experimental Study on Bond Strength of Deformed Steel Bars in Recycled Glass Aggregate Concrete. KSCE J. Civ. Eng. 2018, 22, 3409–3418. [Google Scholar] [CrossRef]
- Omrane, M.; Kenai, S.; Kadri, E.-H.; Aït-Mokhtar, A. Performance and Durability of Self Compacting Concrete Using Recycled Concrete Aggregates and Natural Pozzolan. J. Clean. Prod. 2017, 165, 415–430. [Google Scholar] [CrossRef]
- Aslani, F.; Ma, G.; Wan, D.L.Y.; Muselin, G. Development of High-Performance Self-Compacting Concrete Using Waste Recycled Concrete Aggregates and Rubber Granules. J. Clean. Prod. 2018, 182, 553–566. [Google Scholar] [CrossRef]
- Revilla-Cuesta, V.; Skaf, M.; Faleschini, F.; Manso, J.M.; Ortega-López, V. Self-Compacting Concrete Manufactured with Recycled Concrete Aggregate: An Overview. J. Clean. Prod. 2020, 262, 121362. [Google Scholar] [CrossRef]
- Prince, M.J.R.; Singh, B. Bond Behaviour of Normal- and High-Strength Recycled Aggregate Concrete. Struct. Concr. 2015, 16, 56–70. [Google Scholar] [CrossRef]
- Han, Y.; Yang, Z.; Ding, T.; Xiao, J. Environmental and Economic Assessment on 3D Printed Buildings with Recycled Concrete. J. Clean. Prod. 2021, 278, 123884. [Google Scholar] [CrossRef]
- Kim, S.-W.; Yun, H.-D.; Park, W.-S.; Jang, Y.-I. Bond Strength Prediction for Deformed Steel Rebar Embedded in Recycled Coarse Aggregate Concrete. Mater. Des. 2015, 83, 257–269. [Google Scholar] [CrossRef]
- Arezoumandi, M.; Looney, T.J.; Volz, J.S. Effect of Fly Ash Replacement Level on the Bond Strength of Reinforcing Steel in Concrete Beams. J. Clean. Prod. 2015, 87, 745–751. [Google Scholar] [CrossRef]
- Ma, Y.; Guo, Z.; Wang, L.; Zhang, J. Experimental Investigation of Corrosion Effect on Bond Behavior between Reinforcing Bar and Concrete. Constr. Build. Mater. 2017, 152, 240–249. [Google Scholar] [CrossRef]
- Butler, L.; West, J.; Tighe, S. The Effect of Recycled Concrete Aggregate Properties on the Bond Strength between RCA Concrete and Steel Reinforcement. Cem. Concr. Res. 2011, 41, 1037–1049. [Google Scholar] [CrossRef]
- Cao, F.B.; Li, F.Y. Coarse Aggregate Replacement Ratio on the Properties of Recycled Concrete Bonding Effect. Adv. Mater. Res. 2014, 926–930, 533–536. [Google Scholar] [CrossRef]
- Kim, S.-W.; Yun, H.-D. Evaluation of the Bond Behavior of Steel Reinforcing Bars in Recycled Fine Aggregate Concrete. Cem. Concr. Compos. 2014, 46, 8–18. [Google Scholar] [CrossRef]
- Shima, H.; Chou, L.-L.; Okamura, H. Micro and Macro Models for Bond in Reinforced Concrete. J. Fac. Eng. 1987, 39, 133–194. [Google Scholar]
- Kankam, C.K. Relationship of Bond Stress, Steel Stress, and Slip in Reinforced Concrete. J. Struct. Eng. 1997, 123, 79–85. [Google Scholar] [CrossRef]
- Seara-Paz, S.; González-Fonteboa, B.; Eiras-López, J.; Herrador, M.F. Bond Behavior between Steel Reinforcement and Recycled Concrete. Mater. Struct. 2014, 47, 323–334. [Google Scholar] [CrossRef]
- Guizani, L.; Chaallal, O.; Mousavi, S.S. Local Bond Stress-Slip Model for Reinforced Concrete Joints and Anchorages with Moderate Confinement. Can. J. Civ. Eng. 2017, 44, 201–211. [Google Scholar] [CrossRef]
- Gao, X.; Li, N.; Ren, X. Analytic Solution for the Bond Stress-Slip Relationship between Rebar and Concrete. Constr. Build. Mater. 2019, 197, 385–397. [Google Scholar] [CrossRef]
- Hu, X.; Peng, G.; Niu, D.; Zhao, N. Bond Characteristics of Deformed Steel Bar in Early-Age Frozen Concrete during Service Period. Eng. Struct. 2019, 197, 109438. [Google Scholar] [CrossRef]
- Pei, P.; Zheng, S.; Zhang, Y.; Dong, L. Overview on the Bonding of Reinforced Concrete under Pristine, Corrosive and Freeze-Thaw Conditions. J. Adhes. Sci. Technol. 2019, 33, 761–789. [Google Scholar] [CrossRef]
- Shang, H.; Zhao, T.; Cao, W. Bond Behavior between Steel Bar and Recycled Aggregate Concrete after Freeze–Thaw Cycles. Cold Reg. Sci. Technol. 2015, 118, 38–44. [Google Scholar] [CrossRef]
- Hanjari, K.Z.; Utgenannt, P.; Lundgren, K. Experimental Study of the Material and Bond Properties of Frost-Damaged Concrete. Cem. Concr. Res. 2011, 41, 244–254. [Google Scholar] [CrossRef] [Green Version]
- Liu, X.; Liu, Y.; Wu, T.; Wei, H. Bond-Slip Properties between Lightweight Aggregate Concrete and Rebar. Constr. Build. Mater. 2020, 255, 119355. [Google Scholar] [CrossRef]
- Shi, J.; Zhu, H.; Wu, Z.; Seracino, R.; Wu, G. Bond Behavior between Basalt Fiber–Reinforced Polymer Sheet and Concrete Substrate under the Coupled Effects of Freeze-Thaw Cycling and Sustained Load. J. Compos. Constr. 2013, 17, 530–542. [Google Scholar] [CrossRef]
- Huaishuai, S.; Zhiheng, W.; Peng, Z.; Tiejun, Z.; Guoxi, F.; Guosheng, R. Bond Behavior of Steel Bar in Air-Entrained RCAC in Fresh Water and Sea Water after Fast Freeze-Thaw Cycles. Cold Reg. Sci. Technol. 2017, 135, 90–96. [Google Scholar] [CrossRef]
- Wang, Z.; Zeng, Q.; Wang, L.; Yao, Y.; Li, K. Corrosion of Rebar in Concrete under Cyclic Freeze–Thaw and Chloride Salt Action. Constr. Build. Mater. 2014, 53, 40–47. [Google Scholar] [CrossRef]
- Ren, G.; Shang, H.; Zhang, P.; Zhao, T. Bond Behaviour of Reinforced Recycled Concrete after Rapid Freezing-Thawing Cycles. Cold Reg. Sci. Technol. 2019, 157, 133–138. [Google Scholar] [CrossRef]
- Zareei, S.A.; Ameri, F.; Bahrami, N.; Shoaei, P.; Musaeei, H.R.; Nurian, F. Green High Strength Concrete Containing Recycled Waste Ceramic Aggregates and Waste Carpet Fibers: Mechanical, Durability, and Microstructural Properties. J. Build. Eng. 2019, 26, 100914. [Google Scholar] [CrossRef]
- Wu, X.; Zhou, J.; Kang, T.; Wang, F.; Ding, X.; Wang, S. Laboratory Investigation on the Shrinkage Cracking of Waste Fiber-Reinforced Recycled Aggregate Concrete. Materials 2019, 12, 1196. [Google Scholar] [CrossRef] [PubMed] [Green Version]
- Liu, Z.; Lu, Y.; Li, S.; Zong, S.; Yi, S. Flexural Behavior of Steel Fiber Reinforced Self-Stressing Recycled Aggregate Concrete-Filled Steel Tube. J. Clean. Prod. 2020, 274, 122724. [Google Scholar] [CrossRef]
- Merli, R.; Preziosi, M.; Acampora, A.; Lucchetti, M.C.; Petrucci, E. Recycled Fibers in Reinforced Concrete: A Systematic Literature Review. J. Clean. Prod. 2020, 248, 119207. [Google Scholar] [CrossRef]
- Domski, J.; Katzer, J.; Zakrzewski, M.; Ponikiewski, T. Comparison of the Mechanical Characteristics of Engineered and Waste Steel Fiber Used as Reinforcement for Concrete. J. Clean. Prod. 2017, 158, 18–28. [Google Scholar] [CrossRef]
- Gao, D.; Yan, H.; Fang, D.; Yang, L. Bond Strength and Prediction Model for Deformed Bar Embedded in Hybrid Fiber Reinforced Recycled Aggregate Concrete. Constr. Build. Mater. 2020, 265, 120337. [Google Scholar] [CrossRef]
- Khan, M.; Ali, M. Effectiveness of Hair and Wave Polypropylene Fibers for Concrete Roads. Constr. Build. Mater. 2018, 166, 581–591. [Google Scholar] [CrossRef]
- Afroughsabet, V.; Biolzi, L.; Monteiro, P.J.M. The Effect of Steel and Polypropylene Fibers on the Chloride Diffusivity and Drying Shrinkage of High-Strength Concrete. Compos. Part B Eng. 2018, 139, 84–96. [Google Scholar] [CrossRef]
- Di Maida, P.; Radi, E.; Sciancalepore, C.; Bondioli, F. Pullout Behavior of Polypropylene Macro-Synthetic Fibers Treated with Nano-Silica. Constr. Build. Mater. 2015, 82, 39–44. [Google Scholar] [CrossRef] [Green Version]
- Zhou, J.; Kang, T.; Wang, F. The Permeability of Waste Fiber Recycled Concrete. Mater. Sci. 2019, 26, 210–217. [Google Scholar] [CrossRef] [Green Version]
- Mohammadhosseini, H.; Awal, A.S.M.A.; Yatim, J.B.M. The Impact Resistance and Mechanical Properties of Concrete Reinforced with Waste Polypropylene Carpet Fibres. Constr. Build. Mater. 2017, 143, 147–157. [Google Scholar] [CrossRef]
- Kurad, R.; Silvestre, J.D.; de Brito, J.; Ahmed, H. Effect of Incorporation of High Volume of Recycled Concrete Aggregates and Fly Ash on the Strength and Global Warming Potential of Concrete. J. Clean. Prod. 2017, 166, 485–502. [Google Scholar] [CrossRef]
- Chinese National Standard. GB175-2018 Common Portland Cement; Standards Press of China: Beijing, China, 2018. (In Chinese) [Google Scholar]
- Chinese National Standard. GB/T 25177-2010 Recycled Coarse Aggregate for Concrete; Standards Press of China: Beijing, China, 2010. (In Chinese) [Google Scholar]
- Chinese National Standard. GB/T 14685-2011 Pebble and Crushed Stone for Construction; Standards Press of China: Beijing, China, 2011. (In Chinese) [Google Scholar]
- Chinese Local Standard. DG/T J08-2018 Technical Specification for the Application of Recycled Concrete; Standards Press of China: Shanghai, China, 2018. (In Chinese) [Google Scholar]
- Liu, S.; Du, M.; Tian, Y.; Wang, X.; Sun, G. Bond Behavior of Reinforced Concrete Considering Freeze–Thaw Cycles and Corrosion of Stirrups. Materials 2021, 14, 4732. [Google Scholar] [CrossRef] [PubMed]
- Tang, C.-W. Modeling Uniaxial Bond Stress–Slip Behavior of Reinforcing Bars Embedded in Concrete with Different Strengths. Materials 2021, 14, 783. [Google Scholar] [CrossRef]
- Chinese National Standard. GB/T50082-2009 Standard for Test Methods of Long-Term Performance and Durability of Ordinary Concrete; Standards Press of China: Beijing, China, 2009. (In Chinese) [Google Scholar]
- Chinese National Standard. GB/T 50152-2012 Standard for Test Method of Concrete Structures; Standards Press of China: Beijing, China, 2012. (In Chinese) [Google Scholar]
- Xiao, J.; Falkner, H. Bond Behaviour between Recycled Aggregate Concrete and Steel Rebars. Constr. Build. Mater. 2007, 21, 395–401. [Google Scholar] [CrossRef]
- Prince, M.J.R.; Singh, B. Bond Behaviour of Deformed Steel Bars Embedded in Recycled Aggregate Concrete. Constr. Build. Mater. 2013, 49, 852–862. [Google Scholar] [CrossRef]
- Shao, Y.; Lefort, T.; Moras, S.; Rodriguez, D. Studies on Concrete Containing Ground Waste Glass. Cem. Concr. Res. 2000, 30, 91–100. [Google Scholar] [CrossRef]


| Type | Apparent Density (kg/m3) | Bulk Density (kg/m3) | Water Absorption (%) | Bulk Density (kg/m3) |
|---|---|---|---|---|
| Natural | 2730 | 1850 | 1.12 | 6.4 |
| Recycled | 2460 | 1275 | 4.36 | 17.0 |
| Grade | Apparent Density (kg/m3) | Diameter (mm) | Yield Strength (MPa) | Tensile Strength (MPa) |
|---|---|---|---|---|
| HRB400 | ribbed | 10 | 542 | 714 |
| HRB400 | ribbed | 16 | 566 | 710 |
| Notion | RF (%) | Amount of Material (kg·m−3) | |||
|---|---|---|---|---|---|
| Cement | Sand | NA | RA | ||
| NC 1 | 0 | 390 | 709 | 1156 | 0 |
| RC50 | 0 | 390 | 709 | 578 | 578 |
| RC100 | 0 | 390 | 709 | 0 | 1156 |
| RFRC50-12 | 0.12 | 390 | 709 | 578 | 578 |
| RFRC50-24 | 0.24 | 390 | 709 | 578 | 578 |
| Notion | F-T Cycles | Failure Mode | Ultimate Load (kN) | Bond Strength (MPa) | Bond Slip (mm) |
|---|---|---|---|---|---|
| NC | 0 | S-P | 30.83 | 19.63 | 0.28 |
| 50 | S-P | 26.09 | 16.61 | 0.33 | |
| 100 | S-P | 22.51 | 14.33 | 0.38 | |
| 150 | S-P | 16.89 | 10.75 | 0.41 | |
| RC50 | 0 | S-P | 22.7 | 14.45 | 0.27 |
| 50 | S-P | 19.52 | 12.43 | 0.31 | |
| 100 | S-P | 15.87 | 10.1 | 0.35 | |
| 150 | S-P | 11.62 | 7.4 | 0.37 | |
| RC100 | 0 | S-P | 20.64 | 13.14 | 0.29 |
| 50 | S-P | 17.64 | 11.23 | 0.3 | |
| 100 | S-P | 12.82 | 8.16 | 0.32 | |
| 150 | 1S + 2S-P | 6.31 | 4.02 | 0.35 | |
| RFRC50-12 | 0 | S-P | 21.44 | 13.65 | 0.26 |
| 50 | S-P | 20.75 | 13.21 | 0.32 | |
| 100 | S-P | 16.24 | 10.34 | 0.34 | |
| 150 | S-P | 12.94 | 8.24 | 0.41 | |
| RFRC50-24 | 0 | S-P | 23.78 | 15.14 | 0.25 |
| 50 | S-P | 21.63 | 13.77 | 0.33 | |
| 100 | S-P | 15.41 | 9.81 | 0.31 | |
| 150 | 2S + 1S-P | 10.81 | 6.88 | 0.36 |
| Type | Number of F–T Cycles | Ascending Sections | Descending Sections | |
|---|---|---|---|---|
| A | a | b | ||
| NC | 0 | 0.74 | 3.09 | 2.02 |
| 50 | 0.98 | 1.33 | 0.16 | |
| 100 | 1.16 | 1.31 | 0.20 | |
| 150 | 0.90 | 1.23 | 0.15 | |
| RC50 | 0 | 1.09 | 2.98 | 1.9 |
| 50 | 1.23 | 3.41 | 2.48 | |
| 100 | 0.90 | 1.81 | 0.7 | |
| 150 | 1.51 | 1.07 | 0.07 | |
| RC100 | 0 | 0.84 | 1.55 | 0.45 |
| 50 | 0.71 | 3.21 | 2.22 | |
| 100 | 0.58 | 0.87 | −0.2 | |
| 150 | 0.60 | 0.96 | −0.1 | |
| RFRC5012 | 0 | 0.66 | 1.86 | 0.70 |
| 50 | 0.86 | 1.11 | 0.08 | |
| 100 | 0.77 | 1.65 | 0.47 | |
| 150 | 0.75 | 0.64 | −0.39 | |
| RFRC5024 | 0 | 0.80 | 1.58 | 0.5 |
| 50 | 0.79 | 2.54 | 1.55 | |
| 100 | 0.67 | 4.64 | 3.67 | |
| 150 | 0.66 | —— | —— | |
Publisher’s Note: MDPI stays neutral with regard to jurisdictional claims in published maps and institutional affiliations. |
© 2021 by the authors. Licensee MDPI, Basel, Switzerland. This article is an open access article distributed under the terms and conditions of the Creative Commons Attribution (CC BY) license (https://creativecommons.org/licenses/by/4.0/).
Share and Cite
Liu, Y.; Zhou, J.; Wu, D.; Kang, T.; Liu, A. Bond Behavior of Recycled Fiber Recycled Concrete with Reinforcement after Freeze-Thaw Cycles. Crystals 2021, 11, 1506. https://doi.org/10.3390/cryst11121506
Liu Y, Zhou J, Wu D, Kang T, Liu A. Bond Behavior of Recycled Fiber Recycled Concrete with Reinforcement after Freeze-Thaw Cycles. Crystals. 2021; 11(12):1506. https://doi.org/10.3390/cryst11121506
Chicago/Turabian StyleLiu, Yu, Jinghai Zhou, Di Wu, Tianbei Kang, and Aixia Liu. 2021. "Bond Behavior of Recycled Fiber Recycled Concrete with Reinforcement after Freeze-Thaw Cycles" Crystals 11, no. 12: 1506. https://doi.org/10.3390/cryst11121506
APA StyleLiu, Y., Zhou, J., Wu, D., Kang, T., & Liu, A. (2021). Bond Behavior of Recycled Fiber Recycled Concrete with Reinforcement after Freeze-Thaw Cycles. Crystals, 11(12), 1506. https://doi.org/10.3390/cryst11121506