Article

Microwave-Assisted Aldol Condensation of Furfural and Acetone over Mg–Al Hydrotalcite-Based Catalysts

DEQ, ETSEQ, Universitat Rovira i Virgili, Avinguda dels Països Catalans 26, 43007 Tarragona, Spain
*
Author to whom correspondence should be addressed.
Crystals 2020, 10(9), 833; https://doi.org/10.3390/cryst10090833
Submission received: 4 August 2020 / Revised: 14 September 2020 / Accepted: 16 September 2020 / Published: 18 September 2020
(This article belongs to the Special Issue Layered Double Hydroxides (LDHs))

Abstract

:
The depletion of fossil fuel resources has prompted the scientific community to find renewable alternatives for the production of energy and chemicals. The products of the aldol condensation between bio-based furfural and acetone have been individuated as promising intermediates for the preparation of biofuels and polymeric materials. We developed a protocol for the microwave-assisted condensation of these two compounds over hydrotalcite-based materials. Mg:Al 2:1 hydrotalcite was prepared by co-precipitation; the obtained solid was calcined to afford the corresponding mixed metal oxide, which was then rehydrated to obtain a meixnerite-type material. The prepared solids were characterized by PXRD, ICP-AES, TGA-DSC and N2 physisorption, and tested as catalysts in the aldol condensation of acetone and furfural in a microwave reactor. The performance of the catalysts was assessed and compared; the meixnerite catalyst proved to be the most active, followed by the mixed metal oxide and the as-synthesized hydrotalcite, which has often been reported to be inactive. In all cases, the reaction is quite fast and selective, which makes our protocol useful for rapidly converting furfural and acetone into their condensation products.

1. Introduction

Non-renewable resources are slowly, but inexorably, depleting [1]. This has prompted researchers to find alternatives to fossil fuel-derived matter, which industry traditionally uses to produce energy and chemicals [2]. Although it is theoretically possible to switch fossil fuels for renewable sources, such as solar, wind, and hydrothermal energy [3], for the post-oil production of chemicals, alternative raw materials are required. Carbon is present on Earth in many forms. It is mostly stored in the lithosphere as carbonate minerals, whereas the part which actively takes part in the carbon cycle is distributed between the soil, atmosphere, and water as carbon dioxide, carbonates, and their intermediates, and as organic carbon in the fossil pool and biomass [4]. Hence, it comes as no surprise that numerous biomass conversion strategies have been developed in recent decades [5]. The extensive use of this strategy may also be effective at reducing the emission of greenhouse gases and tackling the climate change problem [6].
Besides this, renewable energy resources may not always be suitable substitutes for fossil fuels in specific contexts. This may be the case for transportation fuels, for which biomass could instead provide valuable alternatives, namely biomass-derived fuels (or biofuels) [7]. Mixtures must meet some specifications (e.g., viscosity, boiling point, etc.) if they are to serve as diesel or jet fuels [8]; since these fuels are made up of liquid hydrocarbons, the mixtures must contain alkenes with definite carbon chain ranges to meet the aforementioned specifications [9]. The oligomerization of bioethanol [8] and the Fischer–Tropsch reaction of biomass-derived syngas [10] are some of the C–C bond forming strategies for producing diesel and jet fuels from biomass. Another option is to use bio-based aldehydes as coupling partners in aldol condensations with enolizable ketones such as acetone [11]; the enones obtained after cross-condensation have chain lengths that are suitable for liquid alkane transportation fuels [9]. The total hydrodeoxygenation (HDO) of these products affords the corresponding linear hydrocarbons [12]. The enones themselves, and the derivatives obtained by partial HDO, may also be used as novel organic dyes, monomers, and cross-linking agents [13].
A suitable electrophilic partner for this transformation is furfural, a furanic aldehyde obtained by the dehydration of hemicellulose-based pentoses, such as xylose [14]. Furfural is considered to be one of the most important bio-derived chemical platforms, and can be converted into a wide variety of products with the most disparate applications [15]. The reaction of furfural and acetone under basic conditions affords the aldol C8-OH (Scheme 1), the dehydration of which leads to the formation of the enone C8. C13-OH is obtained after a second aldol reaction on the other side of the ketone, and C13 is ultimately formed by the dehydration of the corresponding aldol. In industry, aldol condensations are traditionally carried out in alkaline aqueous solution [16], which presents such disadvantages as reaction corrosion and the difficult separation of the products. For this reason, various reports on the cross-condensation of furfural and acetone have focused on heterogeneous catalysis [17,18,19,20,21].
We developed a microwave-assisted batch process for the neat aldol condensation of furfural and acetone over hydrotalcites and derivatives. Mg:Al hydrotalcites (HTs) are anionic clays which belong to the category of layered double hydroxides with the general formula [ M g 1 x 2 + A l x 3 + ( H O ) 2 ] x + [ C O 3 2 ] x / 2 x · m ( H 2 O ) [22]. HTs are prepared by co-precipitation of Mg and Al metal salts, and have been used as adsorbents, ion-exchangers, and heterogeneous basic catalysts. In the present study, we prepared 2:1 Mg:Al HTs with different degrees of modification (as-synthesized, calcined, and rehydrated). These solids have different types of basicity [23] and proved to be valuable catalysts for aldol condensation, especially the mixed metal oxides (MMOs) obtained after calcination of HTs [18,24] and the meixnerite-like (MX) layered double hydroxides obtained after rehydration of MMOs [25,26,27]. The solids prepared were characterized and tested as catalysts in aldol condensation reactions performed in a microwave (MW) reactor. Microwave irradiation has become a popular heating method in organic synthesis [28]. Moreover, as most of the solid catalysts are good MW absorbers, the use of microwave irradiation in heterogeneous catalytic processes is becoming increasingly popular [29]. Neat reaction of furfural and acetone with conventional heating over catalysts similar to ours has already been reported [27], although the hydrotalcites used were purchased, not prepared in the laboratory, and had different properties than the conventional hydrotalcites reported in the literature. We used MW irradiation as a heating method, and used hydrotalcites synthesized in our laboratories.

2. Materials and Methods

All starting materials were obtained from commercial sources. The starting materials for the preparation of the Mg:Al HT were Mg(NO3)2·6H2O (extra pure, Acros Organics, Fair Lawn, NJ, USA), Al(NO3)3·9H2O (≥98%, Fisher Chemical, Hampton, VA, USA), NaOH (Pellets, 98.9%, Fisher Chemical), and Na2CO3 (Anhydrous, ≥99.5%, Fisher Chemical). Deionized water was used for this preparation (18.2 MΩ·cm at 25 °C, Simplicity UV water purification system, Merck Millipore, Burlington, NJ, USA). Furfural (99%, Sigma Aldrich, St. Louis, MO, USA) and acetone (99.5+%, Acros Organic) were used in the aldol condensation. Pure N2 (≥99.9992%, 200 bar at 15 °C, Carburos Metálicos, Cornellà de Llobregat, Spain) was used to increase the chamber pressure of the microwave reactor during the condensation experiments. Toluene (≥99.3%, Honeywell, Charlotte, NC, USA) was used as an internal standard for the GC-FID analysis of samples obtained after the microwave-assisted process.

2.1. Catalyst Preparation

Hydrotalcite (HT, 2:1 Mg:Al) was prepared by the co-precipitation of Mg and Al nitrates in deionized water. NaOH and Na2CO3 were added dropwise, and the pH was kept constant at 10. The resulting white slurry was left to age overnight under magnetic stirring and without heating: this aging is more advantageous than aging under heating from the point of view of energy consumption; it also produces more amorphous solids that are generally better for catalytic purposes. The slurry was then filtered, and the cake obtained was washed with abundant deionized water. The solid obtained was dried at 100 °C for 24 h, ground, and stored in a vial. Calcination at 450 °C for 4 h in a muffle furnace (HD—150 muffle furnace, Hobersal, Caldes de Montbui, Spain) transformed HT into the corresponding mixed metal oxide (MMO), which was used for the catalysis as it was, or rehydrated. MMO was rehydrated in the liquid phase by immersing it in deionized water (2 mg MMO/mL), which had previously been bubbled with pure Ar. The mixture was left stirring at 500 rpm for 24 h at room temperature in a sealed vessel, and finally centrifuged, filtered, and dried under vacuum.

2.2. Catalyst Characterization

The prepared catalysts were characterized by PXRD, ICP-AES, TGA, and N2 physisorption. PXRD measurements were performed using a Siemens D5000 diffractometer (Bragg–Brentano parafocusing geometry and vertical θ-θ goniometer) fitted with a curved graphite diffracted-beam monochromator, incident, and diffracted-beam Soller slits, a 0.06° receiving slit, and a scintillation counter as a detector. The angular 2θ diffraction range was between 5 and 70°. The data were collected with an angular step of 0.05° at 3 s per step and sample rotation. A low background Si (510) wafer was used as a sample holder. CuKα radiation was obtained from a copper X-ray tube operating at 40 kV and 30 mA.
ICP-AES analyses were performed on samples obtained by dissolving the solids in concentrated HNO3, and digesting the resulting solution in an Ethos Easy (Milestone, Sorisole, Italy) MW digester. These samples were then analyzed by a 160 charge coupled device (CCD) (Arcos, Spectro, Kleve, Germany) spectrometer to obtain the content of Na, Mg, and Al.
TGA-DSC was performed using a SENSYS evo TG-DSC (S60/58129, Setaram Instrumentation, Caluire-et-Cuire, France). All analyses started with a conditioning step (5 min at 30 °C), after which the chamber was heated to 800 °C at a constant heating rate of 10 °C/min. This temperature was kept for 5 min, and then the chamber was left to cool for 25 min. The analyses were conducted under Ar at a flow of 30 standard cubic centimeters.
N2 physisorption was performed on solids outgassed at 120 °C for 5 h under vacuum (6 mTorr) in the instrument pre-chamber (FloVac Degasser, Quantachrome Instruments, Boynton Beach, FL, USA) to remove the adsorbed species from the samples. The N2 physisorption analysis was performed at 77 K using a Quadrasorb SI Models 4.0 with QuadraWin Software (Quantachrome Instruments, v. 5.0 + newer).

2.3. Furfural Distillation

Furfural spontaneously undergoes degradation when in contact with air [30]. For this reason, furfural was periodically purified, by means of distillation, to remove the degradation products from the starting material. A simple distillation was carried out by heating furfural in a round-bottom flask with a heating mantle (Fibroman-N, JP Selecta, Abrera, Spain). The vapors were channeled into a condenser, and the purified furfural was collected in another round-bottom flask. The flask was sealed, its content was bubbled with argon, and it was stored in a refrigerator at 4 °C.

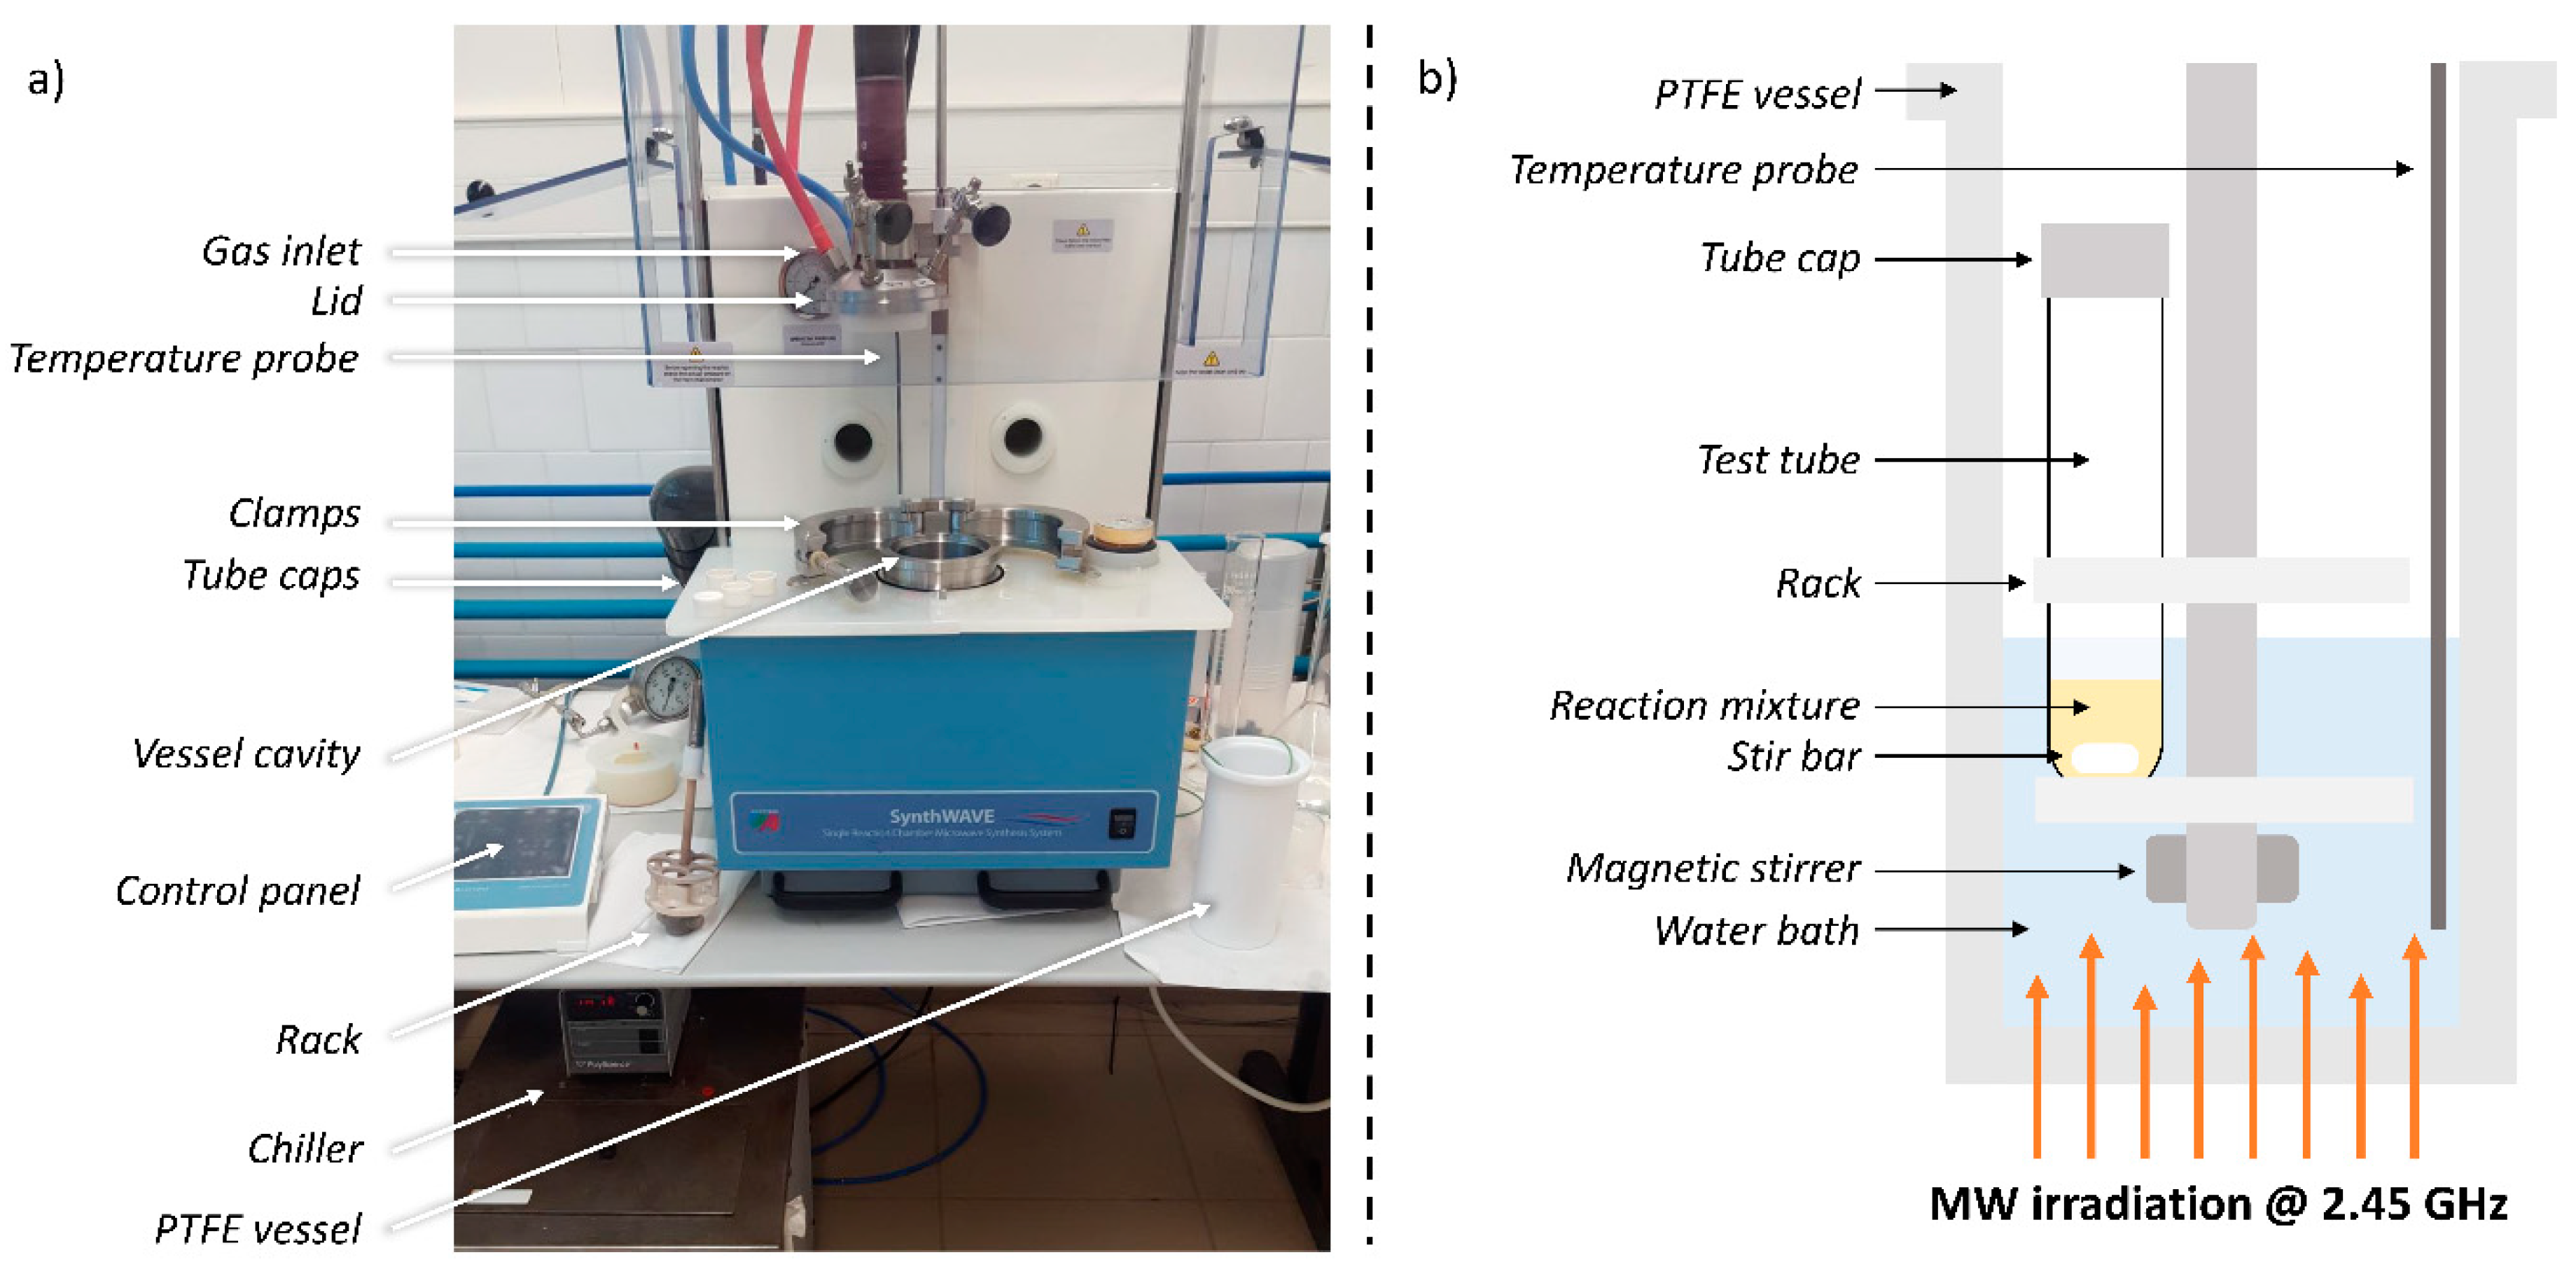
2.4. Microwave-Assisted Aldol Condensation

The aldol condensations were performed in an MW reactor (single reaction chamber microwave synthesis system, Milestone SynthWAVE, controlled by a Terminal 660 control panel with easyCONTROL software, Figure 1a). The reaction mixtures consisted of 0.1 g of furfural (86 uL, 1.04 mmol) in 5 mL of acetone, and the specified amounts of catalyst. The mixtures were placed in oven-dried glass reaction tubes together with magnetic stir bars; caps were put on to prevent the reaction mixtures from coming out of the tubes (Figure 1b). These tubes were placed in a rack, which was immersed in a heating bath. In all cases, this bath consisted of 250 mL of deionized water. The stirring was operated by a rotating magnetic stirrer, and the stirring rate was set to 50%. The whole PTFE reaction vessel was pressurized with 10 bars of N2. The maximum MW irradiation power was set to 300 W. The power was modulated by the system so that the real bath temperature matched the corresponding temperature in the program. Indeed, the temperature probe measures the temperature of the bath, and all temperatures mentioned in the rest of this article refer to the bath ones. The system did not measure the temperature of the reaction mixtures. The general structure of the temperature programs (Figure S1) was the following: in the first step, the temperature was increased to the desired temperature in 10 min; in the second step, this temperature was maintained for the rest of the reaction time; in the third step, the irradiation was stopped, and the bath temperature was allowed to decrease for 20 min to below 56 °C, the boiling point of acetone. Once the third step was over, the pressure was released, the reaction vessel was opened, and the reaction tubes were collected.

2.5. Analysis of the Reaction Mixtures

Samples were prepared from the final reaction mixtures by adding 100 μL of an internal standard (toluene, which is not formed in the reaction and is not reactive towards any of the reaction components), and then performing 1:5 dilutions with acetone to reduce the concentration of the reaction species and achieve better peak shapes and resolution in the GC analysis. The obtained samples were analyzed with a GC-2010 (Shimadzu, Kyoto, Japan) using a TRB-5 column (TR-120232, Teknokroma, Sant Cugat del Vallès, Spain; length: 30 m; film thickness: 25 μm; inner diameter: 0.25 mm). The product concentration was estimated from the calibration curve obtained for furfural, using the effective carbon number as a correction factor [31]. The conversion X of furfural was calculated as follows:
X F U R = n F U R 0 n F U R n F U R 0 · 100
The yields, Y, of the various products and intermediates were calculated as follows:
Y C 8 = n C 8 n F U R 0 · 100               Y C 8 O H = n C 8 O H n F U R 0 · 100             Y C 13 = 2 · n C 13 n F U R 0 · 100
The C8:C13 selectivity was defined as the ratio between the yields of the mono- and the double-condensation products. With our protocol, the standard deviations of both conversions and yields are below 5%. In addition, GC-MS was used to aid peak assignations. The samples were analyzed with a GCMS-QP-2010 (Shimadzu) using a Zebron ZB-5ms column (Phenomenex, Torrance, CA, USA). The results of these analyses can be found in the Supplementary Materials (Figure S2).

3. Results and Discussion

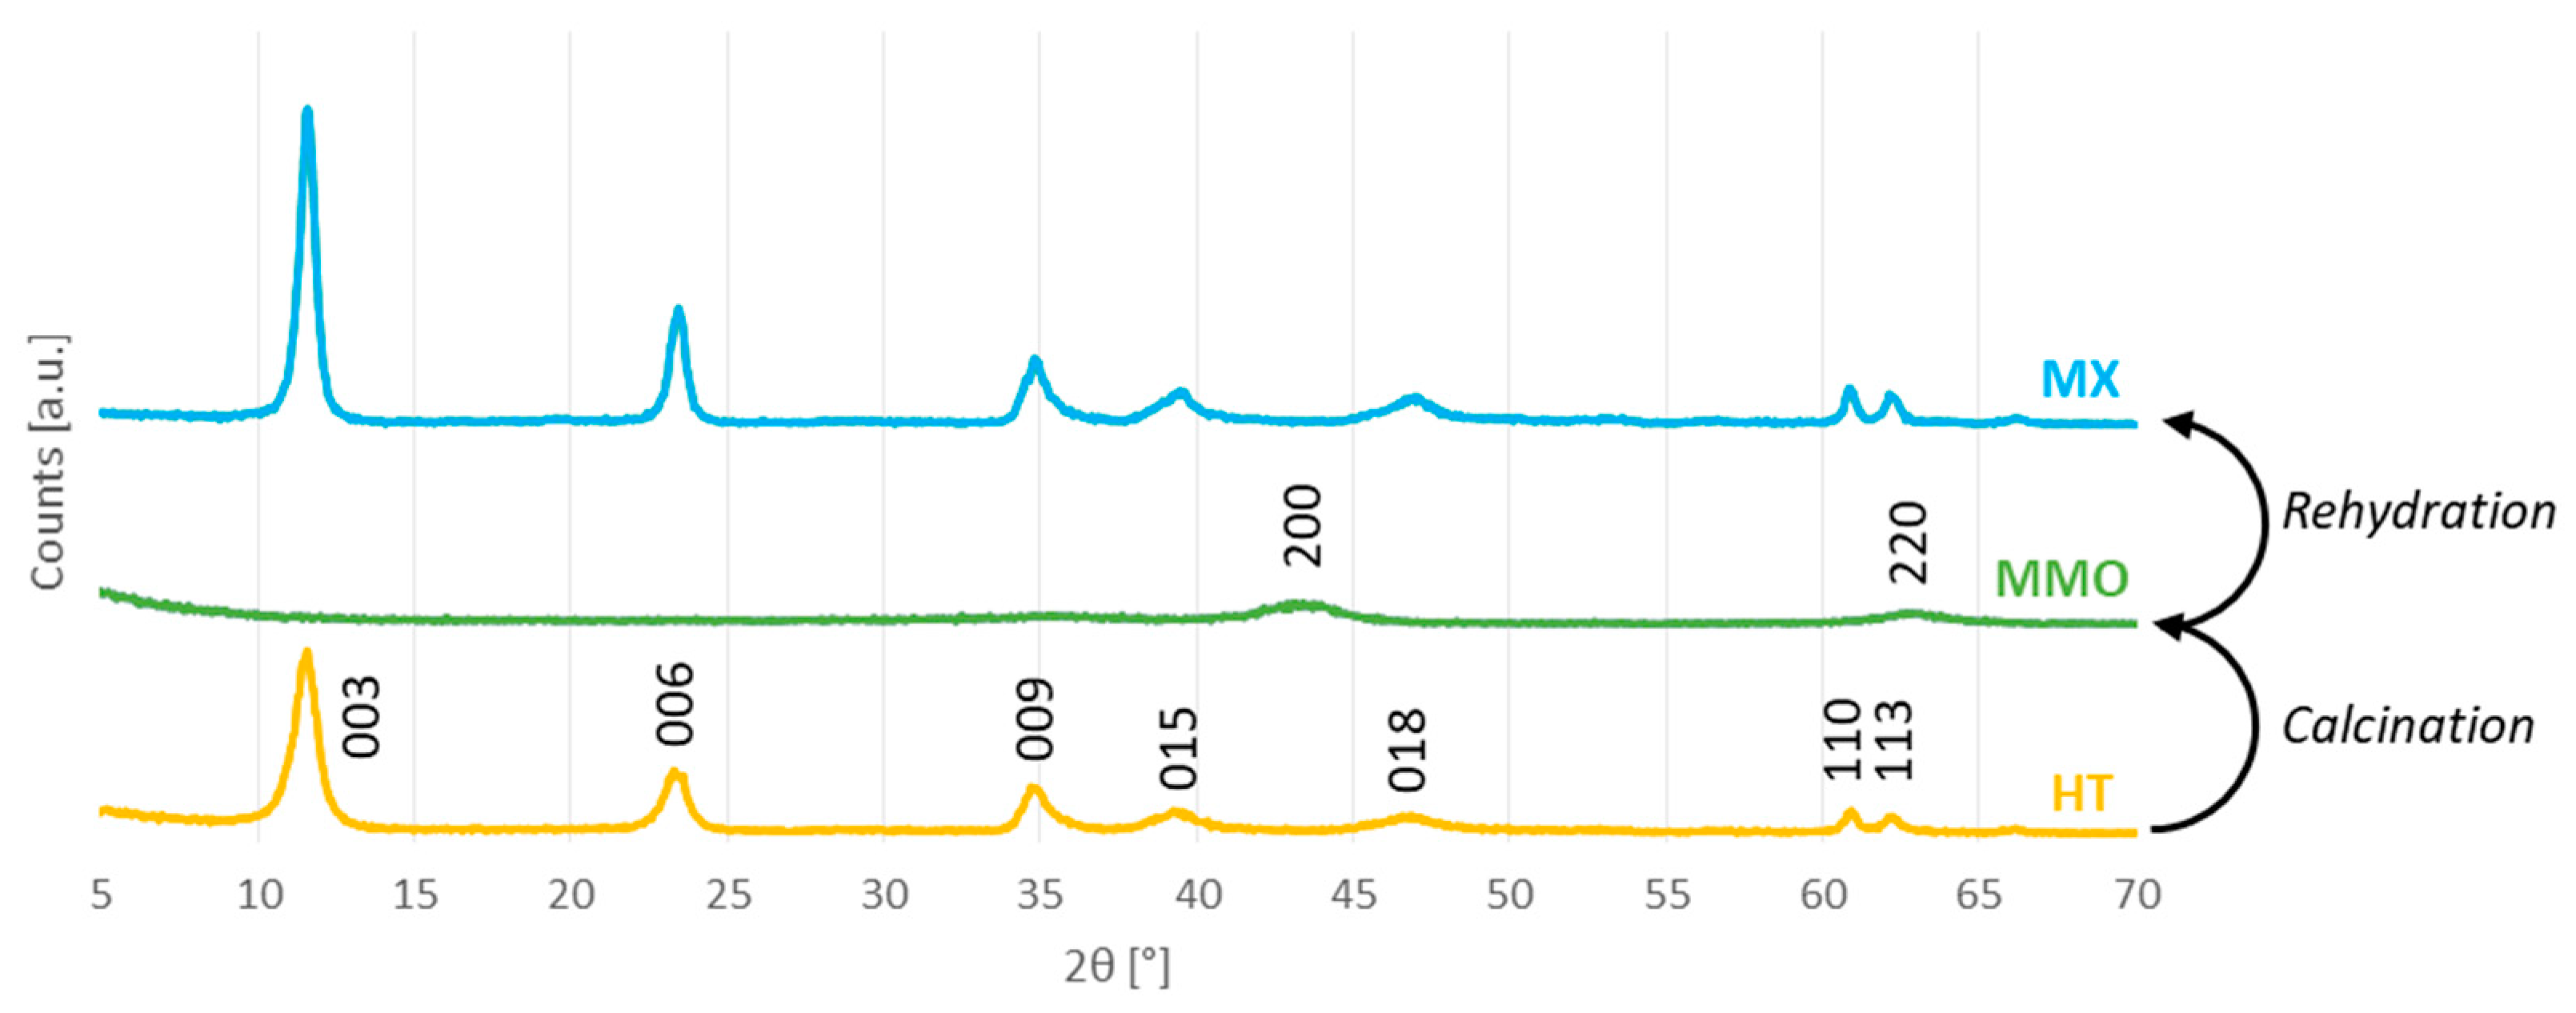
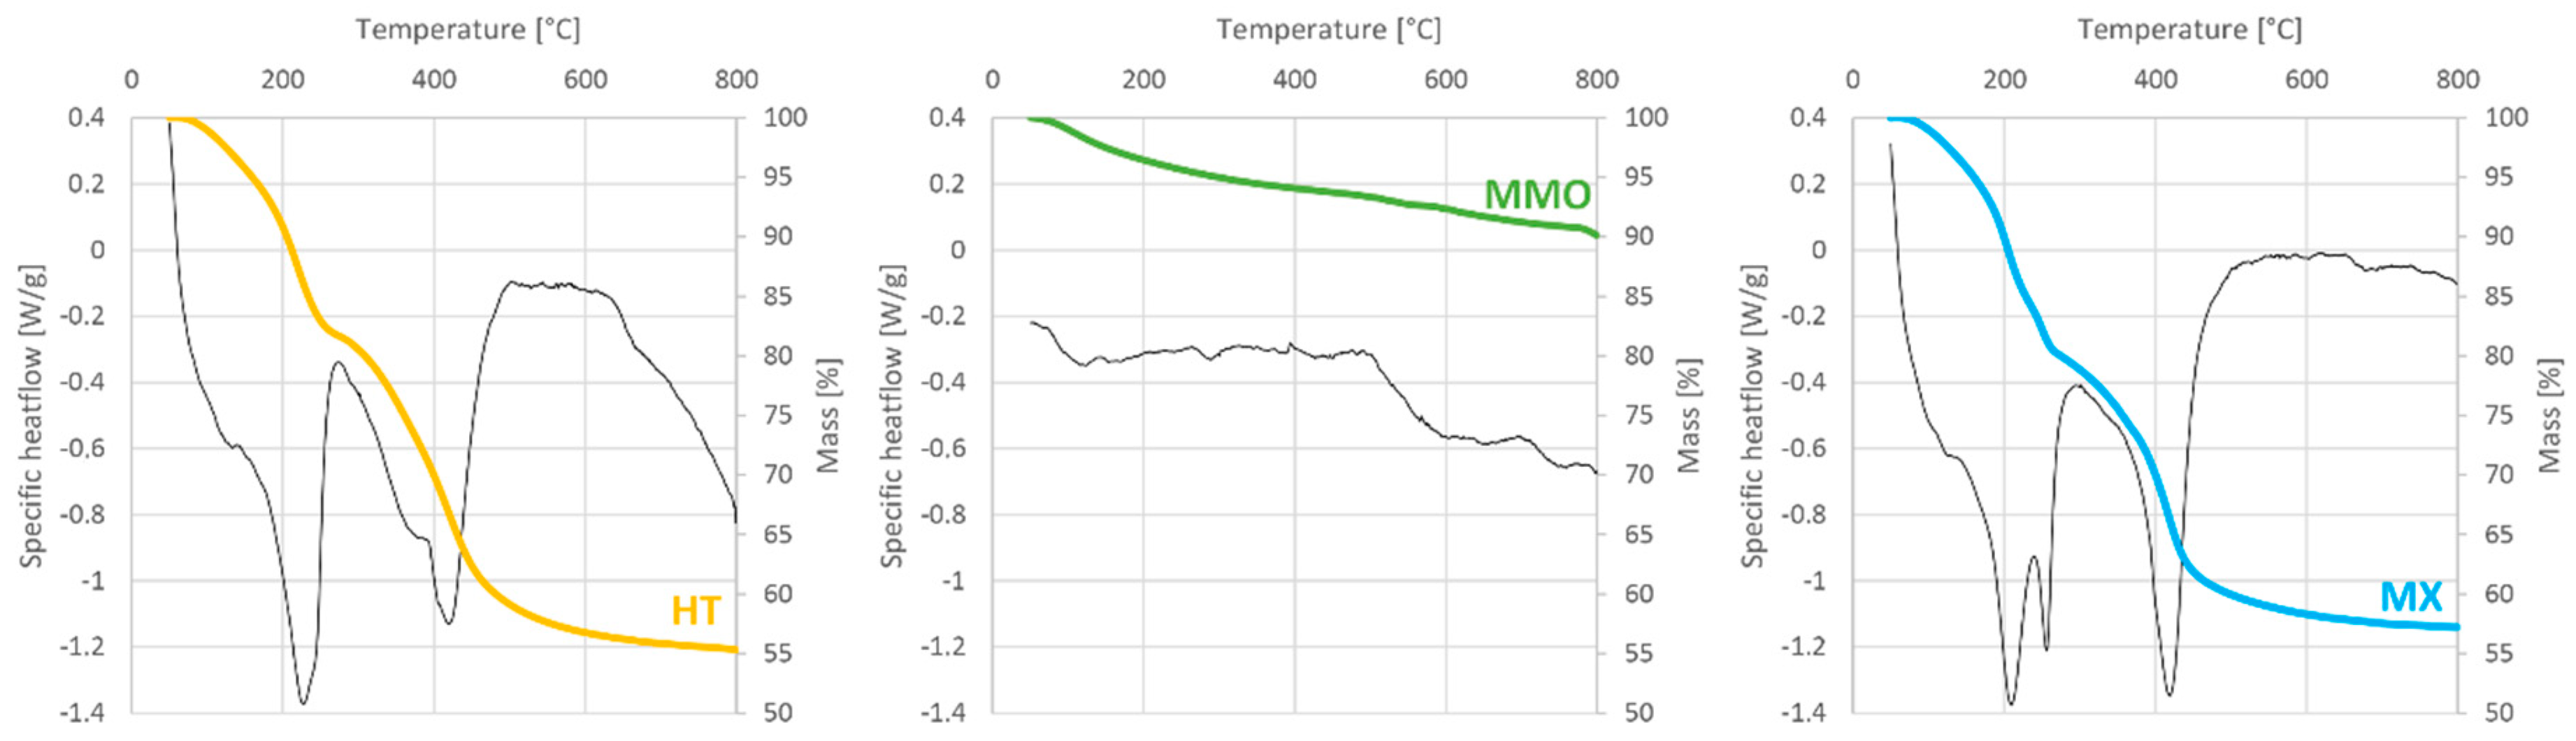
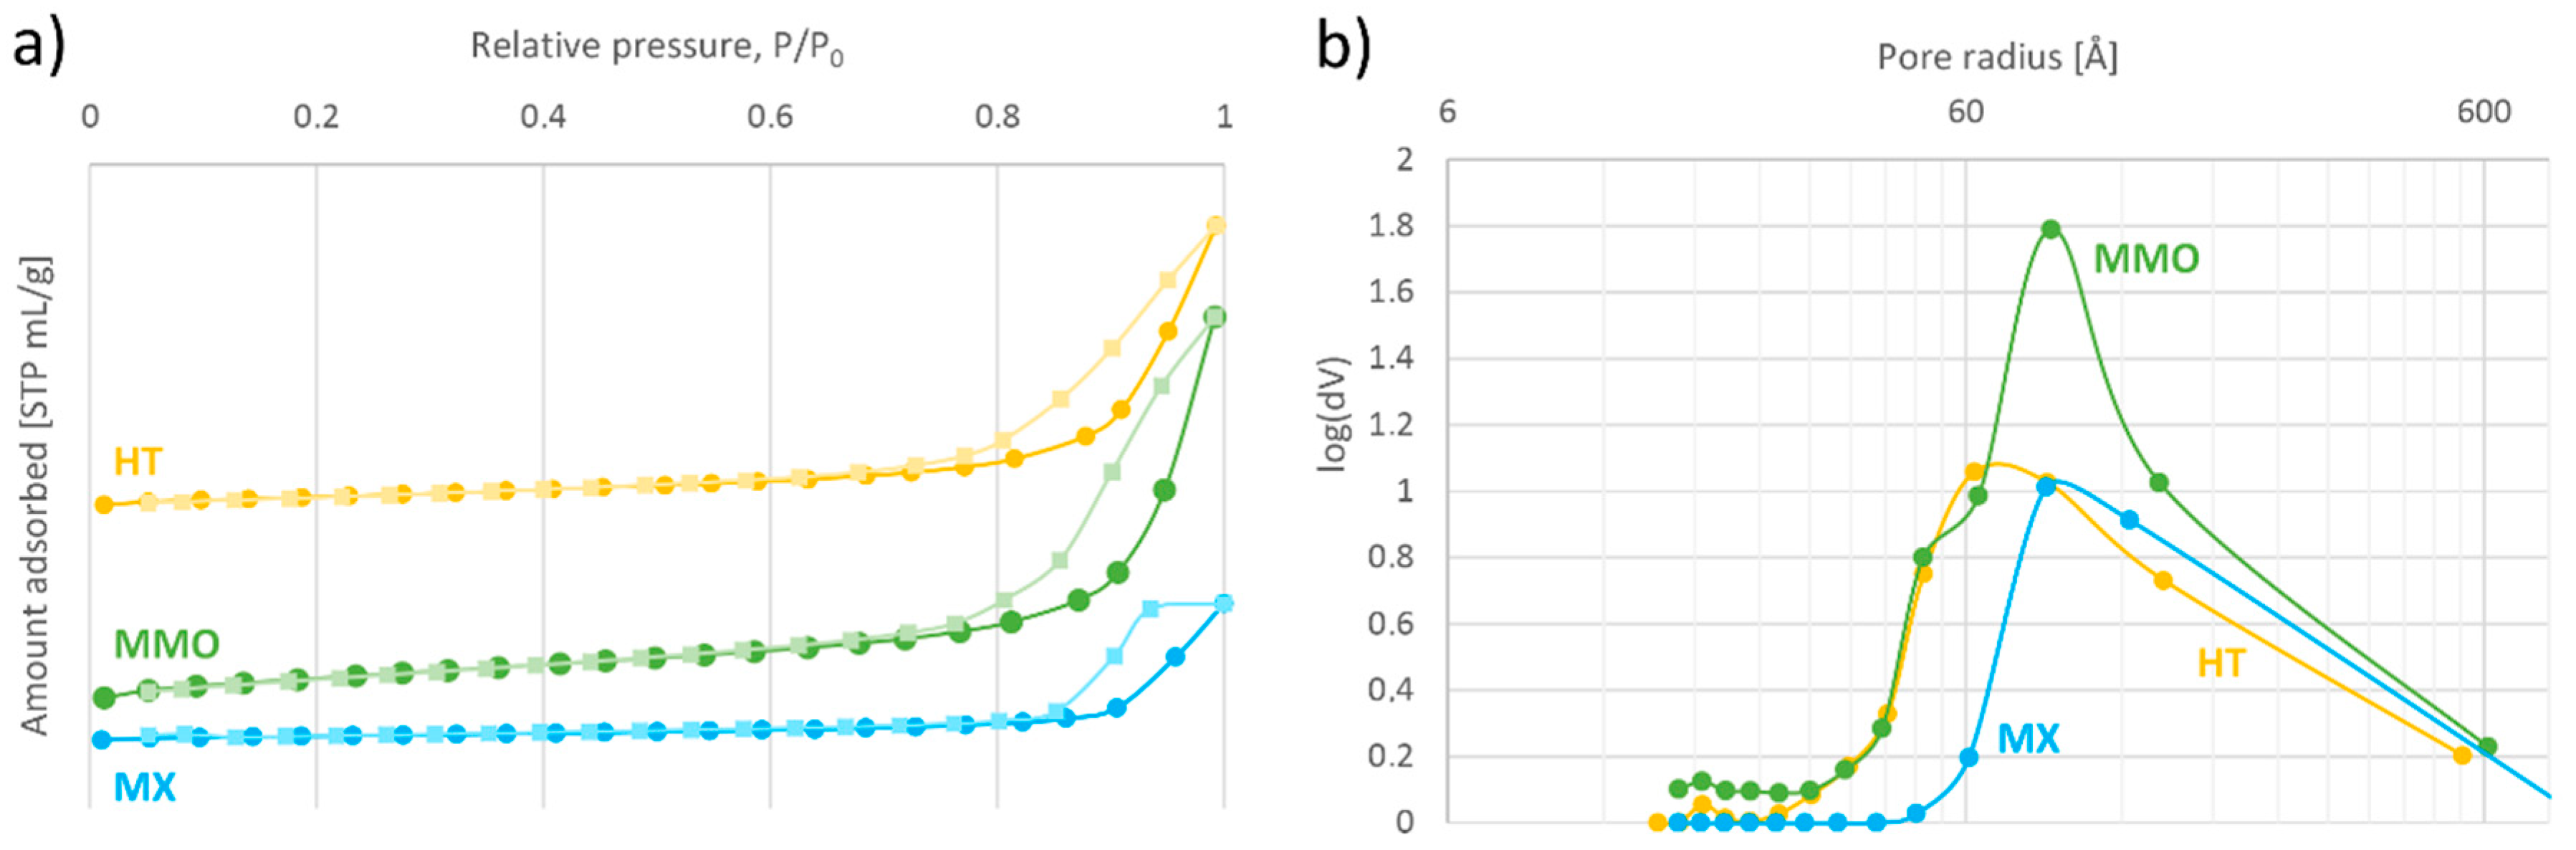
3.1. Catalyst Characterization

The catalysts were analyzed by PXRD in order to characterize their crystalline structure (Figure 2).
The original, as-synthesized HT catalyst has the typical hydrotalcite structure, that is, a layered double hydroxide structure of Mg–Al mixed hydroxides organized in brucite-like layers containing water and carbonate anions in the interlayer [32]: sharp (003), (006), (009), (110), and (113) diffraction lines, and two broad (015) and (018) ones. The crystalline structure of hydrotalcites have a high morphological anisotropy because of the layered structure. Hence, it is common to report the crystallite size for every <hkl> direction (Table 1).
The calculated lattice parameter c corresponds to the basal spacing of the layered double hydroxide; dividing the crystallite size in the 003 direction by c gives the number of layers in one crystallite, corresponding to about four in this case. The calcination of HT causes the collapse of the layered double hydroxide structure. As a consequence, the MMO X-ray diffractogram does not include any of the aforementioned reflections, but instead presents two broad (200) and (220) diffraction lines, corresponding to the MgO cubic phase (periclase) [33]. Immersion of MMO in aqueous media enables the double hydroxide structure layer to be reconstructed, thanks to the memory properties of these oxides which, for this reason, are also called layered double oxides. XRD analysis of MX does indeed confirm that the rehydration has induced the reconstruction of the original layered double hydroxide structure. As the rehydration was carried out in an inert atmosphere, the calcination–rehydration cycle has the overall effect of replacing the initial carbonate anions with hydroxyls, which enhance the Brønsted basicity of the catalyst. Even so, this anion exchange does not seem to have a notable effect on the diffractograms. Nevertheless, the lattice parameter c slightly changes as a result of the different interlayer composition. Moreover, the layered double hydroxide obtained after calcination and rehydration appears to have a bigger crystallite size in all directions, indicating agglomeration of the layers: the number of layers per crystallite is now about eight, approximately double the value obtained with HT (Table 1).
Next, the catalysts were analyzed by ICP-AES to obtain the atomic composition of the prepared materials. The information of interest was the final Mg: Al ratio in the solids and the Na content, which may be due to incomplete HT washing after the co-precipitation. In particular, this parameter is known to have a remarkable influence on the catalytic performance of the solids [34]. Table 2 summarizes the results of the ICP-AES analyses.
The atomic ratio of Mg and Al matches the theoretical one (2) in all cases. The Na content of the original HT sample is below the detection limit (Table 2, entry 1). The Na, Mg, and Al concentrations increase with calcination as a result of the loss of water, hydroxyls, and carbonates, although their percentage is still very low (Table 2, entry 2). On rehydration, the introduction of water and hydroxyls in the solid pushes the Na content back to below the detection limits (Table 2, entry 3). It can therefore be argued that Na has little or no effect on the aldol condensation results, which will be discussed in the sections below, since the sodium content in HT is below the level of that which is considered to have an impact on the catalytic activity (0.04%).
TGA-DSC was used to study the non-metal composition of the catalysts, and the degradation behavior of the solids. The results of the analysis are reported in Figure 3.
The thermogravimetric curve obtained for HT fits the previously reported ones well [25]. The curve points to two distinct mass loss events: one of these is at a DSC negative peak at about 200 °C, which has been attributed to the loss of physisorbed and inter-layer water; the other is at about 400 °C, and should correspond to decarboxylation and dehydroxylation events. The MMO was analyzed as a freshly calcined material, so little or no mass loss was expected. As anticipated, there was no distinct mass loss, and the sample mass drifted slowly to 90% of its original value. As for MX, the profile very much resembled HT’s. Yet there were some differences: for example, the different mass loss of water, and the different shape of the second mass loss step, which is probably due to the absence (or at least a reduced quantity) of carbonates in the structure. These observations are in agreement with previously reported data [25].
N2 physisorption was used to obtain the nitrogen adsorption–desorption isotherms, Brunauer–Emmett–Teller (BET) surface area, and pore volume of the catalysts. The results obtained are summarized in Figure 4 and Table 3.
Generally, the results of N2 physisorption analysis of HT and related materials very much depend on the procedure followed for the preparation and the sample degassing [25,34,35,36]. The shape of the HT isotherm resembles the shape of type III (Figure 4a), which commonly corresponds to macroporous materials (even though HT has pores in the mesopore range (Table 3, entry 1)) with weak adsorbent–adsorbate interactions [37]. The same considerations apply to the isotherms of MMO and MX (Table 3, entries 2 and 3, respectively). As for adsorption hysteresis, the loops of HT and MMO seem to be type H3, which is associated with clays made of non-rigid aggregates of plate-like particles [37]. On the other hand, the hysteresis loop of MX appears to be more pronounced and seems to correspond to type H2b, which indicates pore blocking. The BET area of the prepared HT is quite high (Table 3, entry 1), and calcination of the hydrotalcite is supposed to increase this value [25,34,36], which is indeed the case for our MMO (Table 3, entry 2). The surface area of MX depends on the preparation conditions [36], and in our case, it was lower than the area of both its parent catalysts (Table 3, entry 3). Moreover, the Barrett–Joyner–Halenda (BJH) results indicated that while HT and MMO are overall quite porous, the porosity of MX is considerably lower.

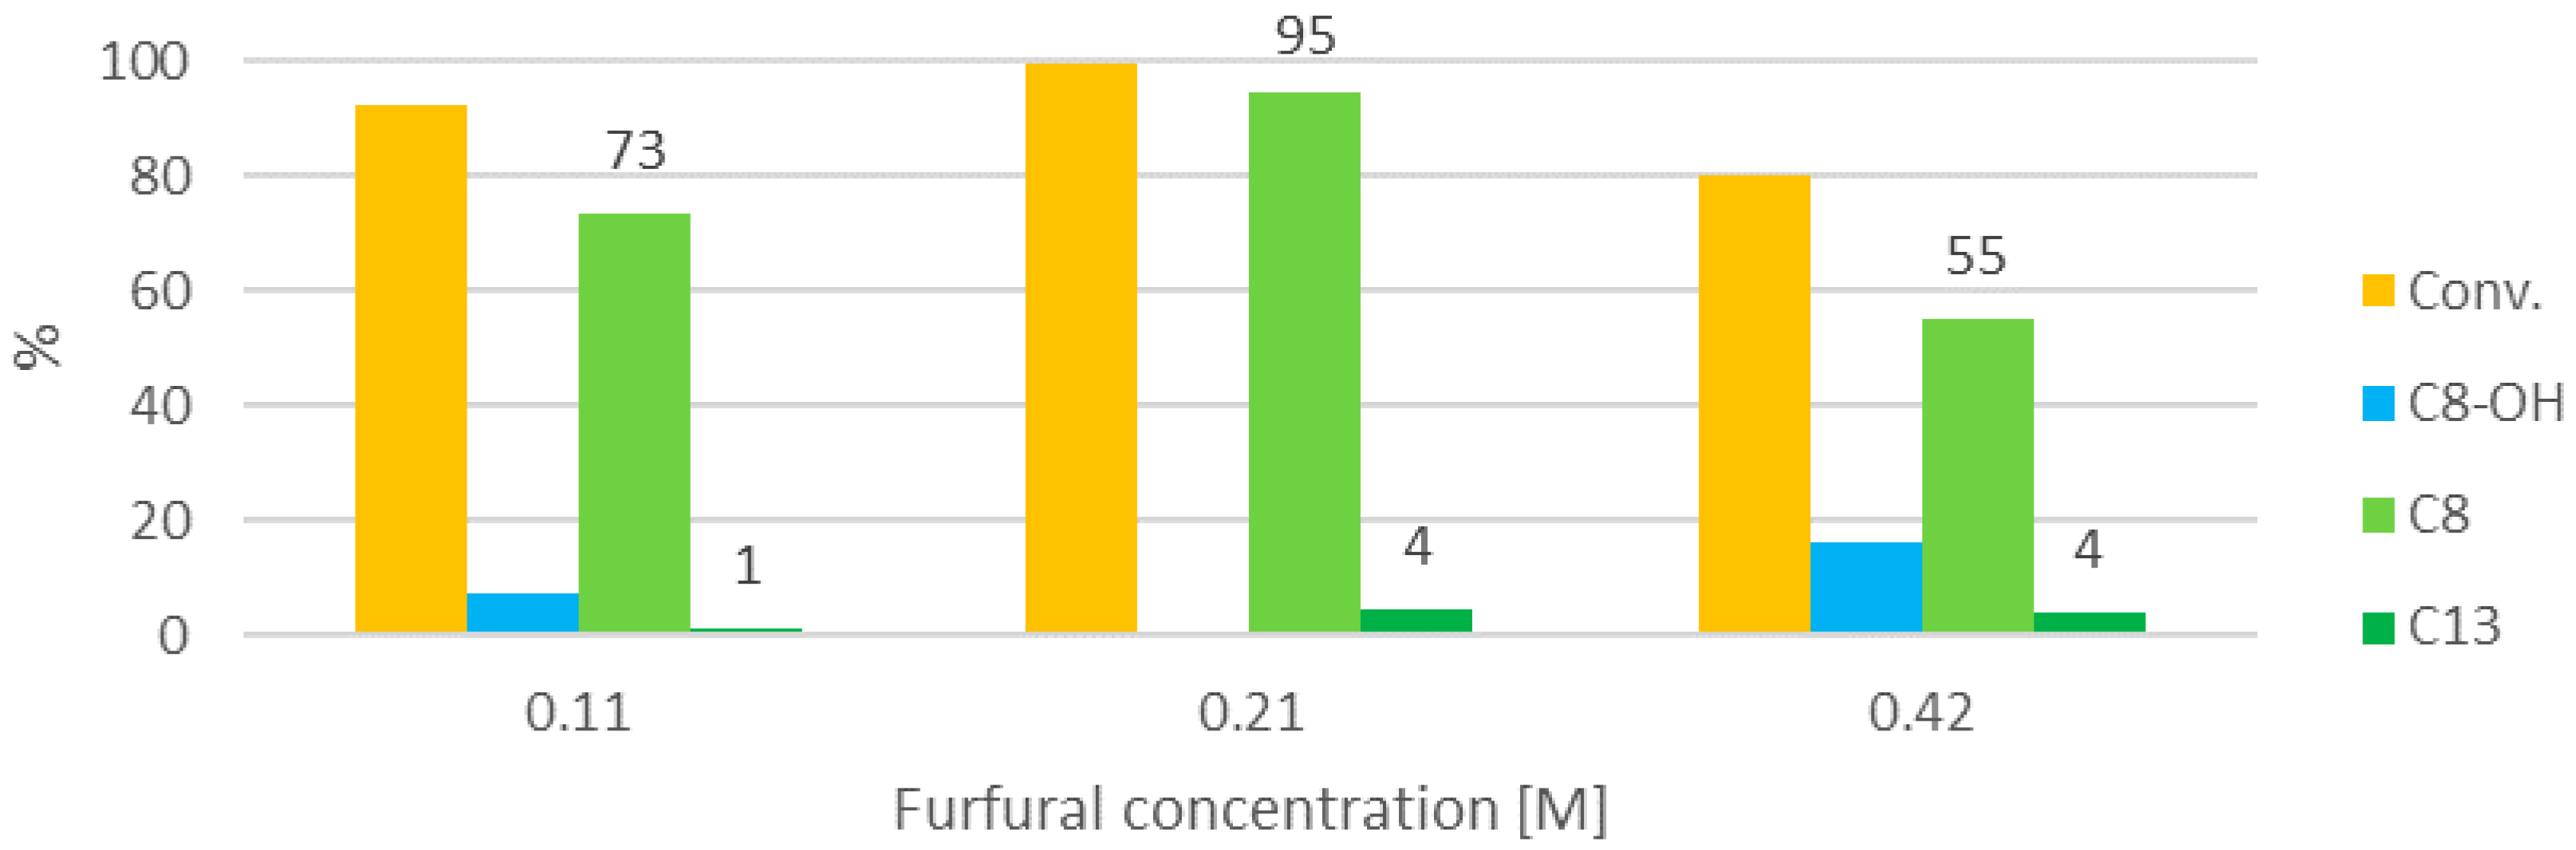
3.2. Evaluation of the Catalytic Performance of HT at Different Concentrations

The as-synthesized HT was tested as a catalyst in the microwave-assisted aldol condensation of acetone and furfural. In all the GC-FID chromatograms obtained after analysis, only three products were present in detectable amounts: the mono-aldol product, C8-OH, the mono-condensation product, C8, and the double-condensation product, C13. The only other product detected was diacetone alcohol, the product of the self-aldolization of acetone, which was produced in small amounts. Since, in our system, acetone was present in large excess, the formation of diacetone alcohol did not compromise the selectivity of the reaction. However, the presence of this side product in the final reaction mixtures means that a purification may be required at the end of a potential industrial process.
The concentration of furfural is the first parameter that was investigated. We expected that the different acetone:furfural ratio would have an effect on the C8:C13 selectivity. The chosen reaction temperature was 100 °C. This temperature was reached in about 10 min by irradiating the water bath, and it was then kept constant for 20 min. The central value of concentration was 0.1 g of furfural in 5 mL of acetone (0.02 g/mL, 0.21 M), with a furfural:HT weight ratio of 2:1. Two other concentrations were explored, namely 0.11 and 0.42 M, corresponding to half and double the central value, respectively. The volume of acetone and the furfural:HT ratio was kept constant for all experiments. Figure 5 reports the results of the concentration optimization.
The best concentration in terms of activity appears to be 0.21 M. The reaction is slightly slower at lower concentration, perhaps as a result of a slower dehydration, whereas the lower conversion obtained at 0.42 M may be the result of a lower irradiation power per mass of catalyst, which may influence the local temperature of the solid, so fewer or less intense hotspots are formed in the catalyst. Hence, the central concentration value was chosen for further optimization. As expected, the C8:C13 selectivity seems to decrease when the concentration is increased from 54 to 22 to 14. This means that although it is possible to obtain almost complete selectivity to C8 with a somewhat lower concentration, it is not feasible in an HT-catalyzed neat reaction to shift the selectivity to C13, because that would require an excess of furfural and, therefore, to use a solvent.

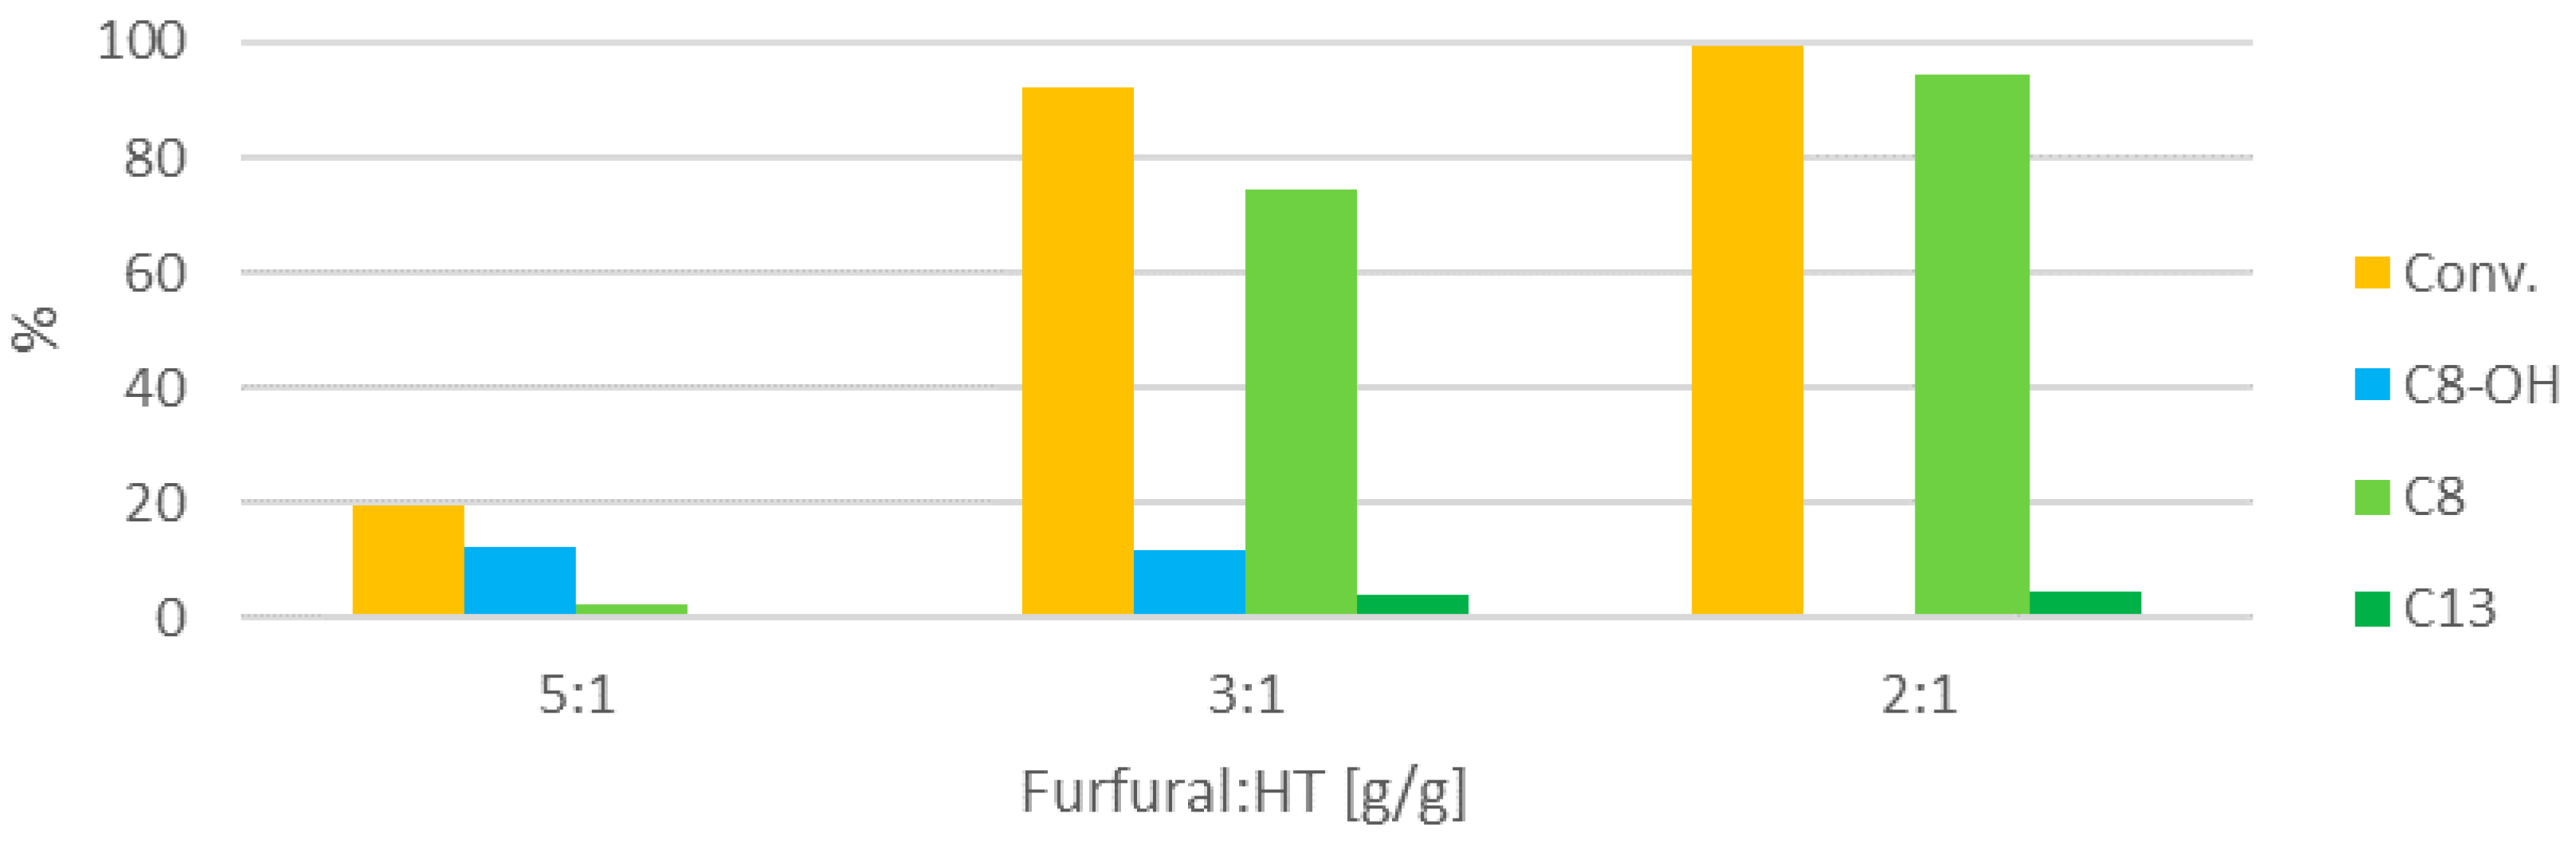
3.3. Influence of the Catalyst Quantity

Next, the effect of decreasing the furfural:HT ratio on the reaction outcome was studied (Figure 6).
The reaction rate decreases dramatically when the furfural:HT ratio is increased to 5:1, and only traces of the condensation products are detected. However, with an intermediate ratio of 3:1, the activity is still fairly high, although a consistent part of the converted furfural is still present as the intermediate C8-OH.

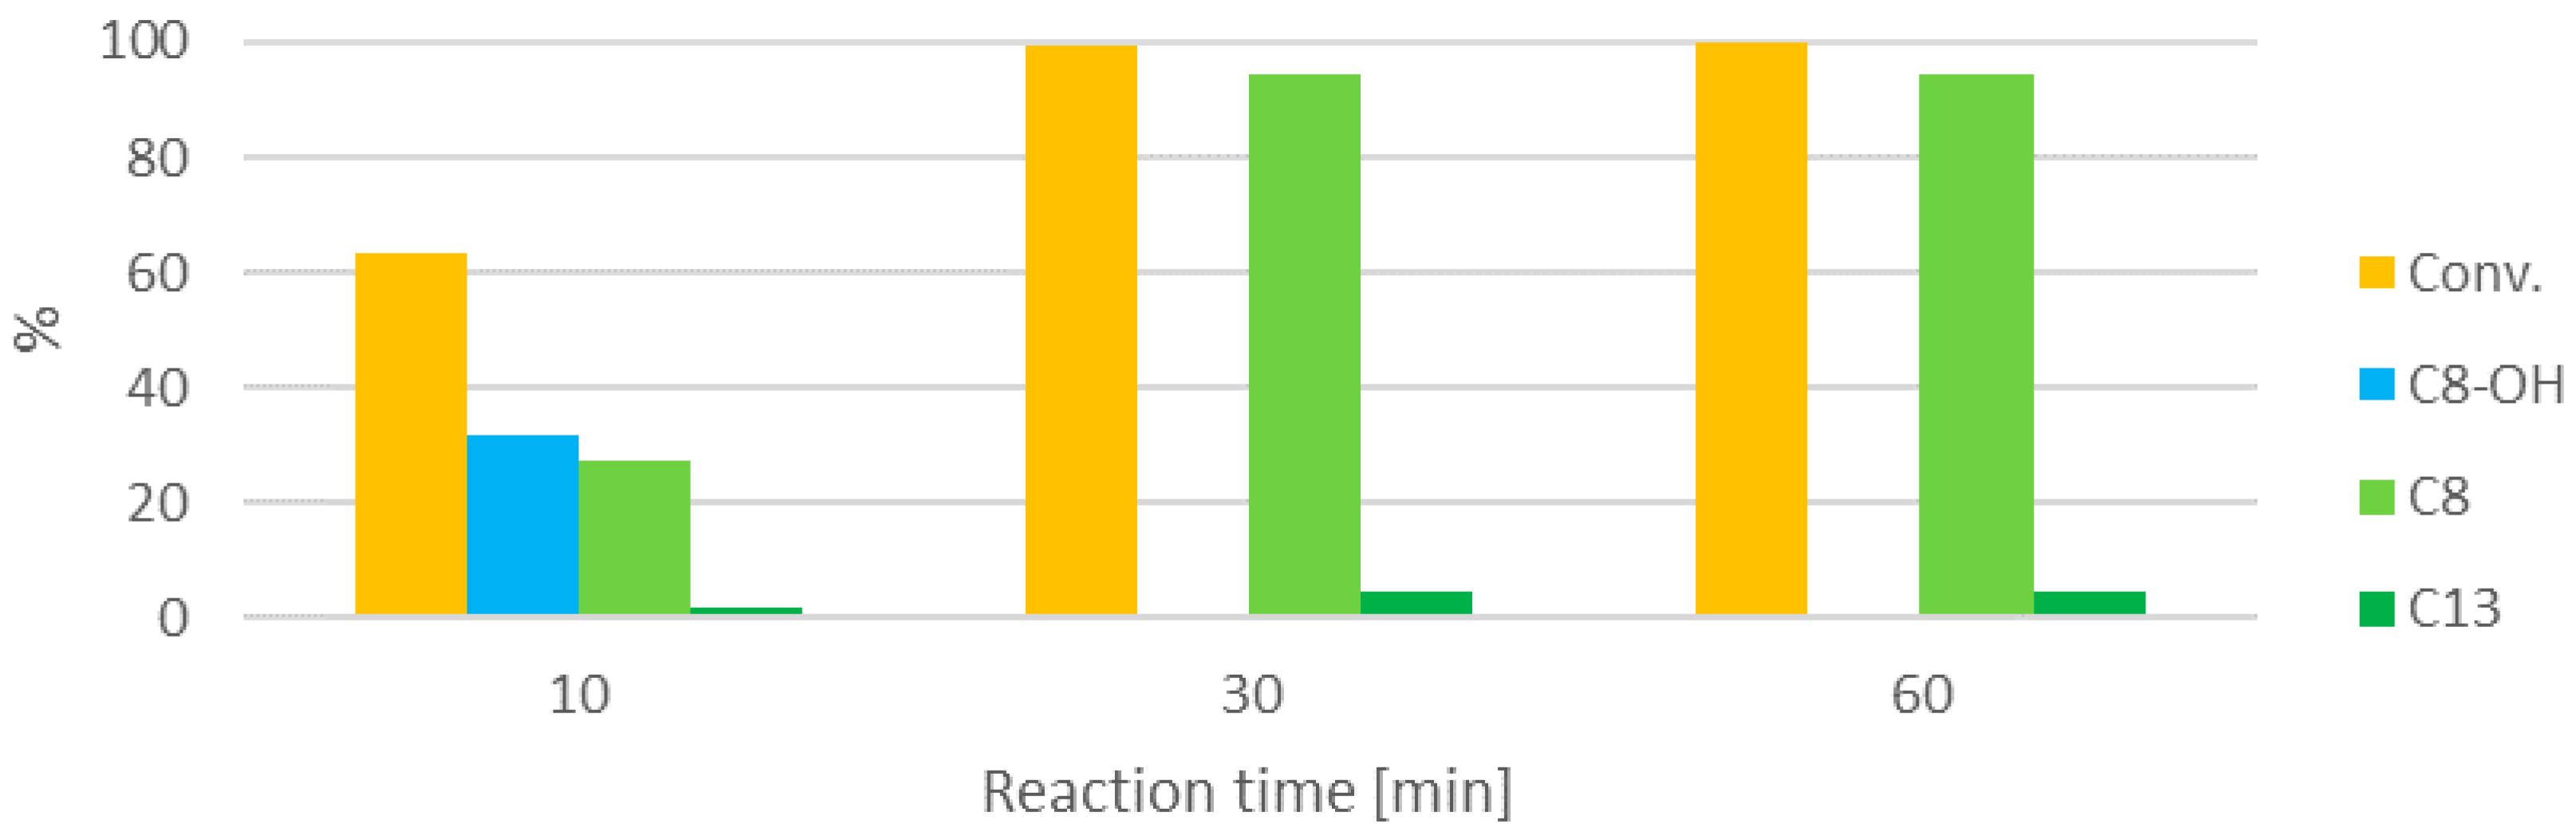
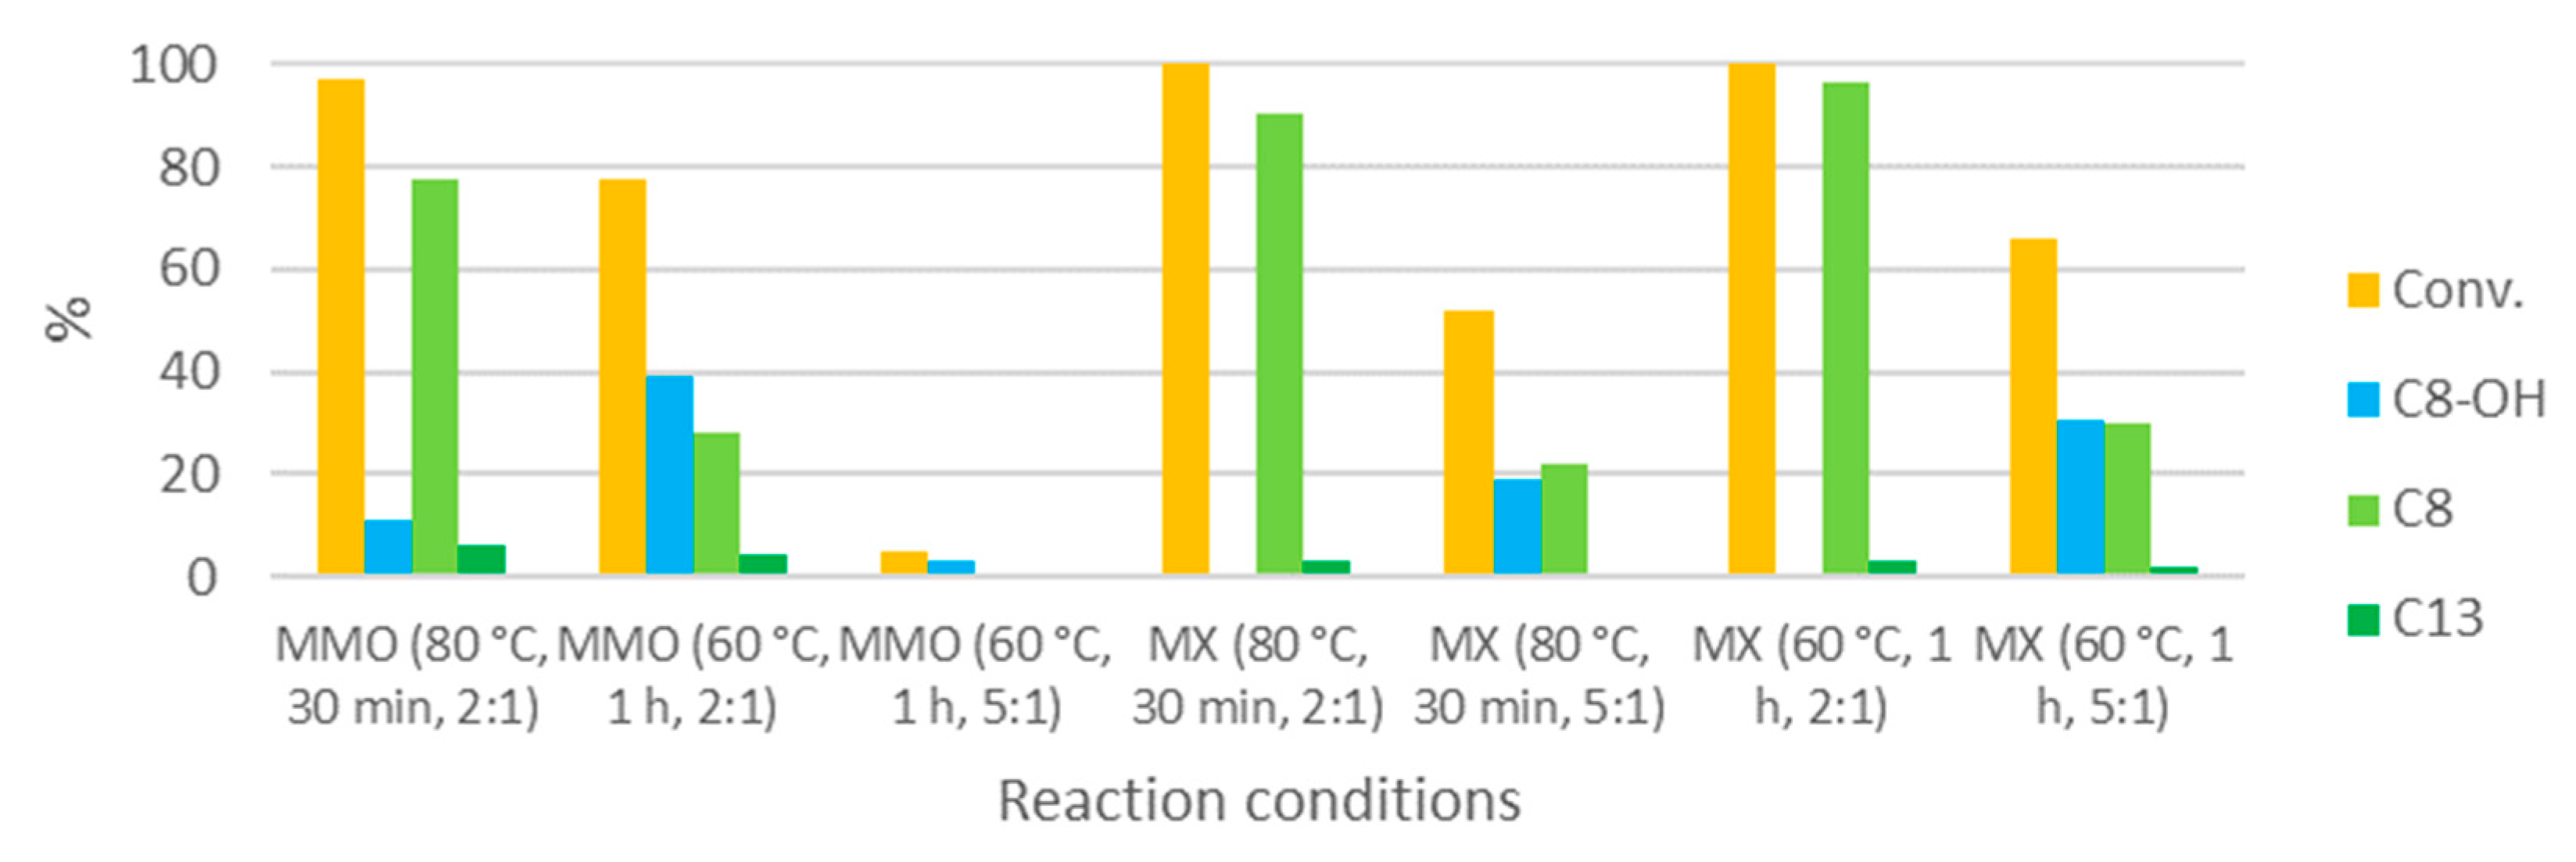
3.4. Influence of the Reaction Time

Then, the formation of the various products over time was studied (Figure 7).
The conversion increases consistently with the reaction time. After 10 min, the major product is C8-OH, which disappears after 30 min to make way for C8. Aldol condensations are reversible reactions, so even after complete conversion has been reached, it could still be possible to obtain C13 from C8, even if formally furfural is absent, especially when one product is more stable than the other. Nevertheless, no such transformation is seen, and the composition of the mixture remains unaltered for 30 min after complete conversion. In addition, this test shows how the condensation products are substantially stable, and do not deteriorate in the reaction conditions.

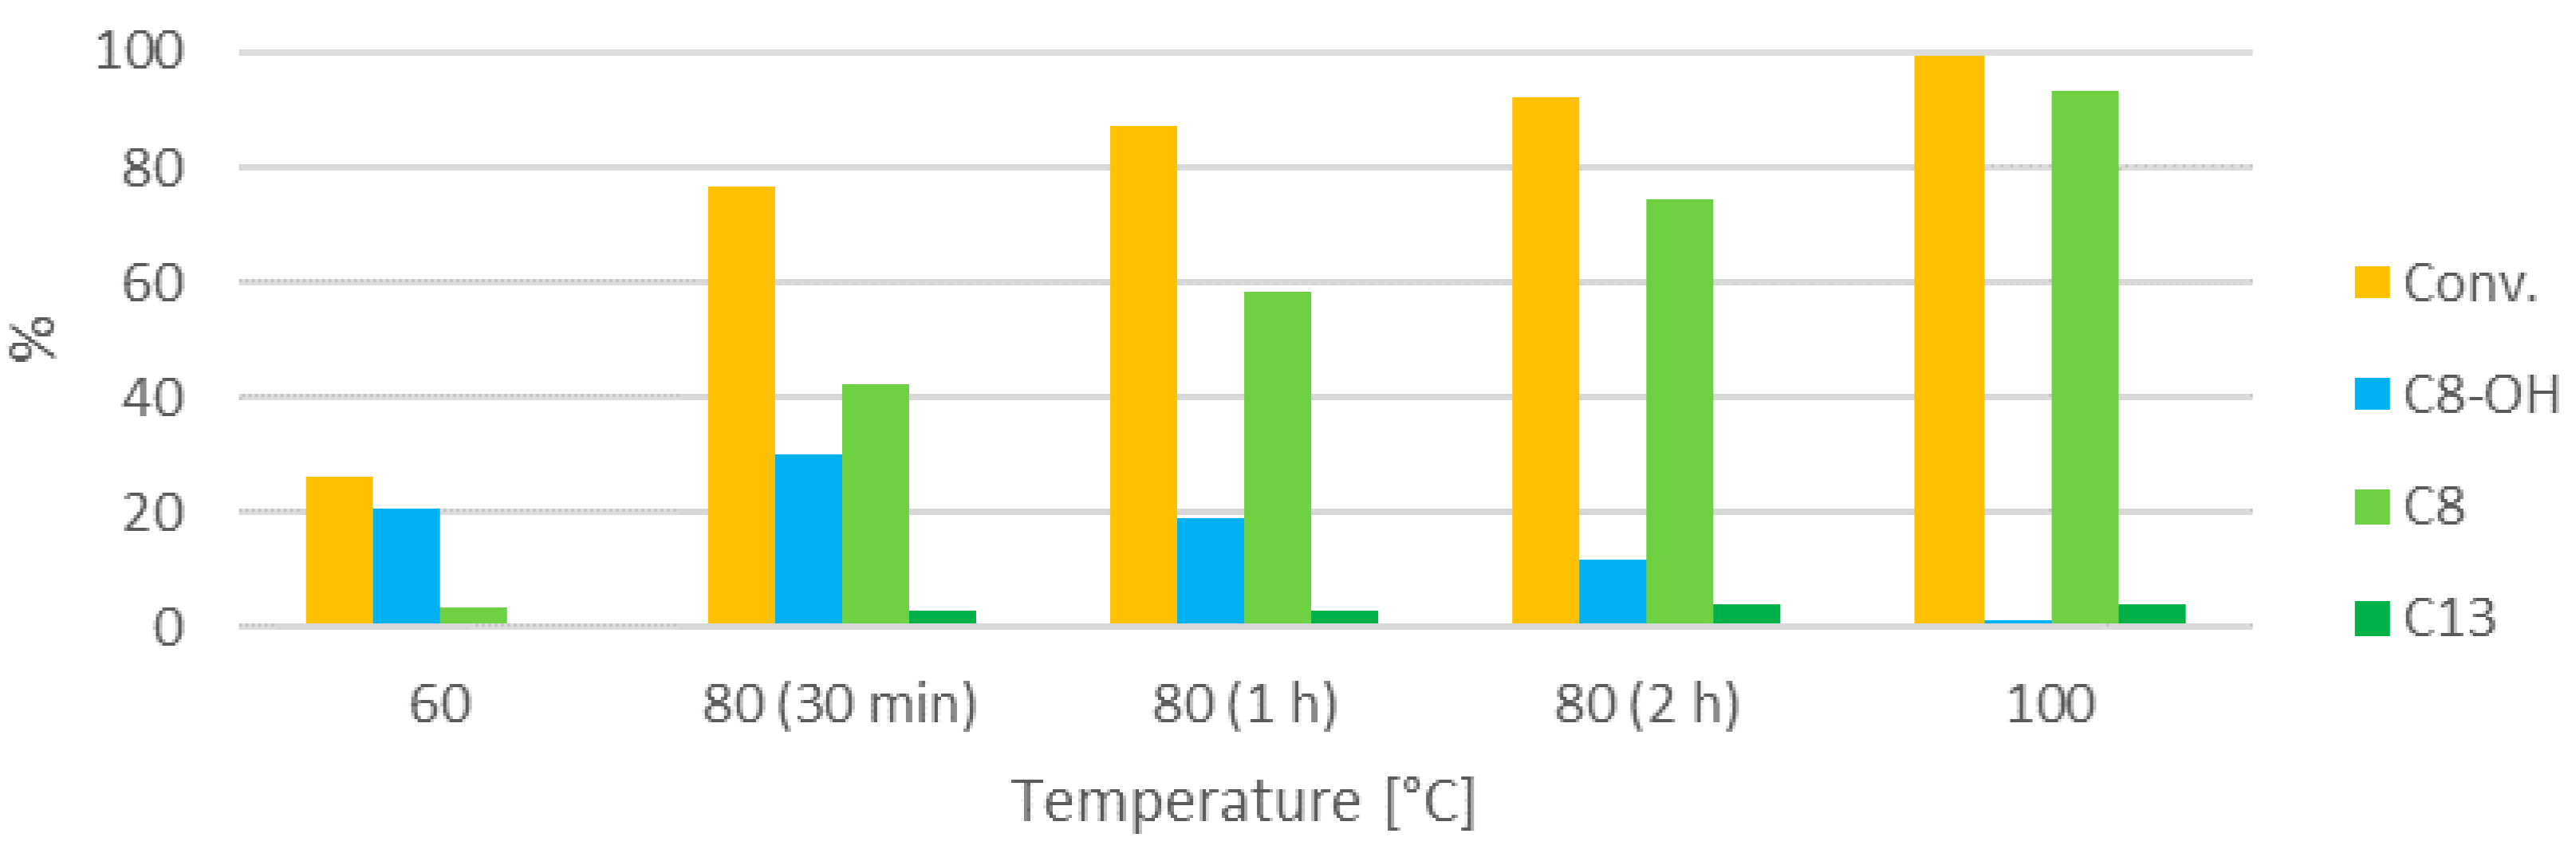
3.5. Influence of the Temperature

The reaction temperature is the next parameter that was studied (Figure 8).
The reaction at 60 °C is considerably slower than the reaction at 100 °C. Only traces of condensation products are observed. At 80 °C, an intermediate level of conversion is obtained, and the dehydration also appears to be favored by the higher temperature. However, the reaction at this temperature is still much slower than at 100 °C, and even when the reaction time is increased to 2 h, the conversion does not match the conversion in the experiment at 100 °C for 30 min. This might also be associated with the lower irradiation power. The C8:C13 ratio does not appear to be affected by the lower temperature.

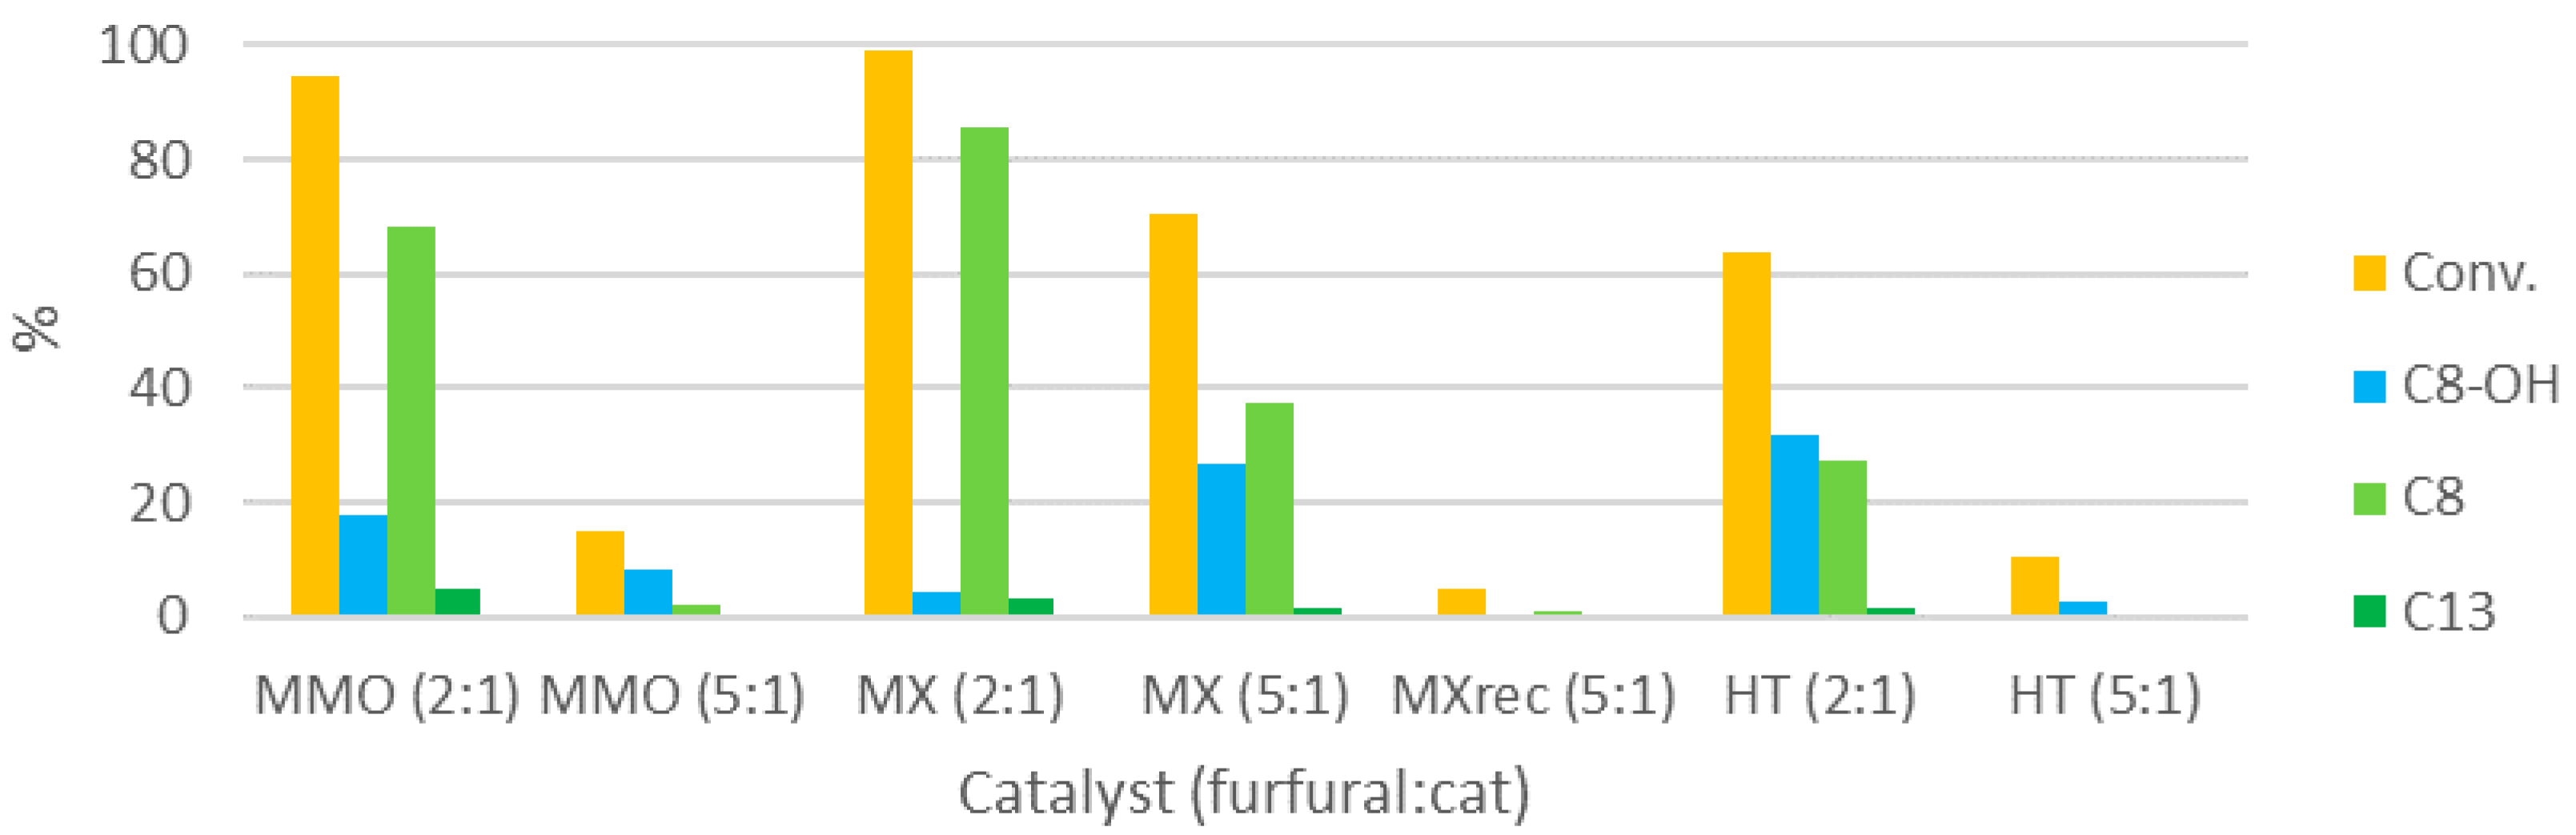
3.6. Choice of the Catalyst

A blank test was performed to confirm the role of the catalyst in the transformation. Indeed, no conversion and formation of product was seen in our reaction conditions. Other HT-derived catalysts were tested: HT was calcined to MMO, which was tested as a catalyst (Figure 9).
MMO proved to be a more active catalyst than HT, in terms of both furfural conversion and dehydration of C8-OH. As seen for HT, the MMO activity decreases if a 5:1 furfural:catalyst ratio is used. MMO was rehydrated in the liquid phase, and the solid collected after this modification, MX, was used as a catalyst for the condensation. MX was the most active of the catalysts tested, with conversion reaching >99% by the end of the heating step of only 10 min, and C8-OH dehydration being almost complete. Remarkably, the performance of this catalyst at a furfural:catalyst ratio of 5:1 was greater than when HT was used at the same ratio, and even at a 2:1 ratio, in the same conditions. Interestingly, the C8:C13 selectivity obtained with MMO as a catalyst was lower than when the parent catalyst was used (13 vs. 22). The selectivity obtained with MX was not significantly different (26). The solid in the mixture of an MX-catalyzed reaction was recovered by filtration, washed with abundant acetone, and then used as a catalyst in a subsequent reaction. This catalyst (MXrec) proved to be basically inactive; differently from the parent catalyst, which is a white solid, MXrec is a brown powder. Apparently, after reaction, organic matter is deposited on the catalyst surface and deactivates the catalyst.
MMO and MX were also tested at lower temperatures (Figure 10).
The conversion obtained with MMO at 80 °C is comparable to the conversion obtained at 100 °C, although the reaction time is much longer (30 min vs. 10). The same applies to the C8:C13 selectivity (13 in both cases). Decreasing the reaction temperature to 60 °C leads to a somewhat lower conversion, even with a reaction time as long as 1 h. Also, in this case, the activity decreases dramatically when the furfural:MMO ratio is decreased to 5:1, as was observed for the reaction at 100 °C. When using MX at 80 °C for 30 min the activity decreases, but with a 5:1 ratio, about half of the furfural can still be converted. When the same reaction is performed at 60 °C for 1 h, the conversion increases slightly. Using a 2:1 furfural:MX ratio leads to complete conversions and C8-OH dehydrations at these lower temperatures.
Differently from what has previously been reported with conventional heating (almost complete conversion at 100 °C in 2 h, excluding the pre-heating, with a catalyst analogous to MX at a 3.25:1 furfural:MX ratio [27]), in our MW-assisted process it was possible to obtain a 70% conversion with a 5:1 furfural:MX ratio with 10 min irradiation in the heating step to the same temperature. Likely, it is the interaction of microwaves with the solid catalysts that is the source of this activity boost. The reaction is also much faster than the reactions catalyzed by the most common heterogeneous catalysts (e.g., Mg–Al and Mg–Zr) in the aqueous phase [18].

4. Conclusions

We developed a microwave-assisted protocol to convert furfural and acetone very quickly into their aldol reaction (C8-OH) and condensation products (C8 and C13). The catalysts used are easy to prepare and to separate from the reaction mixture, they are not corrosive, and only contain earth-abundant elements. Our neat process is selective for the preparation of C8, which is achieved with satisfactory C8:C13 selectivity. This selectivity can be increased even further if the furfural concentration is decreased, whereas shifting the selectivity towards C13 requires the use of a solvent (or of a different catalyst). MX is by far the most active catalyst of the ones tested, followed by MMO and HT. Although this reactivity trend has been observed in many other reports, HT activity has not. HTs are usually reported to be inactive, or they are not even considered for catalytic testing. The formation of hotspots in the HT structure caused by MW irradiation may account for the atypical activity of this catalyst. The reaction also works well at temperatures lower than 100 °C but, of course, a much longer reaction time is required.

Supplementary Materials

The following are available online at https://www.mdpi.com/2073-4352/10/9/833/s1: Figure S1: Parameter profiles in a typical microwave experiment; Figure S2: Mass spectra of the various chemical species detected in the final reaction mixtures by GC-MS.

Author Contributions

Investigation: A.T. and M.L.; writing—original draft preparation: A.T.; writing—review and editing: F.M. and M.C.; supervision: F.M. All authors have read and agreed to the published version of the manuscript.

Funding

A.T. thanks AGAUR (Generalitat de Catalunya) and ESF (European Union) for his postgraduate scholarship (2018 FI_B 01124). F.M. and M.C. thank the Ministerio de Economía y Competitividad for financial support (RTI2018-098310-B-I00).

Acknowledgments

S. Dominguez and the technicians of the Servei de Recursos Científics i Tècnics of URV are gratefully acknowledged for assistance in the characterizations.

Conflicts of Interest

The authors declare no conflict of interest. The funders had no role in the design of the study; in the collection, analyses, or interpretation of data; in the writing of the manuscript; or in the decision to publish the results.

References

  1. Capellán-Pérez, I.; Mediavilla, M.; De Castro, C.; Carpintero, Ó.; Miguel, L.J. Fossil fuel depletion and socio-economic scenarios: An integrated approach. Energy 2014, 77, 641–666. [Google Scholar] [CrossRef]
  2. Levi, P.G.; Cullen, J.M. Mapping Global Flows of Chemicals: From Fossil Fuel Feedstocks to Chemical Products. Environ. Sci. Technol. 2018, 52, 1725–1734. [Google Scholar] [CrossRef] [PubMed]
  3. Bogdanov, D.; Farfan, J.; Sadovskaia, K.; Aghahosseini, A.; Child, M.; Gulagi, A.; Oyewo, A.S.; De Souza Noel Simas Barbosa, L.; Breyer, C. Radical transformation pathway towards sustainable electricity via evolutionary steps. Nat. Commun. 2019, 10, 1077. [Google Scholar] [CrossRef] [PubMed] [Green Version]
  4. Falkowski, P.; Scholes, R.J.; Boyle, E.; Canadell, J.; Canfield, D.; Elser, J.; Gruber, N.; Hibbard, K.; Högberg, P.; Linder, S.; et al. The global carbon cycle: A test of our knowledge of earth as a system. Science 2000, 290, 291–296. [Google Scholar] [CrossRef] [PubMed] [Green Version]
  5. Corma, A.; Iborra, S.; Velty, A. Chemical routes for the transformation of biomass into chemicals. Chem. Rev. 2007, 107, 2411–2502. [Google Scholar] [CrossRef] [PubMed]
  6. Höök, M.; Tang, X. Depletion of fossil fuels and anthropogenic climate change—A review. Energy Policy 2013, 52, 797–809. [Google Scholar] [CrossRef] [Green Version]
  7. Ahorsu, R.; Medina, F.; Constantí, M. Significance and Challenges of Biomass as a Suitable Feedstock for Bioenergy and Biochemical Production: A Review. Energies 2018, 11, 3366. [Google Scholar] [CrossRef] [Green Version]
  8. Wang, W.-C.; Tao, L. Bio-jet fuel conversion technologies. Renew. Sustain. Energy Rev. 2016, 53, 801–822. [Google Scholar] [CrossRef] [Green Version]
  9. West, R.M.; Liu, Z.Y.; Peter, M.; Dumesic, J.A. Liquid alkanes with targeted molecular weights from biomass-derived carbohydrates. ChemSusChem 2008, 1, 417–424. [Google Scholar] [CrossRef]
  10. Gruber, H.; Groß, P.; Rauch, R.; Reichhold, A.; Zweiler, R.; Aichernig, C.; Müller, S.; Ataimisch, N.; Hofbauer, H. Fischer-Tropsch products from biomass-derived syngas and renewable hydrogen. Biomass Conv. Biorefin. 2019, 48, 22. [Google Scholar] [CrossRef] [Green Version]
  11. Zang, H.; Wang, K.; Zhang, M.; Xie, R.; Wang, L.; Chen, E.Y.-X. Catalytic coupling of biomass-derived aldehydes into intermediates for biofuels and materials. Catal. Sci. Technol. 2018, 8, 1777–1798. [Google Scholar] [CrossRef]
  12. Sutton, A.D.; Waldie, F.D.; Wu, R.; Schlaf, M.; Silks, L.A.P.; Gordon, J.C. The hydrodeoxygenation of bioderived furans into alkanes. Nat. Chem. 2013, 5, 428–432. [Google Scholar] [CrossRef] [PubMed]
  13. Chang, H.; Motagamwala, A.H.; Huber, G.W.; Dumesic, J.A. Synthesis of biomass-derived feedstocks for the polymers and fuels industries from 5-(hydroxymethyl)furfural (HMF) and acetone. Green Chem. 2019, 21, 5532–5540. [Google Scholar] [CrossRef]
  14. Mamman, A.S.; Lee, J.-M.; Kim, Y.-C.; Hwang, I.T.; Park, N.-J.; Hwang, Y.K.; Chang, J.-S.; Hwang, J.-S. Furfural: Hemicellulose/xylosederived biochemical. Biofuels Bioprod. Biorefin. Innov. Sustain. Econ. 2008, 2, 438–454. [Google Scholar] [CrossRef]
  15. Mariscal, R.; Maireles-Torres, P.; Ojeda, M.; Sádaba, I.; López Granados, M. Furfural: A renewable and versatile platform molecule for the synthesis of chemicals and fuels. Energy Environ. Sci. 2016, 9, 1144–1189. [Google Scholar] [CrossRef]
  16. Kelly, G.J.; King, F.; Kett, M. Waste elimination in condensation reactions of industrial importance. Green Chem. 2002, 4, 392–399. [Google Scholar] [CrossRef]
  17. Huber, G.W.; Chheda, J.N.; Barrett, C.J.; Dumesic, J.A. Production of liquid alkanes by aqueous-phase processing of biomass-derived carbohydrates. Science 2005, 308, 1446–1450. [Google Scholar] [CrossRef] [Green Version]
  18. Faba, L.; Díaz, E.; Ordóñez, S. Aqueous-phase furfural-acetone aldol condensation over basic mixed oxides. Appl. Catal. B Environ. 2012, 113–114, 201–211. [Google Scholar] [CrossRef]
  19. Desai, D.S.; Yadav, G.D. Green Synthesis of Furfural Acetone by Solvent-Free Aldol Condensation of Furfural with Acetone over La2O3–MgO Mixed Oxide Catalyst. Ind. Eng. Chem. Res. 2019, 58, 16096–16105. [Google Scholar] [CrossRef]
  20. Smoláková, L.; Dubnová, L.; Kocík, J.; Endres, J.; Daniš, S.; Priecel, P.; Čapek, L. In-situ characterization of the thermal treatment of Zn-Al hydrotalcites with respect to the formation of Zn/Al mixed oxide active in aldol condensation of furfural. Appl. Clay Sci. 2018, 157, 8–18. [Google Scholar] [CrossRef]
  21. Kikhtyanin, O.; Chlubná, P.; Jindrová, T.; Kubička, D. Peculiar behavior of MWW materials in aldol condensation of furfural and acetone. Dalton Trans. 2014, 43, 10628–10641. [Google Scholar] [CrossRef]
  22. Nishimura, S.; Takagaki, A.; Ebitani, K. Characterization, synthesis and catalysis of hydrotalcite-related materials for highly efficient materials transformations. Green Chem. 2013, 15, 2026. [Google Scholar] [CrossRef]
  23. Lari, G.M.; De Moura, A.B.L.; Weimann, L.; Mitchell, S.; Mondelli, C.; Pérez-Ramírez, J. Design of a technical Mg–Al mixed oxide catalyst for the continuous manufacture of glycerol carbonate. J. Mater. Chem. A 2017, 5, 16200–16211. [Google Scholar] [CrossRef]
  24. Cueto, J.; Faba, L.; Díaz, E.; Ordóñez, S. Performance of basic mixed oxides for aqueous-phase 5-hydroxymethylfurfural-acetone aldol condensation. Appl. Catal. B Environ. 2017, 201, 221–231. [Google Scholar] [CrossRef]
  25. Abelló, S.; Medina, F.; Tichit, D.; Pérez-Ramírez, J.; Groen, J.C.; Sueiras, J.E.; Salagre, P.; Cesteros, Y. Aldol condensations over reconstructed Mg-Al hydrotalcites: Structure-activity relationships related to the rehydration method. Chem. Eur. J. 2005, 11, 728–739. [Google Scholar] [CrossRef]
  26. Abelló, S.; Vijaya-Shankar, D.; Pérez-Ramírez, J. Stability, reutilization, and scalability of activated hydrotalcites in aldol condensation. Appl. Catal. A General 2008, 342, 119–125. [Google Scholar] [CrossRef]
  27. Hora, L.; Kelbichová, V.; Kikhtyanin, O.; Bortnovskiy, O.; Kubička, D. Aldol condensation of furfural and acetone over MgAl layered double hydroxides and mixed oxides. Catal. Today 2014, 223, 138–147. [Google Scholar] [CrossRef]
  28. Horikoshi, S.; Schiffmann, R.F.; Fukushima, J.; Serpone, N. Microwave Chemical and Materials Processing; Springer: Singapore, 2018; ISBN 978-981-10-6465-4. [Google Scholar]
  29. Kokel, A.; Schäfer, C.; Török, B. Application of microwave-assisted heterogeneous catalysis in sustainable synthesis design. Green Chem. 2017, 19, 3729–3751. [Google Scholar] [CrossRef]
  30. Zeitsch, K.J. The Discoloration of Furfural. In the Chemistry and Technology of Furfural and Its Many by-Products; Elsevier: Amsterdam, The Netherlands, 2000; pp. 28–33. ISBN 9780444503510. [Google Scholar]
  31. Scanlon, J.T.; Willis, D.E. Calculation of Flame Ionization Detector Relative Response Factors Using the Effective Carbon Number Concept. J. Chromatogr. Sci. 1985, 23, 333–340. [Google Scholar] [CrossRef]
  32. Mokhtar, M.; Inayat, A.; Ofili, J.; Schwieger, W. Thermal decomposition, gas phase hydration and liquid phase reconstruction in the system Mg/Al hydrotalcite/mixed oxide: A comparative study. Appl. Clay Sci. 2010, 50, 176–181. [Google Scholar] [CrossRef]
  33. Barriga, C.; Gaitán, M.; Pavlovic, I.; Ulibarri, M.A.; Hermosĩn, M.C.; Cornejo, J. Hydrotalcites as sorbent for 2,4,6-trinitrophenol: Influence of the layer composition and interlayer anion. J. Mater. Chem. 2002, 12, 1027–1034. [Google Scholar] [CrossRef]
  34. Abelló, S.; Medina, F.; Tichit, D.; Pérez-Ramírez, J.; Rodríguez, X.; Sueiras, J.E.; Salagre, P.; Cesteros, Y. Study of alkaline-doping agents on the performance of reconstructed Mg–Al hydrotalcites in aldol condensations. Appl. Catal. A Gen. 2005, 281, 191–198. [Google Scholar] [CrossRef]
  35. Galindo, R.; López-Delgado, A.; Padilla, I.; Yates, M. Hydrotalcite-like compounds: A way to recover a hazardous waste in the aluminium tertiary industry. Appl. Clay Sci. 2014, 95, 41–49. [Google Scholar] [CrossRef] [Green Version]
  36. Xu, C.; Gao, Y.; Liu, X.; Xin, R.; Wang, Z. Hydrotalcite reconstructed by in situ rehydration as a highly active solid base catalyst and its application in aldol condensations. RSC Adv. 2013, 3, 793–801. [Google Scholar] [CrossRef]
  37. Thommes, M.; Kaneko, K.; Neimark, A.V.; Olivier, J.P.; Rodriguez-Reinoso, F.; Rouquerol, J.; Sing, K.S.W. Physisorption of gases, with special reference to the evaluation of surface area and pore size distribution (IUPAC Technical Report). Pure Appl. Chem. 2015, 87, 1051–1069. [Google Scholar] [CrossRef] [Green Version]
Scheme 1. Base-catalyzed aldol condensation of furfural and acetone.
Crystals 10 00833 sch001
Figure 1. (a) Photograph of the microwave (MW) reactor, and (b) scheme of the reaction vessel during operation.
Crystals 10 00833 g001
Figure 2. X-ray diffractograms of the prepared catalysts.
Crystals 10 00833 g002
Figure 3. TGA (colored lines) and DSC (black lines, exo up) curves of the prepared catalysts.
Crystals 10 00833 g003
Figure 4. (a) Isotherms of N2 adsorption–desorption, and (b) Barrett–Joyner–Halenda (BJH) pore size distributions of the prepared catalysts.
Crystals 10 00833 g004
Figure 5. Influence of furfural concentration (at 100 °C, 30 min, furfural:HT 2:1).
Crystals 10 00833 g005
Figure 6. Influence of the furfural:HT ratio (at 100 °C, 30 min, concentration 0.21 M).
Crystals 10 00833 g006
Figure 7. Influence of the reaction time (at 100 °C, furfural:HT 2:1, 0.21 M).
Crystals 10 00833 g007
Figure 8. Influence of the reaction temperature (30 min, furfural:HT 2:1, 0.21 M).
Crystals 10 00833 g008
Figure 9. Influence of the catalyst choice (at 100 °C, 10 min, 0.21 M).
Crystals 10 00833 g009
Figure 10. Performances of the various catalysts at lower temperatures (0.21 M).
Crystals 10 00833 g010
Table 1. Results of the ICP-AES analysis of the prepared catalysts.
HT MMO MX
2θ [°]<hkl>Size [nm] Size [nm] 2θ [°]<hkl>Size [nm]
11.750039.16 2.48 11.7700317.71
23.460067.95 23.5000614.06
34.960098.33 34.930099.42
39.400154.11 39.430154.90
46.840183.04 46.900183.63
60.9011023.43 60.8411033.18
62.2111313.64 62.1711320.23
Lattice parameters [Å]
a = 3.05 a = 4.19 a = 3.05
c = 22.83 c = 22.74
Table 2. Results of the ICP-AES analysis of the prepared catalysts.
EntryCatalystMg [w/w%]Al [w/w%]Na [w/w%]Mg/Al [at/at]
1HT21.011.2n.d2.07
2MMO34.718.60.062.07
3MX20.611.1n.d.2.06
Table 3. Results of the N2 physisorption analysis of the prepared catalysts.
EntryCatalystSBET [m2/g]Vpore [mL/g]rpore [Å]
1HT120.6050.71962.321
2MMO256.8800.95187.679
3MX45.7390.35385.812

