Article

Comparison of the Isotopic Composition of Silicon Crystals Highly Enriched in 28Si

Physikalisch-Technische Bundesanstalt (PTB), Bundesallee 100, 38116 Braunschweig, Germany
*
Author to whom correspondence should be addressed.
Crystals 2020, 10(6), 500; https://doi.org/10.3390/cryst10060500
Submission received: 27 May 2020 / Revised: 8 June 2020 / Accepted: 9 June 2020 / Published: 11 June 2020
(This article belongs to the Special Issue Growth and Evaluation of Crystalline Silicon (Volume II))

Abstract

:
The isotopic composition and molar mass M of silicon in a new crystal (code: Si28-33Pr11) measured by isotope ratio mass spectrometry using a high-resolution multicollector-inductively coupled plasma mass spectrometer (MC-ICP-MS) is presented using the virtual-element isotope dilution mass spectrometry (VE-IDMS) method. For this new crystal, M = 27.976 950 48 (16) g/mol was determined with urel(M) = 5.7 × 10⁻⁹. The “X-ray-crystal-density (XRCD) method”, one of the primary methods for realizing and disseminating the SI units kilogram and mole in the recently revised SI, is based on “counting” silicon atoms in silicon single crystal spheres. One of the key quantities is the isotopic composition—expressed by the molar mass M—of the three stable isotopes 28Si, 29Si, and 30Si in the material highly enriched in 28Si. M was determined with lowest possible uncertainty using latest improvements of the experimental techniques. All uncertainties were estimated according to the “Guide to the expression of uncertainty in measurement, GUM”. The results of the new crystal are discussed and compared with the four previously available crystals, establishing a worldwide limited pool of primary reference spheres of highest metrological quality.

Graphical Abstract

1. Introduction

The choice of silicon with the three stable natural isotopes 28Si, 29Si, and 30Si as an element which is ideally suitable for the realization and dissemination of the SI base units kilogram and mole dates back to its first comprehensive use for the X-ray-crystal-density (XRCD) method in the 1970s, first applied by the National Bureau of Standards (now National Institute of Standards and Technology, NIST) [1,2]. During the 1980s up to the beginning of the 2000s, first silicon with a natural isotopic abundance has been used for the production of single crystals in a macroscopic manner ready to produce perfectly round spheres with a mass of approximately one kilogram each [3]. Silicon has a long tradition in semiconductor research and applications [4], the underlying knowledge and improved techniques for the growth of macroscopic single crystals marks Si an ideal candidate for the XRCD method [5]. Moreover, the mechanical robustness of the macroscopic spheres including the stability of oxide surface layers turns it into a material of choice [6]. The broader background of the research—focused on the isotopic composition and molar mass M of the silicon material—was the revision of the Si units defined by fixed fundamental physical constants in 2019 and the scientific methods used therein [7,8]. The kilogram, now defined via the numerical value of the Planck constant h, and the mole, defined via the numerical value of the Avogadro constant NA, are best realized and disseminated by the Kibble balance (watt balance) and the XRCD method, respectively [5,9]. The exceptional advantage is that both units can be realized and disseminated by one of these two primary methods which are of comparative nature, yielding both smallest measurement uncertainties. From 2007, silicon highly enriched in 28Si is used in the XRCD method, because when taking silicon with natural isotopic composition, the relative uncertainty associated with the molar mass M, a key quantity in this procedure, reaches a lower limit in the 10−7 range, at least one order of magnitude too high for a respective small uncertainty of NA and thus a precondition of the revision of the SI at that time. Using the enriched silicon crystal material, urel(M) is smaller than 10−8 applying the methods described later. The basic principle of the XRCD method is the “counting” of all silicon atoms of a macroscopic silicon sphere with lowest associated uncertainty yielding NA using the relation
N A = 8 V a 3 M m = N n
here, V = Vsphere is the volume of the macroscopic silicon sphere (≈430 mL), 8 is the number of atoms in the unit cell, M is the molar mass, m is the mass of the Si sphere (≈1 kg), a is the lattice parameter. This yields the total number N of silicon atoms and the amount of substance n. As stated, from 2018 NA has a fixed numerical value NA = 6.022 140 76 × 1023 mol−1 without an associated uncertainty by definition. This in turn shows, that a silicon sphere characterized by the XRCD method (second term in Equation (1)) can serve as a primary mass standard which is expressed by
m = 8 V a 3 2 R h c α 2 i [ x ( i S i ) A r ( i S i ) ] A r ( e ) + m sur m def
with the Rydberg constant R, the Planck constant h, the speed of light in vacuum c, the fine structure constant α, the relative atomic mass of the electron Ar(e), the relative atomic masses Ar(iSi) of the silicon isotopes—given in respective updated tables [10], the mass of surface layers msur, and the mass of point defects mdef. In a similar way, the base quantity amount of substance n is realized and disseminated
n = 8 V a 3 2 R h c α 2 1 A r ( e ) M u = 8 V a 3 1 N A
in the third term of Equation (3), the molar mass constant Mu must be considered with Mu = 1.000 000 000 00 (45) g mol−1 [11].
The application of the XRCD method for the realization and dissemination of the kilogram and the mole thus constitutes one of the two best (on a metrological scale) respective experiments. In case of the XRCD method this means that not only one single sphere but a pool of several rather similar spheres of highest quality should be available. Due to the extreme enrichment of x(28Si) > 0.999 9 mol/mol (with the amount-of-substance fraction x), the production of a respective crystal is both time consuming and extremely expensive which explains the very limited number of spheres available on that level [12]. In this article, we report on the isotopic composition x(iSi) and molar mass M of another new silicon single crystal highly enriched in 28Si with the code Si28-33Pr11. From the new crystal ingot (Figure 1), two spheres were cut as schematically shown in Figure 2.
The molar mass M has been derived from four samples (≈ 500 mg each) bracketing the outer limits of the spheres in the regions N and V. All data were calculated using an uncertainty analysis with respect to the “Guide to Expression of Uncertainty in Measurement” (GUM) [13]. We compared the results of the present crystal with the other available crystals highly enriched in 28Si: Si28-10Pr11 (“AVO28-crystal” (2007)), Si28-23Pr11 (2015), Si28-24Pr11 (2016), and Si28-31Pr11 (2018). From each crystal two spheres are available.

2. Theoretical Background

The silicon material described in this article requires a special methodology for the measurement of the molar mass and isotopic composition, because of the extreme enrichment in 28Si and thus the ultra-low abundances of 29Si and 30Si. For this reason, typical mass spectrometric methods used for the determination of M and/or x(iSi) might fail or will lead to large uncertainties. Details of these procedures have been published elsewhere [14,15,16]. Briefly, a modified isotope-dilution mass spectrometry method (virtual-element isotope dilution mass spectrometry: VE-IDMS) was applied in combination with isotope ratio mass spectrometry (high resolution multicollector inductively-coupled plasma mass spectrometer MC-ICP-MS). Mass bias correction of the measured isotope ratios was performed using a gravimetric mixtures method yielding the necessary calibration (K) factors [15]. The measurement of the isotope ratios will give accesses to the respective x(iSi). The extremely high enrichment will generate too large uncertainties if ratios e.g., 30Si/28Si are measured. Therefore, the silicon material is treated as consisting of (theoretically) 29Si and 30Si only (the virtual element which can be regarded as an impurity) in the matrix of 28Si (an excess amount). The measurements require mainly the determination of the isotope ratios R(30Si/29Si) = x(30Si)/(x(29Si) and the knowledge of the masses (myx and mx) of components in the blend bx of the sample material x (Si enriched in 28Si) and a “spike” material y (Si enriched in 30Si). Finally, the amount-of-substance fractions x(iSi) and the molar mass M will be derived, the latter with relative uncertainties in the 10−9 range. The VE-IDMS method has been applied and validated by several national metrology institutes (NMIs) and serves as a primary method [17,18,19,20].

3. Materials and Experimental Methods

The silicon samples (each with a mass of approximately 500 mg) were cut from two axial positions (parts N and V) of the original ingot (compare Figure 2). From each part, two samples (adjacent to the axis and with a small distance) were used, bracketing the intended area of the two spheres. The crystal has been produced in Russia (isotopic enrichment at the Stock Company Production Association Electrochemical Plant (Sc “PA ECP”) in Zelenogorsk and the production of the polycrystal in the G.G. Devyatykh Institute of Chemistry of High-Purity Substances of the Russian Academy of Sciences (IChHPS RAS) in Nizhny Novgorod, and finally at the Leibniz-Institute for Crystal Growth (IKZ) in Berlin in the framework of a joint project aiming at manufacturing several silicon crystal-spheres highly enriched in 28Si [12,21,22]. The sample notation is: Si28-33Pr11 N.2.1, Si28-33Pr11 N.2.3, Si28-33Pr11 V.2.1, and Si28-33Pr11 V.2.3. Prior to the preparation of the sample solutions used for the mass spectrometric measurements, the solid samples were carefully cleaned and etched to remove possible surface layers of e.g., oxides [23]. The rather large size of the individual samples was necessary, because of the extremely high enrichment in the 28Si isotope and thus the respectively very small abundances in 29Si and 30Si with the latter being the analytes of interest. The cleaned and etched samples were weighed (with buoyancy correction) dissolved in aqueous tetramethylammonium hydroxide (TMAH)(Electronic Grade, 99.9 999 %, Alfa Aesar, Thermo Fisher GmbH, Kandel, Germany) with a mass fraction of the final sample solution w(TMAH) = 0.0006 g/g. This yields the following mass fractions of the solutions to be measured with the MC-ICP-MS: sample wx(Si) ≈ 4000 µg/g, blend wbx(Si) ≈ 3000 µg/g, and natural silicon for mass bias correction ww(Si) = 4 µg/g. All mass spectrometric measurements were performed with a Neptune XT™ MC-ICP-MS (Thermo Fisher Scientific GmbH, Bremen, Germany) using the operation parameters listed in Table 1.
The isotope ratio measurements were carried out in exactly the same way for the samples x, the blends bx, the natural material w, and the blank solutions. Prior to each silicon solution, a blank solution was measured to enable the signal correction for blank and carry-over effects. Each silicon solution was measured four times in the order sample x, blend bx, and natural silicon w yielding the uncorrected intensity ratios (in V/V) of 30Si/29Si.
The natural silicon solution w was measured at the end of each sequence in order to avoid a contamination of the isotopic composition of the sample and blend solution. Moreover, the measured intensity ratio Rmeas(30Si/29Si) in w was used to calculate the respective K factor applying the “true” values of Rw given elsewhere [24]. With that K factor, each measured ratio Rmeas(30Si/29Si) was converted to a corrected isotope ratio R(30Si/29Si) of that sequence.

4. Results and Discussion

4.1. Molar Mass of Si28-33Pr11

In this study, four samples were measured aiming at a first glance overview of the behavior/distribution of the molar mass (isotopic composition) along the crystal axis acting as a first decision guidance for the cutting regions of the two spheres. It is the first study on the molar mass of enriched silicon in our group using a new further development of the Neptune™ MC-ICP-MS, the new Neptune XT™. Each sample was measured in exactly the same way using the same sequences and operating conditions. Four to six sequences per samples were measured (in total 21 sequences, see Supplementary Materials). The average molar mass values of the respective samples are shown in Figure 3 (with associated uncertainties, k = 1). The respective data as well as the amount-of-substance fractions x are listed in Table 2. In contrast to comparable studies performed with other crystals of enriched silicon, the average uncertainty of the average molar mass of all four crystals measured in this study is slightly increased yielding M(Si) = 27.976 950 48 (16) g/mol with urel(M) = 5.7 × 10⁻⁹ (including data scattering) [21,22,24].
The reason for this increase is suggested to originate from data scattering between the different measurements as will be shown below. At a first glance, the molar masses of the measured samples agree within the limits of uncertainty and thus the crystal can be treated as homogeneous along the main axis which is supported by the general manufacturing process of the float-zone crystal as has been described previously [12]. The relative uncertainties associated with M of the single measurements range in the lower 10−9 region not including data scattering as reported in [22]. Figure 4 displays the detailed measurement results of M of the crystal sample V.2.3. Here, the error bars indicate the respective uncertainties without including data scattering. It is evident that some data points are not included in the k = 1 range. Since this behavior is observed when measuring a single sample, it is clear that this kind of fluctuation cannot be attributed to inhomogeneities of the material (e.g., disordering or impurities in the crystal lattice). The scattering is a combined result of the experimental conditions (plasma stability, decrease of sensitivity due to strong depositions of Si components on the sampler and skimmer cones during the measurement of the highly concentrated Si solutions, general low signal abundance).
A consistency analysis calculating the degrees of equivalence (di) has been performed for the molar mass results of the four samples (Figure 5) with di = MiM (differences of the single samples values and average value of the molar mass). Within the limits of uncertainty, all di enclose the zero line, clearly showing the consistency of the molar masses of the crystal samples. A representative uncertainty analysis (single measurement of sample N.2.1) is given in Table 3. The uncertainty analysis was performed using the GUM Workbench Pro™ software (version 2.4.1 392, Metrodata GmbH, Braunschweig, Germany) according to the model equation of the molar mass of the VE-IDMS principle e.g., [21]. As in previous studies on other crystals highly enriched in 28Si, one of the main contributions to the uncertainty associated with M is the measured intensity ratio (index 2 denotes the ratio 30Si/29Si) R bx , 2 meas in the blend of the sample and the “spike” material (Si enriched in 30Si); here with 61%. The second main contribution (24.5%) is the corrected isotope ratio Rw,2 of the natural silicon material w measured for the K factor determination. The measured intensity ratio R x , 2 meas in the sample contributes with another 13%. The masses of the components in the blend bx as well as the molar masses of the individual silicon isotopes do not contribute to the uncertainty at all.
The comparable small contribution of R x , 2 meas to u(M) is unusual, because of the isotopic composition of this very crystal. Although the enrichment in 28Si with x(28Si) = 0.999 976 24 (19) mol/mol is not that large compared to other highly enriched silicon crystals (see Section 3), the characteristic of the crystal Si28-33Pr11 is the large ratio of x(29Si) and x(30Si) with two orders of magnitude. This is an additional experimental challenge: the small abundance of 29Si is accompanied by a much smaller signal of 30Si leading to a difficult data collection.

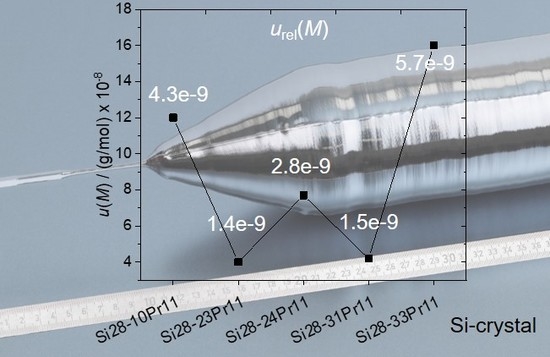
4.2. Comparison of the Available Highly Enriched Silicon Crystals

The realization and dissemination of the kilogram and mole via the XRCD method is based on silicon spheres highly enriched in 28Si with extremely high chemical purity and an almost perfect crystal lattice [5]. Again, only an enrichment in 28Si of this order of magnitude is capable to yield an uncertainty of urel(M) < 1.0 × 10⁻⁸ which is essential to obtain urel(NA) < 2 × 10⁻⁸, which was a prerquisite for the realization of NA prior to the revision of the SI [5]. A silicon sphere matching this condition is called a “primary” sphere according the notation given in [6]. A sphere of this kind must be well characterized by the XRCD method. Due to the large amount of material (1 kg per sphere), the manufacturing is extremely expensive, but also time consuming with the need of extraordinary logistic efforts [12]. This is the reason why only a small pool of spheres has been manufactured yet, each a kind of an individual material artefact with properties of its own. Currently, the production of ten spheres has been completed/is under way according to the original crystals listed in Table 4. Each of the spheres can be used as a primary mass standard with lowest associated uncertainty u(m) on the metrological top level suitable for the calibration/comparison of other weights on the next lower metrological level. Therefore, the spheres are interchanged in part for the reason of laboratory intercomparisons on the highest level. Additionally, they are object of basic metrological research (XRCD properties and time-dependent changes of surface characteristics). The spheres with the highest enrichment in 28Si are originating from the crystal Si24-Pr11 (the second crystal manufactured during the “kilogram-2 project” [12]) with an amount-of-substance fraction x(28Si) > 0.999 99 mol/mol, followed by the spheres from Si28-31Pr11 (obtained during the “kilogram-3 project”), the latter not yet fully characterized. All available crystals show an enrichment of at least x(28Si) > 0.999 9 mol/mol. In Figure 6, both the average molar masses and x(28Si) of the respective crystals are compared. It is evident that there is a strong correlation between M and x(28Si).
The error bars (uncertainties) of both M and x(28Si) are not shown in Figure 6, because of their comparable small range which is covered by the data points itself. On an absolute scale, the “abundance” of 29Si and 30Si is “tiny” yielding ranges of approximately 6 × 10⁻⁶ < x(29Si) < 4 × 10⁻⁵ mol/mol. The range of x(30Si) is lowered by up to two orders of magnitude: 2 × 10⁻⁷ < x(30Si) < 1 × 10⁻⁶ mol/mol. In fact, the measurement of the 30Si isotopes is challenging, and the more difficult, the smaller x(30Si). This experimental problem is not influencing the uncertainty associated with M because of the absence of any input values of amount-of-substances in the conditional equation of M given in [24].

5. Conclusions

This work presents latest results of the molar mass and amount-of-substance fractions of a new chemically ultrapure silicon crystal (Si28-33Pr11), highly enriched in 28Si, to be used for the preparation of two additional spheres in the very limited pool of primary reference standards for the dissemination of the kilogram and the mole. For the correct estimation of Si atoms, it is necessary to determine chemical impurities like C, N, and O (in the lower ranges of 1015 cm3, 1013 cm3, and 1014–1015 cm3, respectively) via IR spectroscopy most exactly. The reported crystal produced during the “kilogram-3-project” serves as the origin of two new unique spheres. The isotopic composition expressed by the molar mass M has been determined at several crystal positions yielding an average M = 27.976 950 48 (16) g/mol with urel(M) = 5.7 × 10⁻⁹. Now, crystals highly enriched in 28Si enable the use of 10 respective spheres, characterized by the XRCD method, which can be compared worldwide acting as the highest standards for the mass and amount-of-substance. However, the silicon crystals differ in their absolute compositions of 28Si, 29Si, and 30Si aiming first at the high enrichment in 28Si. The uncertainty associated with M is correlated at a first glance with the enrichment in 28Si. In parallel, the measurability of the isotopes 29Si and 30Si—which are the main target measurands using the VE-IDMS principle—is a limiting factor. Due to the extremely tiny abundance of both isotopes, urel(M) might increase although x(28Si) increases. Thus, care must be taken that for future productions of silicon spheres highly enriched in 28Si (x(28Si) > 0.999 9 mol/mol), there should be a proper balance between high enrichment and a reasonable ratio 29Si/30Si on a measurable scale.

Supplementary Materials

The following are available online at https://www.mdpi.com/2073-4352/10/6/500/s1.

Author Contributions

Conceptualization; methodology; validation; formal analysis; investigation; resources; data curation; writing—original draft preparation; writing—review and editing; visualization, O.R. and A.P. All authors have read and agreed to the published version of the manuscript.

Funding

This research received no external funding.

Acknowledgments

The authors gratefully acknowledge the provisioning of silicon samples from the ingot crystal by Daniela Eppers (PTB).

Conflicts of Interest

The authors declare no conflict of interest.

References

  1. Deslattes, R.D.; Henins, A.; Bowman, H.A.; Schoonover, R.M.; Carroll, C.L.; Barnes, I.L.; Machlan, L.A.; Moore, L.J.; Shields, W.R. Determination of the Avogadro-Constant. Phys. Rev. Lett. 1974, 33, 463–466. [Google Scholar] [CrossRef]
  2. Deslattes, R.D.; Henins, A.; Schoonover, R.M.; Carroll, C.L.; Bowman, H.A. Avogadro-Constant-Corrections to an Earlier Report. Phys. Rev. Lett. 1976, 36, 898–900. [Google Scholar] [CrossRef]
  3. Becker, P. History and progress in the accurate determination of the Avogadro constant. Rep. Prog. Phys. 2001, 64, 1945–2008. [Google Scholar] [CrossRef]
  4. Cerofolini, G.F.; Meda, L. Physical Chemistry of, in, and on Silicon; Springer: Berlin/Heidelberg, Germany, 1989. [Google Scholar]
  5. Fujii, K.; Bettin, H.; Becker, P.; Massa, E.; Rienitz, O.; Pramann, A.; Nicolaus, A.; Kuramoto, N.; Busch, I.; Borys, M. Realization of the kilogram by the XRCD method. Metrologia 2016, 53, A19–A45. [Google Scholar] [CrossRef]
  6. Knopf, D.; Wiedenhöfer, T.; Lehrmann, K.; Härtig, F. A quantum on a scale? Dissemination of the quantum based kilogram. Metrologia 2019, 56, 1–9. [Google Scholar] [CrossRef]
  7. Liebisch, T.C.; Stenger, J.; Ullrich, J. Understanding the Revised SI: Background, Consequences, and Perspectives. Ann. Phys. 2019, 531, 1800339. [Google Scholar] [CrossRef]
  8. Newell, D.B. The CODATA 2017 values of h, e, k, and NA for the revision of the SI. Metrologia 2018, 55, L13–L16. [Google Scholar] [CrossRef]
  9. Robinson, I.A.; Schlamminger, S. The watt or Kibble balance: A technique for implementing the new SI definition of the unit of mass. Metrologia 2016, 53, A46–A74. [Google Scholar] [CrossRef]
  10. Wang, M.; Audi, G.; Kondev, F.G.; Huang, W.J.; Naimi, S.; Xu, X. The AME2016 atomic mass evaluation. Chin. Phys. C 2017, 41, 030003. [Google Scholar] [CrossRef]
  11. Güttler, B.; Rienitz, O.; Pramann, A. The Avogadro Constant for the Definition and Realization of the Mole. Ann. Phys. 2018, 531, 1800292. [Google Scholar]
  12. Abrosimov, N.V.; Aref’Ev, D.G.; Becker, P.; Bettin, H.; Bulanov, A.D.; Churbanov, M.F.; Filimonov, S.V.; Gavva, V.A.; Godisov, O.N.; Gusev, A.V.; et al. A new generation of 99.999% enriched 28Si single crystals for the determination of Avogadro’s constant. Metrologia 2017, 54, 599–609. [Google Scholar] [CrossRef]
  13. BIPM; IEC; IFCC; ILAC; ISO; IUPAC; IUPAP; OIML. JCGM 100:2008. Evaluation of Measurement Data−Guide to the Expression of Uncertainty in Measurement. 2008. Available online: https://www.bipm.org/utils/common/documents/jcgm/JCGM_100_2008_E.pdf (accessed on 8 June 2020).
  14. Rienitz, O.; Pramann, A.; Schiel, D. Novel concept for the mass spectrometric determination of absolute isotopic abundances with improved measurement uncertainty: Part 1-theoretical derivation and feasibility study. Int. J. Mass Spectrom. 2010, 289, 47–53. [Google Scholar] [CrossRef]
  15. Mana, G.; Rienitz, O. The calibration of Si isotope-ratio measurements. Int. J. Mass Spectrom. 2010, 291, 55–60. [Google Scholar] [CrossRef]
  16. Pramann, A.; Rienitz, O.; Schiel, D.; Güttler, B.; Valkiers, S. Novel concept for the mass spectrometric determination of absolute isotopic abundances with improved measurement uncertainty: Part 3-Molar mass of silicon highly enriched in 28Si. Int. J. Mass Spectrom. 2011, 305, 58–68. [Google Scholar] [CrossRef]
  17. Yang, L.; Mester, Z.; Sturgeon, R.E.; Meija, J. Determination of the Atomic Weight of 28Si-Enriched Silicon for a Revised Estimate of the Avogadro Constant. Anal. Chem. 2012, 84, 2321–2327. [Google Scholar] [CrossRef] [Green Version]
  18. Narukawa, T.; Hioki, A.; Kuramoto, N.; Fujii, K. Molar-mass Measurement of a 28Si-enriched silicon crystal for determination of the Avogadro constant. Metrologia 2014, 51, 161–168. [Google Scholar] [CrossRef]
  19. Vocke, R.D., Jr.; Rabb, S.A.; Turk, G.C. 2014 Absolute silicon molar mass measurements, the Avogadro constant and the redefinition of the kilogram. Metrologia 2014, 51, 361–375. [Google Scholar] [CrossRef]
  20. Ren, T.; Wang, J.; Zhou, T.; Lu, H.; Zhou, Y.-j. Measurement of the molar mass of the 28Si-enriched silicon crystal (AVO28) with HR-ICP-MS. J. Anal. At. Spectrom. 2015, 30, 2449–2458. [Google Scholar] [CrossRef]
  21. Pramann, A.; Narukawa, T.; Rienitz, O. Determination of the isotopic composition and molar mass of a new ‘Avogadro’ crystal: Homogeneity and enrichment-related uncertainty reduction. Metrologia 2017, 54, 738–747. [Google Scholar] [CrossRef]
  22. Pramann, A.; Rienitz, O. The molar mass of a new enriched silicon crystal: Maintaining the realization and dissemination of the kilogram and mole in the new SI. Eur. Phys. J. Appl. Phys. 2019, 88, 20904. [Google Scholar] [CrossRef]
  23. Pramann, A.; Rienitz, O.; Schiel, D.; Güttler, B. Novel concept for the mass spectrometric determination of absolute isotopic abundances with improved measurement uncertainty: Part 2–Development of an experimental procedure for the determination of the molar mass of silicon using MC-ICP-MS. Int. J. Mass Spectrom. 2011, 299, 78–86. [Google Scholar] [CrossRef]
  24. Pramann, A.; Lee, K.-S.; Noordmann, J.; Rienitz, O. Probing the homogeneity of the isotopic composition and molar mass of the ‘Avogadro’-crystal. Metrologia 2015, 52, 800–810. [Google Scholar] [CrossRef]
Figure 1. Single crystalline float-zone crystal ingot Si28-33Pr11 (length: 560 mm; mass: 6.216 kg).
Crystals 10 00500 g001
Figure 2. Float-zone crystal ingot Si28-33Pr11: schematic cross section. The measured samples (cubic shape with approx. 500 mg each) bracketing the sphere areas (P and U) are taken from parts N and V.
Crystals 10 00500 g002
Figure 3. Molar masses M of the four crystal samples (Si28-33Pr11) investigated in this study. For each average value, the combined uncertainty (k = 1) is given by error bars. The average value (arithmetic mean) of all measurements is M(Si) = 27.976 950 48 (16) g/mol (solid line). The average relative uncertainty is urel(M) = 5.7 × 10⁻⁹ including the contributions of data scattering.
Crystals 10 00500 g003
Figure 4. Single measurements of molar masses M of the sample Si28-33Pr11 part V.2.3 (error bars for k = 1 without scattering contribution). The solid line represents the average molar mass M of all sequences (including the measurements of all the other samples). The dashed lines denote the respective upper and lower average uncertainties (k = 1) without the contribution of scattering.
Crystals 10 00500 g004
Figure 5. Degrees of equivalence di of the four samples of the crystal Si28-33Pr11 (average molar mass without scattering). Uncertainties for k = 2. All data are consistent due to the enclosure of the zero line.
Crystals 10 00500 g005
Figure 6. Left scale (filled circles): Average molar masses M of the available silicon crystals highly enriched in 28Si. Right scale (filled squares): Amount-of-substance fractions x(28Si) displaying the “enrichment” of the respective crystal. Uncertainties for both M and x(28Si) are not displayed, because of their extremely small values being hidden by the data points. Data for the crystal Si28-31Pr11 are yet preliminary due to the limited number of samples.
Crystals 10 00500 g006
Table 1. Summary of the main operation parameters and instrument settings of the MC-ICP-MS.
Argon gas (cooling, auxiliary, sample)/L min−116, 0.8, 0.9…1.2
power (radio frequency)/W1175
torch, bonnetsapphire
nebulizer (PFA 1; flow rate/µL min−1)50
spray chamber (PFA 1, PEEK 2)cyclonic/Scott
sampler, skimmer (orifice/mm)nickel (1.1), nickel (0.8; XT type)
mass resolution M/∆M8000 (high resolution)
slit size/µm25
autosamplerCETAC ASX 110 FR
Faraday detectorsC, H3
operation modestatic
virtual amplifier™left rotation
integration time/s4
number of integrations (cycles) per block1 (3)
number of blocks6
1 PFA: perfluoroalkoxy alkane, 2 PEEK: polyether ether ketone.
Table 2. Average molar masses and amount-of-substance fractions (isotopic composition) of different samples (Si28-33Pr11). Numbers in brackets denote uncertainties in the last digits. Uncertainties (k = 1) do not cover data scattering.
SampleMx(28Si)x(29Si)x(30Si)
g mol−1mol/molmol/molmol/mol
×10−5×10⁻⁷
N.2.127.976 950 371 (71)0.999 976 461 (64)2.3232 (60) 3.07 (17)
N.2.327.976 950 390 (86)0.999 976 266 (85)2.3602 (85)1.312 (47)
V.2.127.976 950 655 (99)0.999 976 061 (98)2.3747 (96)1.926 (86)
V.2.327.976 950 519 (76)0.999 976 161 (74)2.3683 (74)1.562 (74)
average27.976 950 484 (84)0.999 976 237 (81)2.3566 (80)1.97 (10)
Table 3. Representative uncertainty budget of sample N.2.1 (single measurement).
QuantityUnitBest Estimate
(Value)
Standard UncertaintySensitivity CoefficientIndex
Xi[Xi]xiu(xi)ci
M(28Si)g/mol27.976926534940540 × 10−121.00.0%
myxg5.611000 × 10−6 704 × 10−124.20.0%
mxg0.062474995 569 × 10−9−380 × 10−60.0%
M(29Si)g/mol28.976494669090610 × 10−1223 × 10−60.0%
M(30Si)g/mol29.973770136027.0 × 10−9−560 × 10−90.0%
Ry,3mol/mol1.58550.0222−81 × 10−90.1%
Ry,2mol/mol269.045.652.0 × 10−91.4%
R x , 2 meas V/V0.010380686 × 10−650 × 10−613.0%
R bx , 2 meas V/V3.75400.0116−6.4 × 10−660.9%
Rw,2mol/mol0.662301.32 × 10−3−36 × 10−624.5%
R w , 2 meas V/V0.702850073.8 × 10−633 × 10−60.0%
Y[Y]yuc(y)
Mg/mol27.976950218395.1 × 10−9
Table 4. Comparison of M and x(iSi) of the available silicon spheres highly enriched in 28Si used for the XRCD experiment (uncertainties for k = 1).
CrystalMx(28Si)x(29Si)x(30Si)YearRef
Si28-g mol−1mol/molmol/molmol/mol
×10−5×10⁻⁷
10Pr1127.976 970 12 (12)0.999 957 52 (12)4.136 (11)11.21 (14)2015[24]
23Pr1127.976 942 666 (40)0.999 984 470 (39)1.492 1 (38)6.095 (48)2017[21]
24Pr1127.976 933 787 (77)0.999 993 104 (66)0.653 6 (51)3.60 (17)2019[22]
31Pr1127.976 941 260 (42)0.999 985 501 (40)1.426 4 (39)2.338 (75)20181
33Pr1127.976 950 48 (16)0.999 976 24 (19)2.357 (24)1.97 (78)20202
1 Preliminary results; 2 this work.

