Abstract
In this study, an experimental approach was developed to analyze and better understand the laser welding and melting of a powder bed process. Different optical diagnostics tools (high-speed camera, infrared camera, pyrometer, etc.) were applied to measure different physical quantities (molten pool morphology, temperature field, residual stresses, and distortions). As a result, measurements during the laser welding process facilitated the building of a database of experimental results (experimental benchmarks). The study of the melting of a powder bed enabled a better understanding of the physics related to the formation and behavior of the molten pool. These results can be used by researchers to improve and validate numerical simulations of these processes.
1. Introduction
The laser welding process is used widely in international industry. It involves using a laser to assemble various metals (carbon steels, stainless steels, aluminum, and titanium). A laser is a concentrated heat source that can provide a tight and deep weld bead. This process has different advantages over other welding processes: the absence of chamfers and filler material, a high welding speed, a controlled welding depth, a small thermal affected zone, and a low deformation of welded parts. Recently, additive manufacturing processes have begun to occupy an increasingly important place in the industrial world, especially those based on the melting of a powder bed. They consist of producing parts through layer by layer deposition and selective melting of powder layers using a laser. During the melting of a powder bed, different materials can be used: metals, polymers, and ceramics. Metals are by far the most used materials in different industrial environments such as medical, aerospace, automotive, and power.
The laser welding and especially the melting of a powder bed require continuous studying to improve their performance. The experimental approach is often used to study and analyze these thermomechanical processes [1,2,3,4,5,6,7,8]. These studies can be very expensive considering that the processes parameters are numerous [9,10]. In this context, numerical simulation can be an alternative solution. It facilitates the optimization of these parameters and predicting the final characteristics of manufactured parts for a reasonable cost and time.
During the numerical simulation of these thermomechanical processes, several physical phenomena must be considered. These phenomena include the formation of the molten pool, heat transfers, metallurgical transformation, residual stresses, and distortions. Depending on the aims targeted by the simulation, some physical phenomena can be neglected [11]. For example, during numerical modeling that focuses on the formation of the molten pool (thermo-fluid simulation), the mechanical computation (residual stresses and distortions computation) is often overlooked [12,13,14,15]. Thermomechanical simulation is generally used to estimate residual stresses and distortions, thus providing very useful information for fatigue lifetime predictions. The thermal computation of this type of simulation is often simplified (the formation of the molten pool is neglected) to reduce the computation time [16,17,18,19,20,21,22,23,24]. Some studies have attempted to consider most of these physical phenomena. For example, Saadlaoui et al. [25] developed a new strategy to simulate the interaction between the fluid flow in the molten pool and the deformations in the base metal. Therefore, their strategy enables the provision, at the same time, of thermal, fluid, and mechanical results (thermal cycle, molten pool morphology, fluid flow, residual stresses, and deformations). As mentioned above, the numerical simulation can be a useful solution in studying these processes for a reasonable cost and time. However, the numerical simulation is based on different assumptions [11]. For this, a step of validating the numerical models may be necessary. It involves testing the efficiency and reliability of the simulation using experimental or numerical benchmarks. Frequently, researchers prefer to validate their modeling using numerical benchmarks. That is mostly because of the reasonable cost and the accessibility of these benchmarks (contrarily to experimental benchmarks). Here, the problem is that these numerical benchmarks are often simple academic simulations. For example, the sloshing problem was used by Saadlaoui et al. [15] to validate the fluid formulation of the molten pool formation during the laser welding process. It involves tracking the oscillations of a liquid in a container [26]. Therefore, these benchmarks cannot be directly used to validate the results of a laser welding simulation. In this context, several experimental measurements were developed to study and to build a database (experimental benchmarks) of thermomechanical processes [27,28,29,30,31,32]. These experimental benchmarks can clearly be used to improve and validate numerical simulations.
Some experimental studies have examined the formation of a molten pool during laser welding and the melting of powder bed processes [10,30,33,34,35]. They have enabled the measuring of the molten pool morphology. This may assist in validating the thermo-fluid simulation of these processes. Gao et al. [36] studied the formation of a molten pool and the keyhole during ND: YAG laser welding of stainless steel. They applied a coaxial visual sensing system to record images of the molten pool. The same system was used by Kim et al. [29] to observe the morphology of the molten pool and keyhole during a remote laser welding. The effect of the welding speed on the molten pool morphology during a high-power laser welding was studied by Li et al. [37]. Lei et al. [32] used a high-speed camera synchronized with an auxiliary laser light to study the effect of laser welding parameters on the molten pool morphology. The same system was used by Trapp et al. [10] to follow the formation of the molten pool during the melting of a powder bed. These authors and others have studied only the formation of the molten pool. In addition, the molten pool images of these studies (especially for the melting of a powder bed) are not always of sufficient quality to determine the molten pool morphology [10,38,39,40,41,42]. Therefore, these studies cannot be used to validate a complete simulation (thermo-fluid-mechanical simulation) of thermomechanical processes. Indeed, information on the temperature field and the residual stresses distribution may be necessary for such validation. These physical quantities were measured separately by some studies [27,31]. Finding an experimental study that measured the molten pool morphology, the temperature field, the residual stresses, and the distortions at the same time is very rare.
In this paper, an experimental approach is proposed to study laser welding. It involves instrumenting this process to measure different physical quantities (molten pool morphology, temperature field, residual stresses, and distortions). These quantities can be used to build a database (experimental benchmark) to validate the numerical simulation of this process. In addition, the formation of the molten pool during the melting of a powder bed process was also studied using the same experimental approach. Here, the aim was to analyze and understand this recent process better.
The paper is organized as follows:
2. Experiment Setup
2.1. Proposed Approach
A specific experimental setup (Figure 1) was designed and realized using different instrumentation tools (high-speed camera, infrared camera, etc.).
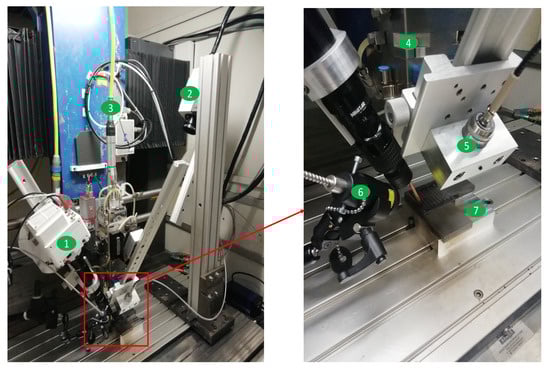
Figure 1.
Experiment setup: 1—High-speed camera; 2—Infrared camera; 3—Laser fiber; 4—Laser head; 5—Pyrometer; 6—Auxiliary laser light; 7—Samples support.
For laser welding by conduction, the numerical simulation is well advanced and controlled. It enables the consideration of the physical phenomena during this process [11,14,15,43]. For this, the main objective of welding measurements is to acquire the necessary results to validate the numerical simulation of this process. However, obtaining results of all physical quantities using the experimental approach is not always easy. Hence, we will focus on the weld pool morphology, the temperature field, residual stresses, and distortions.
Contrary to laser welding, the numerical simulation of the melting of a powder bed is not sufficiently advanced [44,45,46,47]. Thus, the first interest of the experimental study was to understand the physical phenomena involved better. This can help to improve the numerical simulation of this process. We note that the same experimental setup was used to study both processes (laser welding and melting of a powder bed).
2.2. Experimental Equipment and Samples
2.2.1. Machine and Laser
A TRUMPF LASMA 1054 CNC machine (3 axis) was used (Figure 1). A PRECITEC YC52 laser head was powered by a LASERLINE LDM 3000-60 diode laser with a theoretical power of 3 kW and a wavelength of 930 nm. A real laser power equal to 2.5 kW was measured using a wattmeter. The beam analysis of this laser was carried out for the maximum power (2.5 kW) and the results are given in Figure 2.
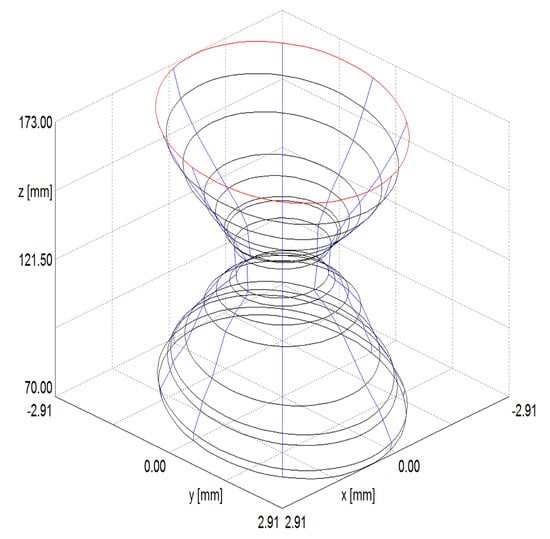
Figure 2.
Laser beam analysis for maximal power of 2.5 kW.
This analysis enables us to position the sample in the focal plane. Initially, we decided that the upper surface of the sample is merged with this plane (Figure 3a). This configuration causes the formation of a keyhole that is not often considered during numerical simulations [15]. For this reason, the laser beam was defocused by 5 mm (Figure 3b) to conduct a laser welding by conduction. This second configuration give a laser beam diameter of 2.4 mm. The energy distributions of the laser beam of these two configurations are given by Figure 3c,d. The formation of the molten pool during the two welding configurations is presented in Figure 4.
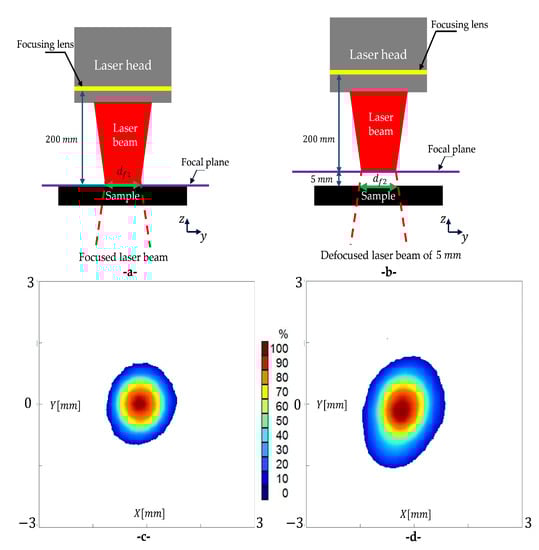
Figure 3.
(a) Focused laser beam; (b) Defocused laser beam of 5 mm; (c) Energy distribution of focused laser beam; (d) Energy distribution of defocused laser beam.
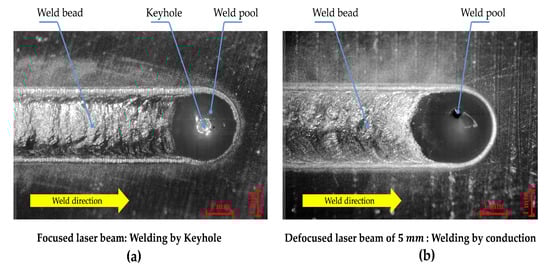
Figure 4.
Two welding configuration (images of high-speed camera): (a) welding by keyhole; (b) welding by conduction (P = 2.5 KW, v = 600 mm.min).
2.2.2. High-Speed Camera and Auxiliary Laser Light
A Phantom VEO 710 high-speed camera with a resolution of pixels was used. With a maximal rate of , this camera model is perfect to track the formation of the molten pool. Phantom Camera Control (PCC) software was used to configure, control, process, and download images. A filter with a wavelength of 810 nm was installed on the camera lens (NAVITAR ZM 6000-II, 12 mm FF). The camera was also synchronized with an auxiliary laser light (CAVILUX diode laser with a wavelength of 810 nm and a maximal power of 500 W). This facilitated the capturing of clear images of the molten pool surface (without the light of the laser power). As shown in Figure 1, the camera was attached to the laser head to monitor the molten pool movement. The working distance (the distance between the camera lens and the tip of the power laser) was approximately 100 mm and the tilt angle of the camera from the vertical was approximately 30. We note that a reference sample was used to determine the scale of the camera images.
2.2.3. Infrared Camera and Pyrometer
A FLIR Phoenix MWIR infrared camera with a resolution of pixels was used to determine the temperature distribution in the weld bead. As Figure 1 shows, the camera was attached to the machine table. Its working distance and tilt angle were in the order of 695 mm and 29, respectively. With this configuration, the camera facilitated the capturing of the temperature distribution throughout the weld bead. An attenuator filter was installed on the camera lens to capture temperatures approximately 1600 C. An integration time of and acquisition time of were chosen.
We note that the infrared camera was not calibrated, so it could not provide temperature values. For this, a KLEIBER LVO 25 S-7 monochromatic pyrometer was used to measure the temperature in the weld bead. It can measure temperatures between 350 and 3500 C. A specific mounting was used to install the pyrometer on the laser head (Figure 1). This specific mounting expedited moving the pyrometer and measuring the temperature in four positions (P1, P2, P3, and P4) on the weld bead (Figure 5). A working distance of approximately 123 mm and a length of the pyrometer body of 61 mm enabled the measuring of the temperature with a spot diameter of 0.9 mm. We note that the emissivity of the material was assumed to be 1. Therefore, the temperature given by the pyrometer was the brightness temperature.
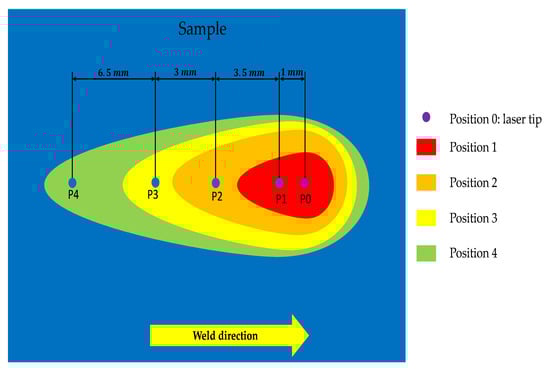
Figure 5.
Measurement points of the pyrometer.
2.2.4. Optical Microscope, DRC Machine, and 3D Measuring Arm
The length and width of the weld pool can be measured using the images of the high-speed camera. However, to determine its depth and height, the use of another approach is necessary. It involves making samples by transversely cutting the welded samples. These samples must then undergo a polishing step. Subsequently, a chemical attack must be conducted to distinguish the different zones: weld bead, heat affected zone (HAZ), and the base metal. The final step is to visualize the samples using an optical microscope.
A PROTO DRX machine (with a collimator diameter of 1 mm) was used to measure residual stresses. The detector uses two orientations, 0 and 90, to determine the axial and longitudinal residual stresses. For each of these two orientations, the scanned angles are −25; −16.66; −8.33; 0; 8.33; 16.66, and 25.
A FARO GAGE 3D measuring arm (with a precision of 0.025 mm) was used to measure the flatness of the samples after welding. This measuring enabled us to determine the vertical displacements of the welded samples (Figure 6).
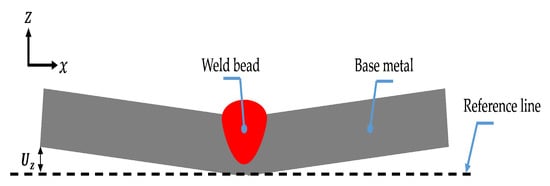
Figure 6.
Vertical displacement of welded sample: transverse plane.
2.2.5. Samples Preparation
For the laser welding, 316L stainless steel plates (austenitic steel) from hot rolling were machined to obtain nine samples with dimensions of 100 mm × 100 mm × 10 mm. The chemical composition of this material is given in Table 1. These samples were subjected to a relaxation heat treatment at 610 C for 2.5 h with slow cooling in a neutral atmosphere (nitrogen). This heat treatment facilitates the reduction of the residual stresses related to the machining and rolling processes. Thus, this enables avoiding considering the initial residual stresses during the numerical simulation of the laser welding process. The first measurement of stresses (after machining of samples and before the heat treatment) indicated values in the order of 700 MPa while values of approximately 100 MPa were observed after this heat treatment. Samples in 15CDV6 low alloy steel (bainitic steel) were also machined (with the same dimensions). The aim here was to study the formation of the weld pool of two materials that do not have the same thermophysical properties.

Table 1.
Chemical composition of 316L stainless steel in percent.
The melting of a powder bed involved filling a hollow 316L substrate of dimensions 60 mm × 60 mm × 10 mm (Figure 7) by a layer of 316L powder. Subsequently, the power laser facilitated the formation of a bead by melting a zone of this layer (thickness of 2 mm). Two types of powder were examined to study the influence of the size and granulometry of the powder on the formation of the molten pool: a spherical powder with a diameter between 20 and 50 m, and another irregular one with a size between 100 and 150 m (Figure 8).
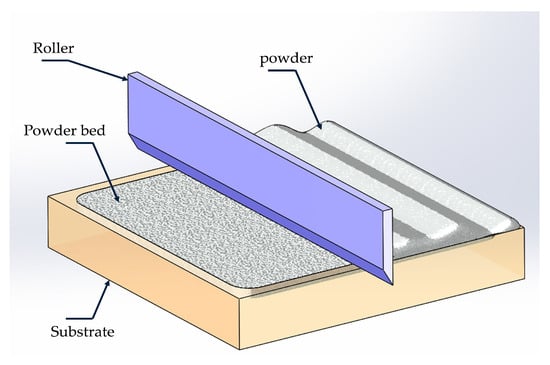
Figure 7.
Preparation of the powder layer.
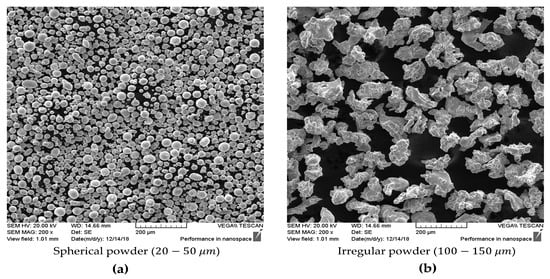
Figure 8.
Granulometry of 316L powder: (a) spherical powder (20–50 m); (b) irregular powder (100–150 m).
3. Methodology
3.1. Laser Welding
Laser welding tests involved creating a bead of length 90 mm on each sample. A maximal power of laser of approximately 2.5 kW was set. Welding speeds of 600, 1600, and 2600 mm.min were tested. Three 316L samples were studied for each speed. 15CDV6 samples were also examined to study the weld pool formation according to the welded material. A comparison of the weld pool morphology of the two materials (316L and 15CDV6) was conducted.
As noted earlier, the aim here was to create a database (experimental benchmark) that enables the validating of numerical simulations of laser welding. To achieve this, we were interested in the weld pool morphology, temperature evolution, residual stresses, and distortions of the 316L samples. The length and width of the weld pool were measured from the images of the high-speed camera. However, to determine its depth and height, the approach proposed in Section 2.2.4 must be used. The infrared camera enabled us to obtain the temperature distribution. At the same time, the pyrometer enabled us to measure the brightness temperature for each color given by the infrared camera (points P1, P2, P3, and P4: Figure 5). Residual stresses related to the welding process were also measured at three points (1, 2, and 3) on 316L samples (Figure 9). The welding conditions and measurements performed for the two materials are given in Table 2.
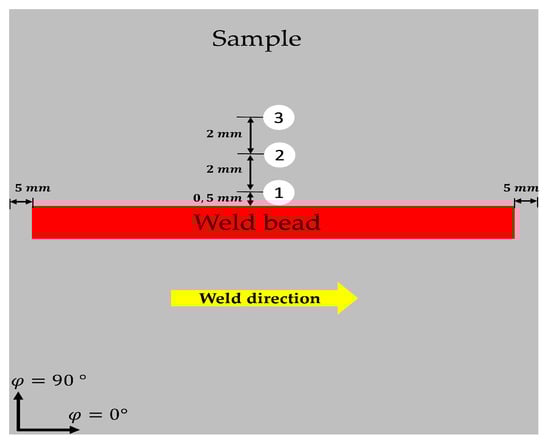
Figure 9.
Measurement points of residual stress.
Table 2.
Machine parameters and measured quantities for both materials (316L and 15CDV6).
3.2. Melting of a Powder Bed
A single bead of 50 mm length was created by melting a zone of the powder layer. Similar to laser welding, the maximum power of the laser was used (2.5 kW). Scanning speeds (speed of laser movement) between 400 and 3600 mm.min were examined. Three beads were created for each speed.
4. Results and Discussion
In this section, the results of the laser welding process (molten pool morphology, temperature field, residual stresses, and distortions) are given and discussed. The authors are interested in the effect of the welding speed on these results. The results (formation of the molten pool) of the melting of a powder bed are then presented.
4.1. Laser Welding
4.1.1. Weld Pool Morphology
Figure 10 shows the microscopic images of a cross-section of 316L and 15CDV6 weld beads for a speed of 1600 mm.min. These images enable us to determine the depth, height, and width of the weld bead. The length of the molten pool can be measured from images of the high-speed camera (the width can also be measured from these images: Figure 11). Table 3 and Table 4 illustrate respectively the dimensions of the 316L and 15CDV6 weld beads for three speeds (600, 1600 and 2600 mm.min). Figure 12 shows the high-speed camera images of the weld pool of the two materials for a welding speed equal to 1600 mm.min.
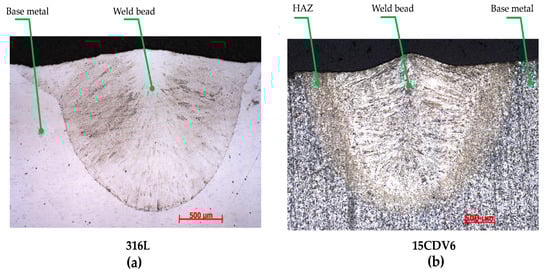
Figure 10.
Cross-section of the weld bead (microscopic images, v = 1600 mm.min): (a) 316L; (b) 15CDV6.
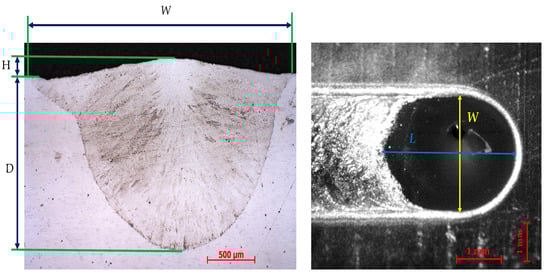
Figure 11.
Morphology of the weld pool (316L): 1600 mm.min.
Table 3.
Morphology of the weld pool (316L).
Table 4.
Morphology of the weld pool (15CDV6).
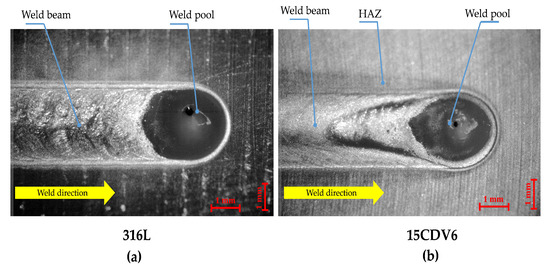
Figure 12.
Morphology of the weld pools of both materials (1600 mm.min): (a) 316L; (b) 15CDV6.
The images captured by the optical microscope and the high-speed camera enabled us to build a database of 316L (Table 3) and 15CDV6 (Table 4) weld pool morphologies. Table 3 and Table 4 indicate a significant effect of the welding speed on the weld pool morphology. As expected, the weld pool is longer and shallower for the speed of 2600 mm.min. In Figure 12, the weld pool, HAZ, and base metal can be clearly distinguished. Because 316L steel is austenitic, it does not undergo a major metallurgical transformation during welding (not HAZ). However, the HAZ is very remarkable for the 15CDV6 material (bainitic steel). Figure 12 also shows that the weld pool morphology is sensitive to the welded material. For example, using the same welding conditions, the 15CDV6 weld pool is longer compared to the 316L weld pool (Table 3 and Table 4). This may be justified by the fact that the two materials do not have the same thermophysical properties (thermal conductivity, viscosity, surface tension, etc.).
4.1.2. Temperature Field
The temperature distribution during the laser welding of the 316L samples is shown in Figure 13. We note that an arbitrary unit (A.U.) was used in Figure 13 because the infrared camera was not calibrated (the scale does not represent temperature values). Figure 14 illustrates the evolution of the brightness temperature in the melted zone according to welding speed. The evolution of this temperature in different positions of the weld bead is given in Figure 15 (v = 1600 mm.min).
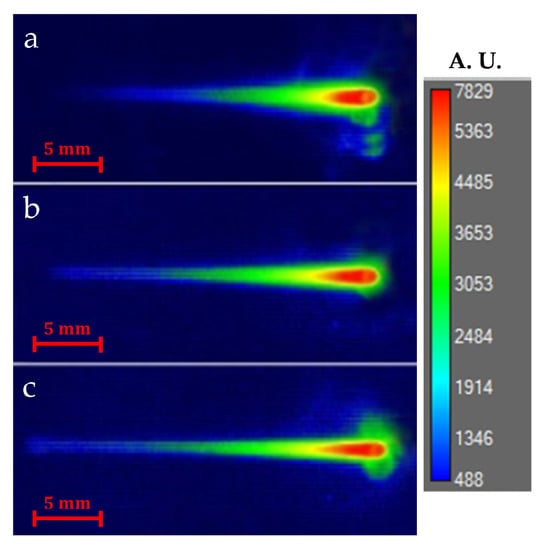
Figure 13.
Temperature field given by infrared camera (316L): (a) v = 600 mm.min; (b) v = 1600 mm.min; (c) v = 2600 mm.min.
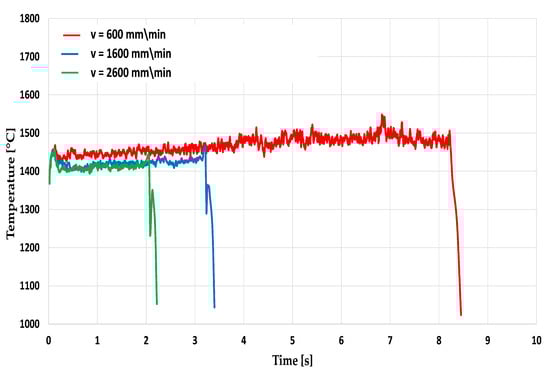
Figure 14.
Effect of the welding speed on the brightness temperature evolution (316L).
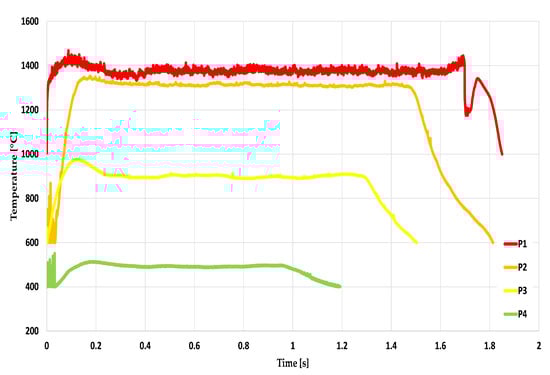
Figure 15.
Measurement of the brightness temperature in different positions on the weld bead for v = 1600 mm.min: P1, P2, P3, and P4 (316L).
The images of the temperature distribution captured by the infrared camera (Figure 13) show that the welding speed affects the isotherms distribution (and thus the morphology of the weld pool). The pyrometer enabled us to determine the brightness temperature values (Figure 15) corresponding to the different colors captured by the infrared camera. This brightness temperature in the weld pool is not very sensitive to the welding speed (Figure 14).
We note that the true temperature restoration is the key problem of pyrometry because of the unknown emissivity and its possible variation during measurement. Different methods can be applied but no universal solution is found [27,31]. The brightness temperature of a non-blackbody target is defined as the temperature of a blackbody with the same monochromatic luminance. The relation between the two temperatures is presented in [48]. The true temperature can be measured during a future work by using other experimental approaches (bichromatic pyrometer, thermocouple, etc.).
4.1.3. Residual Stresses and Distortions
Axial and longitudinal residual stresses were measured on the 316L samples after welding using the DRX machine. As Figure 9 shows, three measurement points were chosen. We specify that the first point is tangent to the weld bead. Table 5 summarizes the results of these stresses for speeds of 600, 1600, and 2600 mm.min.
Table 5.
Residual stresses of 316L samples (points 1, 2, and 3) after welding.
The vertical displacements of the welded samples were measured using the measuring arm. Vertical displacements of of 0.411, 0.174, and 0.091 mm were measured respectively for the welding speeds of 600, 1600, and 2600 mm.min.
Residual stresses in the order of 100 MPa were observed before the welding of the 316L samples. These stresses increased after welding to reach approximately 688 MPa for a speed of 600 mm.min. This indicates that the residual stresses related to the laser welding process can be very important. As shown in Table 5, these stresses are very sensitive to the welding speed. For example, the longitudinal residual stresses decrease when the speed increases. The vertical displacements also decrease when the welding speed increases ( for v = 600 mm.min and for v = 2600 mm.min). This can be justified by the effect of the welding speed on the molten pool morphology and thermal cycle.
The results of the laser welding process enabled us to conduct an experimental benchmark (molten pool morphology, temperature field, residual stresses, and distortions). This benchmark can assist in validating the different types of numerical simulations of this process. For example, the molten pool morphology and temperature field results can be used to validate thermo-fluid simulations. The molten pool morphology and especially the free surface shape can also indicate that the tension surface gradient is positive (for used welding conditions). The mechanical results of the numerical simulation can be validated using the residual stresses and distortion results.
4.2. Morphology of the Molten Pool: Melting of a Powder Bed
Figure 16 shows the formation of the molten pool during the melting of the spherical powder. The effect of the scanning speed on the molten pool morphology is given in Figure 17 and Figure 18. The influence of the types of powder on the formation of the molten pool is presented in Figure 19 and Figure 20. Table 6 and Table 7 summarize the dimensions of the respective beads of the spherical and irregular powders.
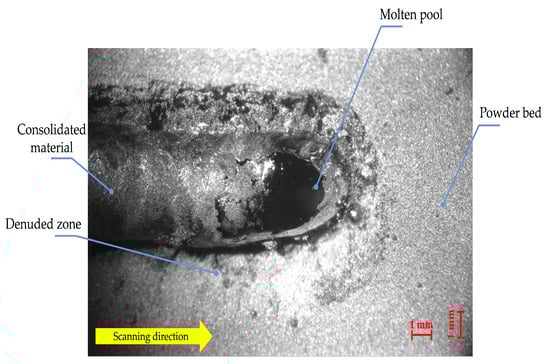
Figure 16.
Formation of the molten pool during melting of a 316L spherical powder bed (v = 1600 mm.min).
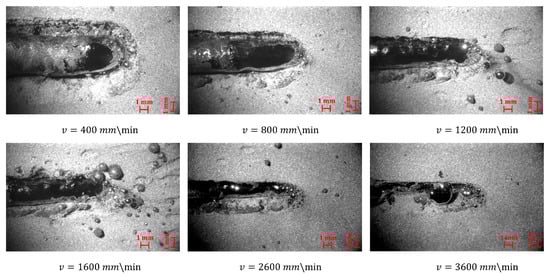
Figure 17.
Effect of scanning speed on molten pool morphology (spherical powder): high-speed camera images.
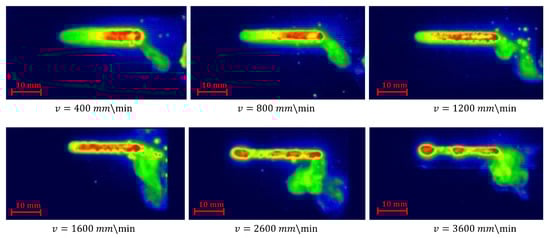
Figure 18.
Effect of scanning speed on molten pool morphology (spherical powder): infrared camera images.
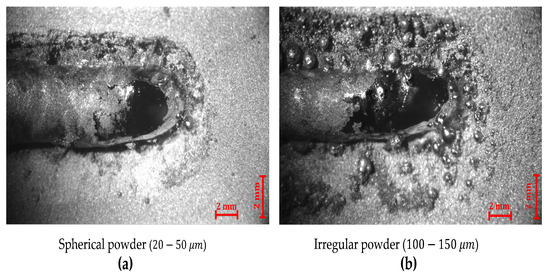
Figure 19.
Effect of powder distribution on molten pool morphology (high-speed camera images, v = 400 mm.min): (a) Spherical powder; (b) Irregular powder.
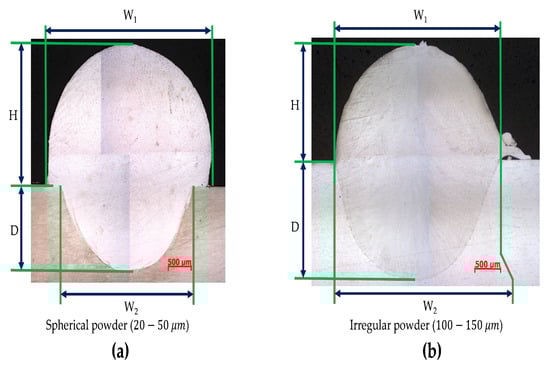
Figure 20.
Molten pool morphology (microscopic images, v = 400 mm.min): (a) Spherical powder; (b) Irregular powder.
Table 6.
Molten pool morphology of spherical powder (20–50 m).
Table 7.
Molten pool morphology of irregular powder (100–150 m).
Figure 16 shows the formation of the molten pool during the melting of a spherical powder layer. In this figure, the molten pool, the bead (consolidated material), and the unfused powder can be distinguished. A denuded zone can also be distinguished; it appears between the bead and the unfused powder. The videos captured by the high-speed camera can explain the causes of the appearance of this zone. Indeed, the molten pool absorbs the powder around it. This absorption can be justified by the mechanical flow of the powder which moves it towards the molten pool. This flow is probably less important for low layer thicknesses.
Figure 17 shows the effect of the scanning speed on the formation of the molten pool. The latter is longer and narrower for the higher velocities. The "balling" phenomenon appears from a speed of 3600 mm.min (Figure 17 and Figure 18). Figure 19 shows the molten pool formation of both types of powder (spherical and irregular powders). We note that the type of powder has a direct effect on the formation and morphology of the bead. This can be justified by the influence of the size and the granulometry of the powder on its mechanical flow. A standardized flowability test (ASTM) was used to measure the rate of this flow. It involves timing the flow of of powder through a hole with a diameter of 2.54 mm. The spherical powder flowed after while was required for the flow of the irregular powder. These results confirm that the flowability of the spherical powder is greater than that of the irregular powder.
The cross-section of the beads of the spherical and irregular powders are given in Figure 20. We observed that the morphology of the bead is sensitive to the types of powder. For example, gaps of 12 and were observed respectively for the width (L1) and height (H) for the speed of 600 mm.min. This difference can also be justified by the flowability of the two powders. We have observed that the height of the spherical powder bead is greater than the initial thickness of the powder layer (2 mm) for speeds of 400, 600, 800, and 1000 mm.min. This can be explained by the flowability of the spherical powder which facilitates its absorption by the molten pool. This absorption facilitates the increase in the volume of the bead. For these velocities, the phenomenon of shrinkage of the layer powder (shrinkage related to the variation of the density between the powder bed and the molten pool) is, therefore, less visible. However, it begins to be observed from a speed of 1200 mm.min. Indeed, the powder quantity absorbed is less important for high velocities. The flowability of the irregular powder and therefore its absorption by the molten pool are less important. For this reason, the height (H) of the irregular powder bead is less than 2 mm, even for low velocities.
The study of the melting of a powder bed enabled us to analyze and understand this process better. As the first remark, we have observed that the molten pool absorbs the unfused powder around it. This phenomenon was very visible especially for the spherical powder, which has a significant flowability. The absorption of the powder by the molten pool leads to the formation of a denuded zone between the bead and the unfused powder. It also facilitates the increase in the bead volume, especially for the spherical powder and at low velocities. Therefore, the shrinkage phenomenon simulated by several studies [46,49] cannot always occur during the melting of a powder bed. However, considering the material addition (related to the mechanical flow of the powder around the molten pool) during the numerical simulation may be necessary according to manufacturing conditions. Considering the fluid flows in the molten pool (related to the absorption of the powder by the molten pool) will also be necessary. The formation of an interface between the molten zone and the unfused powder can also be simulated.
5. Conclusions
An experimental setup was proposed to study the laser welding and melting of powder bed processes. The first aim of this setup was to analyze and understand these two processes better. The second aim was to build an experimental database (experimental benchmark) to validate the different types of numerical simulations of laser welding. The study involved instrumenting a laser welding machine to measure different quantities (molten pool morphology, temperature field, residual stresses, and distortions). Different instrumentation tools (high-speed camera, infrared camera, pyrometer, etc.) were used to achieve this.
In the first step, tests of laser welding were carried out on 316L samples. The effect of the welding speed on the molten pool morphology, temperature field, residual stresses, and distortions was studied. The measured quantities were very sensitive to this speed. For example, the weld pool was longer and shallower for high velocities. The longitudinal residual stresses and distortions decreased when the speed increased. The results of these different quantities will enable researchers to validate their numerical simulations of this process.
In the second step, tests of the melting of a powder bed were carried out using a laser welding machine. The idea was to fill a hollow substrate with a powder layer and then melt it using a laser. The aim of these tests was to understand this process better. As a result, the bead dimensions of two types of powder (spherical and irregular powders) were measured. These results, and especially the height of the bead, depicted that the shrinkage of the powder layer after melting cannot always be visible. Indeed, the height of the bead of the spherical powder exceeded the initial thickness of the powder layer for low velocities. This can be explained by the high-speed camera videos. They indicated that the molten pool absorbed the powder around it. This absorption facilitates the increase in the bead volume and creating a denuded zone between the bead and the unfused powder. The shrinkage of the powder layer was easily visualized with the irregular powder even for low scanning velocities. This can be explained by its low flowability, which delays its absorption by the molten pool (less material addition). The results also indicated that the bead morphology is sensitive to scanning velocities.
Finally, this study enabled us to understand the physics during laser welding and especially during the melting of a powder bed process better. It also enabled us to build a database of experimental results (experimental benchmark) of laser welding. This can assist in improving and validating the numerical simulation of these processes.
Author Contributions
Conceptualization, Y.S., J.S. and J.-M.B.; methodology, Y.S., M.D., E.F. and J.-M.B.; software, Y.S. and J.S.; validation, Y.S., M.D., E.F. and J.-M.B.; formal analysis, Y.S., J.S. and J.-M.B.; investigation, Y.S.; resources, P.B., E.F. and J.-M.B.; data curation, Y.S. and J.S.; writing–original draft preparation, Y.S.; writing–review and editing, J.S., M.D., P.B. and J.-M.B.; visualization, Y.S., P.B. and J.-M.B.; supervision, J.S., M.D. and J.-M.B.; project administration, J.-M.B.; funding acquisition, P.B., E.F. and J.-M.B. All authors have read and agreed to the published version of the manuscript.
Funding
This research received no external funding.
Acknowledgments
The authors would like to thank ESI-GROUP and MELTED project for funding this study.
Conflicts of Interest
The authors declare no conflict of interest.
References
- Liu, Q.S.; Mahdavian, S.; Aswin, D.; Ding, S. Experimental study of temperature and clamping force during Nd:YAG laser butt welding. Opt. Laser Technol. 2009, 41, 794–799. [Google Scholar] [CrossRef]
- Li, L.; Peng, G.; Wang, J.; Gong, J.; Li, H. Experimental study on weld formation of Inconel 718 with fiber laser welding under reduced ambient pressure. Vacuum 2018, 151, 140–147. [Google Scholar] [CrossRef]
- Pankaj, P.; Tiwari, A.; Bhadra, R.; Biswas, P. Experimental investigation on CO2 laser butt welding of AISI 304 stainless steel and mild steel thin sheets. Opt. Laser Technol. 2019, 119, 105633. [Google Scholar] [CrossRef]
- Li, J.; Sun, Q.; Kang, K.; Zhen, Z.; Liu, Y.; Feng, J. Process stability and parameters optimization of narrow-gap laser vertical welding with hot wire for thick stainless steel in nuclear power plant. Opt. Laser Technol. 2019, 123, 105921. [Google Scholar] [CrossRef]
- Pal, S.; Lojen, G.; Kokol, V.; Drstvenšek, I. Reducing porosity at the starting layers above supporting bars of the parts made by Selective Laser Melting. Powder Technol. 2019, 355, 268–277. [Google Scholar] [CrossRef]
- Zhang, B.; Xiu, M.; Tan, Y.T.; Wei, J.; Wang, P. Pitting corrosion of SLM Inconel 718 sample under surface and heat treatments. Appl. Surf. Sci. 2019, 490, 556–567. [Google Scholar] [CrossRef]
- Gao, X.; Liu, Z.; Li, J.; Liu, E.; Yue, C.; Zhao, K.; Yang, G. Selective laser melting of CuZr-based metallic glass composites. Mater. Lett. 2020, 259, 126724. [Google Scholar] [CrossRef]
- Chen, H.; Zi, X.; Han, Y.; Dong, J.; Liu, S.; Chen, C. Microstructure and mechanical properties of additive manufactured W-Ni-Fe-Co composite produced by selective laser melting. Int. J. Refract. Met. Hard Mater. 2020, 86, 105111. [Google Scholar] [CrossRef]
- Sun, J.; Yang, Y.; Wang, D. Parametric optimization of selective laser melting for forming Ti6Al4V samples by Taguchi method. Opt. Laser Technol. 2013, 49, 118–124. [Google Scholar] [CrossRef]
- Trapp, J.; Rubenchik, A.M.; Guss, G.; Matthews, M.J. In situ absorptivity measurements of metallic powders during laser powder-bed fusion additive manufacturing. Appl. Mater. Today 2017, 9, 341–349. [Google Scholar] [CrossRef]
- Dal, M.; Fabbro, R. [INVITED] An overview of the state of art in laser welding simulation. Opt. Laser Technol. 2016, 78, 2–14. [Google Scholar] [CrossRef]
- Ko, S.H.; Yoo, C.D.; Farson, D.F.; Choi, S.K. Mathematical modeling of the dynamic behavior of gas tungsten arc weld pools. Metall. Mater. Trans. B 2000, 31, 1465–1473. [Google Scholar] [CrossRef]
- Khairallah, S.; Anderson, A.; Rubenchik, A. Laser powder-bed fusion additive manufacturing: Effects of main physical processes on dynamical melt flow and pore formation from mesoscopic powder simulation. Acta Mater. 2015. [Google Scholar]
- Saadlaoui, Y.; Sallem, H.; Feulvarch, E.; Sayet, T.; Leblond, J.B.; Bergheau, J.M. Influence des écoulements de la matière sur l’évolution des contraintes résiduelles durant le procédé de soudage. In Proceedings of the 13e Colloque National en Calcul des Structures CSMA 2017, Giens, Var, France, 15–19 May 2017. [Google Scholar]
- Saadlaoui, Y.; Feulvarch, E.; Delache, A.; Leblond, J.B.; Bergheau, J.M. A new strategy for the numerical modeling of a weld pool. C. R. Méc. 2018, 346, 999–1017. [Google Scholar] [CrossRef]
- Duranton, P.; Devaux, J.; Robin, V.; Gilles, P.; Bergheau, J.M. 3D modelling of multipass welding of a 316L stainless steel pipe. J. Mater. Process. Technol. 2004, 153–154, 457–463. [Google Scholar] [CrossRef]
- Zain-ul Abdein, M.; Nelias, D.; Jullien, J.F.; Deloison, D. Prediction of laser beam welding-induced distortions and residual stresses by numerical simulation for aeronautic application. J. Mater. Process. Technol. 2009, 209, 2907–2917. [Google Scholar] [CrossRef]
- Feulvarch, E.; Robin, V.; Bergheau, J.M. Thermometallurgical and mechanical modelling of welding—Application to multipass dissimilar metal girth welds. Sci. Technol. Weld. Join. 2011, 16, 221–231. [Google Scholar] [CrossRef]
- Anca, A.; Cardona, A.; Risso, J.; Fachinotti, V.D. Finite element modeling of welding processes. Appl. Math. Model. 2011, 35, 688–707. [Google Scholar] [CrossRef]
- Portelette, L.; Roux, J.C.; Robin, V.; Feulvarch, E. A Gaussian surrogate model for residual stresses induced by orbital multi-pass TIG welding. Comput. Struct. 2017, 183, 27–37. [Google Scholar] [CrossRef]
- Tsirkas, S.; Papanikos, P.; Pericleous, K.; Strusevich, N.; Boitout, F.; Bergheau, J.M. Evaluation of distortions in laser welded shipbuilding parts using local-global finite element approach. Sci. Technol. Weld. Join. 2003, 8, 79–88. [Google Scholar] [CrossRef]
- Lacki, P.; Adamus, K. Numerical simulation of the electron beam welding process. Comput. Struct. 2011, 89, 977–985. [Google Scholar] [CrossRef]
- Piekarska, W.; Kubiak, M. Modeling of thermal phenomena in single laser beam and laser-arc hybrid welding processes using projection method. Appl. Math. Model. 2013, 37, 2051–2062. [Google Scholar] [CrossRef]
- Caprace, J.D.; Fu, G.; Carrara, J.F.; Remes, H.; Shin, S.B. A benchmark study of uncertainness in welding simulation. Mar. Struct. 2017, 56, 69–84. [Google Scholar] [CrossRef]
- Saadlaoui, Y.; Delache, A.; Feulvarch, E.; Leblond, J.B.; Bergheau, J.M. New strategy of solid/fuid coupling during numerical simulation of welding process. J. Fluids Struct. 2020. submitted for publication. [Google Scholar]
- Ramaswamy, B. Numerical simulation of unsteady viscous free-surface flow. J. Comput. Phys. 1990, 87, 495. [Google Scholar] [CrossRef]
- Smurov, I.; Doubenskaia, M.; Grigoriev, S. Optical Monitoring in Laser Cladding of Ti6Al4V. J. Therm. Spray Technol. 2012, 21, 1357–1362. [Google Scholar] [CrossRef]
- Doubenskaia, M.; Smurov, I.; Grigoriev, S. Optical Monitoring in Elaboration of Metal Matrix Composites by Direct Metal Deposition. Phys. Procedia 2012, 39, 767–775. [Google Scholar] [CrossRef]
- Kim, C.H.; Ahn, D.C. Coaxial monitoring of keyhole during Yb:YAG laser welding. Opt. Laser Technol. 2012, 44, 1874–1880. [Google Scholar] [CrossRef]
- You, Y.; Gao, X.D.; Katayama, S. Review of laser welding monitoring. Sci. Technol. Weld. Join. 2014, 19, 181–201. [Google Scholar] [CrossRef]
- Doubenskaia, M.A.; Zhirnov, I.V.; Teleshevskiy, V.I.; Bertrand, P.; Smurov, I.Y. Determination of True Temperature in Selective Laser Melting of Metal Powder Using Infrared Camera. MSF 2015, 834, 93–102. [Google Scholar] [CrossRef]
- Lei, T.; Rong, Y.; Xu, J.; Huang, Y. Experiment study and regression analysis of molten pool in laser welding. Opt. Laser Technol. 2018, 108, 534–541. [Google Scholar] [CrossRef]
- Clijsters, S.; Craeghs, T.; Buls, S.; Kempen, K.; Kruth, J.-P. In situ quality control of the selective laser melting process using a high-speed, real-time melt pool monitoring system. Int. J. Adv. Manuf. Technol. 2014, 75, 1089–1101. [Google Scholar] [CrossRef]
- Doubenskaia, M.; Kotoban, D.; Zhirnov, I. Study of oxygen effect on the melting pool temperature during selective laser melting. Mech. Ind. 2016, 17, 707. [Google Scholar] [CrossRef]
- Hooper, P.A. Melt pool temperature and cooling rates in laser powder bed fusion. Addit. Manuf. 2018, 22, 548–559. [Google Scholar] [CrossRef]
- Gao, J.Q.; Qin, G.l.; Yang, J.l.; He, J.G.; Zhang, T.; Wu, C.S. Image processing of weld pool and keyhole in Nd:YAG laser welding of stainless steel based on visual sensing. Trans. Nonferrous Met. Soc. China 2011, 21, 423–428. [Google Scholar] [CrossRef]
- Li, S.; Chen, G.; Zhou, C. Effects of welding parameters on weld geometry during high-power laser welding of thick plate. Int. J. Adv. Manuf. Technol. 2015, 79, 177–182. [Google Scholar] [CrossRef]
- Gao, X.; You, D.; Katayama, S. Infrared image recognition for seam tracking monitoring during fiber laser welding. Mechatronics 2012, 22, 370–380. [Google Scholar] [CrossRef]
- Gao, X.; Zhang, Y. Monitoring of welding status by molten pool morphology during high-power disk laser welding. Opt. Int. J. Light Electron Opt. 2015, 126, 1797–1802. [Google Scholar] [CrossRef]
- Zhang, Y.; Zhang, C.; Tan, L.; Li, S. Coaxial monitoring of the fibre laser lap welding of Zn-coated steel sheets using an auxiliary illuminant. Opt. Laser Technol. 2013, 50, 167–175. [Google Scholar] [CrossRef]
- Li, L.; Peng, G.; Wang, J.; Gong, J.; Meng, S. Numerical and experimental study on keyhole and melt flow dynamics during laser welding of aluminium alloys under subatmospheric pressures. Int. J. Heat Mass Transf. 2019, 133, 812–826. [Google Scholar] [CrossRef]
- Yin, J.; Wang, D.; Yang, L.; Wei, H.; Dong, P.; Ke, L.; Wang, G.; Zhu, H.; Zeng, X. Correlation between forming quality and spatter dynamics in laser powder bed fusion. Addit. Manuf. 2020, 31, 100958. [Google Scholar] [CrossRef]
- Saadlaoui, Y.; Feulvarch, E.; Delache, A.; Leblond, J.B. Apragmatic strategy for the numerical simulation of the fluid flow during welding processes. In Proceedings of the CILAMCE 2018 Congress—XXXIX Ibero-Latin American Congress on Computational Methods in Engineering, Paris/Compiegne, France, 11–14 November 2018. [Google Scholar]
- Körner, C.; Attar, E.; Heinl, P. Mesoscopic simulation of selective beam melting processes. J. Mater. Process. Technol. 2011, 211, 978–987. [Google Scholar] [CrossRef]
- Gan, Z.; Yu, G.; He, X.; Li, S. Numerical simulation of thermal behavior and multicomponent mass transfer in direct laser deposition of Co-base alloy on steel. Int. J. Heat Mass Transf. 2017, 104, 28–38. [Google Scholar] [CrossRef]
- Chen, Q.; Guillemot, G.; Gandin, C.A.; Bellet, M. Three-dimensional finite element thermomechanical modeling of additive manufacturing by selective laser melting for ceramic materials. Addit. Manuf. 2017, 16, 124–137. [Google Scholar] [CrossRef]
- Cook, P.; Murphy, A. Simulation of melt pool behaviour during additive manufacturing: Underlying physics and progress. Addit. Manuf. 2020, 31, 100909. [Google Scholar] [CrossRef]
- Smurov, I.; Doubenskaia, M. Temperature Monitoring by Optical Methods in Laser Processing. In Laser-Assisted Fabrication of Materials; Majumdar, J.D., Manna, I., Eds.; Series Title: Springer Series in Materials Science; Springer: Berlin/Heidelberg, Germany, 2013; Volume 161, pp. 375–422. [Google Scholar]
- Saadlaoui, Y.; Feulvarch, E.; Delache, A.; Leblond, J.B.; Bergheau, J.M. Simulation Numérique des Procédés Thermomécaniques dans une Approche Couplant les Écoulements du Fluide avec les Déformations du Solide: Application au Sudage Laser et à la Fusion d’un lit de Poudre. Ph.D. Thesis, Université de Lyon, Saint Etienne, Frane, 2019. [Google Scholar]
© 2020 by the authors. Licensee MDPI, Basel, Switzerland. This article is an open access article distributed under the terms and conditions of the Creative Commons Attribution (CC BY) license (http://creativecommons.org/licenses/by/4.0/).