Abstract
To improve the electrocatalytic methanol oxidation (MOR) performance of platinum (Pt)-based catalysts in direct methanol fuel cells (DMFCs), this study uses phosphorus-doped carbon nanotubes (P-CNTs) as a support material. Through a hydrothermal method, different proportions of potassium bromide (KBr) are introduced as a structural directing agent to prepare a series of Pt/P-CNTs-M catalysts (where M represents the molar ratio of KBr to Pt). The study systematically investigates the mechanism by which KBr regulates the crystal plane of Pt nanoparticles and its structure–activity relationship. Physical characterization revealed that KBr selectively regulates Pt crystal plane growth through Br− adsorption. When M = 30, Pt/P-CNTs-30 exhibited the highest proportion of exposed Pt(111) crystal planes (27.21%), with Pt0 content reaching 51.64%, and featured moderate particle size (2.22 nm) and uniform dispersion. Electrochemical testing indicates that the MOR mass-specific activity of this catalyst reaches 3559.85 mA·mg−1Pt, which is 1.17 times that of Pt/P-CNTs-0; it exhibits the lowest charge transfer impedance, with a current density of 488.25 mA·mg−1Pt still maintained after 3600 s of chronoamperometry testing, and a more negative CO oxidation onset potential, demonstrating optimal resistance to poisoning. The study indicates that an appropriate KBr ratio can synergistically optimize Pt crystal plane structure and electronic states, providing a theoretical basis for the design of high-efficiency fuel cell catalysts.
1. Introduction
Fuel cells, as a highly efficient and clean energy conversion technology, have demonstrated broad application prospects in the fields of new energy vehicles and portable power sources due to their high energy density and low environmental pollution characteristics. Among these, direct methanol fuel cells (DMFCs) have garnered significant attention due to their advantages of easy fuel storage and transportation, as well as high theoretical energy density [1]. However, issues such as slow MOR kinetics, high catalyst costs, susceptibility to poisoning, and poor stability have severely hindered the commercialization of DMFCs [2,3]. Platinum (Pt)-based catalysts are widely used in MOR due to their excellent catalytic activity, but their high cost, limited resource reserves, and the deactivation of active sites caused by the strong adsorption of intermediate products (such as COads) during the catalytic process have become critical issues that need to be addressed.
Research indicates that catalyst performance is closely related to its microstructure (e.g., particle size, crystal plane orientation) [4,5,6,7]. Crystal plane orientation directly affects the exposure of active sites, while dispersion influences the catalyst’s specific surface area. For example, the (111) crystal plane of Pt, with its lower d-band center, can weaken COads adsorption strength, thereby enhancing resistance to poisoning [8,9,10]. Therefore, how to precisely control the crystal plane orientation and dispersion of Pt nanoparticles through synthetic strategies, while ensuring high activity and durability, still requires further exploration of novel synthesis methods and a deeper understanding of nucleation and growth mechanisms, thereby enabling the design of more efficient Pt-based catalysts for fuel cells, chemical catalysis, and other fields.
Structure-directing agents play a crucial role in the synthesis of nanomaterials [11,12,13]. Taking potassium bromide (KBr) as an example, the released Br ions can selectively regulate the growth kinetics of metal crystal faces through adsorption. Previous studies have confirmed that Br- can preferentially adsorb onto high-index crystal faces of Pt (e.g., (200)), inhibiting their growth and thereby promoting the exposure of low-index crystal faces (e.g., (111)) [14]. However, the quantitative relationship between Br− concentration and catalyst structural properties remains unclear, and excessive Br− may lead to the formation of stable complexes with Pt precursors, affecting the reduction process and particle dispersion [15,16]. Therefore, systematically investigating the regulatory mechanisms of KBr addition on the crystal plane orientation, particle size distribution, and electronic structure of Pt/CNTs catalysts holds significant theoretical value.
Based on the above background, this study used phosphorus-doped carbon nanotubes (P-CNTs) as the carrier and introduced different proportions of KBr as a structural directing agent via the hydrothermal method to prepare a series of Pt/P-CNTs-M (M denotes the molar ratio of KBr to Pt) catalysts. Through systematic characterization and electrochemical testing, this study reveals the regulation patterns of KBr on the crystal plane orientation, particle size distribution, and electronic states of Pt nanoparticles, and elucidates the structure–property relationship between these properties and MOR performance. The research findings are expected to provide a theoretical basis and new preparation strategies for designing efficient and durable fuel cell catalysts.
2. Results and Discussion
2.1. Physical Characterization Analysis of Catalysts
The actual loading of Pt in the catalyst Pt/P-CNTs-M was determined by elemental analysis (ICP-OES). As shown in Table 1, the actual loading amounts of Pt/P-CNTs-0, Pt/P-CNTs-10, Pt/P-CNTs-30, Pt/P-CNTs-200, and Pt/P-CNT-500 were 17.79, 18.23, 18.12, 16.85, 15.96, and 13.74 wt.%, respectively, showing a trend of first increasing and then decreasing. The reason for this trend may be that in the Pt/P-CNTs-200 and Pt/P-CNTs-500 samples, the Br− content is relatively high, and excess Br− may form stable complexes with Pt ions in the solution, leading to a decrease in the concentration of free Pt in the system and a relative reduction in Pt reduction efficiency [17,18].

Table 1.
ICP-OES results for Pt/P-CNTs-M (0, 10, 30, 90, 200, 500).
Further characterization of the catalyst’s morphology and microstructure was conducted using TEM. As shown in Figure 1, the CNTs retain their unique 1D structure, and Pt nanoparticles were successfully synthesized and loaded onto P-CNTs-M in all samples. Among the six samples, Pt/P-CNTs-0, Pt/P-CNTs-10, Pt/P-CNTs-30 exhibit a more uniform distribution of Pt nanoparticles with fewer agglomerated particles compared to the other three samples, while Pt/P-CNTs-90, Pt/P-CNTs-200, and Pt/P-CNTs-500 show more pronounced agglomeration of Pt nanoparticles. This may be due to excessive KBr disrupting the charge balance on the surface of the nanoparticles, weakening the electrostatic repulsion between nanoparticles, and leading to particle aggregation [19].
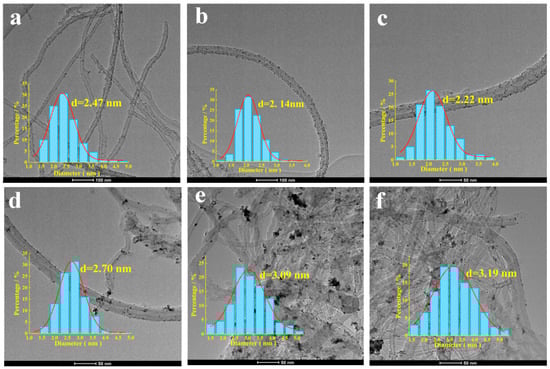
Figure 1.
TEM images and particle size distribution images of catalysts (a) Pt/P-CNTs-0; (b) Pt/P-CNTs-10; (c) Pt/P-CNTs-30; (d) Pt/P-CNTs-90; (e) Pt/P-CNTs-200; (f) Pt/P-CNTs-500.
A statistical analysis of the particle sizes of 200 Pt nanoparticles in the TEM images is shown in Figure 1. The particle size analysis of the six samples reveals that Pt/P-CNTs-0 (2.47 nm), Pt/P-CNTs-10 (2.14 nm), Pt/P-CNTs-30 (2.22 nm), Pt/P-CNTs-90 (2.70 nm), Pt/P-CNTs-200 (3.09 nm), and Pt/P-CNTs-500 (3.19 nm), with the particle size of Pt nanoparticles first decreasing and then increasing. The reason for this phenomenon may be that when the KBr dosage is relatively low (KBr to Pt molar ratio of 10), the presence of Br− may increase the nucleation rate of the Pt precursor, causing the limited Pt to disperse onto more crystal nuclei for growth, resulting in smaller Pt nanoparticle sizes. However, as the KBr dosage continues to increase, excess Br− may form complexes with Pt ions in the metal precursor, reducing the reduction rate of Pt ions [18]. This increases the opportunities for metal particles to collide and fuse during the extended growth time, leading to an increase in the particle size of Pt nanoparticles [20,21,22]. In the field of catalysis, there is a synergistic effect between the particle size of nanoparticles and crystal face exposure, and changes in the proportion of crystal face exposure can further influence the performance of the catalyst. The electrochemical test results discussed below also corroborate this theory.
Figure 2 shows the HRTEM image of Pt/P-CNTs-M. Observation reveals that the lattice fringes in the six samples primarily measure approximately 0.226 nm and 0.195 nm, corresponding to the Pt(111) and Pt(200) crystal faces [23], respectively. This is also consistent with the XRD test results discussed below.
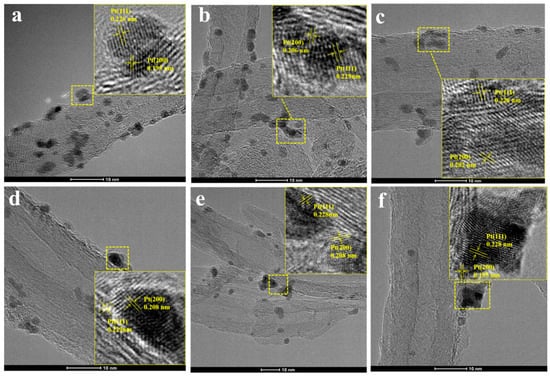
Figure 2.
HRTEM images of catalysts (a) Pt/P-CNTs-0; (b) Pt/P-CNTs-10; (c) Pt/P-CNTs-30; (d) Pt/P-CNTs-90; (e) Pt/P-CNTs-200; (f) Pt/P-CNTs-500.
To investigate the mechanism by which changes in particle size affect crystal planes and catalytic performance, this study conducted XRD characterization analysis on six samples (Figure 3). The results indicate that an increase in particle size does indeed lead to changes in the preferred orientation of crystal planes, thereby causing significant differences in catalytic activity. As shown in Figure 3, the diffraction peaks near 2θ = 26° correspond to the C(002) crystal plane. The Pt peaks are located at approximately 2θ = 39.8°, 46.3°, 67.5°, 81.6°, and 85.8°, respectively, which aligns with the face-centered cubic (FCC) structure of the Pt(111), Pt(200), Pt(220), Pt(311), and Pt(222) crystal planes [24]. Additionally, as shown in Figure 3, the peak intensities of the different crystal planes in the catalysts synthesized under varying KBr concentrations exhibit significant differences. This is because the addition of KBr regulates the changes in the different crystal planes of Pt, and the changes in XRD peak intensities further reflect the crystallization state of the metal nanoparticles. Observation reveals that the diffraction peak intensities of the six samples exhibit notable differences. The crystal plane diffraction peaks of Pt/P-CNTs-90, Pt/P-CNTs-200, and Pt/P-CNTs-500 are stronger and sharper than those of the other samples, indicating that the nanoparticle sizes of these three samples are larger than those of the others [25,26]. This is consistent with the TEM results.
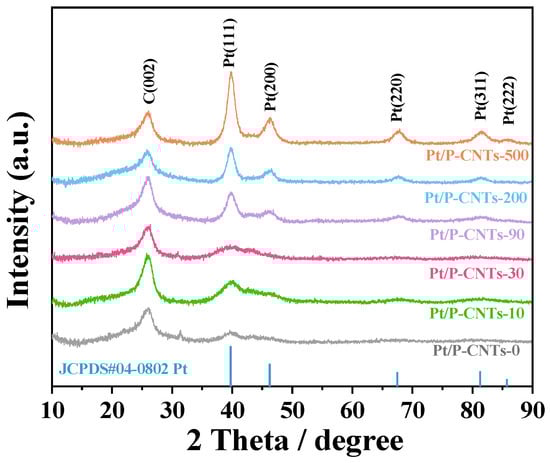
Figure 3.
XRD image of Pt/P-CNTs-M.
The proportion of the Pt(111) crystal plane in each sample was calculated by the intensity ratio of the Pt(111) diffraction peak to the total intensity of diffraction peaks corresponding to exposed crystal planes, including 111, 200, 220, 311, and 222. Calculation results show that the proportion of Pt(111) planes varies with increasing KBr dosage, showing a trend of first increasing and then decreasing. Among the six samples Pt/P-CNTs-0 Pt/P-CNTs-10 Pt/P-CNTs-30 Pt/P-CNTs-90 Pt/P-CNTs-200 and Pt/P-CNTs-500 exhibit respective proportions of 21.15%, 24.12%, 27.21%, 22.49%, 22.31%, and 23.87%. The highest peak intensity percentage of the Pt(111) crystal plane (27.21%) is achieved when the Br to Pt molar ratio is 30:1. Theoretically, KBr serves as a structural director. With increasing KBr addition Br− preferentially adsorbs onto high-surface-energy Pt(200) crystal planes, forming strong adsorption bonds that inhibit the growth of Pt(200) crystal planes, thus facilitating the exposure of more Pt(111) crystal planes [27,28].
However, the experimental results deviate from this theoretical expectation. TEM characterization reveals severe agglomeration of Pt nanoparticles in Pt/P-CNTs-90 Pt/P-CNTs-200 and Pt/P-CNTs-500. This agglomeration leads to wrapping or fusion of originally exposed Pt(111) surfaces, thereby reducing their detectable proportion in XRD analysis. It is important to note that XRD primarily reflects long-range atomic ordering, which requires a certain degree of crystallinity and sufficient atomic arrangement regularity. The broad XRD peaks observed for most samples indicate moderate crystallinity of Pt nanoparticles and limited long-range ordering. Thus, the orientation proportions calculated from XRD are statistical average values of the nanoparticle ensemble rather than absolute quantitative data for individual particles. Although the 27.21% Pt(111) orientation is close to that of polycrystalline Pt nanoparticles, the relative variation trend among samples is meaningful and correlates with the catalytic performance trends in this work. Additionally, the small size of Pt nanoparticles (evidenced by TEM and broad XRD peaks) inherently generates abundant edge and corner sites with low coordination numbers. These edge sites are well-recognized as highly active centers for electrocatalysis, complementing the Pt(111) facet sites to enhance overall catalytic activity. The severe agglomeration in high-KBr-dosage samples not only reduces the exposed Pt(111) planes but also decreases the density of edge active sites by reducing the specific surface area. This comprehensive analysis confirms the formation of Pt nanoparticles with preferential Pt(111) surface orientation in the Pt/P-CNTs-30 electrocatalytic system [29,30] while highlighting the synergistic effects of crystal facets and edge sites on catalytic performance.
The electronic states of Pt were characterized using XPS. As shown in Figure 4, distinct diffraction peaks for C and Pt elements were observed in Pt/P-CNTs-M, confirming the successful loading of Pt in the sample.
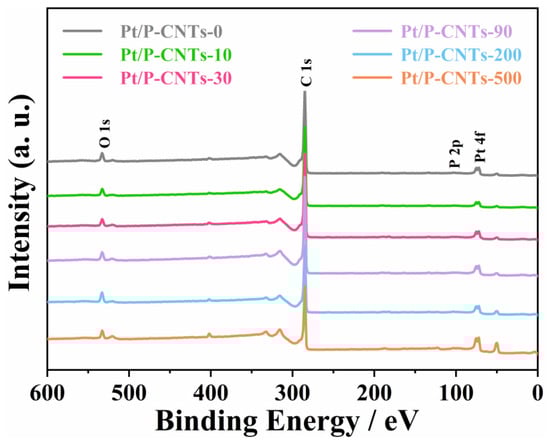
Figure 4.
XPS gross spectra of Pt/P-CNTs-M.
Analysis of the fitting results for sample C 1s (Figure 5) revealed three peaks at approximately 284.8 eV, 285.6 eV, and 286.7 eV, corresponding to C-C/C=C, C-P, and C=O bonds.
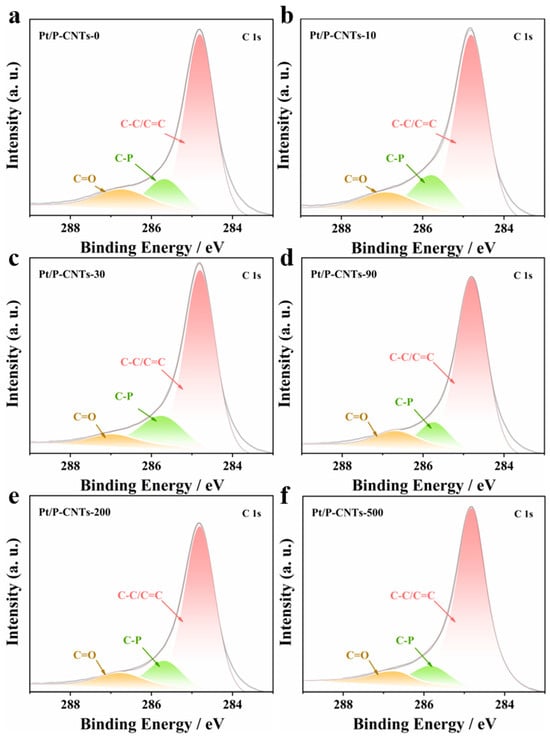
Figure 5.
C 1s spectrum of Pt/P-CNTs-M. (a) Pt/P-CNTs-0, (b) Pt/P-CNTs-10, (c) Pt/P-CNTs-30, (d) Pt/P-CNTs-90, (e) Pt/P-CNTs-200, (f) Pt/P-CNTs-500.
By performing a fitting analysis on the Pt 4f spectrum, the results are shown in Figure 6. The stronger double peaks near 71.8 eV and 75.1 eV correspond to Pt0, while the weaker double peaks around 72.9 eV and 76.1 eV represent Pt2+. As shown by the fitting analysis results, compared to Pt/P-CNTs-0, the Pt 4f7/2 binding energies of the five samples with added KBr exhibit varying degrees of negative shifts (0.06, 0.05, 0.17, 0.20, and 0.21 eV, respectively). Based on the analysis of XRD and HRTEM results, the negative shift may be attributed to the Pt(111) crystal plane acting as a close-packed surface, where the coordination number of surface atoms is relatively high, resulting in a lower d-band center. According to the d-band center theory, a lower d-band center reduces the binding energy. Additionally, an increase in particle size can also cause a negative shift in Pt binding energy [31]. Furthermore, when the KBr-to-Pt ratio is ≥90, the content of Pt0 begins to decrease. This phenomenon may be attributed to the fact that at a ratio ≥ 90, the Br− concentration is too high. Excessive Br− combines with Pt(n+) to form stable complexes, thereby increasing the reduction potential of Pt and inhibiting the reduction reaction, leading to a decrease in the Pt0 ratio. Furthermore, among all samples, Pt/P-CNTs-30 exhibits the highest Pt0 ratio (51.64%).
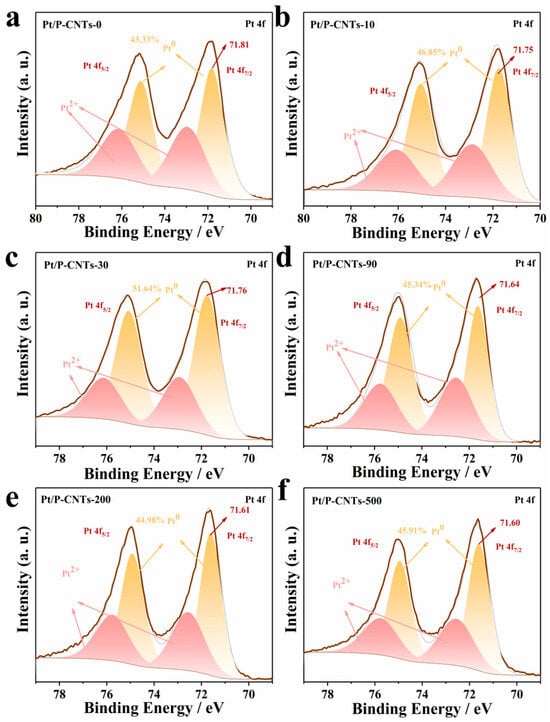
Figure 6.
Pt 4f spectrum of Pt/P-CNTs-M. (a) Pt/P-CNTs-0, (b) Pt/P-CNTs-10, (c) Pt/P-CNTs-30, (d) Pt/P-CNTs-90, (e) Pt/P-CNTs-200, (f) Pt/P-CNTs-500.
2.2. Evaluation of the Electrochemical Performance of the Catalyst
To investigate the variation in MOR performance of Pt/P-CNTs-M electrocatalysts synthesized with different Pt crystal plane ratios under different KBr addition levels, a three-electrode system was used to test the electrochemical performance of Pt/P-CNTs-M in alkaline electrolytes of 1.0 M KOH and 1.0 M KOH + 1.0 M CH3OH. During the experiments, the scan rate was fixed at 50 mV·s−1 to ensure the comparability and reliability of the data.
Figure 7 shows the electrochemical active surface area (ECSA) test results for the Pt/P-CNTs-M catalyst. The data in the figure show that compared to the other four samples (Pt/P-CNTs-M at 0, 10, 90, 200, and 500), Pt/P-CNTs-30 exhibits the largest electrochemical active surface area, indicating that this catalyst has a higher exposure of effective active sites. This phenomenon may be attributed to the following factors: first, the actual loading of Pt in Pt/P-CNTs-30 is relatively high; second, Pt nanoparticles exhibit good dispersion on the carrier surface; additionally, the smaller average particle size of Pt nanoparticles also contributes to increased exposure of active sites [32,33]. These factors collectively enhance the electrochemical active surface area of the catalyst.
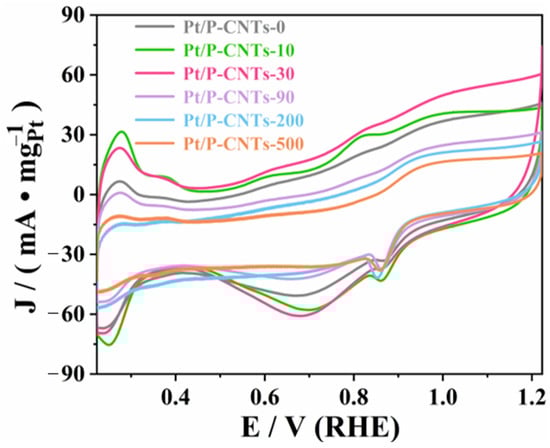
Figure 7.
Image of CV in 1.0 M KOH solution under saturated N2 (50 mV·s−1).
Through data analysis, it was found that although Pt/P-CNTs-10 has the highest actual Pt loading and the smallest particle size among the six samples, its actual active area is inferior to that of Pt/P-CNTs-30 (Figure 7). Combining the XRD results analyzed earlier, the reason for this phenomenon is that the Pt(111) crystal face exhibits higher activity and stability in an alkaline environment. Pt/P-CNTs-30 has a higher proportion of Pt(111) crystal faces compared to Pt/P-CNTs-10, resulting in the largest electrochemical active surface area for Pt/P-CNTs-30. This further confirms that increasing the proportion of the Pt(111) crystal plane enhances the electrocatalytic oxidation performance of Pt catalysts in the MOR reaction. The higher ECSA of Pt/P-CNTs-30 stems from the preferential exposure of the Pt(111) crystal plane and reduced agglomeration, which provides more active sites. This is the core reason for its superior MOR performance. Given the wide double-layer region of the GC/CNTs substrate, the ECSA values calculated from Pt HAD peaks are used for qualitative comparison among different samples rather than absolute quantitative determination. The qualitative trend of ECSA variation is consistent with the catalytic performance trends observed in this work, which supports the rationality of the comparative analysis.
As shown in Figure 8, the cyclic voltammetry curves indicate that different KBr addition amounts significantly affect the electrocatalytic performance of the catalyst, with the Pt/P-CNTs-30 catalyst exhibiting the best methanol oxidation activity [34]. Specifically, the mass-specific activity of Pt/P-CNTs-30 (3559.85 mA·mg−1Pt) is significantly higher than that of other comparison samples. Compared to Pt/P-CNTs-0 (3033.10 mA·mg−1Pt), Pt/P-CNTs-10 (3274.83 mA·mg−1Pt), Pt/P-CNTs-90 (2187.66 mA·mg−1Pt), Pt/P-CNTs-200 (1490.16 mA·mg−1Pt), and Pt/P-CNTs-500 (1117.36 mA·mg−1Pt), the mass-specific activity of Pt/P-CNTs-30 increased by 1.17, 1.09, 1.63, 2.38, and 3.19 times, respectively. This significant improvement in performance fully demonstrates the important role of KBr in regulating the structure and performance of the catalyst. Meanwhile, as shown in the figure, Pt/P-CNTs-30 exhibits a more negative onset potential, reflecting its excellent kinetic performance in the MOR process.
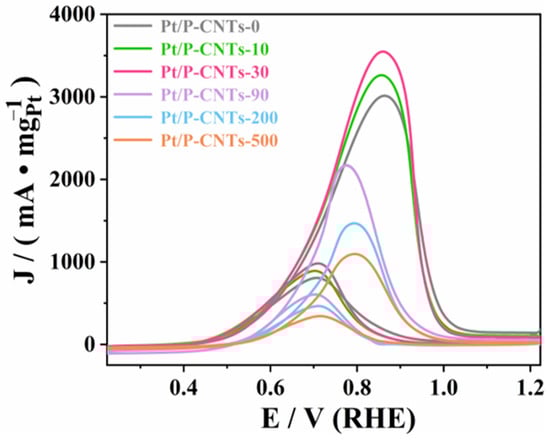
Figure 8.
Plot of CV in 1.0 M KOH + 1.0 M CH3OH solution under saturated N2 (50 mV·s−1).
To verify the reproducibility of these results, 5 independent CV measurements were conducted for each sample, and the results are presented in Figure 9. The small standard deviation across repeated tests confirms the stability of individual sample activities, while the consistent “first increase then decrease” trend (peaking at KBr:Pt = 30:1) across all repeats supports the reliability of the observed structure–activity correlation.
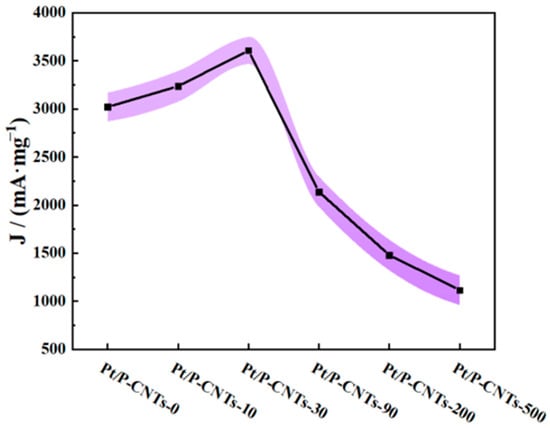
Figure 9.
The electrocatalytic mass activity change and fluctuation curve of Pt/P-CNTs samples measured by multiple CV measurements.
As shown in the electrochemical impedance spectroscopy (EIS) results in Figure 10, the impedance arc diameter of Pt/P-CNTs-30 is significantly smaller than that of other samples. This result directly reflects the superior charge transfer capability of Pt/P-CNTs-30. This is because Br− has strong adsorption selectivity for Pt low index crystal planes, and preferentially adsorbs on the Pt(111) crystal plane platform during the synthesis process, inhibiting the growth of other crystal planes (Pt(100), Pt(110)) and guiding Pt nanoparticles to grow directionally towards the (111) crystal plane, which is consistent with the XRD analysis results. Compared to other crystal planes, the Pt(111) crystal plane has a more suitable electronic configuration, which weakens the adsorption of inert intermediates while enhancing the adsorption of reactive species and reducing the energy barrier for charge transfer during the MOR process [35]. At the same time, the uniform dispersion of Pt nanoparticles on the P-CNTs carrier minimizes the interfacial resistance between Pt and the carrier, further improving the charge transfer efficiency.
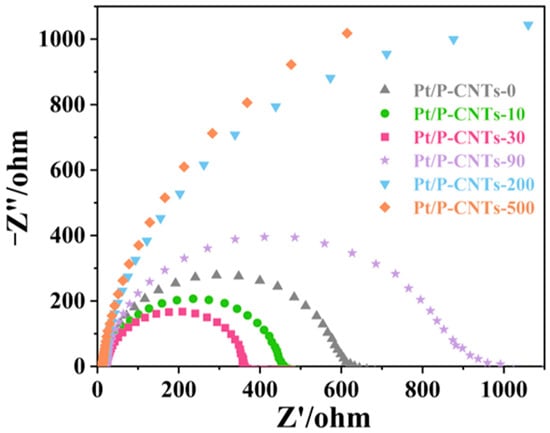
Figure 10.
EIS in 1.0 M KOH + 1.0 M CH3OH-purged N2.
Stability, as one of the core indicators for evaluating the practical performance of catalysts, is of great significance for their industrial applications. In the catalytic oxidation of methanol, the catalyst’s tolerance to carbon-based intermediates on its surface is typically a key factor influencing its stability.
This study employs the ratio of forward to reverse peak current density (If/Ib) in cyclic voltammetry (CV) as an evaluation criterion to conduct a qualitative analysis of the catalyst’s tolerance to carbon-based intermediates during the methanol oxidation process. As shown in Table 2, in alkaline media, the prepared Pt/P-CNTs-30 catalyst exhibited outstanding performance, with an If/Ib value of 3.76, significantly higher than that of other comparison samples. This result indicates that the Pt/P-CNTs-30 catalyst possesses significant anti-poisoning capability, effectively suppressing the accumulation of carbonaceous intermediates and maintaining the continuous availability of catalytic active sites, thereby providing important assurance for its practical application in fields such as fuel cells. This outstanding performance may stem from the catalyst’s unique microstructural characteristics and optimized surface properties, offering valuable references for subsequent catalyst design and optimization.
Table 2.
If/Ib results for Pt/P-CNTs-M (0, 10, 30, 90, 200, 500).
Chronocurrent testing is also an effective method for evaluating the long-term electrochemical stability of catalysts [36,37]. During the entire testing phase, the performance of different catalysts varied, with results shown in Figure 11. Among them, the current density decline trend of Pt/P-CNTs-30 was more gradual compared to other catalysts. When the reaction reached 3600 s, the current densities for Pt/P-CNTs-M (M = 0, 10, 30, 90, 200, 500) were 100.03 mA·mg−1Pt, 217.88 mA·mg−1Pt, 488.25 mA·mg−1Pt, 39.19 mA·mg−1Pt, 20.79 mA·mg−1Pt, and 18.47 mA·mg−1Pt, respectively. As can be seen from the comparison, the current density of Pt/P-CNTs-30 is significantly higher than that of the other five samples. This clearly indicates that Pt/P-CNTs-30 exhibits superior stability compared to the other five samples during the methanol oxidation reaction (MOR).
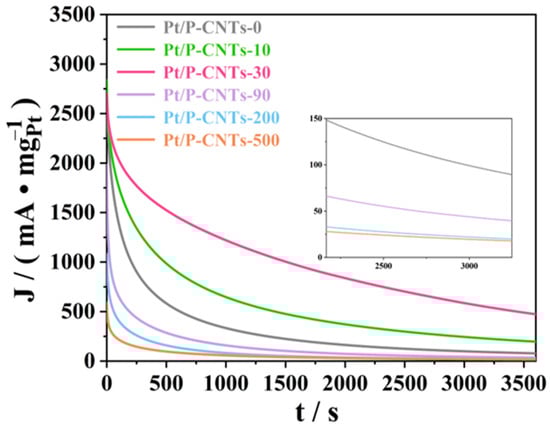
Figure 11.
CA in 1.0 M KOH + 1.0 M CH3OH-purged N2 (50 mV·s−1).
The stability of the catalyst was further elucidated through a CO stripping test, with the results shown in Figure 12. During the methanol electrocatalytic oxidation process, CO, as the primary catalyst poison, rapidly occupies Pt active sites, leading to reduced catalyst activity and stability. Generally, the lower the CO oxidation onset potential and CO oxidation peak potential, the better the catalyst’s resistance to CO poisoning. The figure shows the CO stripping curves of the catalyst measured in a 1 M KOH solution saturated with N2. As clearly shown in the figure, both the initial oxidation potential and peak oxidation potential of CO on Pt/P-CNTs-30 are more negative. This result indicates that, compared to other catalysts, CO can be more easily oxidized and removed on the surface of Pt/P-CNTs-30, which is consistent with the results of CV and CA tests.
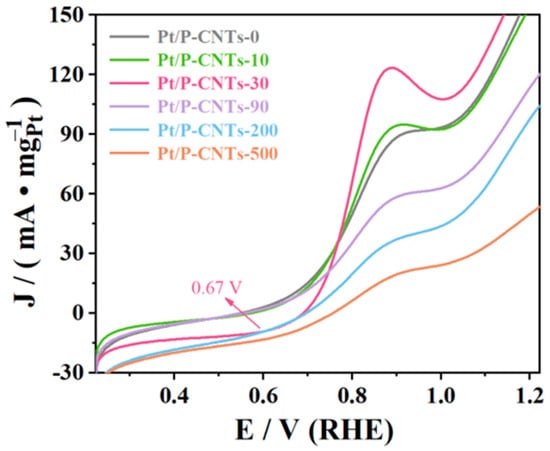
Figure 12.
Image of CO dissolution in 1.0 M KOH solution under saturated N2 (50 mV·s−1).
3. Experimental Section
3.1. Reagents and Instruments
The chemical reagents used in the experiment include: chloroplatinic acid (H2PtCl6·6H2O), triphenylphosphine (purity ≥ 99%), sodium hydroxide (purity ≥ 98%), potassium hydroxide (purity ≥ 95%), ethylene glycol (purity ≥ 99.5%), anhydrous ethanol (purity ≥ 99.7%), potassium bromide (purity ≥ 99.9%), all purchased from Shanghai McLean Bio-Chemical Technology Co., Ltd. (Shanghai, China); carboxylated multi-walled carbon nanotubes (MWCNTs, outer diameter 8–15 nm) purchased from Chengdu Institute of Organic Chemistry, Chinese Academy of Sciences (Chengdu, China); 5% Nafion membrane solution provided by DuPont (Wilmington, DE, USA); sulfuric acid (purity ≥ 98.3%) purchased from Sinopharm Chemical Reagents Co., Ltd. (Shanghai, China).
The experimental instruments used are as follows: a heat-collecting constant-temperature magnetic stirrer (DF-101S, Shanghai Lichenbangxi Instrument Technology Co., Ltd., Shanghai, China), a circulating water vacuum pump (SHB-III, Gongyi Yuhua Instrument Co., Ltd., Gongyi, China), a rotating disk electrode (RRDE-1A, Taizhou Deyi Analytical Instrument Co., Ltd., Taizhou, China), an electrochemical workstation (CHI660E, Shanghai Chenhua Instrument Co., Ltd.), Shanghai, China, Ultrasonic cleaner (F-0305D, Shenzhen Fuyang Technology Group Co., Ltd., Shenzhen, China), electronic analytical balance (ES1035B, Tianjin De’an’an’te Sensing Technology Co., Ltd., Tianjin, China), saturated mercury electrode (R0232, Tianjin Aida Hengsheng Technology Development Co., Ltd., Tianjin, China), magnetic stirrer (DF101S, Changzhou Jintan Dadi Automation Instrument Factory, Changzhou, China), Vacuum Drying Oven (SN-DZF-6020, Shanghai Shangpu Instrument Equipment Co., Ltd., Shanghai, China), Tube Furnace (OTF-1200X-S, Hefei Kejing Materials Technology Co., Ltd., Hefei, China), pH Meter (PHSJ-6L, Shanghai Yidi Scientific Instrument Co., Ltd., Shanghai, China).
3.2. Preparation of the Carrier
Synthesis of phosphorus-doped carbon nanotubes (P-CNTs): 0.3 g of CNTs and 2.1 g of triphenylphosphine were dispersed in 200 mL of anhydrous ethanol via ultrasonication for 1 h. The mixture was then stirred for 12 h and subjected to rotary evaporation at 60 °C until the solvent evaporated. The precursor was then calcined at 600 °C under a nitrogen atmosphere at a heating rate of 5 °C/min for 2 h. The resulting phosphorus-doped CNTs were designated as P-CNTs.
3.3. Preparation of the Catalyst
Take 50.0 mg of P-CNTs and 156.1 mg of KBr (with a molar ratio of 10 to Pt) and uniformly disperse them in 40 mL of ethylene glycol (EG) using ultrasonication. Then, add 3.571 mL of H2PtCl6·6H2O/EG solution (3.5 mg Pt/mL) and stir for 3 h to obtain a uniform suspension. Adjust the pH to 10–12 using NaOH/EG (1.0 mol/L), then transfer the suspension to a 100 mL PTFE-lined high-pressure reactor and heat at 140 °C for 4 h. After the reaction, quench with cold water, adjust the pH of the system to 2–3 using 0.5 M H2SO4 solution, and stir overnight. Finally, the catalyst was filtered, washed, and vacuum-dried at 60 °C for 12 h, yielding the catalyst named Pt/P-CNTs-M (where M denotes the molar ratio of KBr to Pt, corresponding to 0, 10, 30, 90, 200, and 500). The theoretical metal loading was 20 wt.%.
3.4. Catalyst Characterization Methods
Inductively Coupled Plasma Optical Emission Spectroscopy (ICP-OES) was used to perform quantitative analysis of Pt and P in the catalyst samples using an Agilent (Santa Clara, CA, USA) ICP-OES 730 inductively coupled plasma emission spectrometer.
X-ray diffraction (XRD) was performed using a Malvern (Malvern, UK) Panalytical multifunctional powder diffractometer (XPert Pro MPD) to measure the powdered catalyst. The scanning angle ranged from 10° to 90°, with a scanning rate of 5° min−1.
Transmission electron microscopy (TEM) was performed using the FEI (Hillsboro, OR, USA) Tecnai F20 and X-Twin energy dispersive spectrometer to observe the dispersion degree of the catalyst, the particle size of metal nanoparticles, and the distribution of elements. Ethanol was used as a dispersant for dilution, and the sample was ultrasonicated for 30 min before being deposited onto a micro-copper grid. Particle size distribution calculations were performed on 200 particles selected from the TEM images.
X-ray photoelectron spectroscopy (XPS) was performed using a K-Alpha X-ray photoelectron spectrometer from Thermo Fisher Scientific (Waltham, MA, USA) to analyze the configuration of phosphorus (P) and the chemical valence state of platinum (Pt) in the catalyst.
3.5. Electrochemical Performance Evaluation of the Catalyst
To explore how P doping regulates the electrocatalytic methanol oxidation reaction (MOR) behavior of Pt NPs, a conventional three-electrode setup was adopted at room temperature (25 °C) using an electrochemical workstation coupled with a rotating disk electrode. Pt/CNTs served as the reference catalyst, while the MOR performance of Pt/P-CNTs-T series catalysts was systematically assessed under alkaline conditions. A mercury–mercury chloride electrode (SCE) was used as the reference electrode, and all potential values in the study were converted to the relative reversible hydrogen electrode (RHE) scale using the Nernst equation: E(RHE) = E(SCE) + 0.2412 V + 0.0591 V × pH. A platinum wire electrode was used as the counter electrode. The prepared catalyst was coated onto the surface of a glassy carbon electrode (GCE, d = 4 mm, S = 0.1256 cm2) as the working electrode.
A 2.00 mg aliquot of the catalyst was weighed into a 1 mL centrifuge tube, followed by the addition of 50 μL Nafion membrane solution, 450 μL anhydrous ethanol, and 500 μL deionized water. The mixture was subjected to 30 min of sonication for homogeneous dispersion, after which 5 μL of the suspension was pipetted onto the GCE surface. The electrode was dried at room temperature to complete the fabrication.
ECSA, defined as the effective surface area involved in electrochemical reactions, is a critical metric for evaluating the number of accessible active sites and catalytic activity—higher ECSA typically correlates with enhanced MOR performance [38]. For Pt-based catalysts, ECSA was determined via cyclic voltammetry (CV) in N2-purged 1.0 M KOH electrolyte, with a scan rate of 50 mV·s−1 and a potential window of 0.223 to 1.223 V (vs. RHE).
CV measurements were performed in N2-deaerated 1.0 M KOH + 1.0 M CH3OH solution, maintaining the same scan rate (50 mV·s−1) and potential range (0.223–1.223 V vs. RHE) as the ECSA test. The MOR activity of the catalysts was quantified based on the forward peak current density derived from the CV curves.
To evaluate the long-term stability of the catalysts, CA tests were carried out in N2-purged 1.0 M KOH + 1.0 M CH3OH electrolyte at a constant potential of 0.823 V (vs. RHE). The tests were sustained for 3600 s, with the scan rate consistent with previous measurements (50 mV·s−1).
EIS is widely utilized to characterize charge transfer resistance in electrocatalytic processes, thereby reflecting the kinetics of the catalytic reaction [39,40]. Measurements were implemented in N2-deaerated 1.0 M KOH + 1.0 M CH3OH electrolyte at a potential of 0.523 V (vs. RHE), with an AC amplitude of 5 mV and a frequency range spanning 100,000 Hz to 0.01 Hz.
The electrolyte for CO desorption measurements was 1.0 M KOH, with parameters aligned with those used in previous CA and CV tests. First, CO gas was continuously bubbled into the electrolyte to achieve saturation, and CA testing was performed under sustained CO flow to facilitate CO adsorption on the catalyst surface. After completing the CA test, the gas supply was switched to N2 (at a higher flow rate than CO) to ensure complete removal of residual CO from the electrolyte. Subsequent CV testing was conducted within the potential range of 0.223 to 1.223 V (vs. RHE) at 50 mV·s−1. Finally, the CO poisoning resistance of the catalysts was comprehensively assessed based on the CO oxidation onset potential and peak current density.
4. Conclusions
In this study, phosphorus-doped carbon nanotubes were used as a carrier, and platinum nanoparticles with Pt(111) crystal plane orientation were successfully synthesized via the hydrothermal synthesis method. The conclusions obtained are as follows: XRD results indicate that the addition of KBr optimized the crystal plane ratio of Pt nanoparticles, exposing more highly active crystal planes (Pt(111) crystal planes), with Pt/P-CNTs-30 exhibiting the highest Pt(111) crystal plane ratio among all samples (27.21%); TEM results show that the addition of KBr regulates the morphology of the nanoparticles, resulting in a more uniform size distribution and relatively smaller particle size. Analysis of the XPS spectra of Pt reveals that KBr also has a certain influence on the reduction in Pt ions. As the proportion of KBr increases, the content of Pt0 first increases and then decreases, with the highest Pt0 content observed in Pt/P-CNTs-30 (51.64%). Furthermore, the addition of KBr causes a certain degree of negative shift in the binding energy of Pt 4f7/2 in the samples (0.06, 0.05, 0.17, 0.20, 0.21 eV), indicating that the d-band center of Pt is lowered, thereby weakening the adsorption energy of COads. In electrochemical testing, Pt/P-CNTs-30 exhibited the highest activity, with a peak current density of 3559.85 mA·mg−1Pt, which is 1.17 times that of Pt/P-CNTs-0; EIS spectra show that Pt/P-CNTs-30 has the lowest charge transfer impedance, indicating faster electron transfer kinetics; CA test results also indicate that Pt/P-CNTs-30 exhibits significantly higher stability than the other five samples; CO stripping curves also show that Pt/P-CNTs-30 has a more negative initial oxidation potential and oxidation peak potential, indicating its superior resistance to CO poisoning among the six samples, consistent with the results from CV and CA curves. Using an appropriate amount of KBr can enhance the content of the active Pt crystal face (Pt(111)) while improving its morphological structure and enhancing the electrochemical performance of the Pt catalyst.
Author Contributions
W.Z.: Writing—original draft, Investigation, Data curation. Y.Z.: Formal analysis, Validation, Software, Writing—review& editing. H.L.: Investigation, Methodology. All authors have read and agreed to the published version of the manuscript.
Funding
This research received no external funding.
Data Availability Statement
The raw data supporting the conclusions of this article will be made available by the authors on request.
Acknowledgments
The authors would like to acknowledge the institutional support from Lanzhou University of Technology. The authors gratefully acknowledge Li for his insightful guidance throughout the study.
Conflicts of Interest
Wenpeng Zhang was employed by the 13th Construction Co., Ltd., of CNCEC. The remaining authors declare that the research was conducted in the absence of any commercial or financial relationships that could be construed as a potential conflict of interest.
References
- Zakaria, K.; McKay, M.; Thimmappa, R.; Hasan, M.; Mamlouk, M.; Scott, K. Direct Glycerol Fuel Cells: Comparison with Direct Methanol and Ethanol Fuel Cells. ChemElectroChem 2019, 6, 2578–2585. [Google Scholar] [CrossRef]
- Lu, L.; Zhang, S.; Yan, S. Au-based electrocatalysts used in direct methanol fuel cells. Int. J. Electrochem. Sci. 2024, 19, 100546. [Google Scholar] [CrossRef]
- Lee, D.; Gok, S.; Kim, Y.; Sung, Y.E.; Lee, E.; Jang, J.H.; Hwang, J.Y.; Kwon, O.J.; Lim, T. Methanol Tolerant Pt-C Core-Shell Cathode Catalyst for Direct Methanol Fuel Cells. ACS Appl. Mater. Interfaces 2020, 12, 44588–44596. [Google Scholar] [CrossRef]
- Cheng, Z.; Zhang, Q.; Cao, J.; Ning, P.; Chen, J. Ceria-zirconia solid solution supported platinum catalysts for toluene oxidation: Studying the improved catalytic activity by tungsten addition. Sep. Purif. Technol. 2025, 357, 130144. [Google Scholar] [CrossRef]
- Yang, H.; Wu, Y.; Zhuang, Z.; Li, Y.; Chen, C. Factors Affecting the Catalytic Performance of Nano-catalysts. Chin. J. Chem. 2021, 40, 515–523. [Google Scholar] [CrossRef]
- Guo, R.; An, N.; Huang, Y.; Guan, L.; Zhang, G.; Zhu, G.; Liu, Z. One-Pot Synthesis of Pt High Index Facets Catalysts for Electrocatalytic Oxidation of Ethanol. Nanomaterials 2022, 12, 4451. [Google Scholar] [CrossRef]
- Yong, W.; Toshiyuki, Y.; Takashi, T. Selective production of light olefins over zeolite catalysts: Impacts of topology, acidity, and particle size. Microporous Mesoporous Mater. 2023, 358, 112353. [Google Scholar]
- Wang, Y.; Zhang, W.; Li, D.; Guo, J.; Yu, Y.; Ding, K.; Duan, W.; Li, X.; Liu, H.; Su, P.; et al. Efficient schottky junction construction in metal-organic frameworks for boosting H2 production activity. Adv. Sci. 2021, 8, 2004456. [Google Scholar] [CrossRef]
- Wang, W.; Qu, C.; Zhang, D.; Liu, H.; Zheng, X.; Zhang, J.; Ye, Q. Pt/Na-Sepiolite catalysts with superior catalytic oxidation of benzene and anti-poisoning performance. J. Environ. Chem. Eng. 2025, 13, 116643. [Google Scholar] [CrossRef]
- Nardecchia, S.; Serrano, M.C.; García-Argüelles, S.; Da Costa, M.E.H.M.; Ferrer, M.L.; Gutiérrez, M.C. Ice as a Green-Structure-Directing Agent in the Synthesis of Macroporous MWCNTs and Chondroitin Sulphate Composites. Materials 2017, 10, 355. [Google Scholar] [CrossRef] [PubMed]
- He, J.-F.; Xiong, Z.-B.; Du, Y.-P.; Lu, W.; Tian, S.-L. Morphology effect of tungsten oxide on Ce/W catalyst for selective catalytic reduction of NO with NH3: Influence of structure-directing agents. J. Energy Inst. 2021, 94, 85–95. [Google Scholar] [CrossRef]
- Wannapakdee, W.; Meng, L.; van Hoof, A.J.F.; Bolshakov, A.; Wattanakit, C.; Hensen, E.J.M. The Important Role of Rubidium Hydroxide in the Synthesis of Hierarchical ZSM-5 Zeolite Using Cetyltrimethylammonium as Structure-Directing Agent. Eur. J. Inorg. Chem. 2019, 2019, 2493–2497. [Google Scholar] [CrossRef]
- Almeida, G.; Variani, Y.M.; Gómez-Hortigüela, L.; Mercury, J.M.R.; Rojas, A. Performance of three different cations based on imidazolium ring as structure directing agents in the synthesis of aluminophosphates and silicoaluminophosphates microporous materials. Microporous Mesoporous Mater. 2020, 294, 109861. [Google Scholar] [CrossRef]
- Koo, K.; Shen, B.; Baik, S.I.; Mao, Z.; Smeets, P.J.; Cheuk, I.; He, K.; Dos Reis, R.; Huang, L.; Ye, Z.; et al. Formation mechanism of high-index faceted Pt-Bi alloy nanoparticles by evaporation-induced growth from metal salts. Nat. Commun. 2023, 14, 3790. [Google Scholar] [CrossRef] [PubMed]
- Marchetti, F.; Pettinari, C.; Di Nicola, C.; Tombesi, A.; Pettinari, R. Coordination chemistry of pyrazolone-based ligands and applications of their metal complexes. Coord. Chem. Rev. 2019, 401, 213069. [Google Scholar] [CrossRef]
- Xiao, N.; Chen, Y.; Weng, W.; Chi, X.; Chen, H.; Tang, D.; Zhong, S. Mechanism Understanding for Size Regulation of Silver Nanowires Mediated by Halogen Ions. Nanomaterials 2022, 12, 2681. [Google Scholar] [CrossRef]
- Zheng, J.; Suwardi, A.; Wong, C.J.E.; Loh, X.J.; Li, Z. Halogen bonding regulated functional nanomaterials. Nanoscale Adv. 2021, 3, 6342–6357. [Google Scholar] [CrossRef]
- Glebov, E.M.; Grivin, V.P.; Plyusnin, V.F.; Venediktov, A.B.; Korenev, S.V. Photochemistry of PtBr62- complex in aqueous solutions. Formation and decay of Br2-radical anions. J. Photochem. Photobiol. A Chem. 2010, 214, 181–187. [Google Scholar] [CrossRef]
- Kulkarni, S.D.; Walimbe, P.C.; Ingulkar, R.B.; Lahase, J.D.; Kulkarni, P.S. Revert Banding in One-Dimensional Periodic Precipitation of the (AgNO3+KBr) System in Agar Gel. ACS Omega 2019, 4, 13061–13068. [Google Scholar] [CrossRef]
- Bresien, J.; Schulz, A.; Thomas, M.; Villinger, A. A Bismuth-Areneσ-Complex-On the Edge of Menshutkin-Type Complexes. Eur. J. Inorg. Chem. 2019, 2019, 1279–1287. [Google Scholar] [CrossRef]
- Shinyoshi, N.; Seino, S.; Hasegawa, Y.; Uetake, Y.; Nagai, T.; Monden, R.; Ishihara, A.; Nakagawa, T. Effect of particle size on the oxygen reduction reaction activity of carbon-supported niobium-oxide-based nanoparticle catalysts. J. Mater. Sci. 2025, 60, 3275–3285. [Google Scholar] [CrossRef]
- Liu, J.-X.; Wang, P.; Xu, W.; Hensen, E.J. Particle Size and Crystal Phase Effects in Fischer-Tropsch Catalysts. Engineering 2017, 3, 467–476. [Google Scholar] [CrossRef]
- Tetteh, E.B.; Gyan-Barimah, C.; Lee, H.Y.; Kang, T.H.; Kang, S.; Ringe, S.; Yu, J.S. Strained Pt(221) Facet in a PtCo@Pt-Rich Catalyst Boosts Oxygen Reduction and Hydrogen Evolution Activity. ACS Appl. Mater. Interfaces 2022, 14, 25246–25256. [Google Scholar] [CrossRef] [PubMed]
- Shi, T.; Men, Y.; Liu, S.; Wang, J.; Li, Z.; Qin, K.; Tian, D.; An, W.; Pan, X.; Li, L. Engineering the crystal facets of Pt/In2O3 catalysts for high-efficiency methanol synthesis from CO2 hydrogenation. Colloids Surf. A Physicochem. Eng. Asp. 2022, 651, 129782. [Google Scholar] [CrossRef]
- Jhabli, O.; Boutamart, M.; Bouziad, J.; Ghadbane, A.; Rafqah, S.; Redouany, Y.; Bouhmad, A.; Nouneh, K.; Galai, M.; Hsissou, R.; et al. New insights into carbonaceous materials and lead/carbon composites in lead carbon battery. J. Energy Storage 2022, 56, 106019. [Google Scholar] [CrossRef]
- Zhu, A.; Zhou, Y.; Wang, Y.; Zhu, Q.; Liu, H.; Zhang, Z.; Lu, H. Catalytic combustion of VOCs on Pt/CuMnCe and Pt/CeY honeycomb monolithic catalysts. J. Rare Earths 2018, 36, 1272–1277. [Google Scholar] [CrossRef]
- Wang, T.; Yu, Y.; Jiang, X.; Askarov, S.; Khan, S.; Wu, Q.; Zhang, Y.; Chen, K.; Shi, D.; Zhang, F.; et al. Structural modulation of carbon-confined Pt-based catalysts with high-dispersed controllable tri-heterointerface and their MOR performance. Int. J. Hydrogen Energy 2025, 106, 1016–1028. [Google Scholar] [CrossRef]
- Narsing, S.; Namita, B.; Ravi, S. Effect of capping agent on the particle size of CdSe nanoparticles. Lumin. J. Biol. Chem. Lumin. 2016, 31, 1400–1406. [Google Scholar]
- Noviyanto, A.; Amalia, R.; Maulida, P.Y.D.; Dioktyanto, M.; Arrosyid, B.H.; Aryanto, D.; Zhang, L.; Wee, A.T.; Arramel. Anomalous Temperature-Induced Particle Size Reduction in Manganese Oxide Nanoparticles. NACS Omega 2023, 8, 45152–45162. [Google Scholar] [CrossRef]
- Li, F.; Zhang, S.; Luo, J.; Geng, X.; Xu, Z.; Shrout, T.R. [111]-oriented PIN-PMN-PT crystals with ultrahigh dielectric permittivity and high frequency constant for high-frequency transducer applications. J. Appl. Phys. 2016, 120, 074105. [Google Scholar] [CrossRef]
- Ge, S.; Fan, W.; Tang, X.; Cui, Y.; Wang, D.; Gong, X.-Q.; Dai, S.; Lou, Y.; Tang, J.; Guo, Y.; et al. Revealing the size effect of ceria nanocube-supported platinum nanoparticles in complete propane oxidation. ACS Catal. 2024, 14, 2532–2544. [Google Scholar] [CrossRef]
- Li, Y.; Li, H.; Li, G.; Wang, D.; Wang, S.; Zhao, X. Low-temperature N-anchored ordered Pt3Co intermetallic nanoparticles as electrocatalysts for methanol oxidation reaction. Nanoscale 2022, 14, 14199–14211. [Google Scholar] [CrossRef] [PubMed]
- Cai, B.; Wen, D.; Liu, W.; Herrmann, A.; Benad, A.; Eychmüller, A. Function-led design of aerogels: Self-assembly of alloyed PdNi hollow nanospheres for efficient electrocatalysis. Angew. Chem. Int. Ed. 2015, 54, 13101–13105. [Google Scholar] [CrossRef]
- Wang, Q.; Chen, S.; Lan, H.; Li, P.; Ping, X.; Ibraheem, S.; Long, D.; Duan, Y.; Wei, Z. Thermally driven interfacial diffusion synthesis of nitrogen-doped carbon confined trimetallic Pt3CoRu composites for the methanol oxidation reaction. J. Mater. Chem. A 2019, 7, 18143–18149. [Google Scholar] [CrossRef]
- Wang, Y.; Gui, Z.; Li, D.; Gao, G.; Yan, R. Ni-Pt-Pd ternary alloy nanoparticles supported on carboxyl-modified carbon nanotubes as highly efficient catalyst for methanol and ethanol electrooxidation. Appl. Surf. Sci. 2024, 669, 160555. [Google Scholar] [CrossRef]
- Wang, Z.; Wang, L.; Rani, K.K.; Waqas, M.; Huang, D.; Huang, Q.; Liu, X.; Yang, Z.; Peng, X.; Chen, D.H.; et al. Composition-tunable PtNiCu nanoparticles for boosting methanol oxidation reaction. J. Alloys Compd. 2023, 946, 169354. [Google Scholar] [CrossRef]
- Li, S.; Ajmal, S.; Zhou, X.; Lu, M.; Li, X.; Sun, Z.; Liu, S.; Zhu, M.; Li, P. Mixed-Dimensional Partial Dealloyed PtCuBi/C as High-Performance Electrocatalysts for Methanol Oxidation with Enhanced CO Tolerance. Small 2023, 20, e2309226. [Google Scholar] [CrossRef]
- Maillard, F.; Eikerling, M.; Cherstiouk, O.V.; Schreier, S.; Savinova, E.; Stimming, U. Size effects on reactivity of Pt nanoparticles in CO monolayer oxidation: The role of surface mobility. Faraday Discuss. 2004, 125, 357–377. [Google Scholar] [CrossRef]
- Maillard, F.; Schreier, S.; Hanzlik, M.; Savinova, E.R.; Weinkauf, S.; Stimming, U. Influence of particle agglomeration on the catalytic activity of carbon-supported Pt nanoparticles in CO monolayer oxidation. Phys. Chem. Chem. Phys. 2005, 7, 385–393. [Google Scholar] [CrossRef]
- Mundy, G.R.; Potter, R.J.; Christensen, P.A.; Hamnett, A. A study of the electro-oxidation of methanol on platinum in 1 M Na2SO4 by electrochemical and in-situ FTIR techniques. J. Electroanal. Chem. 1990, 279, 257–272. [Google Scholar] [CrossRef]
Disclaimer/Publisher’s Note: The statements, opinions and data contained in all publications are solely those of the individual author(s) and contributor(s) and not of MDPI and/or the editor(s). MDPI and/or the editor(s) disclaim responsibility for any injury to people or property resulting from any ideas, methods, instructions or products referred to in the content. |
© 2025 by the authors. Licensee MDPI, Basel, Switzerland. This article is an open access article distributed under the terms and conditions of the Creative Commons Attribution (CC BY) license.