
Molecular Dynamics Studies on the Inhibition of Cholinesterases by Secondary Metabolites

Abstract
1. Introduction
1.1. Selective Cholinesterse Inhibitors and Alzheimer’s Disease
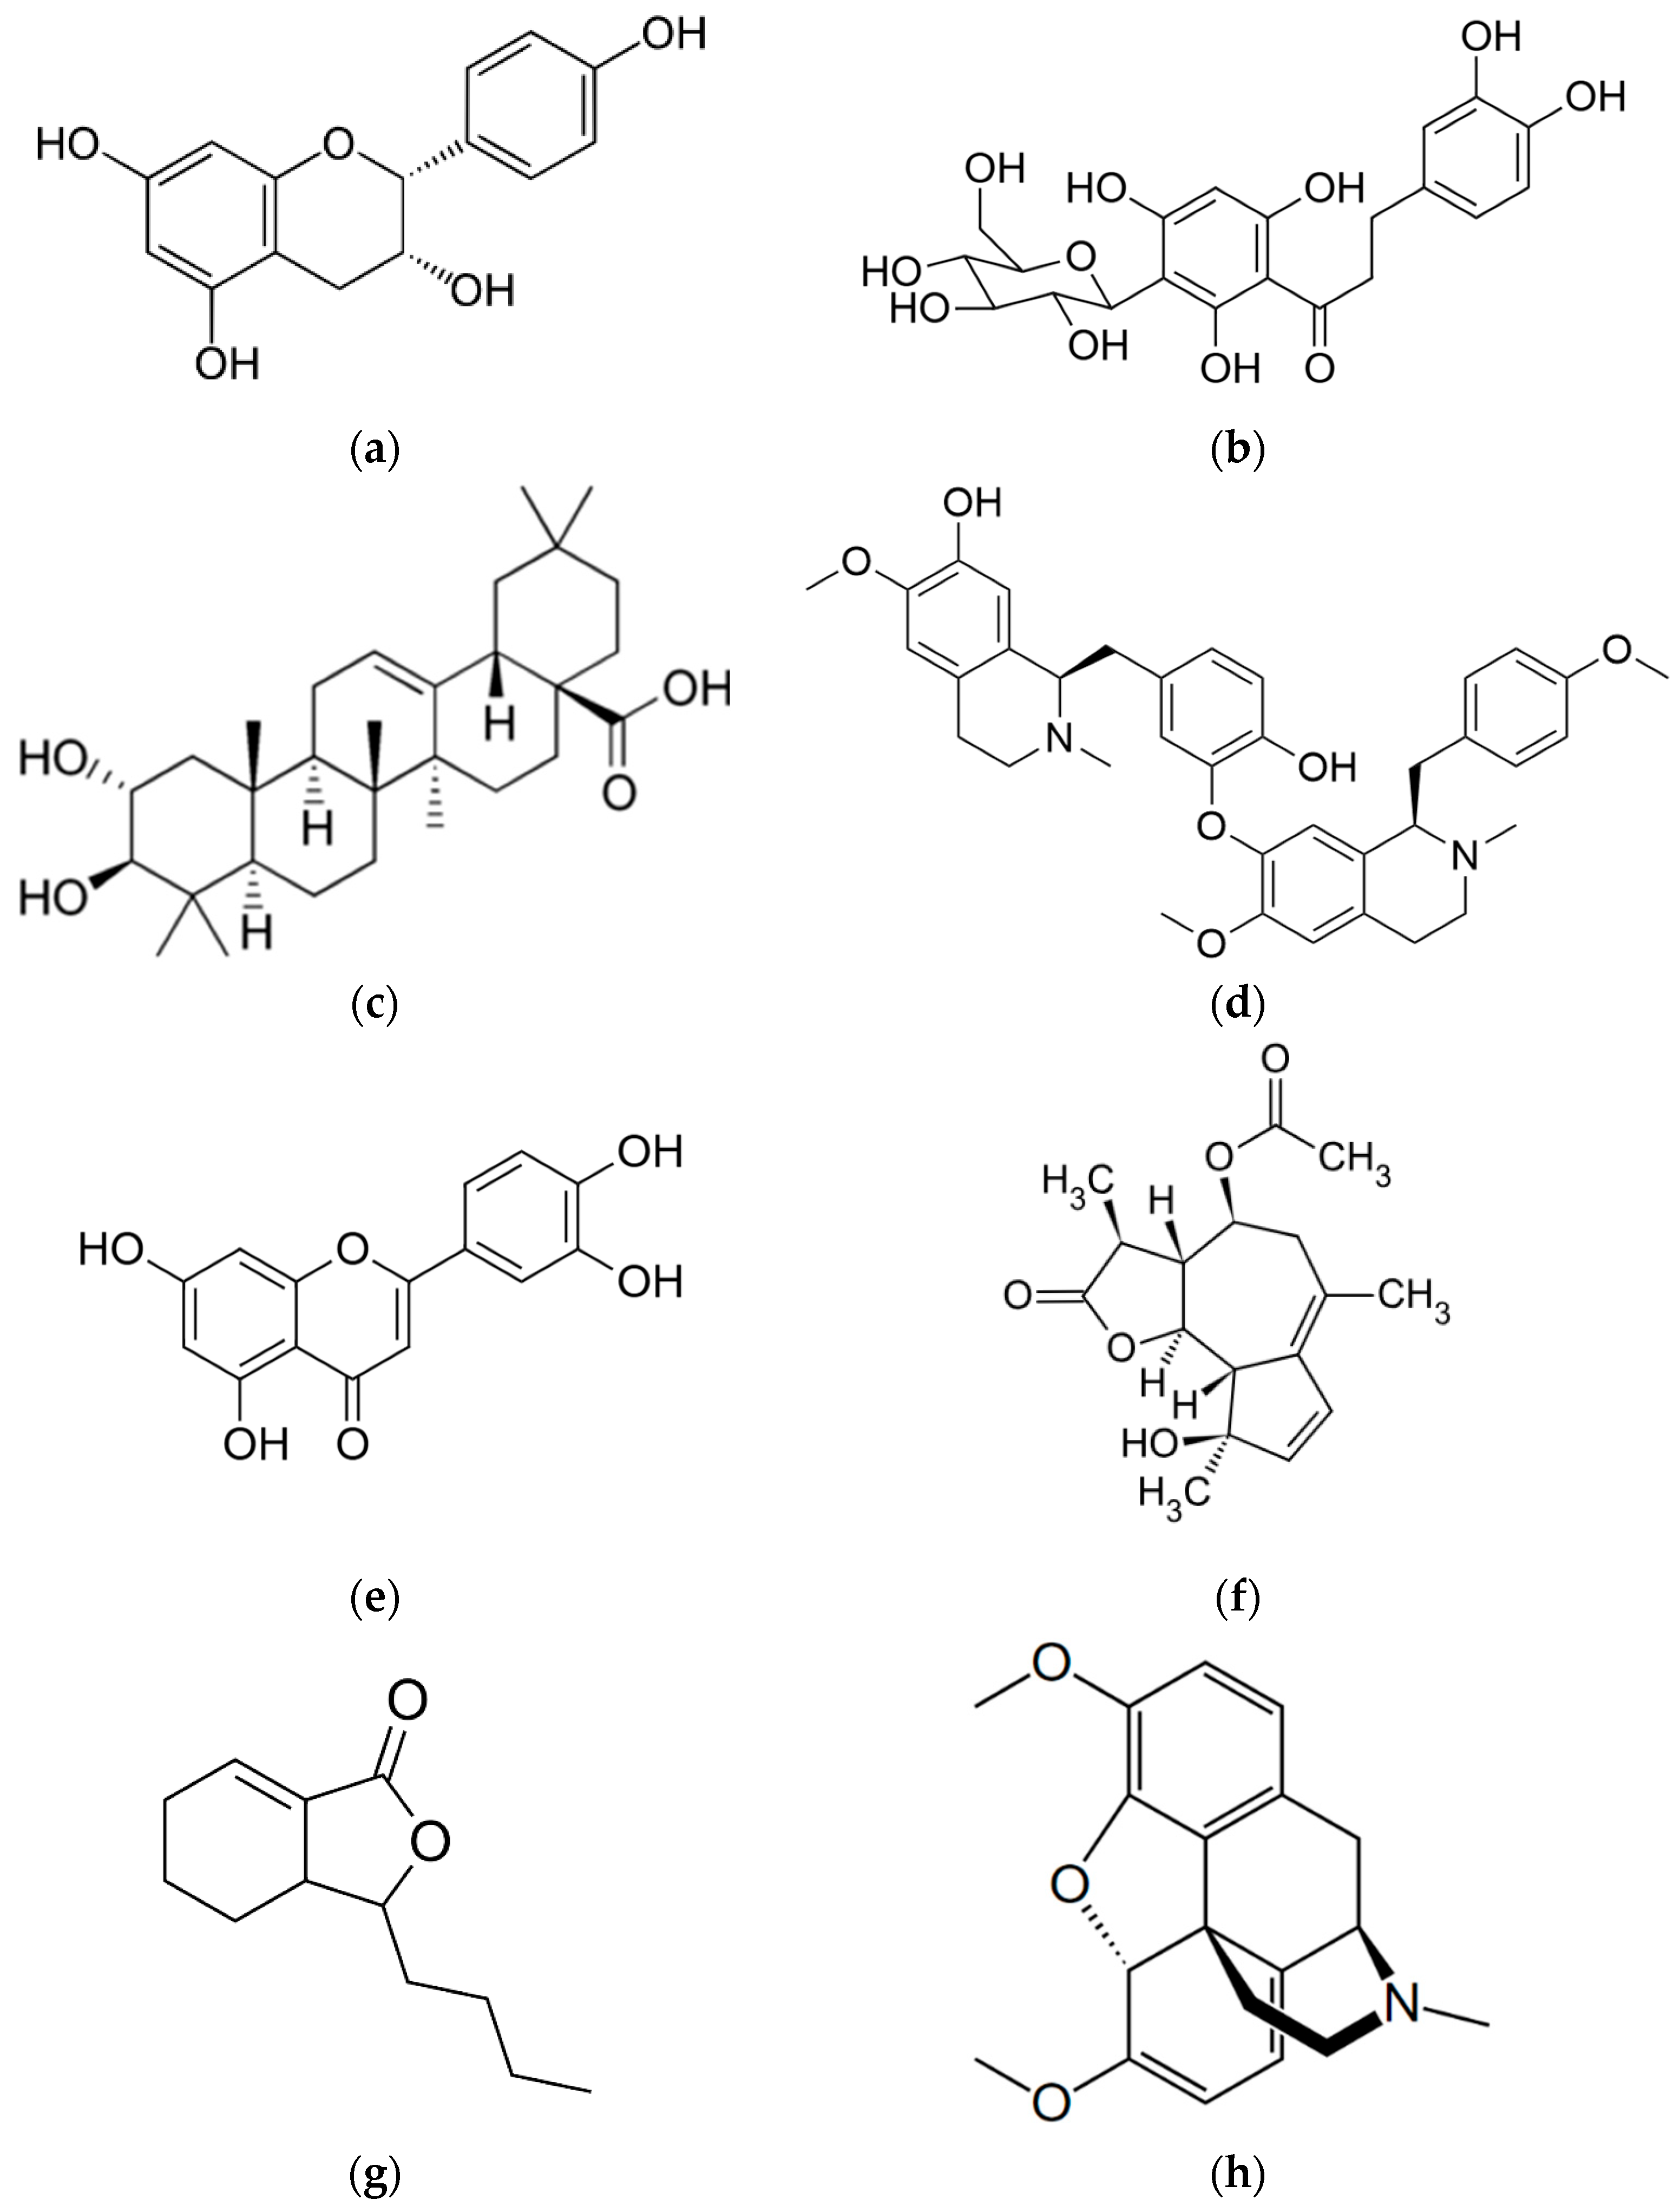
1.2. Secondary Metabolite Phytochemicals
1.2.1. Afzelechin
1.2.2. Aspalathin
1.2.3. D-Maslinic Acid
1.2.4. Isoliensinine
1.2.5. Luteolin
1.2.6. Matricin
1.2.7. Sedanolide
1.2.8. Thebaine
2. Results
2.1. Secondary Metabolite Phytochemicals
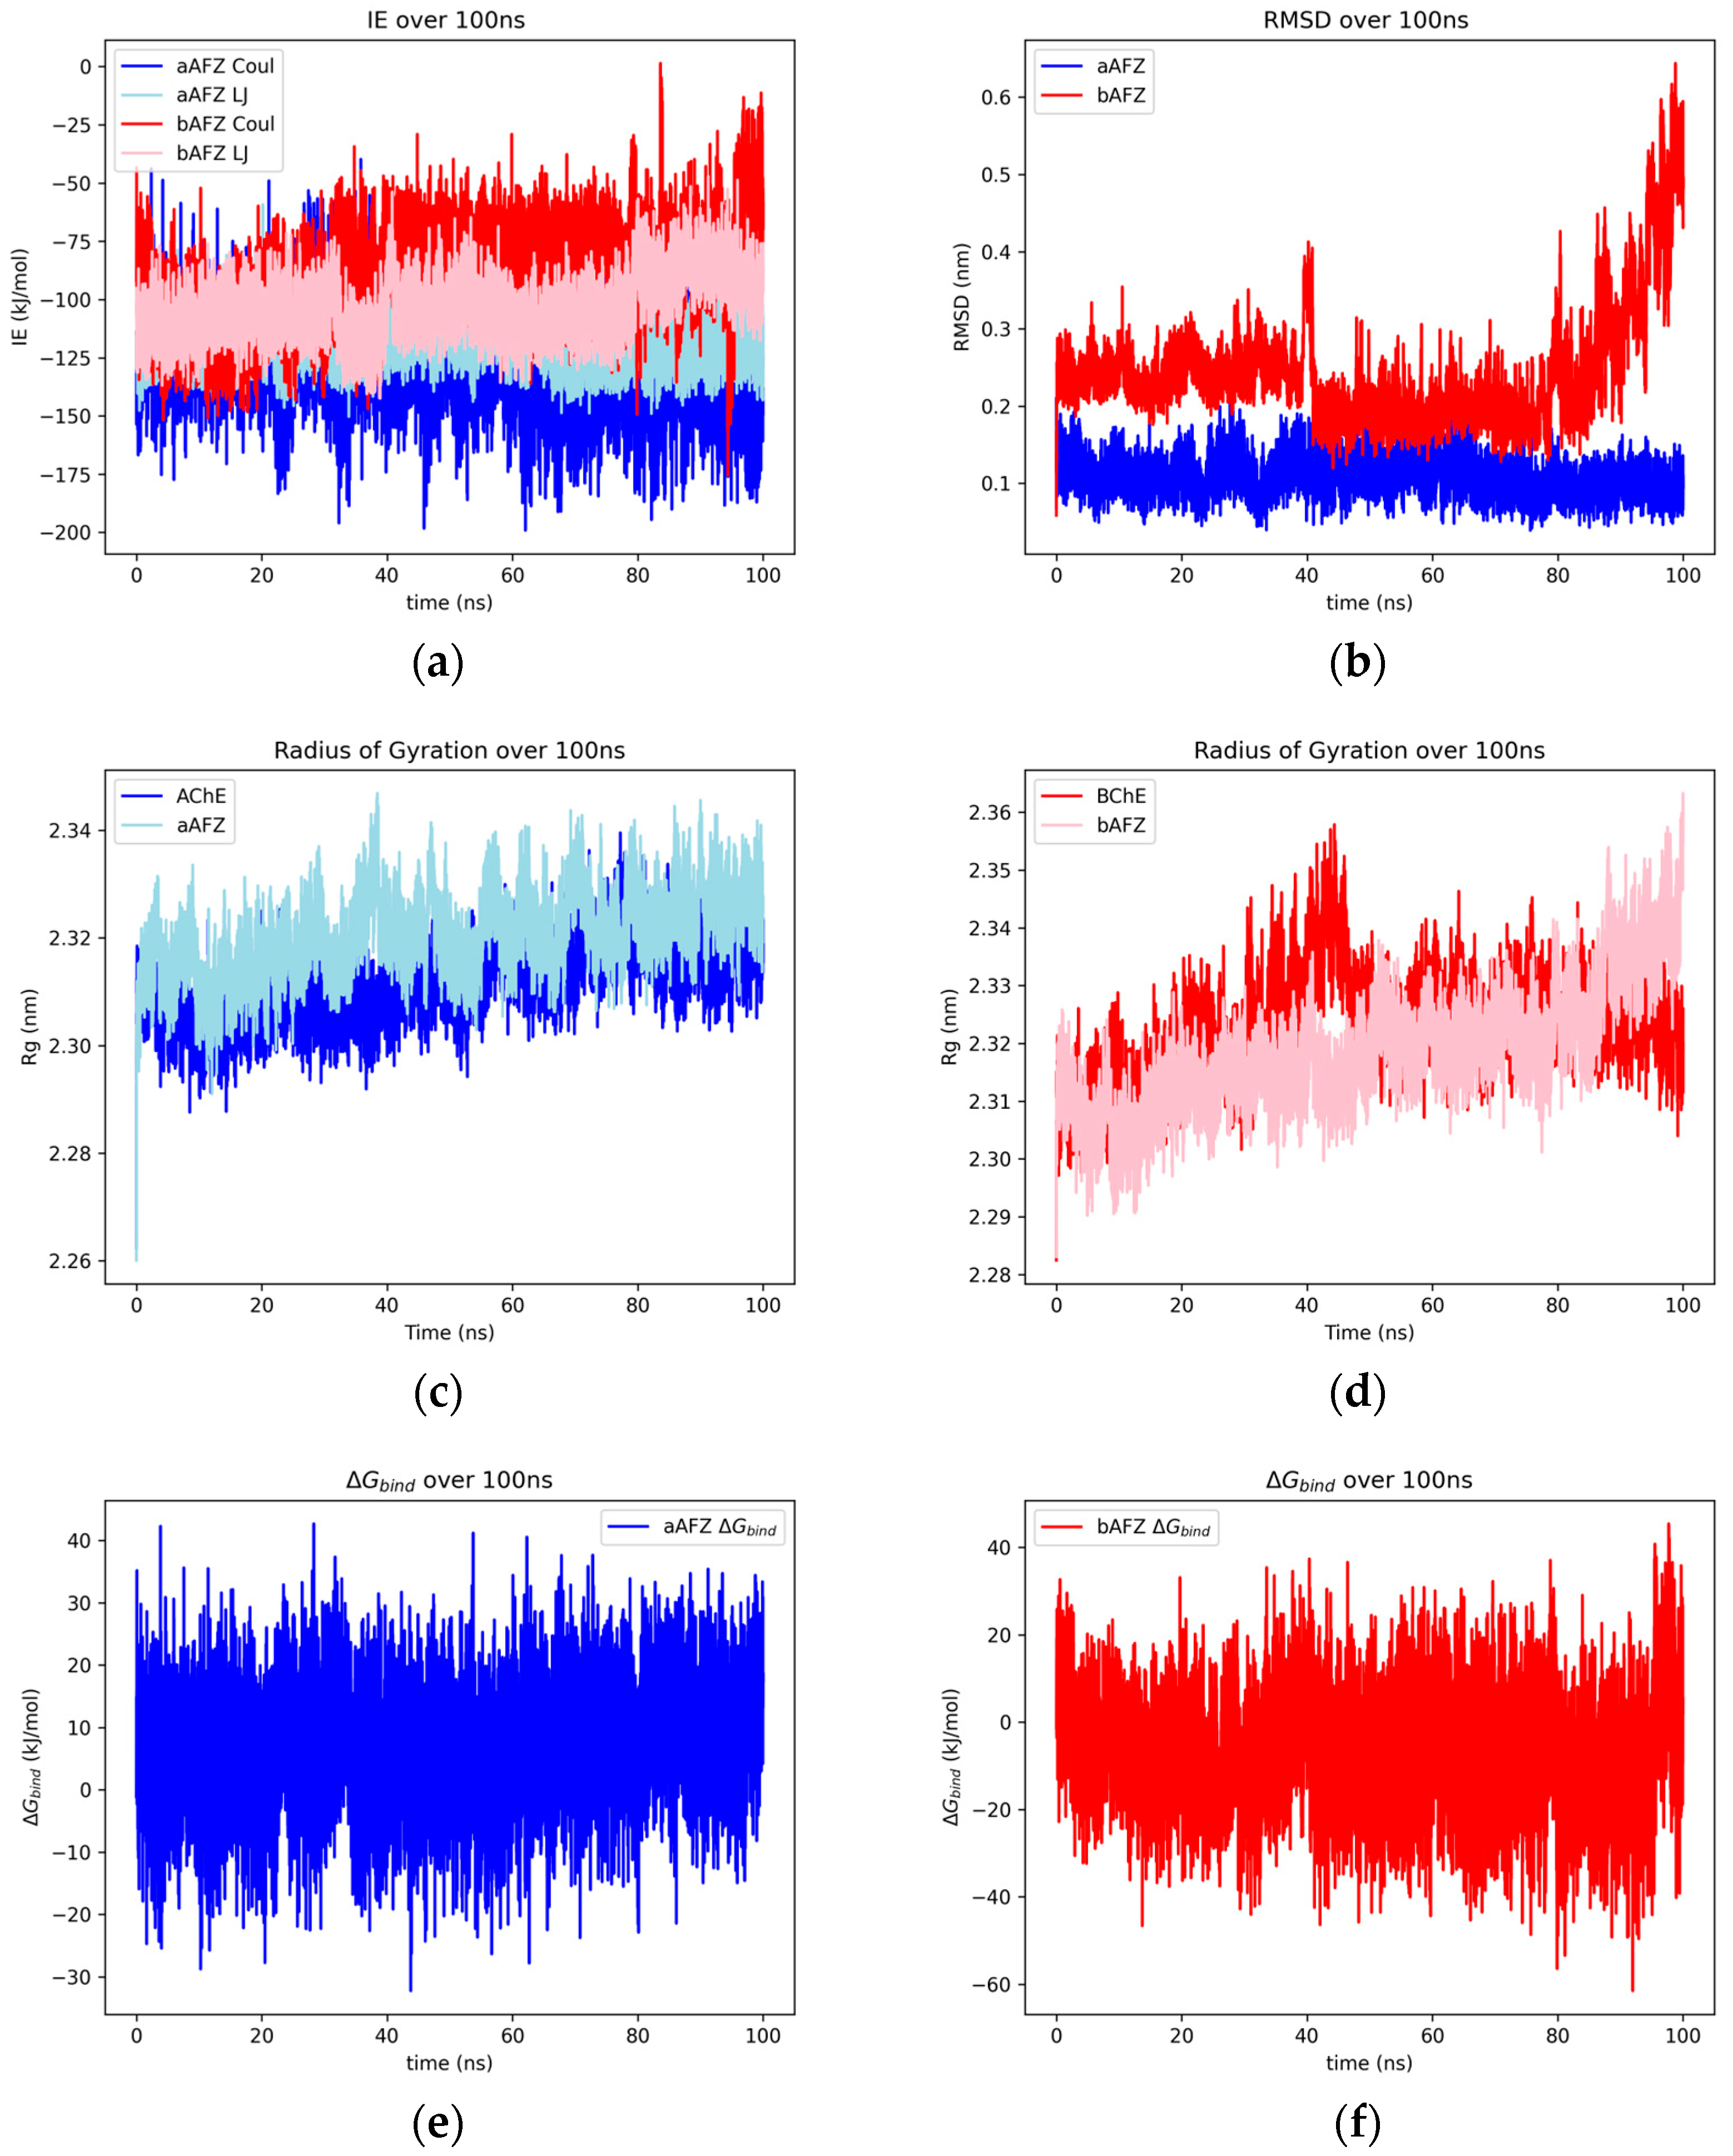
2.1.1. Afzelechin
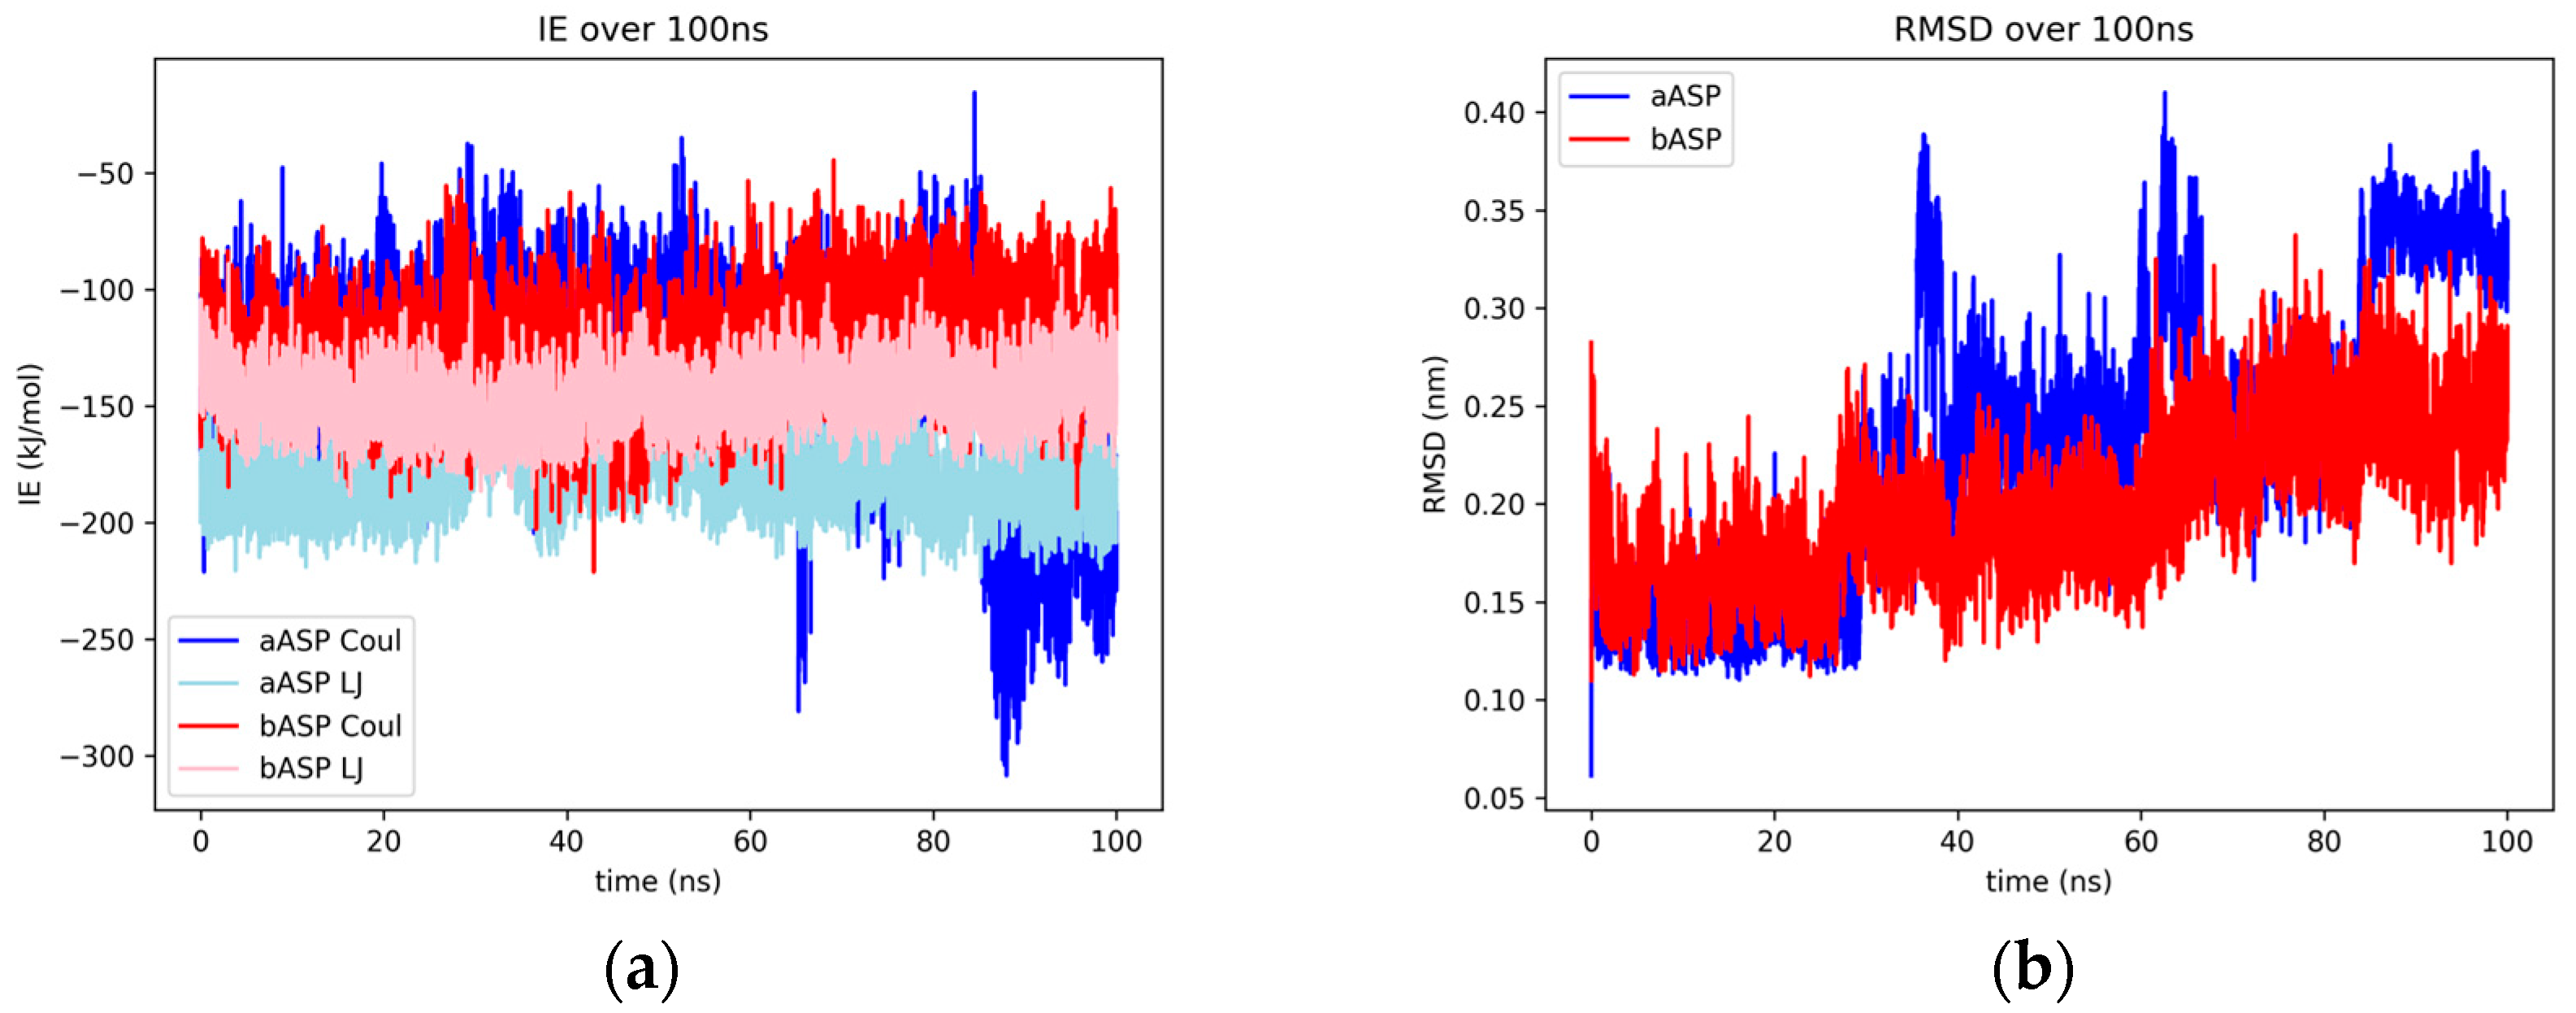
2.1.2. Aspalathin
2.1.3. D-Maslinic Acid
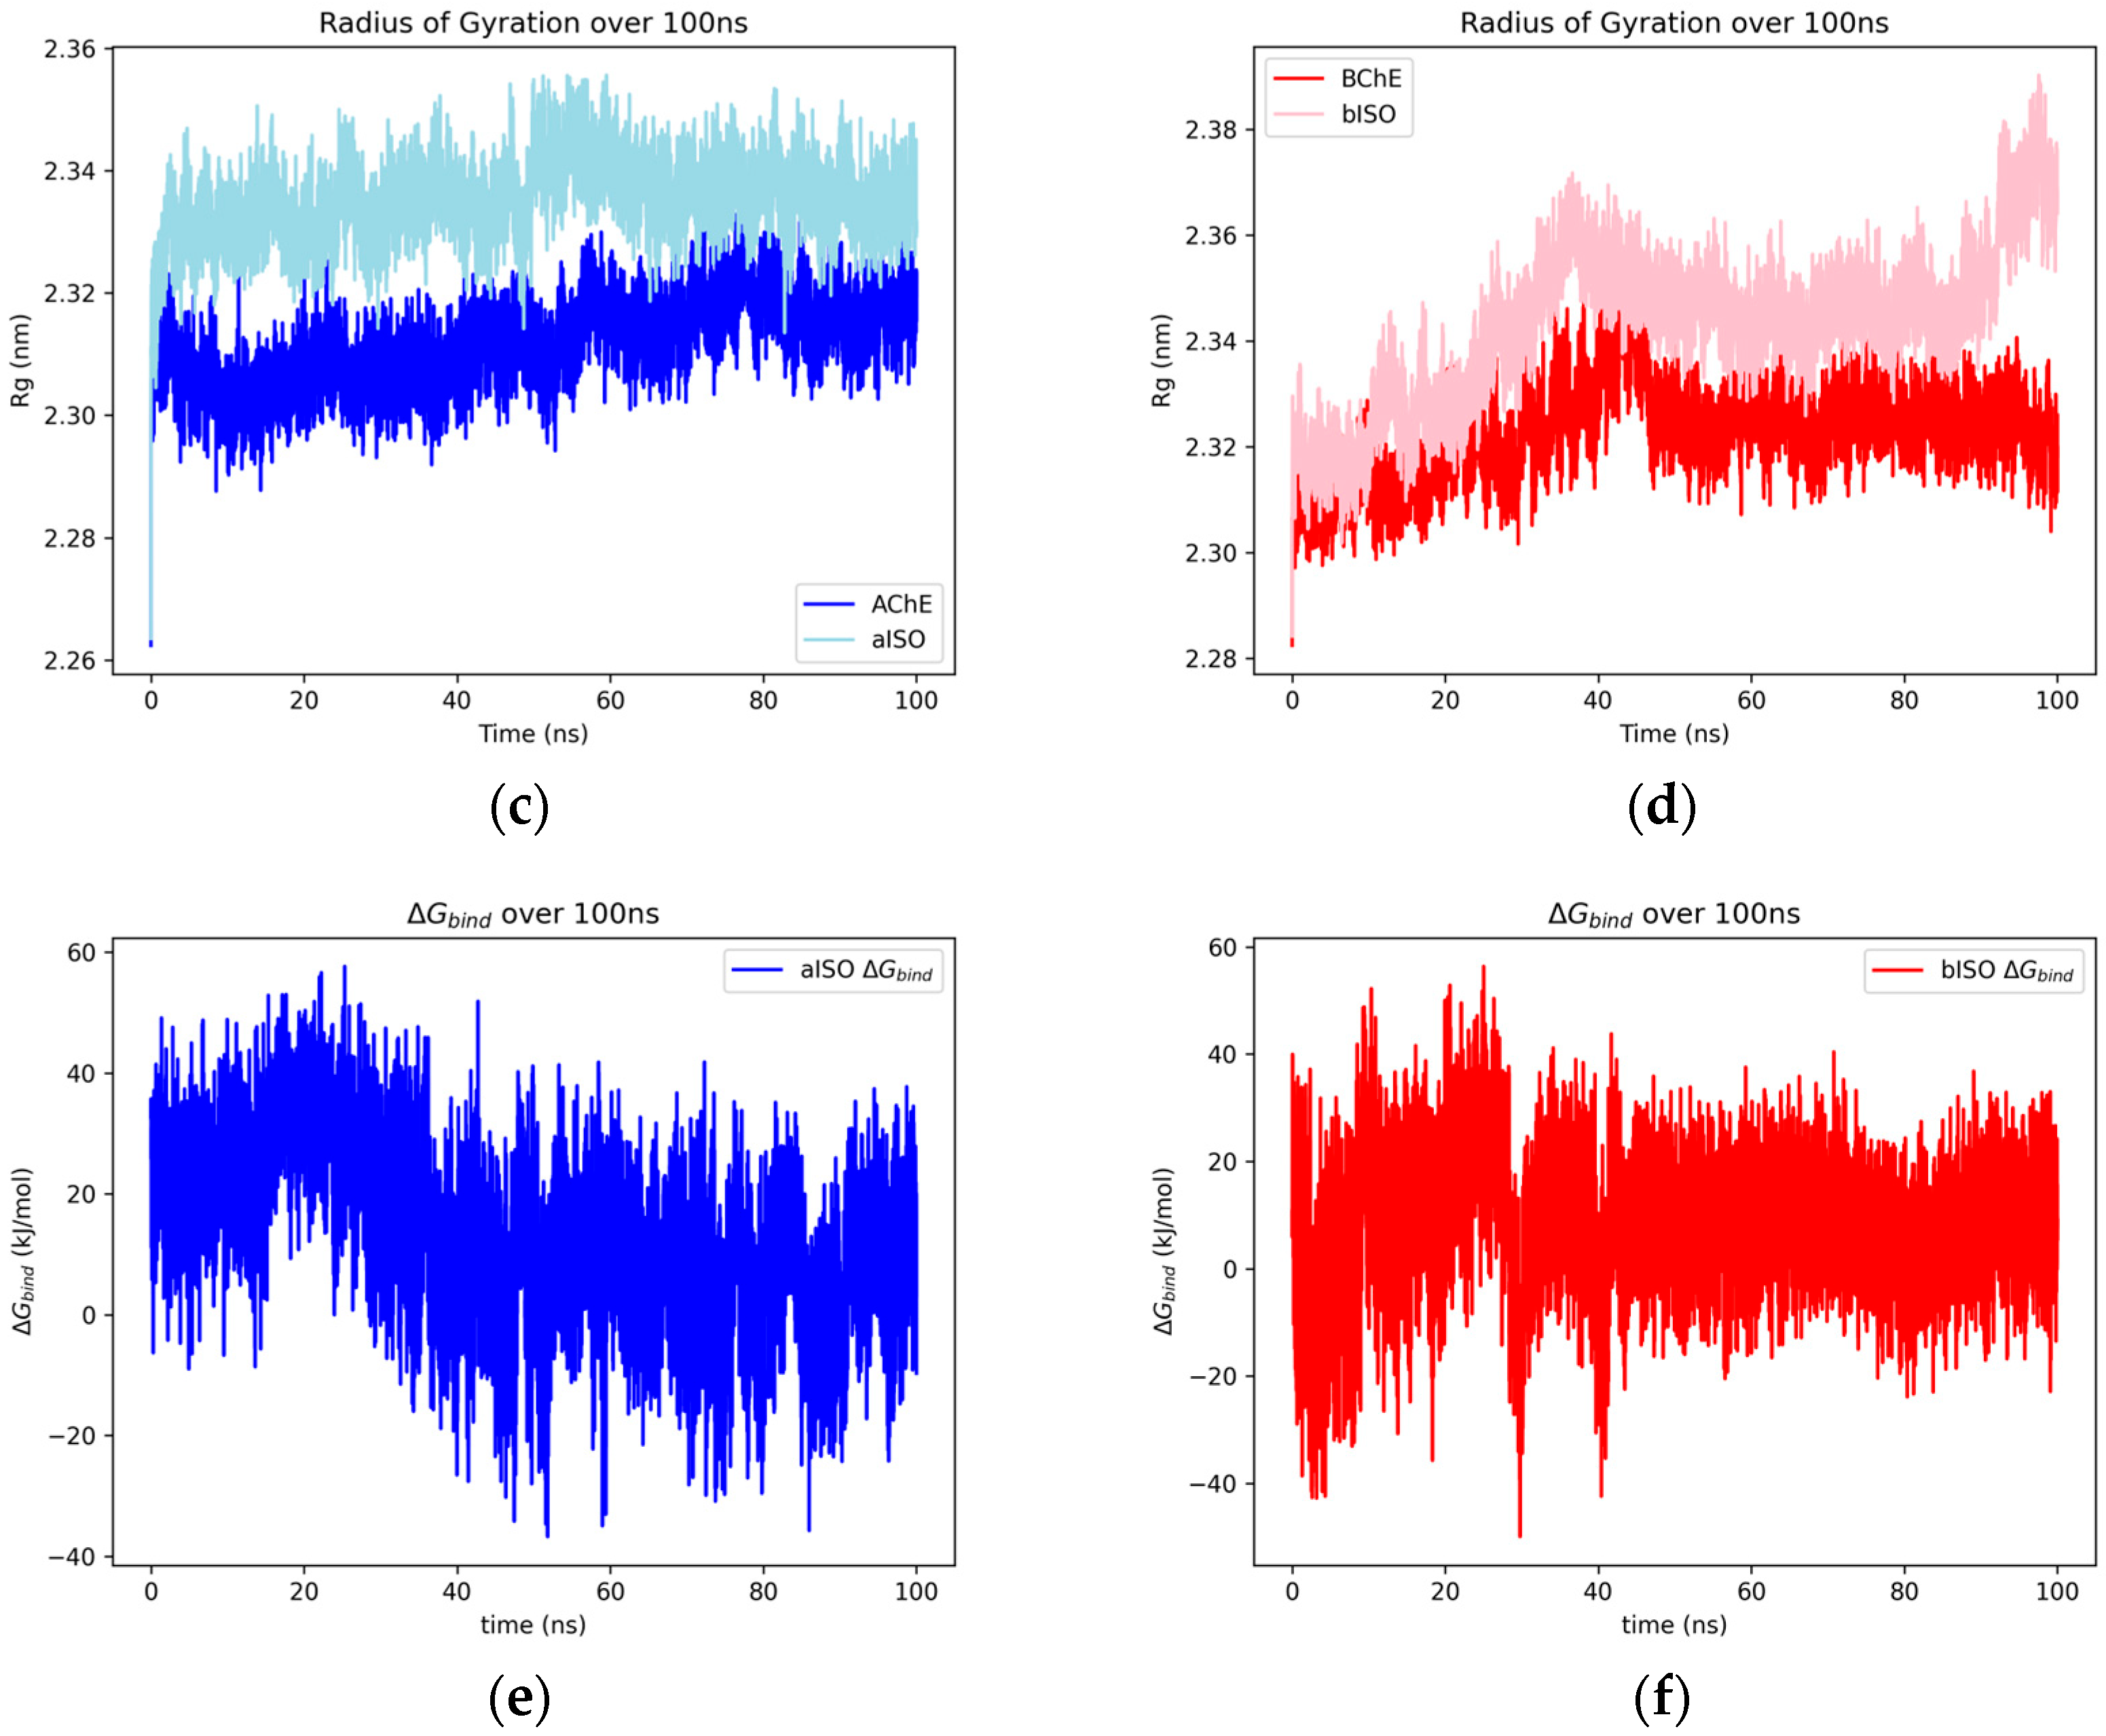
2.1.4. Isoliensinine
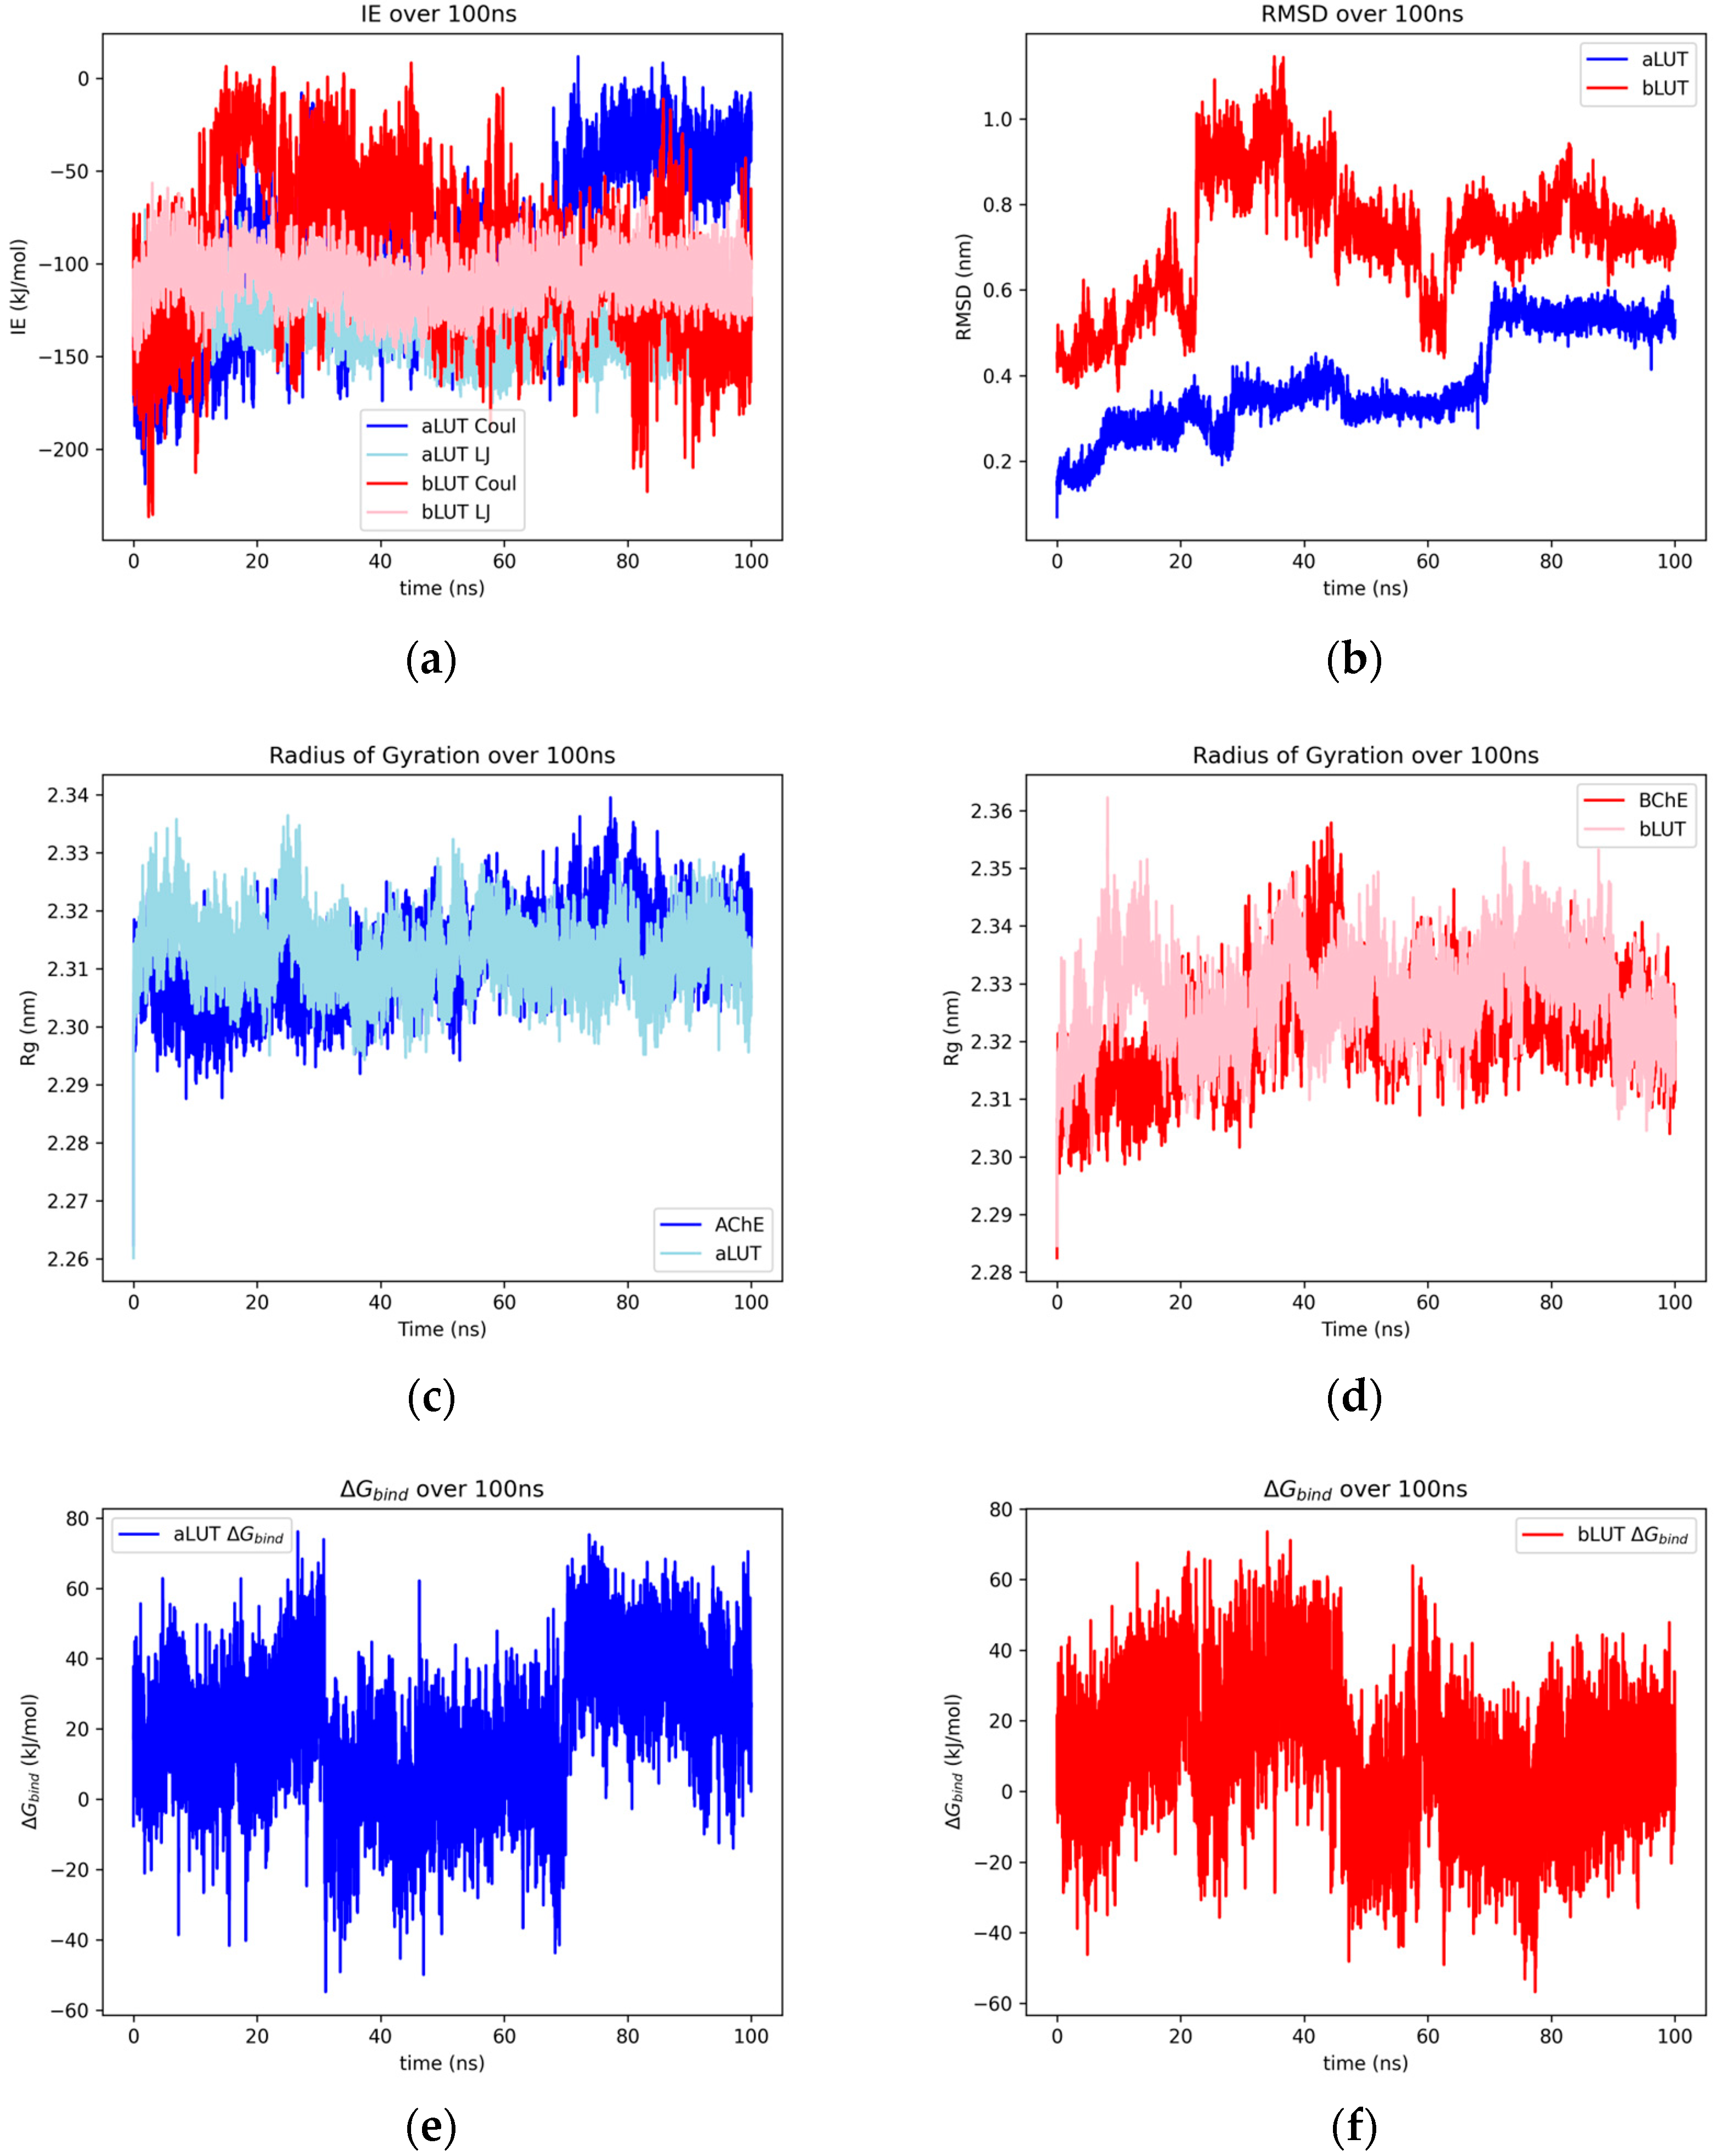
2.1.5. Luteolin
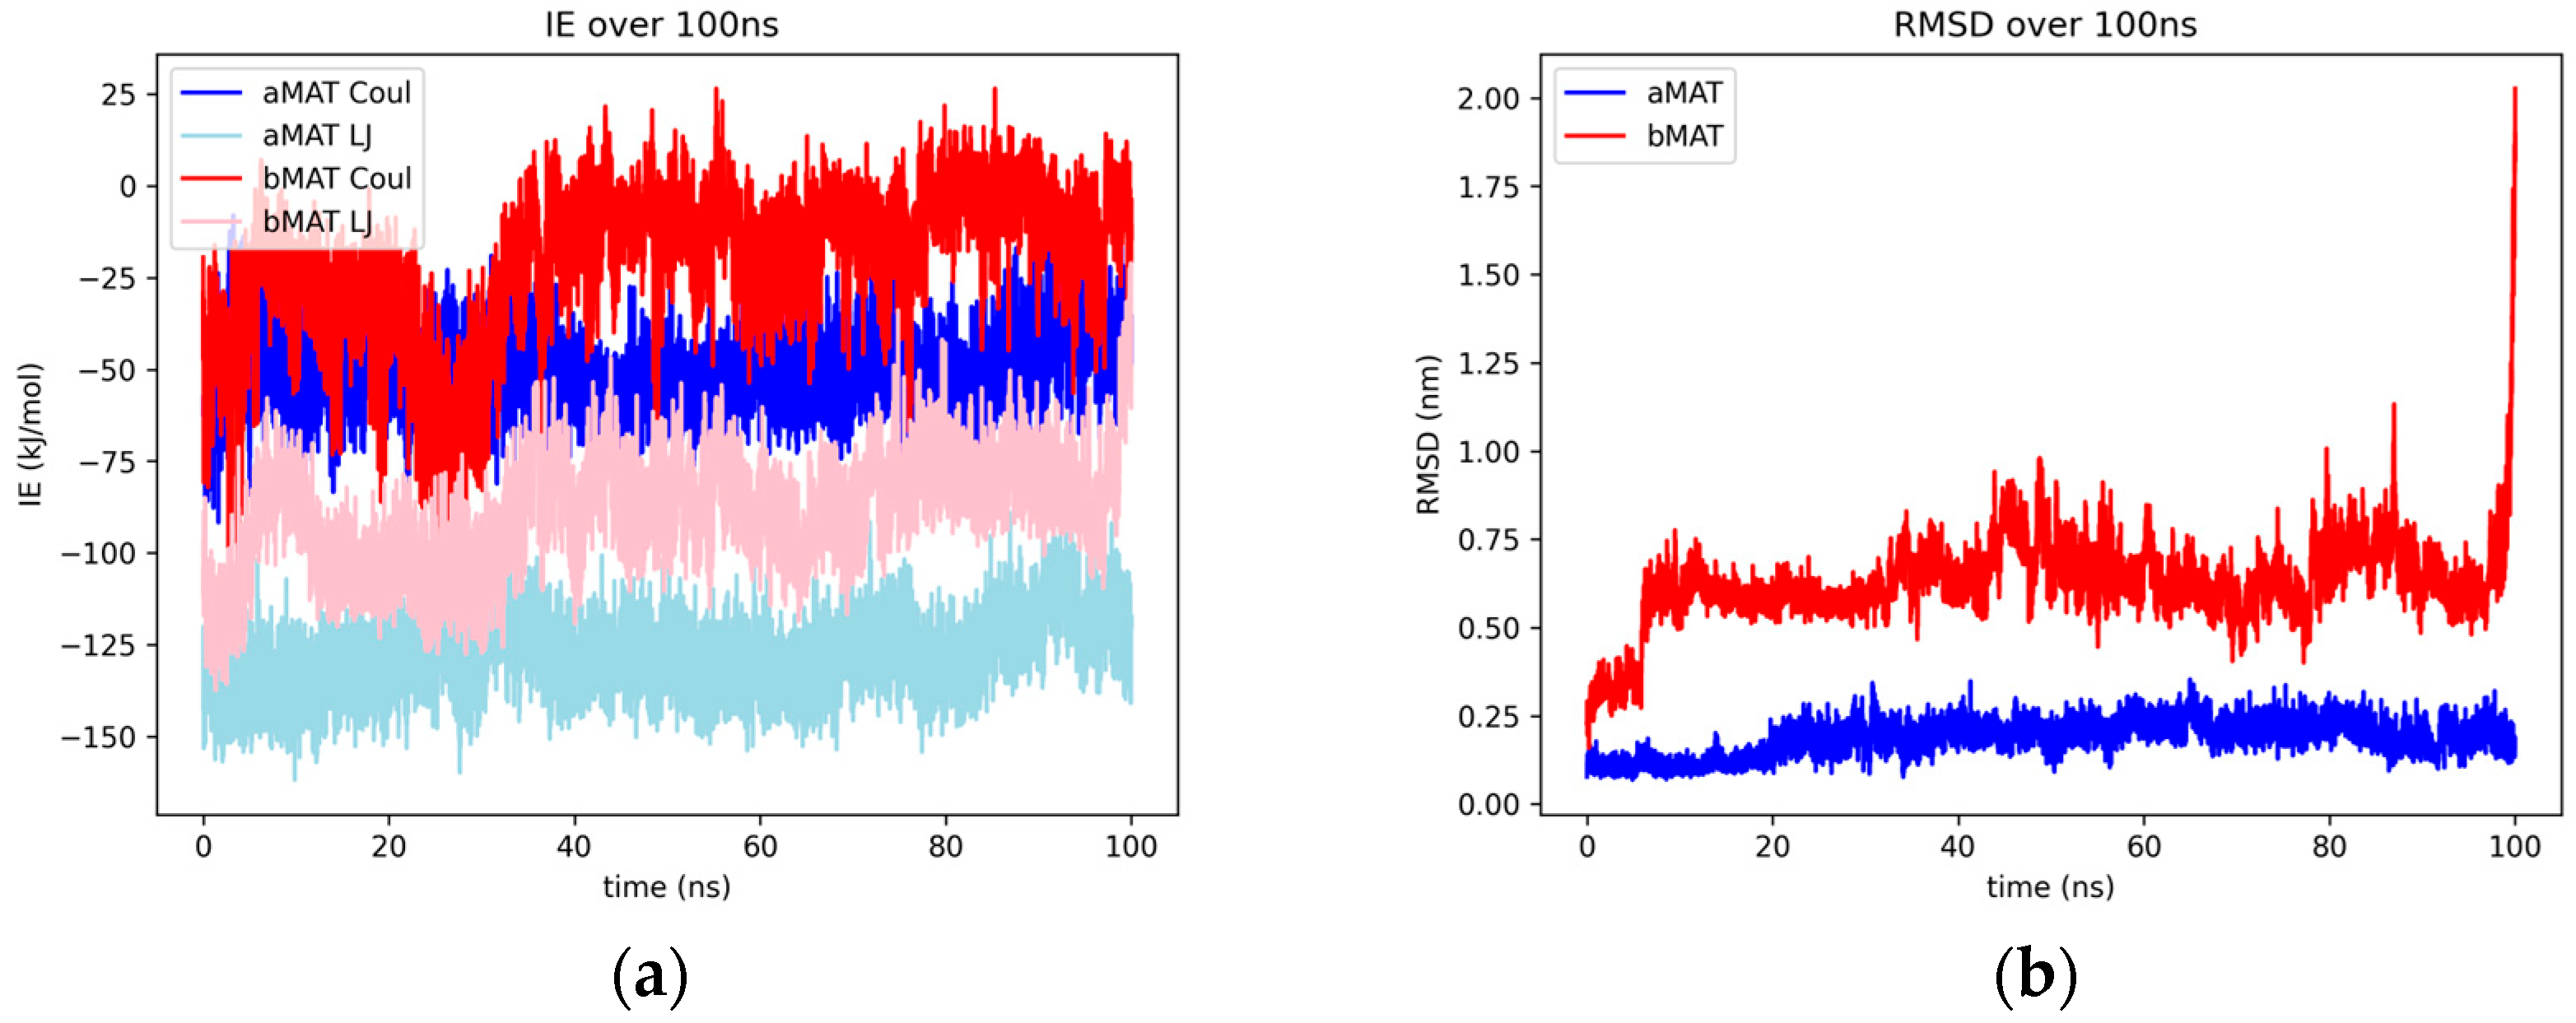
2.1.6. Matricin
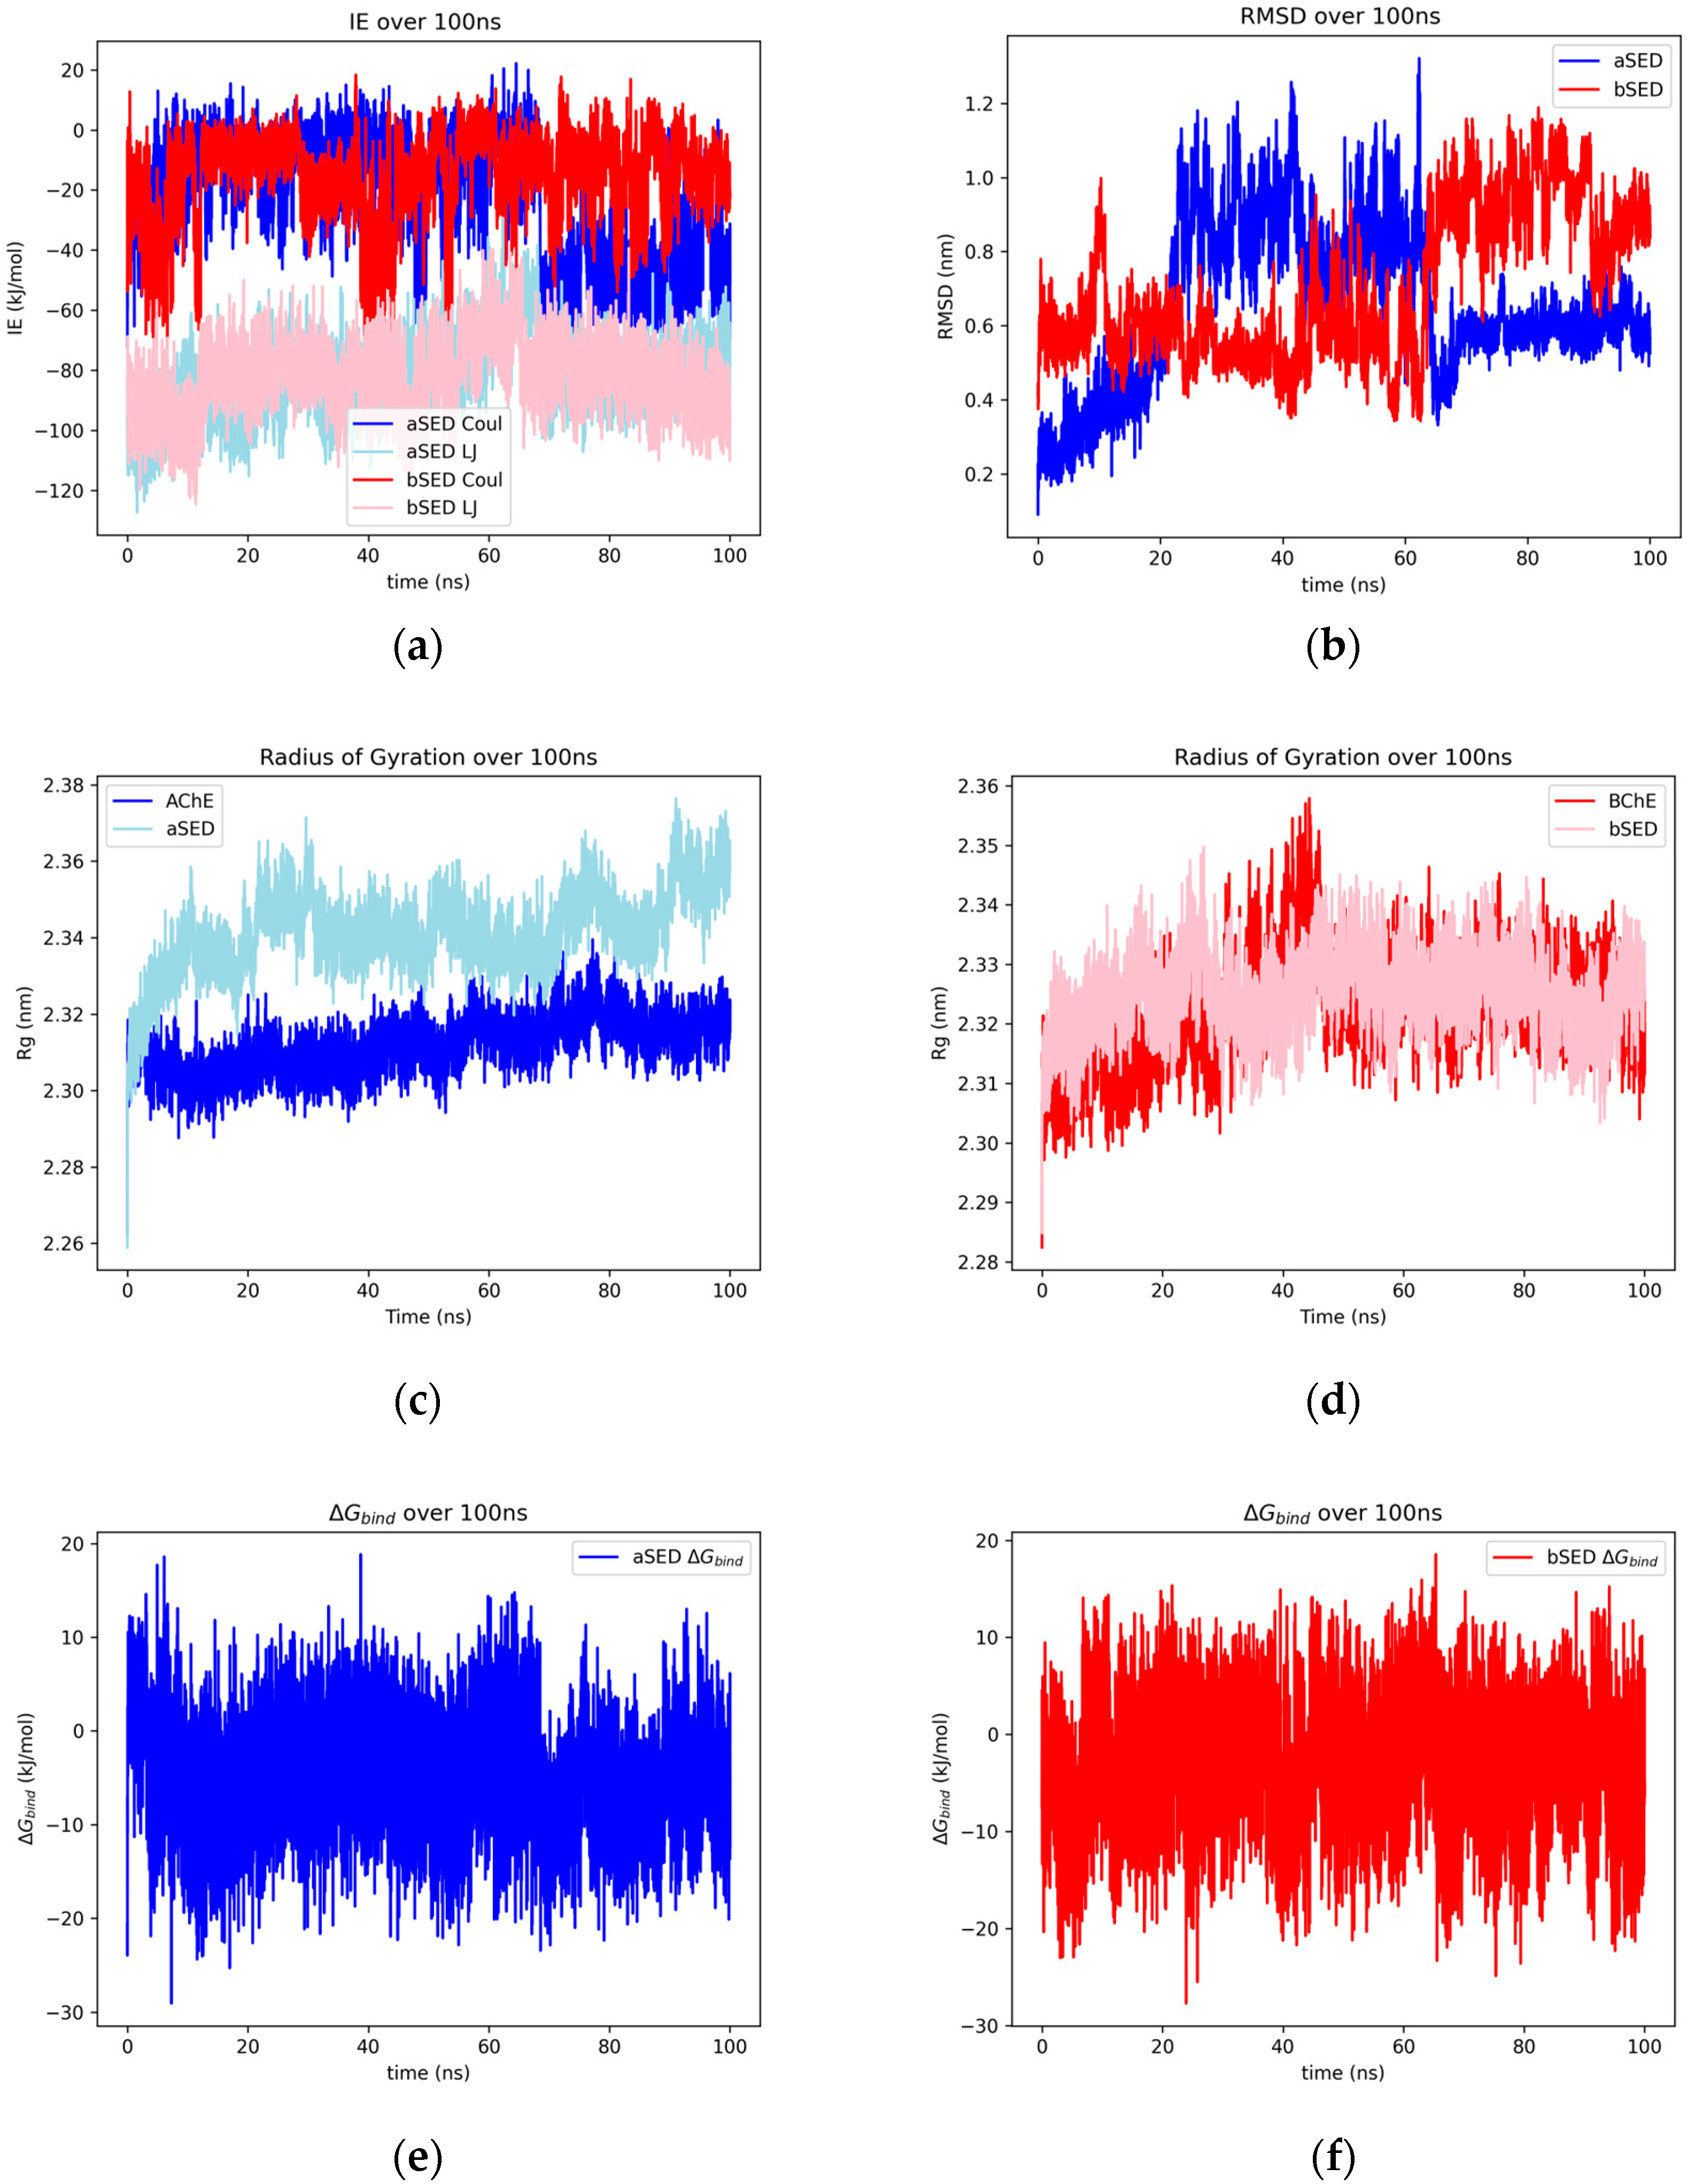
2.1.7. Sedanolide
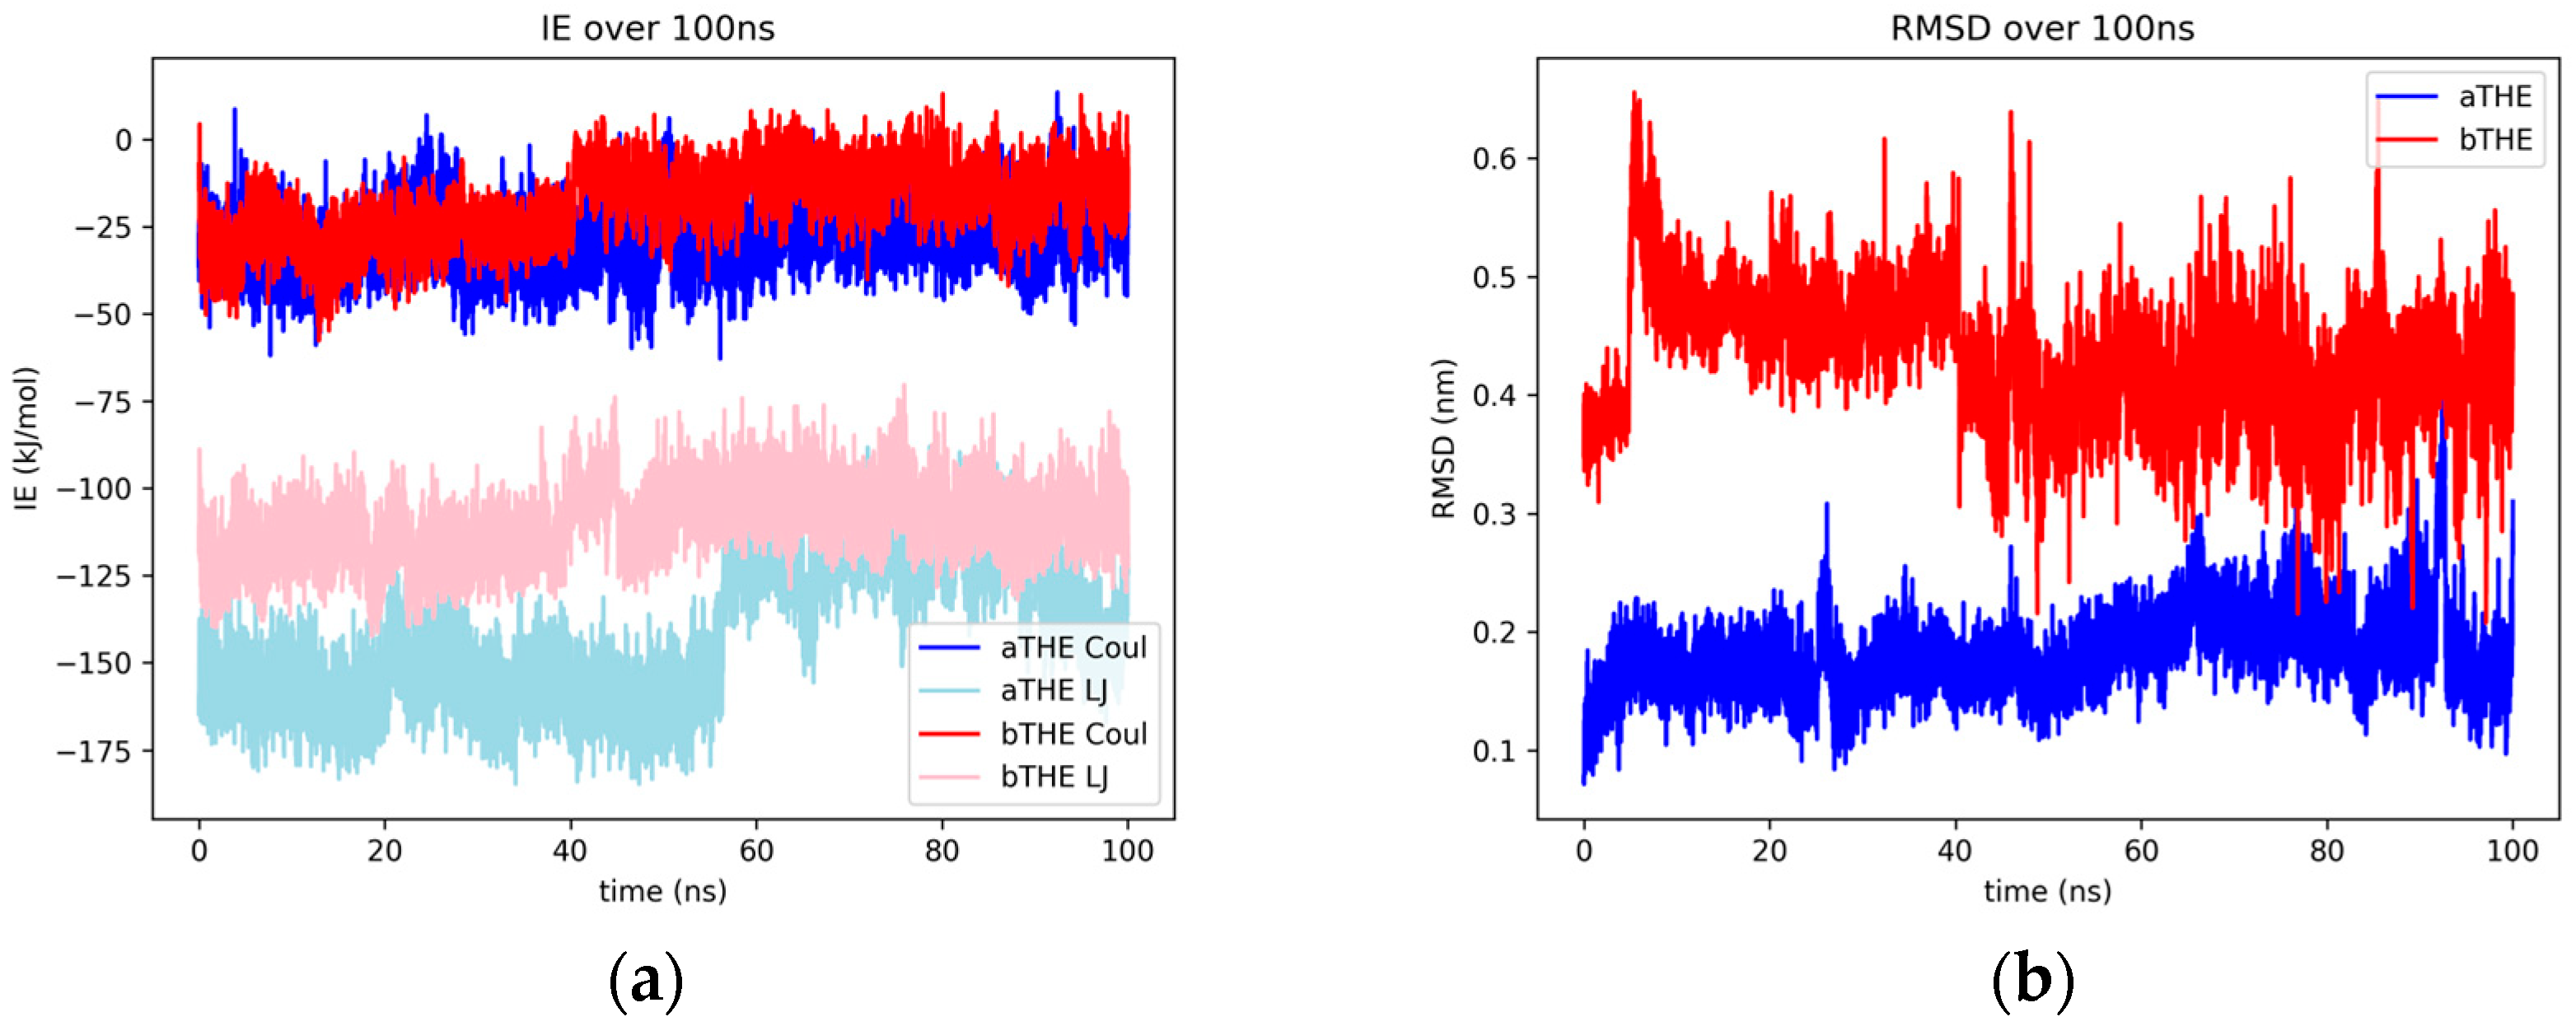
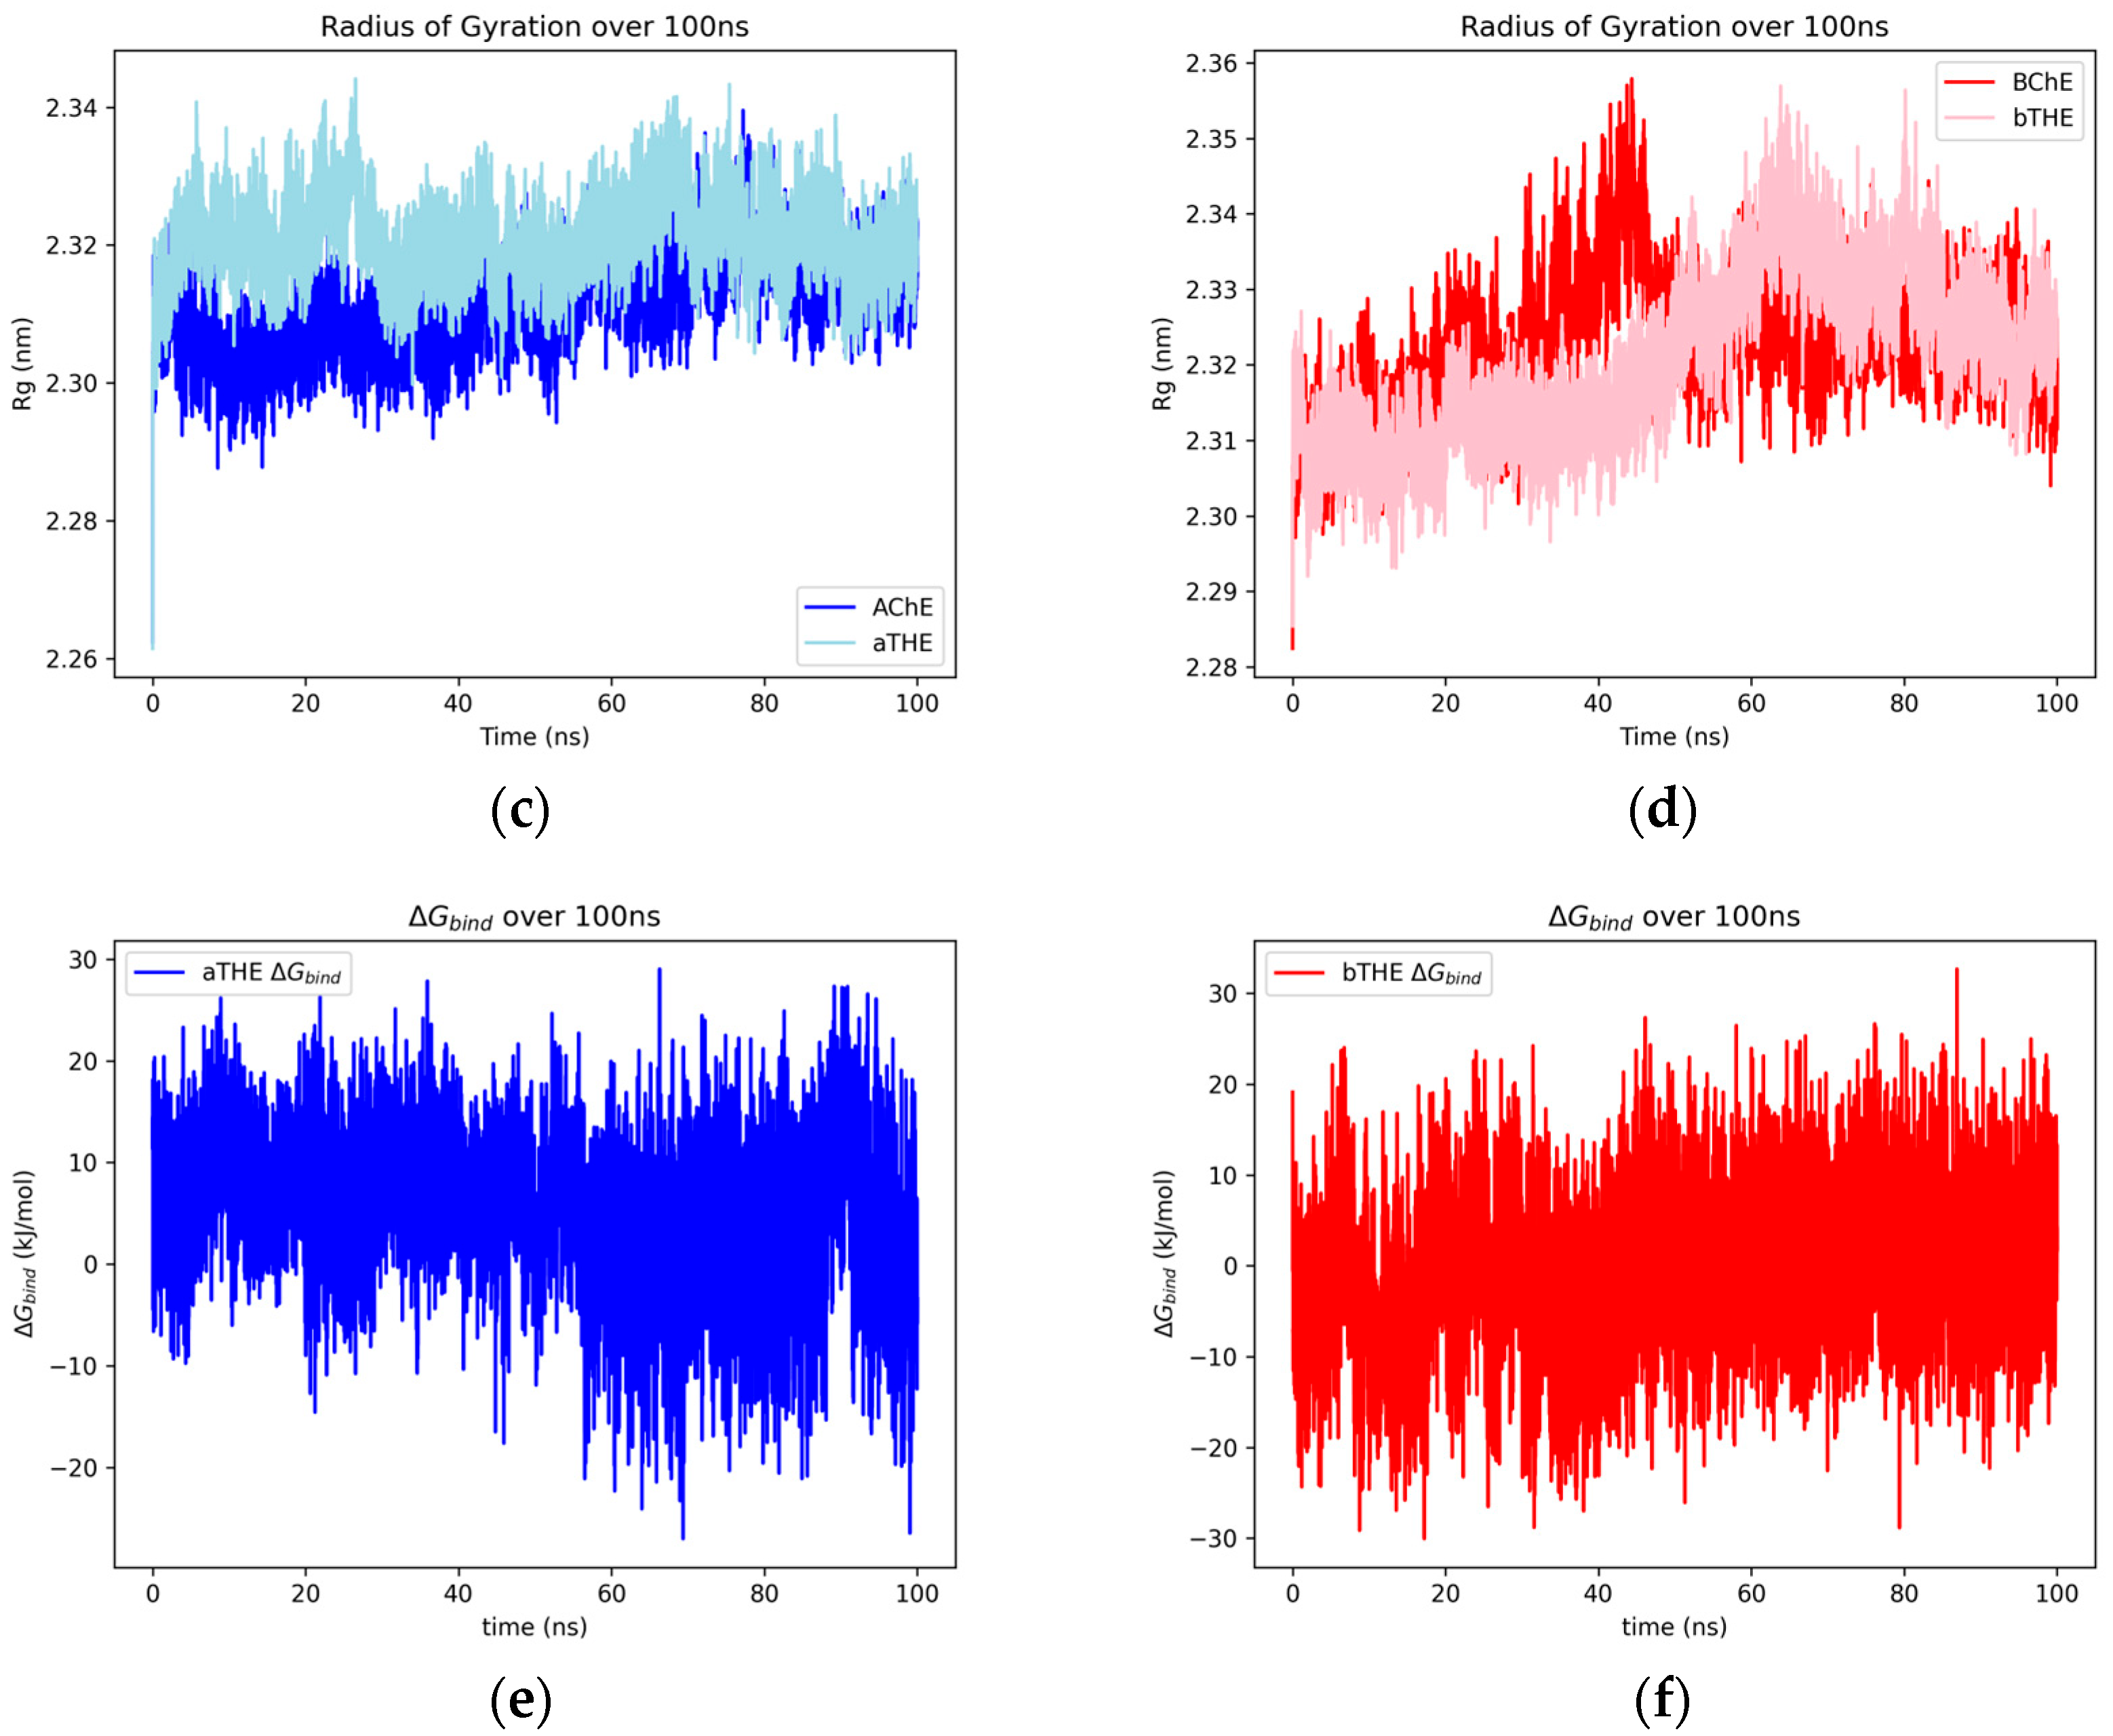
2.1.8. Thebaine
2.2. Binding Modes and RMSF Results
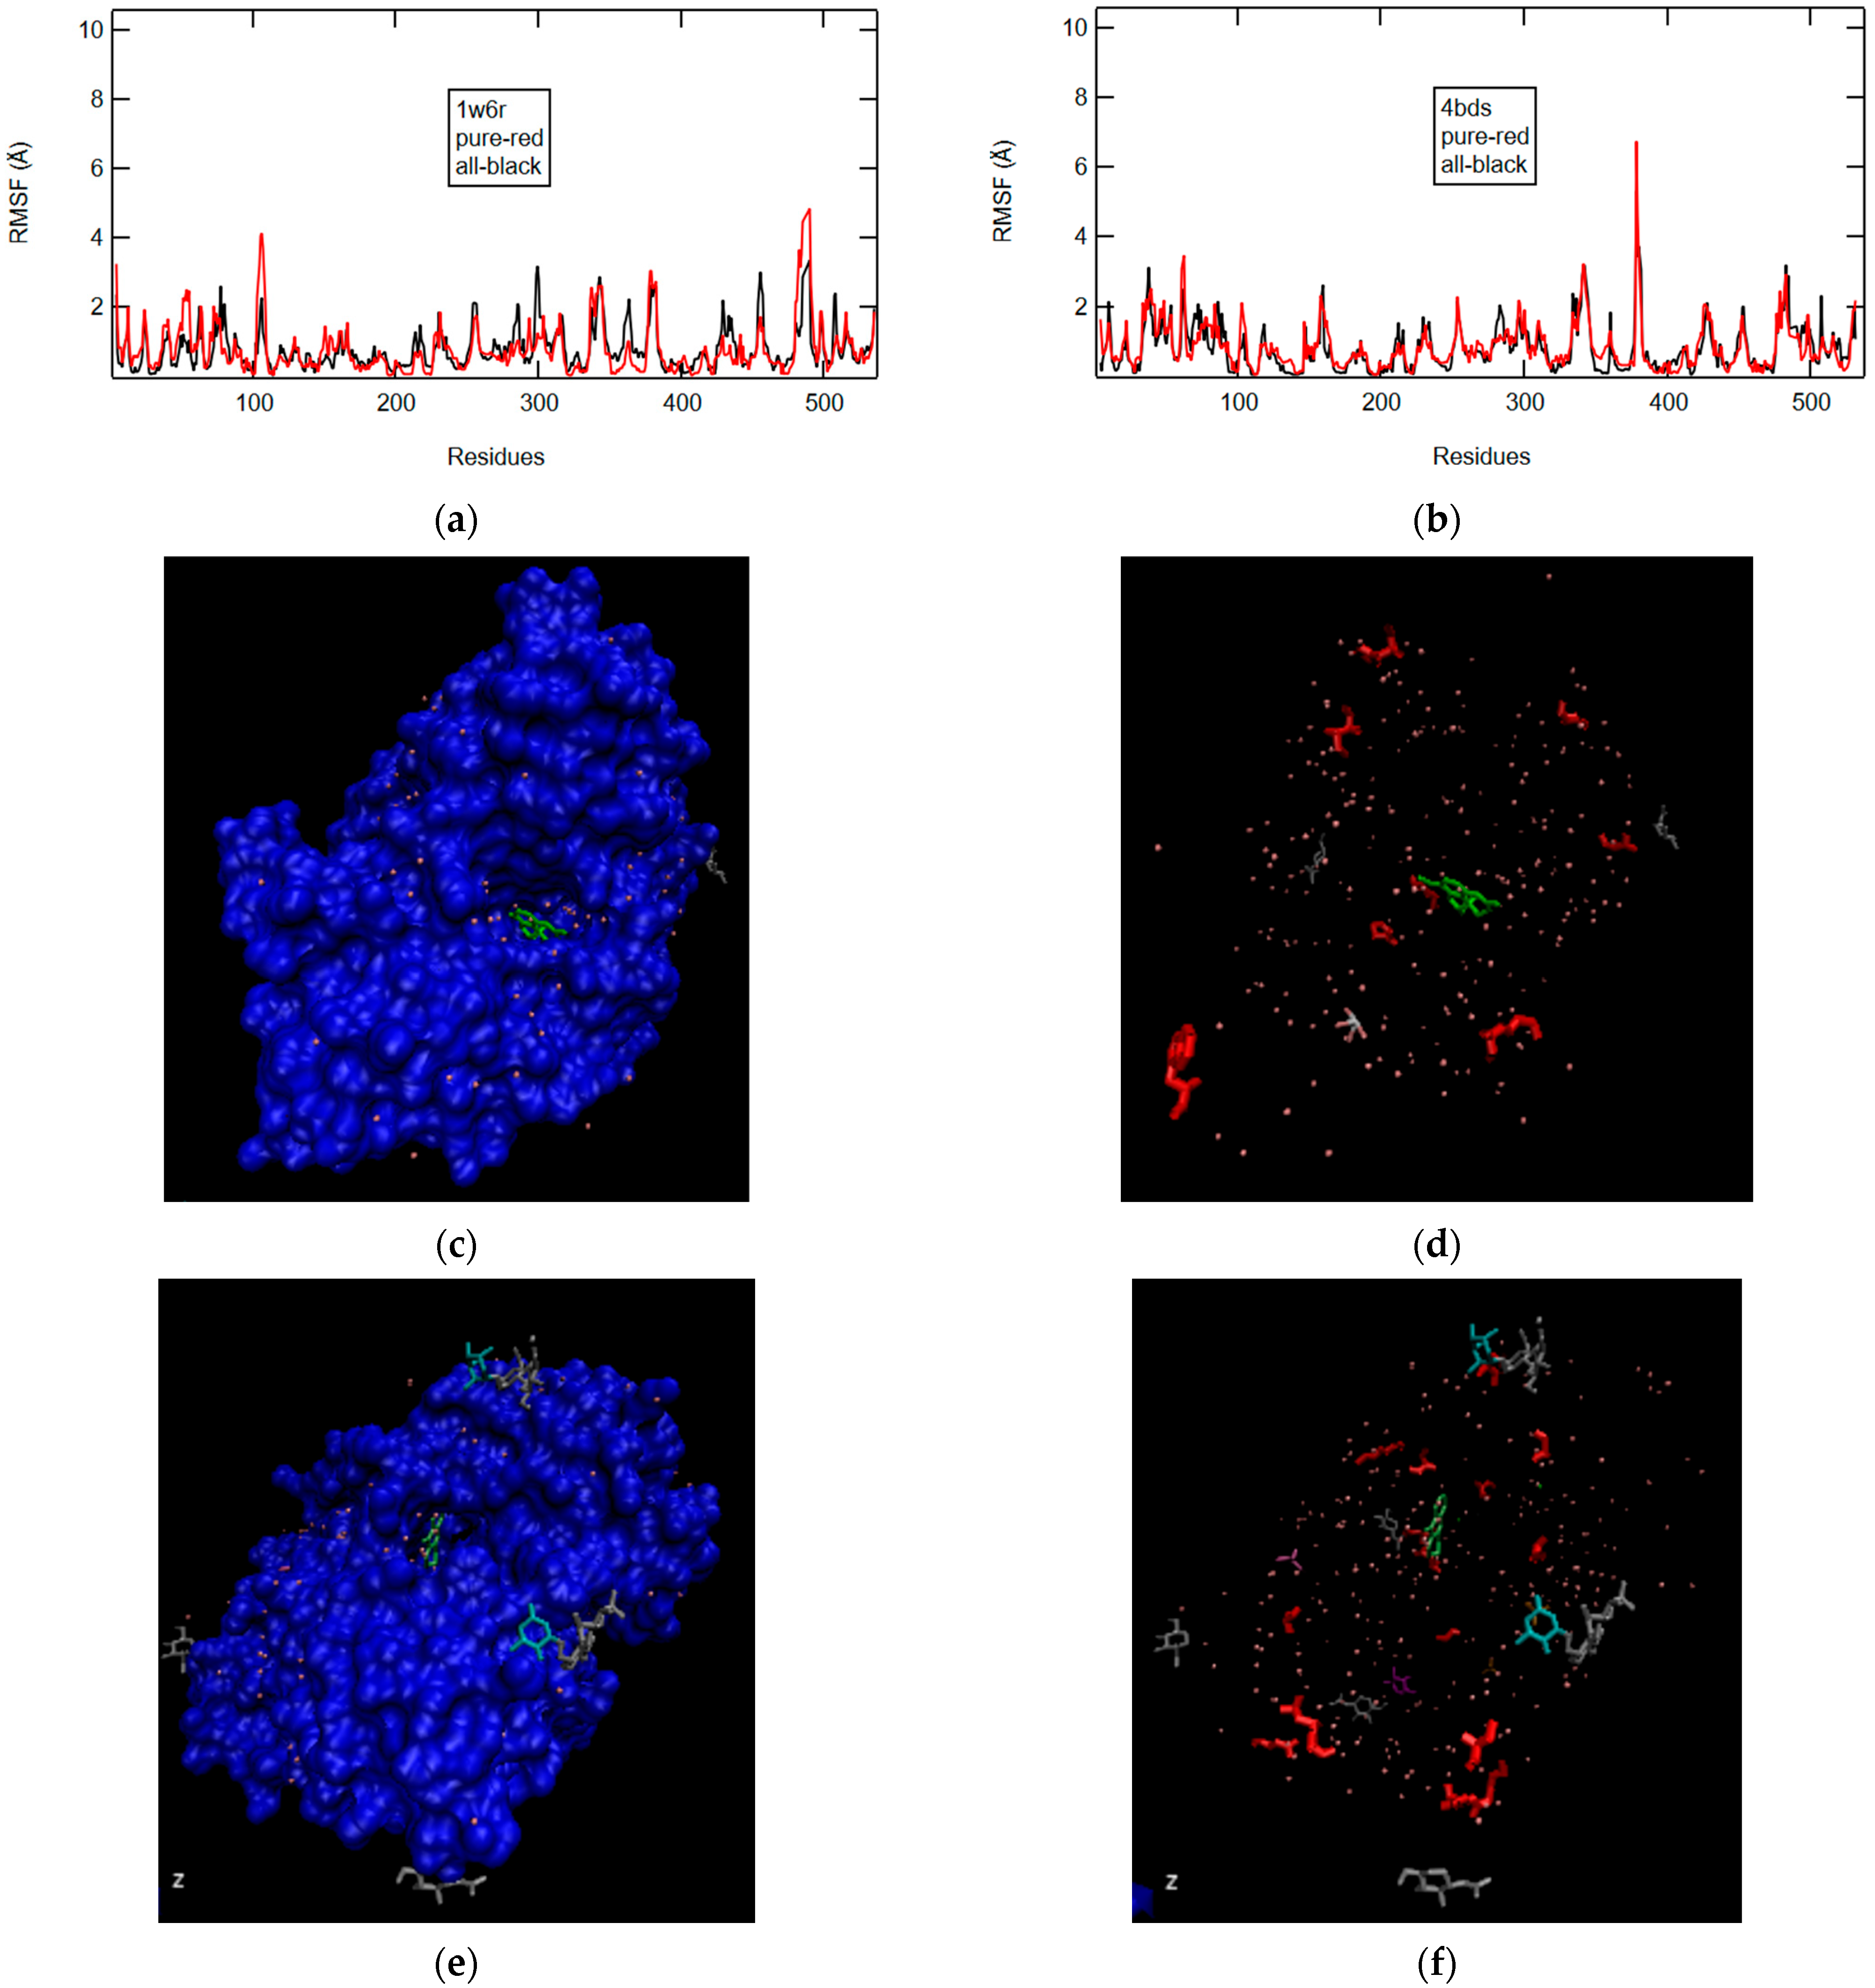
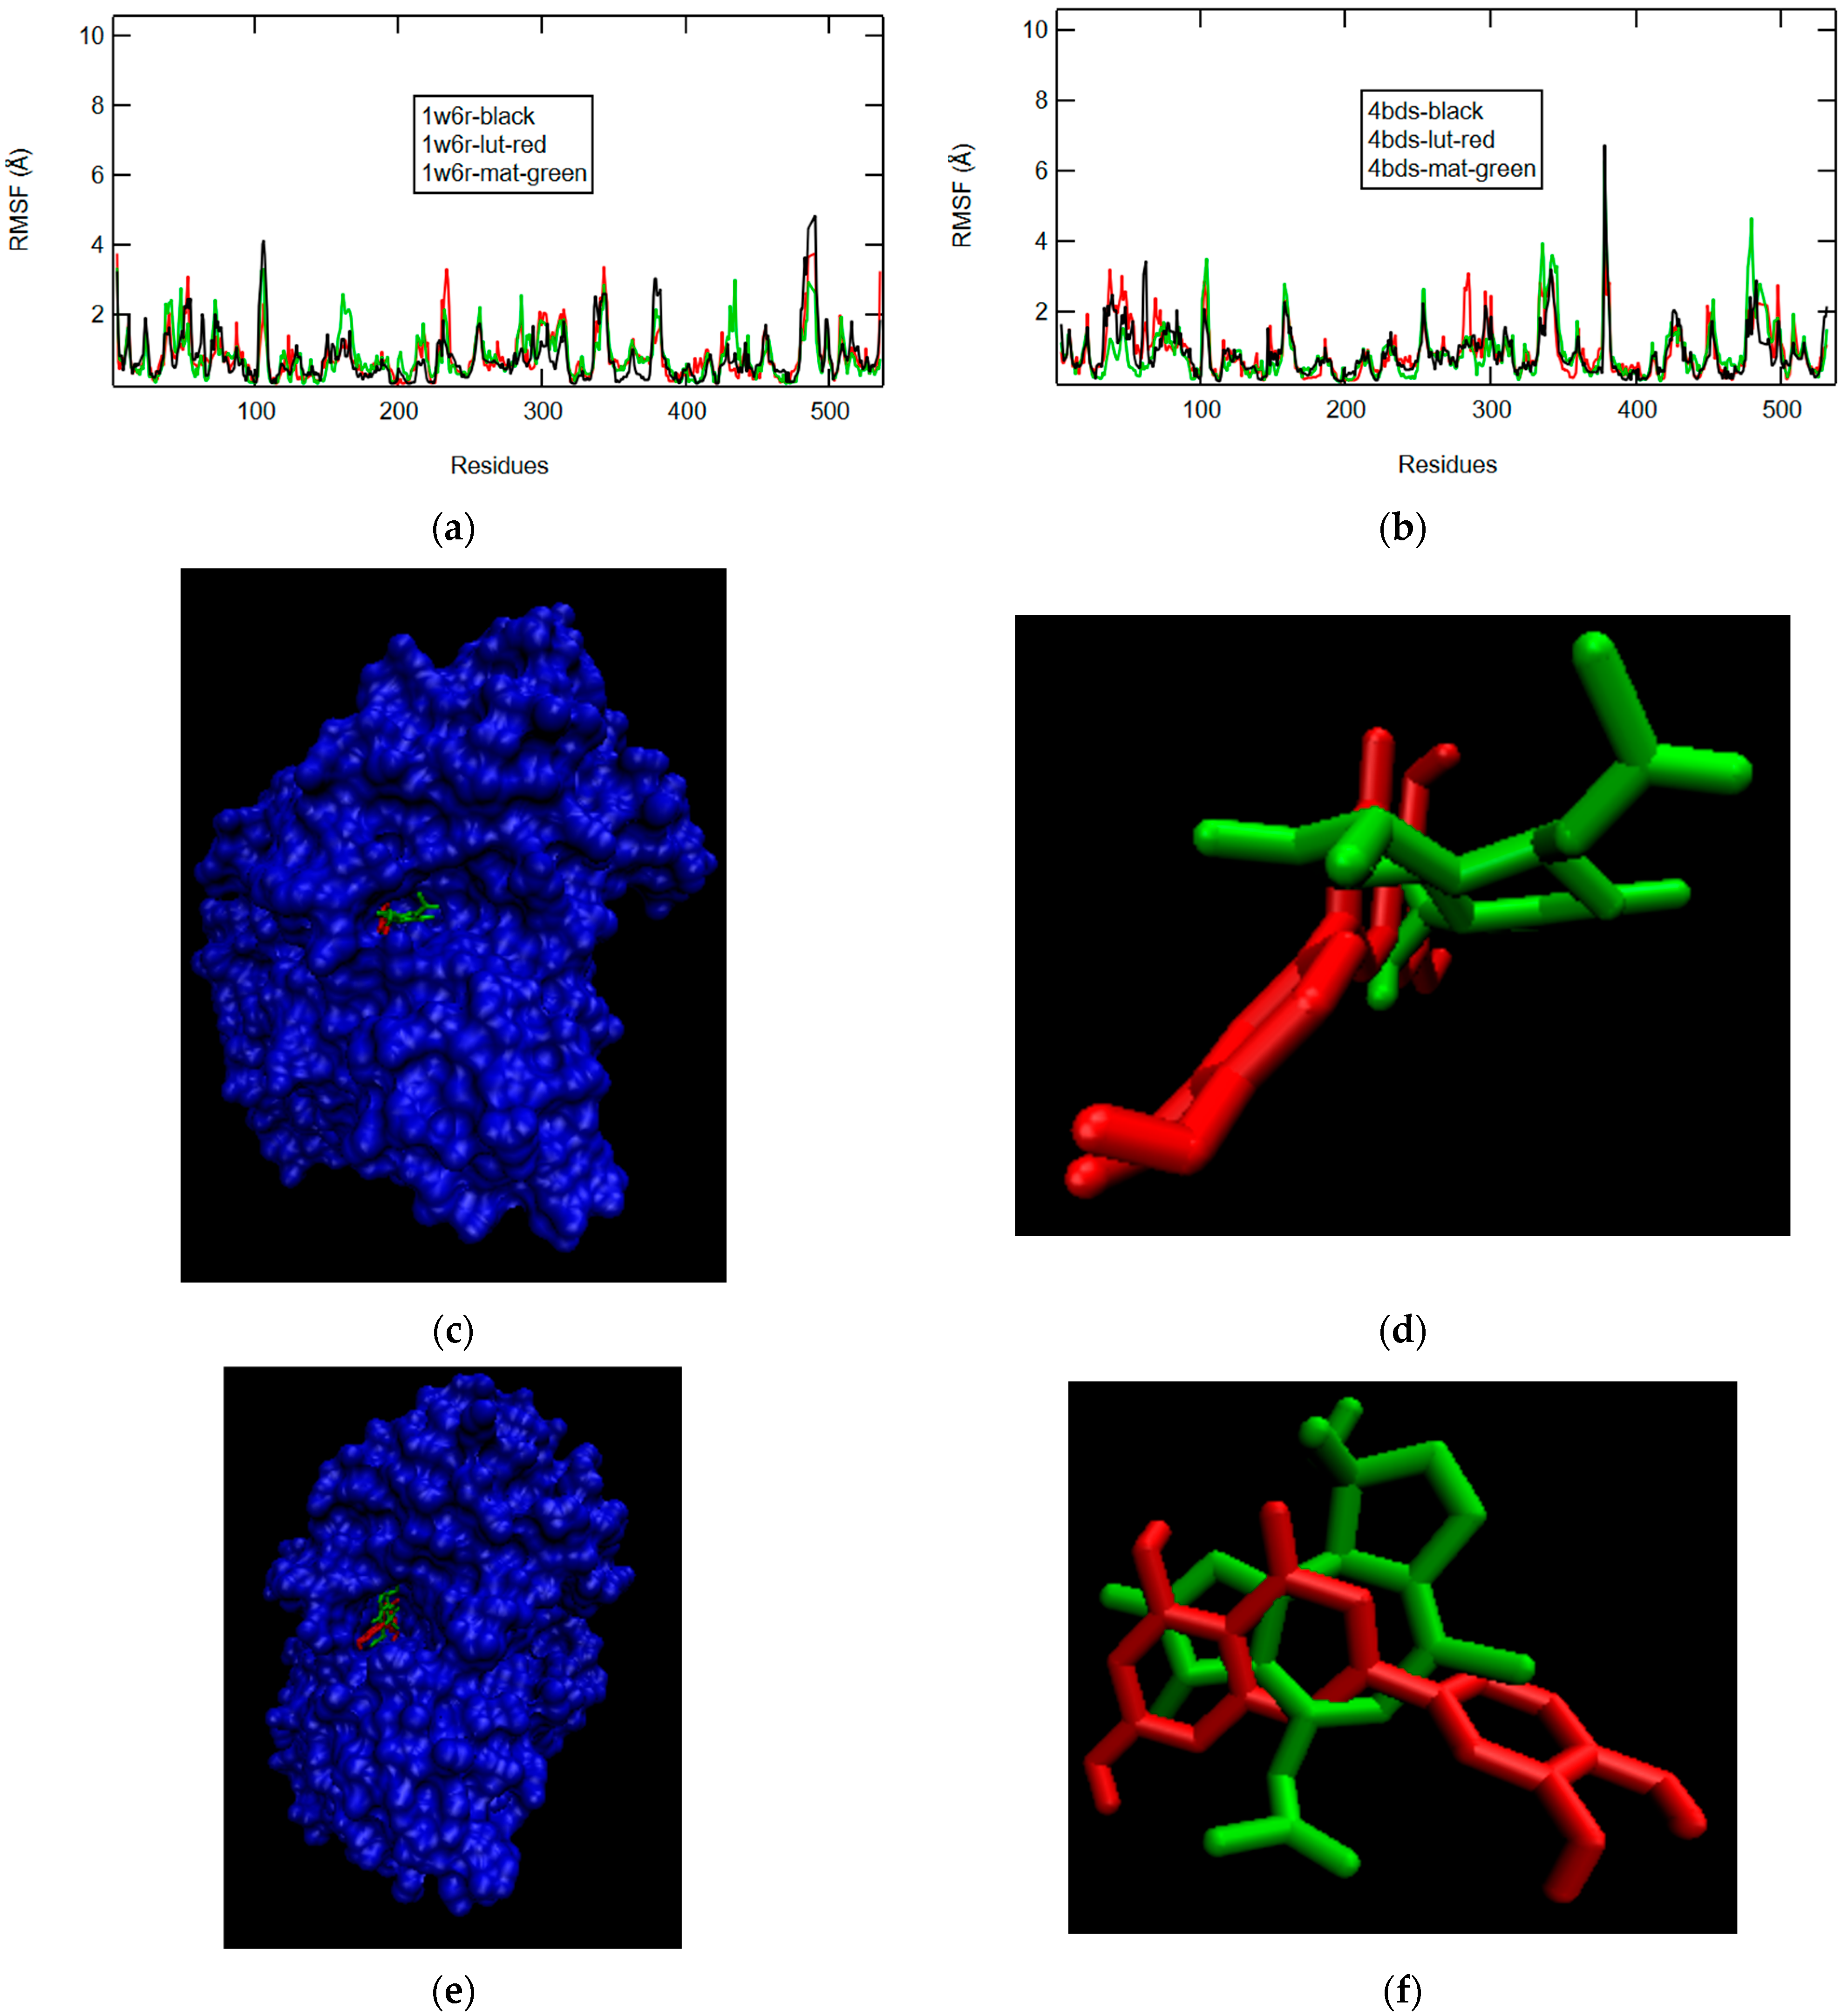
2.2.1. W6R and 4BDS in Pure and Crystal State
2.2.2. Afzelechin and Aspalathin
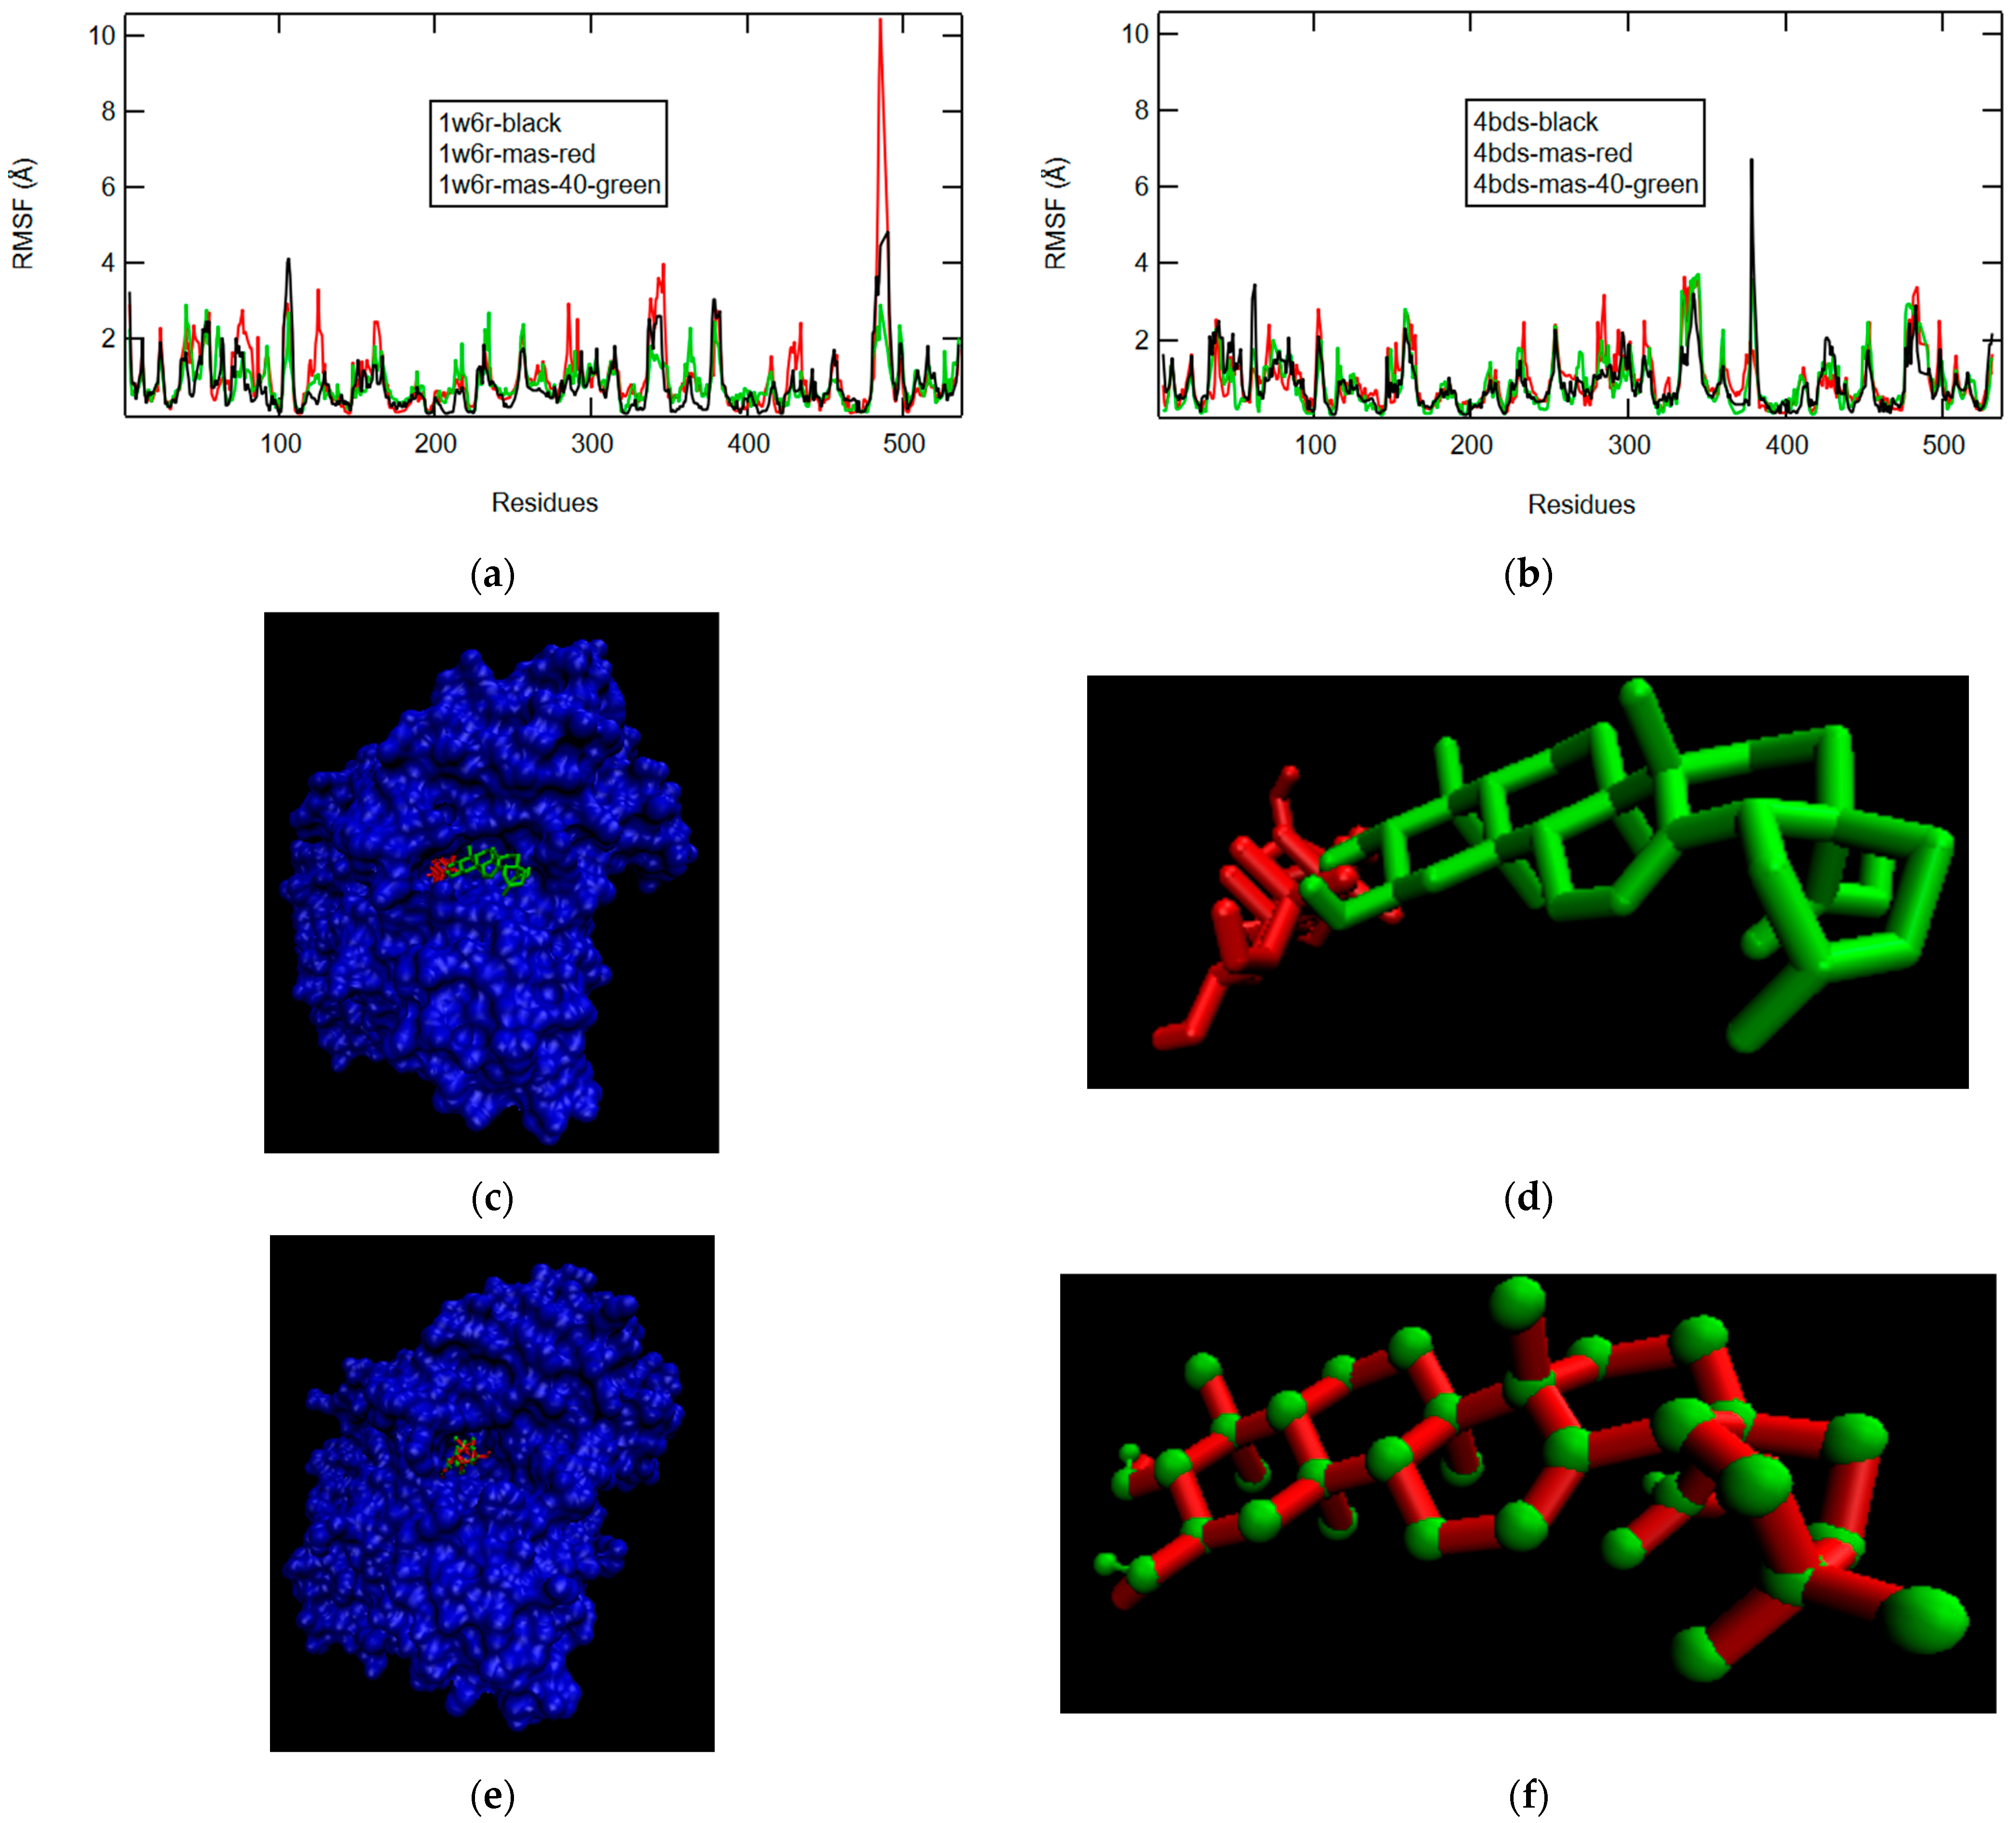
2.2.3. D-Maslinic Acid
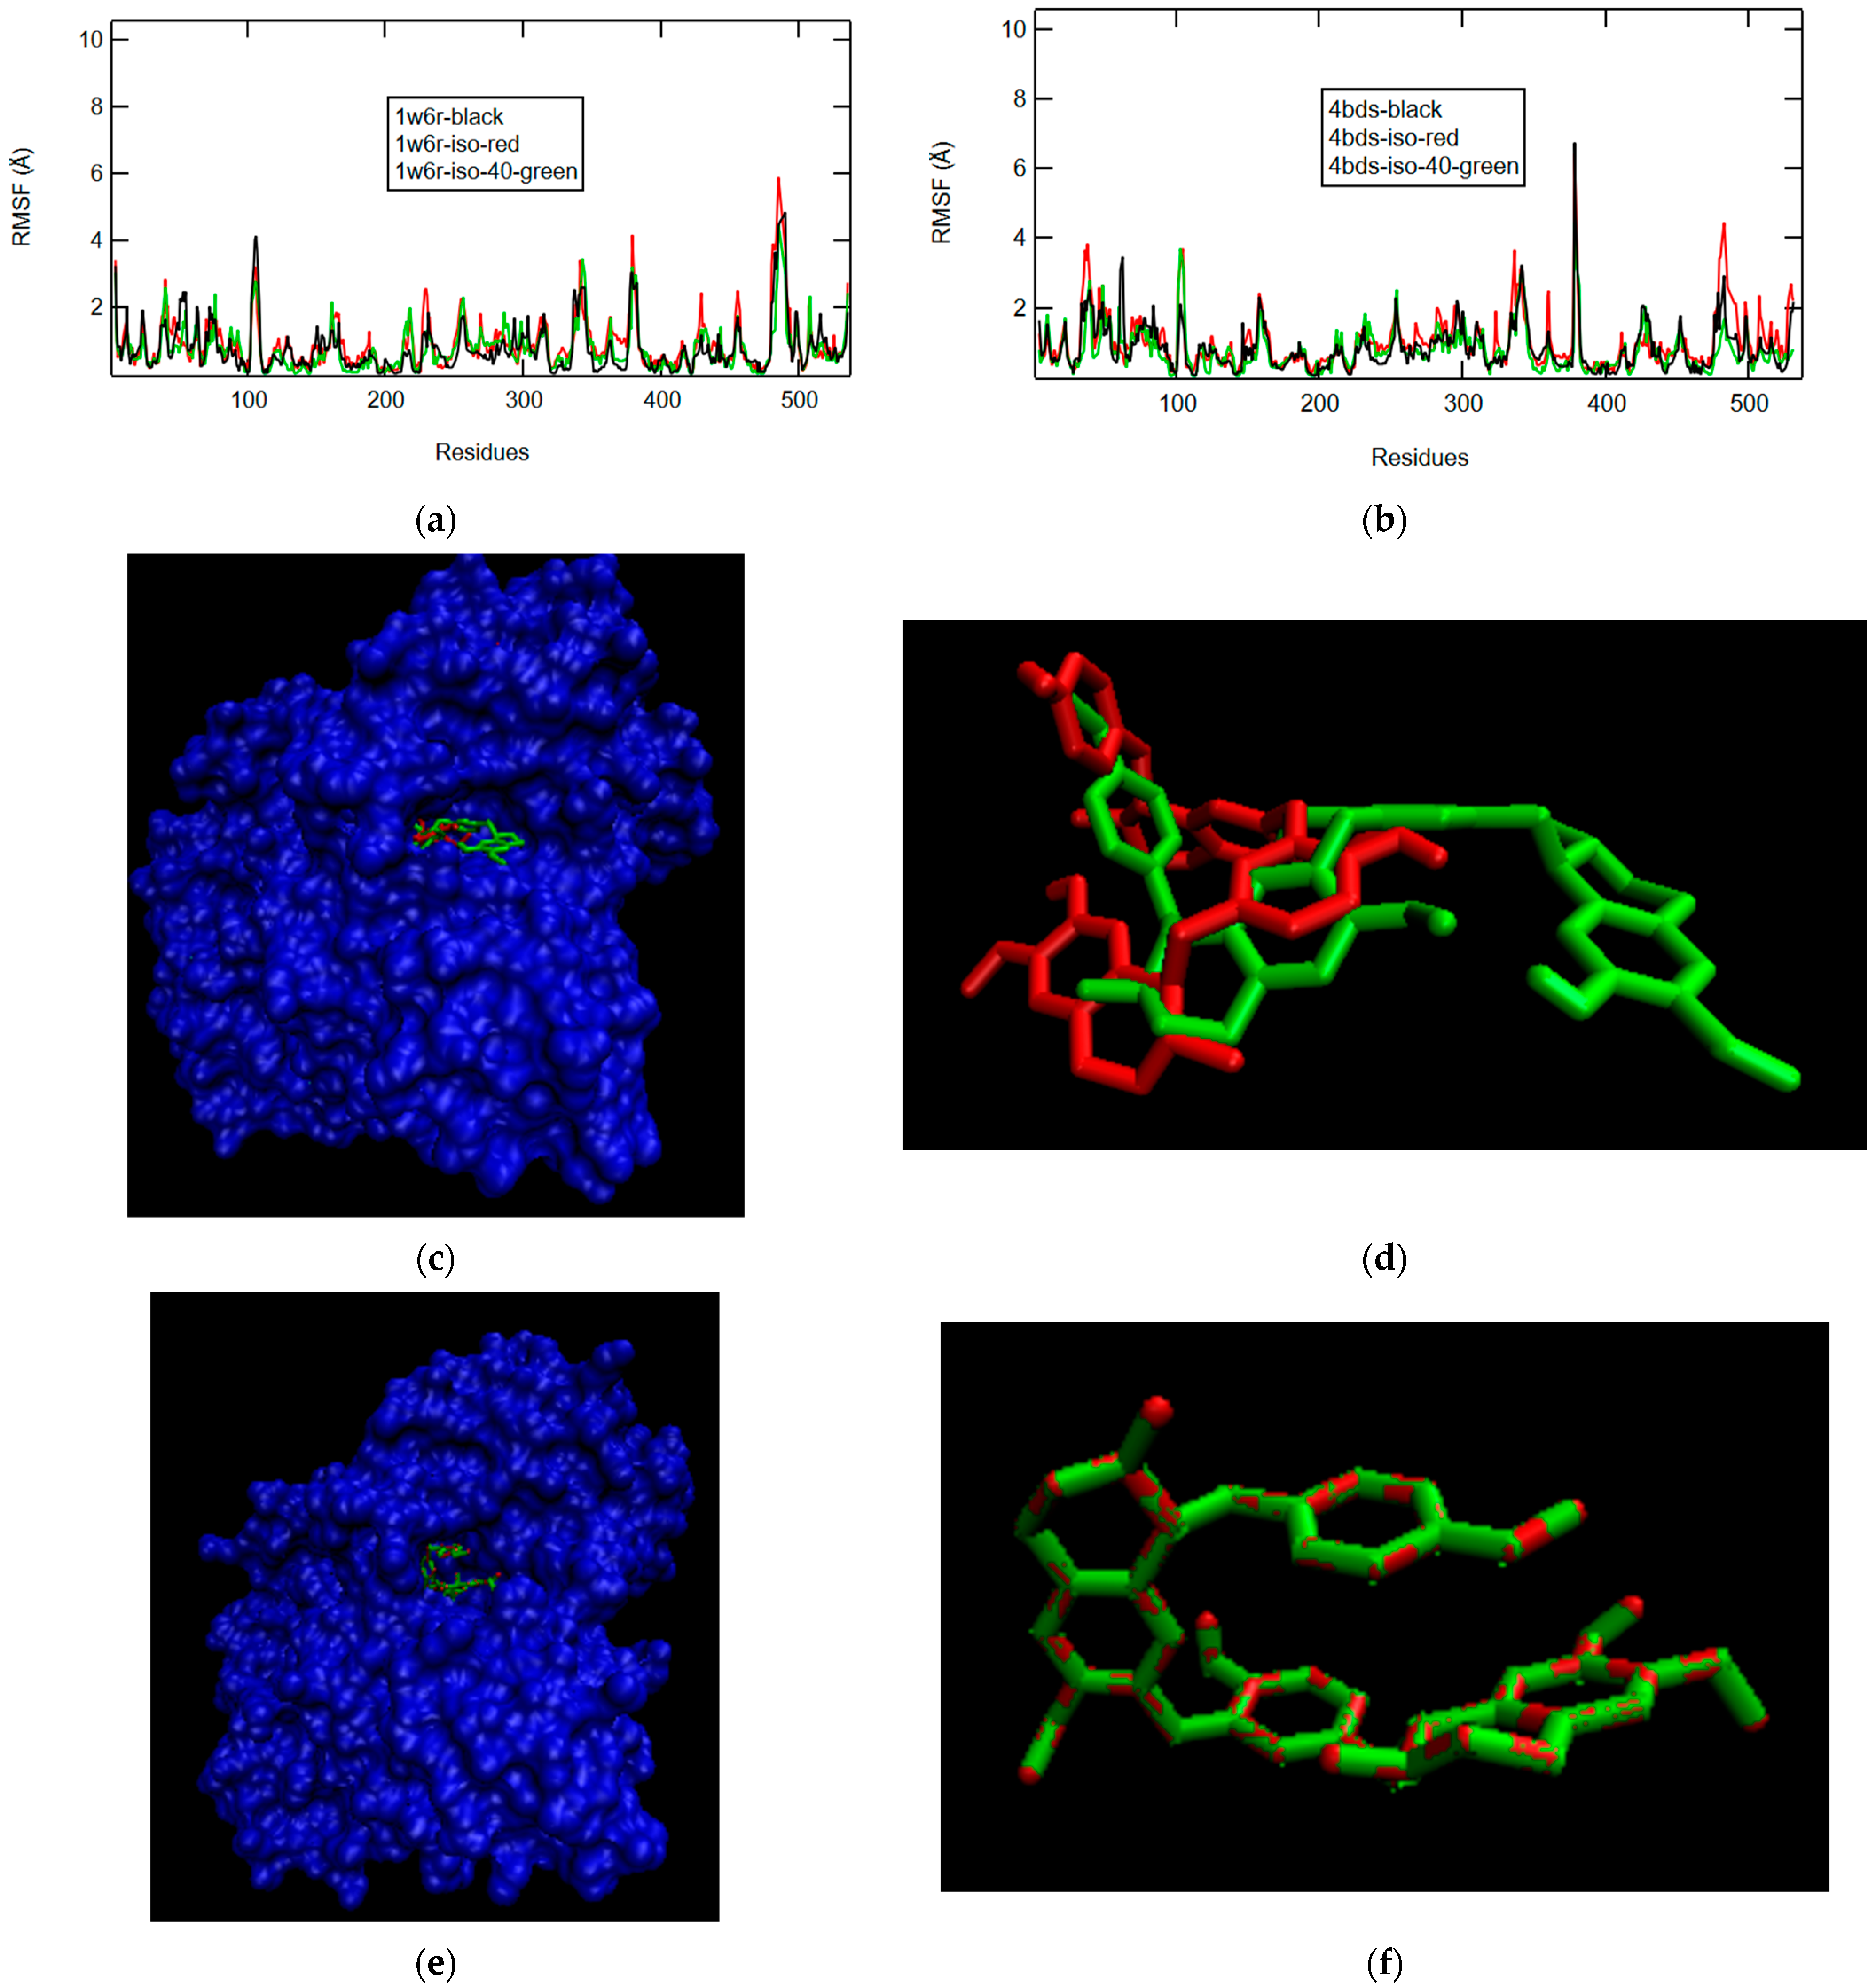
2.2.4. Isoliensinine
2.2.5. Luteolin and Matricin
2.2.6. Sedanolide and Thebaine
3. Discussion
3.1. Previous Results and Docking
3.2. MW and Enzyme–Ligand Rigidity Relationship
3.3. Trends in MD Results of ChE–Ligand Complexes
3.4. BChE Selectivity in the Literature
4. Materials and Methods
4.1. Molecular File Preparation
4.2. Dynamics Parameters
4.3. Post-Production Run Analysis
4.4. LIE Approximation of Gibbs Free Energy of Binding
4.5. Ligand Docking
4.6. Root Mean Squared Fluctuation
5. Conclusions
Supplementary Materials
Author Contributions
Funding
Data Availability Statement
Acknowledgments
Conflicts of Interest
Abbreviations
| AChE | Acetylcholinesterase |
| AD | Alzheimer’s Disease |
| BBB | Blood–Brain Barrier |
| BChE | Butyrylcholinesterase |
| CNS | Central Nervous System |
| Coul | Coulombic |
| Elj | Lennard-Jones (ligand and solvent) |
| Eqq | Coulombic (ligand and solvent) |
| ΔG | Gibbs Free Energy of Binding |
| LIE | Linear Interaction Energy |
| LJ | Lennard-Jones |
| LogP | Water–Octanol Partition Coefficient |
| MD | Molecular Dynamics |
| PSNMJ | Post-Synaptic Neuromuscular Junction |
| Rg | Radius of Gyration |
| RMSD | Root Mean Squared Deviation |
| SR | Short Range |
References
- Darvesh, S.; Walsh, R.; Kumar, R.; Caines, A.; Roberts, S.; Magee, D.; Rockwood, K.; Martin, E. Inhibition of Human Cholinesterases by Drugs Used to Treat Alzheimer Disease. Alzheimer Dis. Assoc. Disord. 2003, 17, 117–126. [Google Scholar] [CrossRef] [PubMed]
- Nutho, B.; Yanarojana, S.; Supavilai, P. Structural Dynamics and Susceptibility of Anti-Alzheimer’s Drugs Donepezil and Galantamine against Human Acetylcholinesterase. Trends Sci. 2022, 19, 4587. [Google Scholar] [CrossRef]
- Pitchai, A.; Rajaretinam, R.K.; Freeman, J.L. Zebrafish as an Emerging Model for Bioassay-Guided Natural Product Drug Discovery for Neurological Disorders. Medicines 2019, 6, 61. [Google Scholar] [CrossRef] [PubMed]
- Urry, L.A.; Cain, M.L.; Wasserman, S.A.; Minorsky, P.V.; Jackson, R.B.; Reece, J.B. AP Campbell Biology in Focus; Pearson: Boston, MA, USA, 2014; pp. 751–767. [Google Scholar]
- Taylor, P.; Brown, J.H. Synthesis, Storage and Release of Acetylcholine. In Basic Neurochemistry: Molecular, Cellular and Medical Aspects, 6th ed.; Lippincott-Raven: Philadelphia, PA, USA, 1999. [Google Scholar]
- Colović, M.B.; Krstić, D.Z.; Lazarević-Pašti, T.D.; Bondžić, A.M.; Vasić, V.M. Acetylcholinesterase inhibitors: Pharmacology and toxicology. Curr. Neuropharmacol. 2013, 11, 315–335. [Google Scholar] [CrossRef] [PubMed]
- Camara, V.S.; Soares, A.J.; Biscussi, B.; Murray, A.P.; Guedes, I.A.; Dardenne, L.E.; Ruaro, T.C.; Zimmer, A.R.; Ceschi, M.A. Expedient microwave-assisted synthesis of bis(n)-lophine analogues as selective butyrylcholinesterase inhibitors: Cytotoxicity evaluation and molecular modelling. J. Braz. Chem. Soc. 2021, 32, 1173–1185. [Google Scholar]
- Xi, M.; Feng, C.; Du, K.; Lv, W.; Du, C.; Shen, R.; Sun, H. Design, synthesis, biological evaluation and molecular modeling of N-isobutyl-N-((2-(p-tolyloxymethyl)thiazol-4yl)methyl)benzo[d][1,3]dioxole-5-carboxamides as selective butyrylcholinesterase inhibitors. Bioorg. Med. Chem. Lett. 2022, 61, 128602. [Google Scholar] [CrossRef] [PubMed]
- Zhang, Z.; Min, J.; Chen, M.; Jiang, X.; Xu, Y.; Qin, H.; Tang, W. The structure-based optimization of δ-sultone-fused pyrazoles as selective BuChE inhibitors. Eur. J. Med. Chem. 2020, 201, 112273. [Google Scholar] [CrossRef] [PubMed]
- Jiang, C.-S.; Ge, Y.-X.; Cheng, Z.-Q.; Wang, Y.-Y.; Tao, H.-R.; Zhu, K.; Zhang, H. Discovery of new selective butyrylcholinesterase (BChE) inhibitors with anti-Aβ aggregation activity: Structure-based virtual screening, hit optimization and biological evaluation. Molecules 2019, 24, 2568. [Google Scholar] [CrossRef] [PubMed]
- Xu, Y.; Zhang, Z.; Jiang, X.; Chen, X.; Wang, Z.; Alsulami, H.; Qin, H.-L.; Tang, W. Discovery of δ-sultone-fused pyrazoles for treating Alzheimer’s disease: Design, synthesis, biological evaluation and SAR studies. Eur. J. Med. Chem. 2019, 181, 111598. [Google Scholar] [CrossRef] [PubMed]
- Vafadarnejad, F.; Karimpour-Razkenari, E.; Sameem, B.; Saeedi, M.; Firuzi, O.; Edraki, N.; Mahdavi, M.; Akbarzadeh, T. Novel N-benzylpyridinium moiety linked to arylisoxazole derivatives as selective butyrylcholinesterase inhibitors: Synthesis, biological evaluation and docking study. Bioorg. Chem. 2019, 92, 103192. [Google Scholar] [CrossRef] [PubMed]
- Wajid, S.; Khatoon, A.; Khan, M.A.; Zafar, H.; Kanwal, S.; Atta-ur-Rahman; Choudhary, M.I.; Basha, F.Z. Microwave-Assisted Organic Synthesis, structure-activity relationship, kinetics and molecular docking studies of non-cytotoxic benzamide derivatives as selective butyrylcholinesterase inhibitors. Bioorg. Med. Chem. 2019, 27, 4030–4040. [Google Scholar] [CrossRef] [PubMed]
- Nordberg, A.; Ballard, C.; Bullock, R.; Darreh-Shori, T.; Somogyi, M. A review of butyrylcholinesterase as a therapeutic target in the treatment of Alzheimer’s disease. Prim. Care Companion CNS Disord. 2013, 15. [Google Scholar] [CrossRef] [PubMed]
- Li, Q.; Yang, H.; Chen, Y.; Sun, H. Recent progress in the identification of selective butyrylcholinesterase inhibitors for Alzheimer’s disease. Eur. J. Med. Chem. 2017, 132, 294–309. [Google Scholar] [CrossRef] [PubMed]
- Murugan, N.A.; Podobas, A.; Gadioli, D.; Vitali, E.; Palermo, G.; Markidis, S. A Review on Parallel Virtual Screening Soft-wares for High-Performance Computers. Pharmaceuticals 2022, 15, 63. [Google Scholar] [CrossRef] [PubMed]
- Morris, G.M.; Huey, R.; Lindstrom, W.; Sanner, M.F.; Belew, R.K.; Goodsell, D.S.; Olson, A.J. AutoDock4 and AutoDockTools4: Automated docking with selective receptor flexibility. J. Comput. Chem. 2009, 30, 2785–2791. [Google Scholar] [CrossRef] [PubMed]
- Trott, O.; Olson, A.J. AutoDock Vina: Improving the speed and accuracy of docking with a new scoring function, efficient optimization, and multithreading. J. Comput. Chem. 2009, 31, 455–461. [Google Scholar] [CrossRef] [PubMed]
- McNutt, A.T.; Francoeur, P.; Aggarwal, R. GNINA 1.0: Molecular docking with deep learning. J. Chem. Inform. 2021, 13, 43. [Google Scholar] [CrossRef] [PubMed]
- Alhossary, A.; Handoko, S.D.; Mu, Y.; Kwoh, C.-K. Fast, Accurate, and Reliable Molecular Docking with QuickVina 2. Bioinformatics 2015, 31, 2214–2216. [Google Scholar] [CrossRef] [PubMed]
- Kapla, J.; Rodríguez-Espigares, I.; Ballante, F.; Selent, J.; Carlsson, J. Can molecular dynamics simulations improve the structural accuracy and virtual screening performance of GPCR models? PLoS Comput. Biol. 2021, 17, e1008936. [Google Scholar] [CrossRef] [PubMed]
- Abraham, M.J.; Murtola, T.; Schulz, R.; Páll, S.; Smith, J.C.; Hess, B.; Lindahl, E. GROMACS: High performance molecular simulations through multi-level parallelism from laptops to supercomputers. SoftwareX 2015, 1, 19–25. [Google Scholar] [CrossRef]
- Reddy, C.; Chawla, A.S.; Deepak, M.; Singh, D.; Handa, S.S. High Pressure Liquid Chromatographic Determination of Bergenin and (+) -Afzelechin from Different Parts of Paashaanbhed (Bergenia Ligulata Yeo). Phytochem. Anal. 1999, 10, 44–47. [Google Scholar] [CrossRef]
- Wan, S.B.; Chan, T.H. Enantioselective Synthesis of Afzelechin and Epiafzelechin. Tetrahedron 2004, 60, 8207–8211. [Google Scholar] [CrossRef]
- Afzelechin. National Center for Biotechnology Information. PubChem Compound Database. Available online: https://pubchem.ncbi.nlm.nih.gov/compound/afzelechin (accessed on 15 February 2023).
- Trieu, L.H.; Hien, L.P.; Anh, L.T.K.; Thao, L.B.; Khoi, N.M.; Huong, N.T.T.; Minh, L.V. Stimulation of Insulin Secretion and Inhibition of KATP Channels by Afzelechin and Coniferaldehyde from Ensete Glaucum Seeds. Biomed. Res. Ther. 2024, 11, 6363–6378. [Google Scholar] [CrossRef]
- Saijyo, J.; Suzuki, Y.; Okuno, Y.; Yamaki, H.; Suzuki, T.; Miyazawa, M. Alpha-Glucosidase Inhibitor from Bergenia Ligulata. J. Oleo Sci. 2008, 57, 431–435. [Google Scholar] [CrossRef] [PubMed]
- Cho, S.; Park, Y.J.; Kim, E.; Bae, J.-S. The Therapeutic Potential of (+)-Afzelechin for Alleviating Sepsis-Associated Pulmonary Injury. J. Med. Food 2024, 27, 12–21. [Google Scholar] [CrossRef] [PubMed]
- Lee, I.-C.; Bae, J.-S. Anti-Inflammatory Activities of (+)-Afzelechin against Lipopolysaccharide-Induced Inflammation. Biomol. Ther. 2024, 32, 467–473. [Google Scholar] [CrossRef] [PubMed]
- Kreuz, S.; Joubert, E.; Waldmann, K.-H.; Ternes, W. Aspalathin, a Flavonoid in Aspalathus Linearis (Rooibos), Is Absorbed by Pig Intestine as a C-Glycoside. Nutr. Res. 2008, 28, 690–701. [Google Scholar] [CrossRef] [PubMed]
- Aspalathin. National Center for Biotechnology Information. PubChem Compound Database. Available online: https://pubchem.ncbi.nlm.nih.gov/compound/aspalathin (accessed on 15 February 2023).
- Kondo, M.; Hirano, Y.; Nishio, M.; Furuya, Y.; Nakamura, H.; Watanabe, T. Xanthine Oxidase Inhibitory Activity and Hypouricemic Effect of Aspalathin from Unfermented Rooibos. J. Food Sci. 2013, 78, H1935–H1939. [Google Scholar] [CrossRef] [PubMed]
- Moens, C.; Bensellam, M.; Himpe, E.; Christo; Jonas, J.; Bouwens, L. Aspalathin Protects Insulin-Producing β Cells against Glucotoxicity and Oxidative Stress-Induced Cell Death. Mol. Nutr. Food Res. 2020, 64, e1901009. [Google Scholar] [CrossRef] [PubMed]
- Montilla, M.P.; Agil, A.; Navarro, M.C.; Jiménez, M.I.; García-Granados, A.; Parra, A.; Cabo, M.M. Antioxidant Activity of Maslinic Acid, a Triterpene Derivative Obtained from Olea Europaea. Planta Medica 2003, 69, 472–474. [Google Scholar] [CrossRef] [PubMed]
- Maslinic Acid. National Center for Biotechnology Information. PubChem Compound Database. Available online: https://pubchem.ncbi.nlm.nih.gov/compound/maslinicacid (accessed on 15 February 2023).
- Lee, W.; Kim, J.; Park, E.K.; Bae, J.-S. Maslinic Acid Ameliorates Inflammation via the Downregulation of NF-ΚB and STAT-1. Antioxidants 2020, 9, 106. [Google Scholar] [CrossRef] [PubMed]
- Li, C.; Yang, Z.; Zhai, C.; Qiu, W.; Li, D.; Yi, Z.; Wang, L.; Tang, J.; Qian, M.; Luo, J.; et al. Maslinic Acid Potentiates the Anti-Tumor Activity of Tumor Necrosis Factor α by Inhibiting NF-ΚB Signaling Pathway. Mol. Cancer 2010, 9, 73. [Google Scholar] [CrossRef] [PubMed]
- Liu, S.; Liang, Y.-Z.; Luo, J.; Cao, D.-S.; Li, X.-Z.; Lei, P.; Yuan, D.-L. Optimization of Liensinine, Isoliensinine and Neferine Extraction from the Embryo of the Seed of Nelumbo Nucifera GAERTN. Sep. Sci. Technol. 2008, 43, 3637–3651. [Google Scholar] [CrossRef]
- Isoliensinine. National Center for Biotechnology Information. PubChem Compound Database. Available online: https://pubchem.ncbi.nlm.nih.gov/compound/Isoliensinine (accessed on 12 February 2023).
- Cheng, Y.; Li, H.L.; Zhou, Z.W.; Long, H.Z.; Luo, H.Y.; Wen, D.D.; Cheng, L.; Gao, L.C. Isoliensinine: A Natural Compound with “Drug-Like” Potential. Front. Pharmacol. 2021, 12, 630385. [Google Scholar] [CrossRef] [PubMed]
- Mushtaq, M.; Anwar, F. A Centum of Valuable Plant Bioactives; Academic Press: Cambridge, MA, USA, 2021. [Google Scholar]
- Luteolin. National Center for Biotechnology Information. PubChem Compound Database. Available online: https://pubchem.ncbi.nlm.nih.gov/compound/luteolin (accessed on 15 February 2023).
- Caporali, S.; De Stefano, A.; Calabrese, C.; Giovannelli, A.; Pieri, M.; Savini, I.; Tesauro, M.; Bernardini, S.; Minieri, M.; Terrinoni, A. Anti-Inflammatory and Active Biological Properties of the Plant-Derived Bioactive Compounds Luteolin and Luteolin 7-Glucoside. Nutrients 2022, 14, 1155. [Google Scholar] [CrossRef] [PubMed]
- Alhawarri, M.B.; Dianita, R.; Rawa, M.S.A.; Nogawa, T.; Wahab, H.A. Potential Anti-Cholinesterase Activity of Bioactive Compounds Extracted from Cassia Grandis L.f. And Cassia Timoriensis DC. Plants 2023, 12, 344. [Google Scholar] [CrossRef] [PubMed]
- Ramadan, M.; Goeters, S.; Watzer, B.; Krause, E.; Lohmann, K.; Bauer, R.; Hempel, B.; Imming, P. Chamazulene Carboxylic Acid and Matricin: A Natural Profen and Its Natural Prodrug, Identified through Similarity to Synthetic Drug Substances. J. Nat. Prod. 2006, 69, 1041–1045. [Google Scholar] [CrossRef] [PubMed]
- Matricin. National Center for Biotechnology Information. PubChem Compound Database. Available online: https://pubchem.ncbi.nlm.nih.gov/compound/matricin (accessed on 15 February 2023).
- Bai, X.; Wang, W.; Wang, Y.; Li, J. Anti-Proliferative and Apoptosis-Inducing Effects of Matricin on Human Non-Small Cell Lung Cancer H1299 Cells via MAPK Pathway Activation. Eur. J. Inflamm. 2020, 18, 205873922094233. [Google Scholar] [CrossRef]
- Flemming, M.; Kraus, B.; Rascle, A.; Jürgenliemk, G.; Fuchs, S.; Fürst, R.; Heilmann, J. Revisited Anti-Inflammatory Activity of Matricine in Vitro: Comparison with Chamazulene. Fitoterapia 2015, 106, 122–128. [Google Scholar] [CrossRef] [PubMed]
- Yan, R.; Li, S.-L.; Chung, H.-S.; Tam, Y.-K.; Lin, G. Simultaneous Quantification of 12 Bioactive Components of Ligusticum Chuanxiong Hort. By High-Performance Liquid Chromatography. J. Pharm. Biomed. Anal. 2005, 37, 87–95. [Google Scholar] [CrossRef] [PubMed]
- Lin, L.-Z.; He, X.-G.; Lian, L.-Z.; King, W.; Elliott, J. Liquid Chromatographic–Electrospray Mass Spectrometric Study of the Phthalides of Angelica Sinensis and Chemical Changes of Z-Ligustilide. J. Chromatogr. A 1998, 810, 71–79. [Google Scholar] [CrossRef]
- Sedanolide. National Center for Biotechnology Information. PubChem Compound Database. Available online: https://pubchem.ncbi.nlm.nih.gov/compound/sedanolide (accessed on 15 February 2023).
- Tabei, Y.; Abe, H.; Suzuki, S.; Takeda, N.; Arai, J.; Nakajima, Y. Sedanolide Activates KEAP1–NRF2 Pathway and Ameliorates Hydrogen Peroxide-Induced Apoptotic Cell Death. Int. J. Mol. Sci. 2023, 24, 16532. [Google Scholar] [CrossRef] [PubMed]
- Mahler, C.H.; Stevens, E.D.; Trudell, M.L.; Nolan, S.P. (−)-Thebaine. Acta Crystallogr. Sec. C Cryst. Struct. Commun. 1996, 52, 3193–3195. [Google Scholar] [CrossRef]
- Thebaine. National Center for Biotechnology Information. PubChem Compound Database. Available online: https://pubchem.ncbi.nlm.nih.gov/compound/thebaine (accessed on 15 February 2023).
- Gambardella, M.D.; Wang, Y.; Pang, J. The Cholinergic Selectivity of FDA-Approved and Metabolite Compounds Examined with Molecular-Docking-Based Virtual Screening. Molecules 2024, 29, 2333. [Google Scholar] [CrossRef] [PubMed]
- Pohanka, M.; Dobes, P. Caffeine Inhibits Acetylcholinesterase, but Not Butyrylcholinesterase. Int. J. Mol. Sci. 2013, 14, 9873–9882. [Google Scholar] [CrossRef] [PubMed]
- Gridhar, G.R.; Gumpeny, L. Emerging Significance of Butyrylcholinesterase. World J. Exp. Med. 2024, 14, 87202. [Google Scholar] [CrossRef] [PubMed]
- Greenblatt, H.M.; Guillou, C.; Guénard, D.; Argaman, A.; Botti, S.; Badet, B.; Thal, C.; Silman, I.; Sussman, J.L. The complex of a bivalent derivative of galanthamine with torpedo acetylcholinesterase displays drastic deformation of the active-site gorge: Implications for structure-based drug design. J. Am. Chem. Soc. 2004, 126, 15405–15411. [Google Scholar] [CrossRef] [PubMed]
- Nachon, F.; Carletti, E.; Ronco, C.; Trovaslet, M.; Nicolet, Y.; Jean, L.; Renard, P.Y. Crystal structures of human cholinesterases in complex with huprine W and tacrine: Elements of specificity for anti-Alzheimer’s drugs targeting acetyl- and butyryl-cholinesterase. Biochem. J. 2013, 453, 393–399. [Google Scholar] [CrossRef] [PubMed]
- Vanommeslaeghe, K.; Hatcher, E.; Acharya, C.; Kundu, S.; Zhong, S.; Shim, J.; Darian, E.; Guvench, O.; Lopes, P.; Vorobyov, I.; et al. CHARMM general force field: A force field for drug-like molecules compatible with the CHARMM all-atom additive biological force fields. J. Comput. Chem. 2010, 31, 671–690. [Google Scholar] [CrossRef] [PubMed]
- Kuriata, A.; Gierut, A.M.; Oleniecki, T.; Ciemny, M.; Kolinski, A.; Kurcinski, M.; Kmiecik, S. CABS-Flex 2.0: A Web Server for Fast Simulations of Flexibility of Protein Structures. Nucleic Acids Res. 2018, 46, W338–W343. [Google Scholar] [CrossRef] [PubMed]
- Kmiecik, S.; Gront, D.; Kolinski, M.; Wieteska, L.; Dawid, A.E.; Kolinski, A. Coarse-Grained Protein Models and Their Applications. Chem Rev. 2016, 116, 7898–7936. [Google Scholar] [CrossRef] [PubMed]
- Igor Pro® 9 Highlights|Igor Pro by WaveMetrics. Available online: https://www.wavemetrics.com/igor-9-highlights (accessed on 5 June 2025).
- Humphrey, W.; Dalke, A.; Schulten, K. VMD—Visual Molecular Dynamics. J. Mol. Graph. 1996, 14, 33–38. [Google Scholar] [CrossRef] [PubMed]
- Galiè, N.; Olschewski, H.; Oudiz, R.J.; Torres, F.; Frost, A.; Ghofrani, H.A.; Badesch, D.B.; McGoon, M.D.; McLaughlin, V.V.; Roecker, E.B.; et al. Ambrisentan for the Treatment of Pulmonary Arterial Hypertension. Circulation 2008, 117, 3010–3019. [Google Scholar] [CrossRef] [PubMed]
- Ambrisentan. National Center for Biotechnology Information. PubChem Compound Database. Available online: https://pubchem.ncbi.nlm.nih.gov/compound/ambrisentan (accessed on 15 February 2023).
- Kingman, M.; Ruggiero, R.; Torres, F. Ambrisentan, an Endothelin Receptor Type A-Selective Endothelin Receptor Antagonist, for the Treatment of Pulmonary Arterial Hypertension. Expert Opin. Pharmacother. 2009, 10, 1847–1858. [Google Scholar] [CrossRef] [PubMed]
- Tfelt-Hansen, P. Ergotamine in the Acute Treatment of Migraine: A Review and European Consensus. Brain 2000, 12, 9–18. [Google Scholar] [CrossRef] [PubMed]
- Diener, H.-C.; Jansen, J.-P.; Reches, A.; Pascual, J.; Pitei, D.; Steiner, T.J. Efficacy, Tolerability and Safety of Oral Eletriptan and Ergotamine plus Caffeine (Cafergot®) in the Acute Treatment of Migraine: A Multicentre, Randomised, Double-Blind, Placebo-Controlled Comparison. Eur. Neurol. 2002, 47, 99–107. [Google Scholar] [CrossRef] [PubMed]
- Ergotamine. National Center for Biotechnology Information. PubChem Compound Database. Available online: https://pubchem.ncbi.nlm.nih.gov/compound/ergotamine (accessed on 15 February 2023).
- Silberstein, S.D.; McCrory, D.C. Ergotamine and Dihydroergotamine: History, Pharmacology, and Efficacy. Headache J. Head Face Pain 2003, 43, 144–166. [Google Scholar] [CrossRef] [PubMed]
- Zijlstra, F.J.; Spierings, E.L.H.; Vincent, J.E. Effect of Ergotamine on Platelet Prostaglandin Synthesis—In Vitro and in Vivo Experiments. Cephalalgia 1981, 1, 25–27. [Google Scholar] [CrossRef] [PubMed]
- ZINC253700110. Available online: https://zinc15.docking.org/substances/ZINC000253700110/ (accessed on 27 January 2025).
- Caffeine. National Center for Biotechnology Information. PubChem Compound Database. Available online: https://pubchem.ncbi.nlm.nih.gov/compound/caffeine (accessed on 15 February 2023).
- Ribeiro, J.A.; Sebastião, A.M. Caffeine and Adenosine. J. Alzheimer’s Dis. 2010, 20, S3–S15. [Google Scholar] [CrossRef] [PubMed]


| Ligands 2 | AChE 3 | BChE 3 |
|---|---|---|
| afzelechin (274.3) | −9.7 (−9.7) | −8.7 (−8.7) |
| aspalathin (452.4) | −8.9 (−9.2) | −9.2 (−9.5) |
| D-maslinic acid (472.7) | −1.1 (−9.0) | −11.0 (−11.0) |
| isoliensinine (610.7) | −1.5 (−10.9) | −11.2 (−11.3) |
| luteolin (286.2) | −10.6 (−10.6) | −9.1(−9.1) |
| matricin (306.4) | −8.8 (−8.7) | −8.6 (−8.6) |
| sedanolide (194.3) | −7.8 (−7.9) | −6.6 (−6.8) |
| thebaine (311.4) | −9.5 (−9.7) | −8.9 (−8.9) |
Disclaimer/Publisher’s Note: The statements, opinions and data contained in all publications are solely those of the individual author(s) and contributor(s) and not of MDPI and/or the editor(s). MDPI and/or the editor(s) disclaim responsibility for any injury to people or property resulting from any ideas, methods, instructions or products referred to in the content. |
© 2025 by the authors. Licensee MDPI, Basel, Switzerland. This article is an open access article distributed under the terms and conditions of the Creative Commons Attribution (CC BY) license (https://creativecommons.org/licenses/by/4.0/).
Share and Cite
Gambardella, M.D.; Wang, Y.; Pang, J. Molecular Dynamics Studies on the Inhibition of Cholinesterases by Secondary Metabolites. Catalysts 2025, 15, 707. https://doi.org/10.3390/catal15080707
Gambardella MD, Wang Y, Pang J. Molecular Dynamics Studies on the Inhibition of Cholinesterases by Secondary Metabolites. Catalysts. 2025; 15(8):707. https://doi.org/10.3390/catal15080707
Chicago/Turabian StyleGambardella, Michael D., Yigui Wang, and Jiongdong Pang. 2025. "Molecular Dynamics Studies on the Inhibition of Cholinesterases by Secondary Metabolites" Catalysts 15, no. 8: 707. https://doi.org/10.3390/catal15080707
APA StyleGambardella, M. D., Wang, Y., & Pang, J. (2025). Molecular Dynamics Studies on the Inhibition of Cholinesterases by Secondary Metabolites. Catalysts, 15(8), 707. https://doi.org/10.3390/catal15080707