Abstract
The present study aimed to investigate the interaction between strontium titanate photocatalysts and alkaline soil (solonetz) soil solutions. For this purpose, one commercially available and several synthesized strontium titanates were considered. The photocatalytic activity and material characteristics were assessed before and after immersion in the soil solutions. All samples were characterized by X-ray diffractometry (XRD), infrared spectroscopy (IR), diffuse reflectance spectroscopy (DRS), and scanning electron microscopy (SEM). After interaction with the soil solution, most of the samples became more active for phenol degradation. It was found that the crystalline structure of each sample was preserved, while the primary crystallite sizes decreased after both phenol degradation and immersion in solonetz soil solutions. Moreover, the surface of all synthesized nanostructures was covered by organic residues from either the soil solution or the by-products of phenol degradation. This was also visible from the DR spectra, as an intensive color change was observed. The bandgaps of most samples were also changed, except for the commercial material. The results imply that it is important to investigate the ecofriendly nature of any photocatalytic material, as it tends to influence the surrounding environment. This is important, as solar photocatalysis is rising among the possible methods for water purification and disinfection.
1. Introduction
Wastewater treatment is of great importance in providing clean water to the increasing population of Earth [1,2]. Due to the high costs required for the various water treatment and purification technologies, extensive research has been conducted into alternative methods such as photocatalysis. Numerous semiconductor materials have already been investigated, including TiO2 [3,4,5], ZnO [6,7], WO3 [8], Bi2O3 [9], etc.
Strontium titanate has been reported as one of the most promising photocatalysts due to its approachable bandgap value of 3.2 eV (UVA-excitable), high photocatalytic activity and quantum yield, and chemical stability [10,11], making it a strong candidate for environmental applications such as solar water treatment (at least 5% of solar energy is UV light). Moreover, strontium titanate is also utilized in dye-sensitized solar cells due to its ability to improve energy conversion efficiency by facilitating electron transport. Its stability and optoelectronic properties also make it valuable in gas sensors, where it detects changes in gas concentration through conductivity shifts [12]. These multiple applications reflect its versatility and importance in both renewable energy and environmental technologies. However, like many nanomaterials, its end of life poses challenges related to material recovery and environmental impact, highlighting the need for sustainable recycling technologies [13].
Research shows that nanomaterials end up in landfills. This means that they can enter the environment and potentially cause local changes in the soil, flora, and fauna [14]. The majority of engineered nanoparticles (ENPs) released into the environment tend to accumulate in the soil, reaching higher concentrations than in water or air [15,16]. Titanium-containing ENPs show the highest accumulation tendency in soil, water, and air, followed by iron- and zinc-based ENPs [15,16]. It is expected that Ti-based nanoparticles will remain in particulate form due to their low solubility, but are unlikely not to change in size [17].
Rainfall and running water cause the formation of soil solutions, which can interact with nanomaterials. The migration and deposition of ENPs are influenced by various parameters such as ionic strength and organic matter. ENPs have been investigated for their potential toxicity and environmental risks and have consequently been identified as emerging pollutants [18,19] endangering various levels of the food chain (bacteria, algae, fish, crustaceans, nematodes, etc.) [20].
Soil is a significant chapter of environmental research, and thus many studies focus on the chemical, biological, and physical changes that occur there [21]. Soil pH is an important soil characteristic that impacts many soil properties and processes, including nutrient availability, microbial activity, and plant growth. It can range from strongly acidic (pH < 5) to strongly alkaline (pH > 8), with most agricultural soils falling in the slightly acidic to slightly alkaline range (pH 6–8). Solonetz alkaline soil is characterized by its high pH and elevated sodium content, which can have a profound impact on soil chemistry and plant growth [22]. Solonetz soils are very common and cover a significant area of the Great Hungarian Plain [23]. This type of soil is abundant in arid and semiarid regions worldwide.
Considering the relevant information and the significance in evaluating soil characteristics, solonetz alkaline soil was selected for investigation. While past research mainly focused on the effects of ENPs in water, there is a lack of understanding regarding their interaction with soil solutions. The goal was to gain valuable insights into the environmental risks associated with ENPs, particularly focusing on the limited knowledge about how the physical and chemical properties of soil solutions affect the catalytic activity of SrTiO3 ENPs. Further investigation in this area is crucial for developing a more comprehensive understanding of the environmental consequences of these ENPs.
Therefore, this study focused on investigating the properties of strontium titanates (structure, morphology, optical properties, and photocatalytic activity) and the changes in these characteristics after interaction with solonetz soil solution. These results give information on the role a specific soil type plays in the environmental distribution and fate of a specific nanomaterial.
2. Results
2.1. Assessment of Photocatalytic Activity
The abbreviations used in this study are listed at the end of the manuscript. Sample names and synthesis methods are described in Section 4.2.
By analyzing the photoactivity of the samples (REF, pristine STO, and soil solution-treated ones) the following questions can be formulated:
- Does the synthesis of the catalysts have any influence on the properties of the samples?
- Following the interaction with soil solutions, can the activity of a catalyst be preserved?
- If the answer to both the above questions is yes, then can it be stated that these nanoparticles are “safe” for the environment?
The photocatalytic degradation experiments revealed that the synthesized catalysts have higher photocatalytic activity than the reference sample (STO_REF). Among the synthesized catalysts, STO_I had the highest photocatalytic activity, as can be seen in Figure 1. The conversion values obtained were 3.8% for STO_REF, 32.1% for STO_I, 12.8% for STO_II, and 5.6% for STO_III.
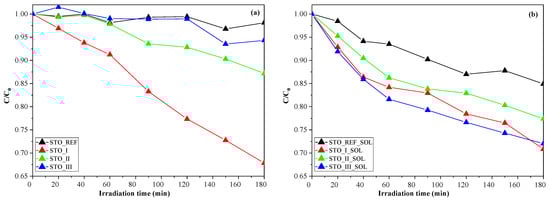
Figure 1.
Phenol degradation efficiency of the STO photocatalysts (a) and their soil solution-treated counterparts (b).
The results show that the soil solution modified (detailed in Section 4.2) the photoactivity of the STO samples. The degradation efficiency for each photocatalyst (following treatment with the soil solution) was 15.0% for STO_REF_SOL, 29.1% for STO_I_SOL, 22.6% for STO_II_SOL, and 27.9% for STO_III_SOL. The immersion in soil solution increased the photocatalytic activity of samples STO_REF, STO_II, and STO_III, while in the case of STO_I, a slight decrease was observed (Figure 1). Usually, surface contamination yields a decreased activity of every photocatalysts; however, here seems to be an exception. There are reports in the scientific literature of an organic compound enhancing the photoactivity of a given nanostructure. In specific cases, surface-anchored compounds can act as charge separators via polar functional groups or aromatic rings, and can lock the photogenerated electrons, thus facilitating the charge separation mechanism and enhancing the overall photoactivity. In some reported situations, surface-anchored compounds can act as suspension stabilizers by enhancing the hydrophilicity of the particles. This way, the crystallites are in more intensive contact with the surrounding matrix, the water, permitting and facilitating the mass transfer between particles and aqueous media.
The photocatalytic degradation of phenol is influenced by many parameters, such as pH, initial concentration of phenol, primary crystallite size, suspension concentration, light intensity, and the presence of electron acceptors (NO3−, SO42−, etc.) [20]. The alkaline pH (in our case, 9.4 ± 0.2) might lead to small particles (due to the slow solubilization of STO in alkaline media and subsequent recrystallization), which can contribute to the observed high photocatalytic activity.
Comparing SrTiO3 photocatalysts that appear in different publications based on their performance may not be correct, due to variations in several experimental parameters, such as lamp emission spectra, reactor design, air supply flux differences, lamp power, lamp distance, different organic compounds, etc. Moreover, a standardized SrTiO3 material should be available and used (which is not always the case) to discuss the performance of the material. However, photocatalysis has just one such major reference material, Evonik Aeroxide P25 TiO2, which is not suitable in the present case. Additionally, there is also the issue of soil solution composition. The chemical composition of soil extracts varies depending on the geographical region. Hence, if there are similar experiments in the literature, comparison with any results will be difficult due to the variance in the chemical composition of the soil extract, which cannot be controlled.
Based on the results discussed above and visualized below (Figure 2a), it is clear that the semiconductor nature of nanoparticles is preserved even after interaction with the basic soil solutions. This was proven by the enhanced photoactivity values following the treatment. Hence, it is imperative to establish a relationship between the treated STO samples and their structural and morphological properties.
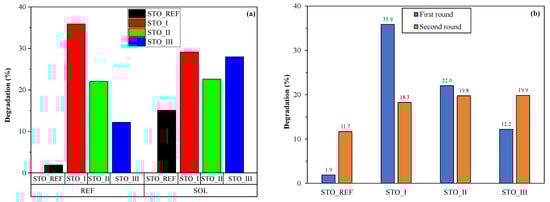
Figure 2.
Comparison of degradation efficiencies before and after immersion in soil solutions (a) and the cyclic reutilization experiment (b).
However, before proceeding with the investigations, the reusability of each catalyst was tested within two cycles. It should be noted that no differences were observed in their XRD patterns (no new diffraction peaks, no widening of the diffraction signals), meaning that every activity change must be related to the surface quality of the particles. Figure 2b shows that the activity of the photocatalysts changed following the first degradation cycle. The most intriguing fact was that the activity changes followed nearly the same trend as what we observed after soil solution immersion, namely that the activity of STO_REF and STO_III increased (1.9% to 11.7%; 12.2 to 19.9%), while the performance of STO_I decreased (from 35.9% to 18.3%) and that of STO_II was nearly the same (22.0% vs. 19.8%). This means that the reason for the activity change after the recycling experiments is most likely identical to the one that will be identified for the soil-solution effect on the SrTiO3 nanostructures.
2.2. Structure and Morphology
2.2.1. Primary Crystallite Size and Composition Analysis
The degradation results suggest that there might be differences in the crystallographic properties of the samples, as these can influence photoactivity. Hence, XRD was applied to verify the hypothesis, and this was complemented with the specific surface area values. First, the success of the synthesis procedure was investigated. All three samples and the reference contained cubic SrTiO3 (JCPDS 35-0734), space group Pmm, lattice parameters: 3.90264 pm. Sample STO_I contained SrCO3 (~17 wt.%; JCPDS 05-0418), while the other three materials (STO_REF, STO_II, and STO_III) were carbonate-free (Figure 3, Figures S1 and S2). It should be noted that SrCO3 may originate from two different sources, the first being absorption of CO2 from air. However, the amount of SrCO3 formed via this route should be low, as the exposure of the precursors and other reagents to air is short, in the order of a few minutes. The other formation route should be directly from the carbonated NaOH, as suggested in the experimental section.
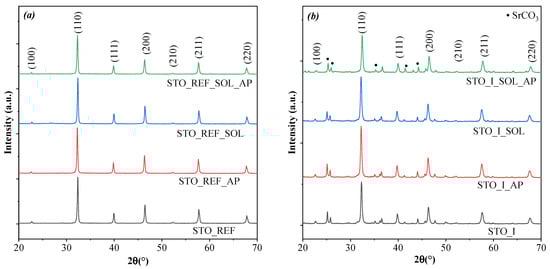
Figure 3.
XRD patterns for (a) STO_REF and (b) STO_I in phenol, solonetz soil and solonetz soil with phenol.
Primary crystallite sizes were calculated for the pristine samples, which were between 42 and 45 nm (STO_I—38.1 m2/g, STO_II—37.7 m2/g, and STO_III—39.0 m2/g), while for STO_REF, this value was 78 nm (12.1 m2/g) (Table S2). Also, it should be mentioned that STO_III did not contain any other Sr or Ti compounds (even though this was expected due to the Sr:Ti = 1:1 ratio, Section 4.2, Figure S2).
The XRD patterns of the soil solution-treated samples were investigated before and after phenol degradation. They showed that the crystalline structure of the samples was preserved at each stage (Figure 3 and Figure S1), except for sample STO_I, where an increase in SrCO3 content was observed. However, after calculating the crystallite sizes, it was found that the interaction with the soil solution resulted in different values compared to the original ones (Table S2). In the case of STO_REF_SOL, it was 77.6 nm (11.8 m2/g), which is lower than the original value (78 nm). For the synthesized samples, this change was as follows: from 44.9 nm to 42.9 nm (38.3 m2/g) in STO_I; from 44.1 nm to 46.1 (36.2 m2/g) in STO_II; and from 42.0 nm to 35.4 nm (42.4 m2/g) in STO_III. After this, all the samples were investigated again following phenol degradation, and it was found that the crystallite sizes had changed again. For STO_REF_AP, 84.2 nm (9.0 m2/g) was obtained, which is larger than the original value (78.3 nm). However, at this size, the Scherrer equation yields less accurate primary crystallite sizes (by 10%–15%) [24]. After phenol degradation, the size of the soil solution-treated sample (STO_REF_SOL_AP) decreased to 67.1 nm (19.2 m2/g). For the synthesized samples, these changes were as follows: from 44.9 nm to 28.2 (49.4 m2/g) nm in STO_I; from 46.1 nm to 26.9 (50.2 m2/g) in STO_II; and from 42.0 nm to 41.4 nm (38.3 m2/g) in STO_III (Figure S1).
2.2.2. Surface Chemistry of the Samples
All the samples mentioned until now were also analyzed using IR spectroscopy. IR results showed that there was a significant difference in specific cases at ~3000–3900 cm−1, which is the so-called water band [25]. In the case of the STO_REF sample set (Figure 4) no changes were observed. In the case of the STO_I sample group (Figure 4), the water band diminished after soil solution immersion (STO_I_SOL, less intense signal diminishing) and also following phenol degradation (STO_I_AP, STO_I_SOL_AP). Sample set STO_II behaved like STO_REF, the only difference being in the case of STO_II_SOL, where a slight increase in this band was noticed. The only case where this band registered an increase after phenol degradation was in sample set STO_III (STO_III_SOL_AP). The other samples from this group did not show any changes in the water band (Figure S2). This phenomenon can be attributed to the fact that during phenol degradation, some intermediates may be adsorbed on the surface of the catalyst, covering the oxide layer. This was partially proven by the results shown below.
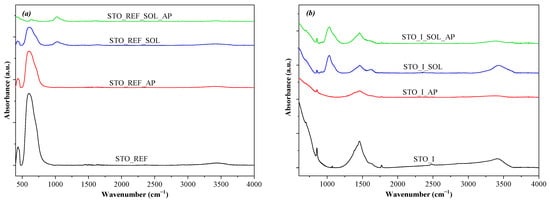
Figure 4.
IR spectra recorded for (a) STO_REF and (b) STO_I after interaction with solonetz soil solution and/or phenol degradation.
One of the major bands is the metal–oxygen (Sr–O, Ti–O) band at ~300–750 cm−1 [26]. The intensity of this signal was stable for STO_II and STO_III (Figure 4 and Figure S2), while for STO_REF, intense adsorption of some organic species may occur, covering the oxide surface and leading to the lower intensity of this band. The same behavior was observed for STO_I as well, with lower intensity.
A band centered at ~1000 cm−1 (C–O) [27] was present in the materials that were immersed in soil solutions. The intensity of this signal was stable for STO_REF, STO_I, and STO_II, while for STO_III, its intensity increased after phenol degradation (STO_III_SOL_AP). The signal found in the 1250–1500 cm−1 region was sharp and intense for the STO_I materials (Figure 4), which can be attributed to several organic compounds, including amines [28]. The other samples did not show this signal. Another intense signal, which behaved like the one located at ~1000 cm−1, was detected at 1650 cm−1 (this signal is also characteristic of highly polar organic species, such as amides, carboxylic acids, etc. [27]). This signal appeared separately in STO_II_SOL and STO_III_SOL, while in the STO_I sample series, it overlapped with the band located at 1250–1500 cm−1
2.2.3. Morphological Changes Induced by the Soil Solution and Phenol Degradation
The measurements revealed that all materials showed large particles with signs of aggregation. Specifically, for STO_REF, no major changes were observed in the size or shape of the particles (~0.5–1.5 µm). The aggregates were shapeless and could not be characterized by a well-defined morphology (Figure 5 and Figure S3).
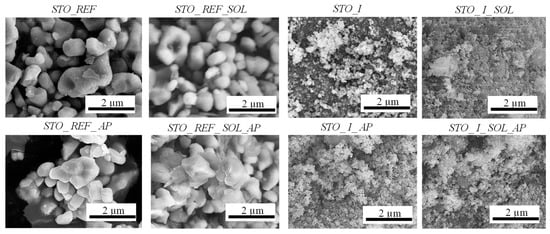
Figure 5.
SEM micrographs of STO_REF and STO_I photocatalysts.
In STO_I, no major changes were observed in the size or shape of the particles. Signs of aggregation were observed for the soil solution-immersed sample STO_I_SOL. Aggregates were found also in STO_II (containing cube-shaped crystals), STO_II_SOL, and STO_II_AP, but after testing the soil solution-modified STO_II sample for phenol degradation (STO_II_SOL_AP), its morphology had changed (the cubic crystal morphology was partially destroyed). For STO_III, this observation was also valid (Figure S3).
2.2.4. Optical Properties and Bandgap Energy of the Samples
Based on the DRS results, STO_REF, STO_I, STO_II, and STO_III did not show any major color changes after phenol degradation. However, it should be mentioned that the reflectance values for STO_REF_AP, STO_I_AP, STO_II_AP, and STO_III_AP were lower compared to those for their pure counterparts, meaning that some phenol degradation intermediates might have adsorbed on their surface. Also, natural organic matter (e.g., humic acids) containing various functional groups can interact with the samples, contributing to changes in the optical properties [29]. When STO_REF was immersed in the soil solution, it became grayish (STO_REF_SOL), then brightened somewhat following phenol degradation (STO_REF_SOL_AP, Figure 6). This color change was valid for all other STO_II (Figure S4) and STO_III (Figure S5) soil solution-immersed samples. The same trend was not valid for STO_I, as the color of STO_I_SOL_AP (Figure 7) became darker after phenol degradation.
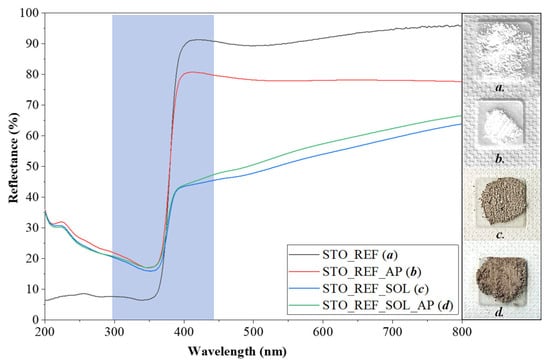
Figure 6.
DR spectra of STO_REF samples (Blue area is the light absorption range).
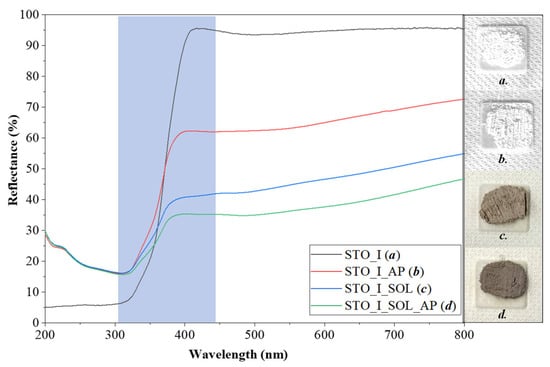
Figure 7.
DRS spectra of STO_I sample series (Blue area is the light absorption range).
The bandgap energy of STO_REF (3.10 eV) did not change after phenol degradation (STO_REF_AP) or after immersion in the soil solution (STO_REF_SOL) followed by phenol degradation (STO_REF_SOL_AP). This was not surprising, because some organic compounds are capable of changing the color of semiconductors, but not their bandgap. This phenomenon is often confused with doping [30]. The bandgap of STO_I slightly decreased from 3.33 eV to 3.07 eV after phenol degradation (STO_I_AP). When the sample was immersed in soil solution, 2.93 eV was obtained (STO_I_SOL). When the previous material was applied in phenol degradation, the bandgap energy remained nearly unchanged (2.83 eV, STO_I_SOL_AP). These phenomena were similar for the STO_II and STO_III sample series, as shown by the values presented in Table S2. A decreasing bandgap value may be associated with decreased crystallite size (Section 2.2.1.) and the covering of the surface with compounds capable of intervening in charge transfer processes [31].
2.2.5. XPS Analysis
In the XP spectra (Figure S6) of SrTiO3, the primary peaks correspond to the core levels of Sr 3d, Ti 2p, and O 1s [32]. The Sr 3d spectrum typically exhibits a doublet with Sr 3d5/2 and Sr 3d3/2 peaks, confirming the presence of Sr in the Sr2⁺ oxidation state. The Ti 2p region also presents a characteristic doublet with Ti 2p3/2 and Ti 2p1/2 peaks, indicating that titanium is in the Ti4+ oxidation state, consistent with the stoichiometry of SrTiO3. No Ti3+ was detected in the investigated samples.
The O 1s peak appears around 529.5 eV, attributed to the lattice oxygen in SrTiO3. Additional features in the O 1s region may indicate surface hydroxylation or adsorbed species. Surface-adsorbed species, such as organic compounds, were detected in the C 1s region, supporting the IR results. However, due to the complexity of organic compounds adsorbed, neither clear identification nor quantification could be carried out.
3. Discussion and Contextual Analysis of the Results
The first phase of this investigation was the evaluation of the photocatalytic performances of all the nanomaterials obtained at different stages, i.e., (i) pristine synthesized samples, (ii) materials immersed in soil solutions, and (iii) samples obtained after photocatalytic degradation and immersion in the soil solution. Two types of effects were observed:
- Activity increase: STO_REF, STO_II, and STO_III sample series.
- Activity decrease: STO_I sample series.
- Recycled catalyst activity: followed the trends listed above.
To explain the diverse activity changes, the main properties of the samples were analyzed.
- Primary crystallite size and composition: It was found that the crystalline structure of the samples was preserved at each stage, except for STO_I. In this sample, the amount of SrCO3 increased following the soil solution treatment, meaning that SrCO3 inhibited the activity of SrTiO3. The primary crystallite sizes decreased more intensively following the photocatalytic degradation process, which was carried out for the samples immersed in the soil solution. This means that recrystallization occurs during the catalytic process, increasing the available surface area (lower crystallite sizes mean higher specific surface areas and in general higher photocatalytic activities), except for STO_I (data regarding the specific surface area can be found in the same section where the primary crystallite size values are discussed). Here, the primary crystallite size decrease effect was most probably balanced by the presence of SrCO3 (manifested in activity decrease).
- Morphological changes: Not only structural but also morphological changes were observed as well. The only sample that did not show any changes in morphology was STO_REF, while aggregation and fragmentation were observable in the other cases. The latter can be associated with the changes registered in primary crystallite size values. This assumption was supported by the correlation between XRD-derived primary crystallite size reduction (Table S2) and the aggregation and fragmentation patterns observed in the SEM micrographs (Figure 5). For instance, sample STO_I showed a decrease in crystallite size from 44 nm to 27 nm, which coincided with visible particle fragmentation in SEM micrographs.
- Changes in the optical properties: Here, two types of changes were observed. The first was the decrease in reflectance in the visible region (above 450 nm) for all samples following their immersion in soil solutions. This was expected, as organic compounds were adsorbed on the surface. This was confirmed by the IR results. The second was the decrease of bandgap energy from 3.1 eV to 2.8 eV. This can be because the adsorbed organic compounds may participate in electron transport routes, hindering recombination (reinforced by the activity enhancements). This conclusion was drawn based on one of our earlier studies, where we observed similar behavior. The only difference was that the photocatalyst studied was titania, while the organic compounds were deposited on the surface of the nanoparticles via the calcination of the amorphous matter [30]. However, a clear mechanism would be challenging to propose because of the wide variety of organic compounds present on the surface of the particles. The only exception was the STO_REF sample series, where no bandgap changes were observed.
- Surface chemistry: Due to the wide variety of organic compounds originating from the soil solution, only a general discussion can be had. It was observed that the concentration of these compounds increases if immersion in soil solution is followed by a photocatalytic degradation experiment. The complexity of the surface is well reflected in the width of the IR band at 1200–1500 cm−1, which in some cases overlaps with the band centered at 1650 cm−1. It is also evident that both soil solution immersion and photocatalysis contribute to the changes registered in the water band. Due to the complexity, XPS results could not be utilized for the explanation of photoactivity changes.
4. Materials and Methods
4.1. Chemicals
Commercial STO (Alfa Aesar, Kandel, Germany; 99%) was used as a reference. Phenol (Spektrum 3D, Debrecen, Hungary; analytical grade) was used as a model pollutant to investigate the photocatalytic activity of the nanomaterials under UVA light irradiation. Soil solutions were prepared using Milli-Q water. For the synthesis of STO, NaOH (VWR; Leuven, Belgium, ≥97.0%), titanium dioxide—P25 (Acros Organics, Waltham, MA, USA, ≥99.5%), urea (Molar Chemicals; Halásztelek, Hungary, ≥99.4%), and strontium nitrate Sr (NO3)2 (Alfa Aesar; Kandel, Germany; 99%) were used. Potassium bromide (Sigma Aldrich; St. Louis, MO, USA, ≥99.0%), (KBr) was applied as the base material for the pellets used during IR measurements.
4.2. Synthesis
In the first step, a 5 M NaOH (80 mL), 2 M urea (10 mL), and 3 M Sr (NO3)2 (10 mL) solution was prepared using Milli-Q water under continuous stirring separately for 10 min. In a second step, the prepared solutions were transferred slowly into a vessel. After the mixture had cooled, 15 mmol of Aeroxide P25 (2 g) was added (Ti:Sr molar ratio was 1:1.2). Subsequently, the mixture was further stirred for 10 min and sonicated for another 10 min. Afterwards, the resulting mixture was transferred into a 150 mL stainless-steel Teflon-lined autoclave and placed in an oven at 180 °C for 24 h. After cooling to room temperature, the content of the autoclave was neutralized until pH 7 was reached with a 5 M HCl solution. The excess liquid was removed through vacuum filtration using a microporous membrane (Pall, GH polypro, 0.2 μm, Pall Corporation, New York, NY, USA). Finally, the product was dried overnight in an oven at 75 °C. The samples obtained were as follows:
- STO_I—this is the sample that followed the synthesis description provided above.
- STO_II—this sample was prepared using the experimental approach listed above, the only difference being the use of Na2CO3-free NaOH, thus reducing the formation of SrCO3. SrCO3 is known to affect the photoactivity of STO, so a carbonate-free sample was also synthesized [33].
- STO_III—this is the sample that followed the synthesis description provided above, but the ratio of the Sr and Ti precursors was identical, and Na2CO3-free NaOH was applied. This was necessary to check whether residual titania clusters can form on the surface and if they contribute to the surface properties of STO, which is a critical aspect of nanoparticles’ behavior in soil.
The samples used throughout this work were named as follows: STO_X_SOL_AP. “STO” stands for strontium titanate and “X” refers to the sample type described above (I, II, III, or “REF” standing for “reference”). “SOL” refers to the solonetz soil solution. Last, “AP” means that the samples were obtained by recollecting them after phenol degradation. For example, “STO_I_SOL_AP” refers to the sample obtained based on the synthesis description provided above following interaction in solonetz soil solution and phenol degradation.
4.3. Characterization of Nanomaterials
X-ray diffraction (XRD) measurements were conducted using a Rigaku Miniflex II (Rigaku, Neu-Isenburg, Germany) diffractometer. The diffraction patterns were recorded over a 2θ° range of 20–70°, with a scan speed of 2°·min−1. The primary crystallite size values were determined using the Scherrer equation [24]:
where:
- L is the crystallite size (nm).
- K is the Scherrer/shape constant, typically around 0.9.
- λ is the wavelength of the X-rays used in the experiment (nm).
- β is the full width at half maximum (FWHM) of the diffraction peak, in radians.
- θ is the Bragg angle (half of the diffraction angle).
The specific surface area of the catalysts was determined by nitrogen adsorption at 77 K with a Micromeritics gas adsorption analyzer (Gemini Type 2375, Micromeritics Instrument Corporation, Norcross, GA, USA). The specific surface area was calculated using the BET method.
The sample morphology was examined with a Hitachi S-4700 Type II scanning electron microscope (SEM, Tokyo, Japan), which was equipped with an Everhart–Thornley detector and operated with an electron beam accelerated to 10 kV.
Infrared (IR) spectroscopy was performed to analyze surface changes on the nanoparticles (NPs) using a Bruker Equinox 55 spectrometer (Billerica, MA, USA). The samples were prepared by pressing KBr powder into pellets, and IR spectra were recorded with a spectral resolution of 2 cm−1 over a wavelength range of 600–4000 cm−1.
Diffuse reflectance spectroscopy (DRS) was employed to study the optical properties of the ENPs using a Jasco V-650 spectrophotometer (Kingsgrove, Australia) in a wavelength range of 300–800 nm. The bandgap energy was calculated using the Kubelka–Munk method [34].
XPS measurements were performed on a SPECS PHOIBOS 150 MCD instrument (Berlin, Germany) with monochromatized Al Kα radiation (1486.69 eV) at 14 kV and 20 mA and pressure of ~5 mbar. The samples were mounted on the sample holder using double-sided adhesive carbon tape. High-resolution Sr3d, Ti2p, and O1s spectra were recorded with a data acquisition rate of 0.05 eV. The analysis of the data was carried out with CasaXPS software version 2.3.25PR1.0. All peaks were deconvoluted using Shirley background and Lorentzian–Gaussian line shapes. The applied value of the Gaussian–Lorentzian ratio was 30.
4.4. Soil Sampling and Solution Preparation
Solonetz alkaline soil samples were taken near Szatymaz (Figure 8) in Hungary at a depth of 20 cm. The samples were dried for 10 days and then sieved with a 2 mm-pore sieve. The soil pH, electrical conductivity (EC), total salt, and organic matter (OM) content were determined following the ISO 10390:2021 standard [35].
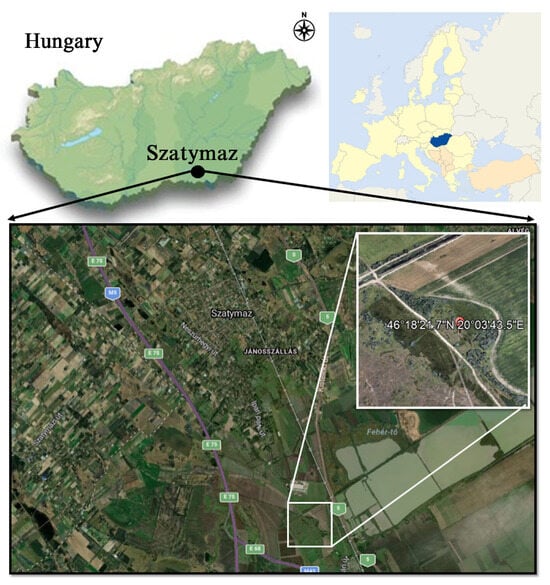
Figure 8.
Localization of the sampling area in Hungary.
The pH was measured with a digital pH meter (Inolab pH 720) with an accuracy of ± 0.05 units in distilled water applying a 1:2.5 soil–water ratio (ISO 10390:2021). The determination of the soil texture was based on the plasticity index values according to Arany (Arany plasticity index). This is calculated from the amount of deionized water added to an air-dry soil sample (100 g) until reaching the upper limit of its plasticity. The electrical conductivity (with an accuracy of ± 10 mS cm−1) and the total salt content were analyzed with an Orion 3-Star conductivity meter (Thermo Electron Corporation, Waltham, MA, USA) in saturated soil samples.
The organic matter (OM) content was determined with a UV-vis spectrophotometer (Spectronic Helios-γ, Thermo Fisher Scientific, Waltham, MA, USA). The OM was oxidized overnight with H2SO4 (95%) and 0.33 M K2Cr2O7 (MSZ-21470–52 1983). The possible error of the measurement is considered to be ± 2%.
To determine the major elemental contents (Na, K, Ca, Mg, Al, Fe, Mn, Zn, Cu, Ni, Co, and As), 0.5 g of the samples were weighed, and 7 mL aqua regia (HNO3/HCl = 1:3) was added. Soil samples were digested in a microwave oven (AntonPaar Multiwave 3000). Element concentrations in the digested samples were determined by an inductively coupled plasma optical emission spectrometer (ICP-OES; Optima 7000 DV, PerkinElmer) with an accuracy of ±10%. The soil parameters are summarized in the Supplementary Information (Table S1).
4.5. Soil Solution and Analysis
The soil solution of each sample was prepared as follows. Milli-Q water was added to the soil samples at a solid-to-solution ratio of 1:2.5. The suspension obtained was shaken for 18 h (40 rpm), centrifuged at 3700 rpm for 30 min, and then filtered with a 0.5 μm-pore cellulose nitrate membrane (VWR Chemicals, Leuven, Belgium).
The pH was measured as described in the previous section. The ionic strength was calculated from the EC values. Chemical oxygen consumption was determined according to the ISO 10390:2021 standards.
The major (Na, K, Ca, Mg, Al, Fe, Mn) and trace (Cu, Zn, Ni, Co, As) element concentrations were measured by ICP-OES, and the anion contents (F−, Cl−, NO3−, NO2−, PO43−) were determined by ion chromatography (IC) and flow injection analysis (FIA).
4.6. Behavior of STO Nanoparticles in Soil Solutions
Suspensions containing 10 g·L−1 STO NPs were prepared using Milli-Q water. Before the adsorption experiments, the STO NP suspensions were ultrasonicated for 10 min.
For the adsorption experiments, 90 mL of soil solution and 10 mL of the stock NP suspension were combined in a volumetric flask and stirred for 3 h. During this time, the pH of the suspensions was monitored every 15 min for the first hour and every 20 min for the remaining two hours. Following the stirring period, the suspensions were centrifuged at 300 rpm for 10 min and then dried for 24 h at 36 °C.
4.7. pH Measurements
Before performing the photocatalytic experiments, the pH of the soil solution was determined as the catalysts were immersed in it. For this purpose, 0.2 g of catalyst was dispersed in 20 mL of H2O, and the suspension was mixed with 180 mL of soil solution. The pH was measured for 3 h (every 15 min in the first hour and every 20 min in the second and third hours), and the results are shown in Figure 9.
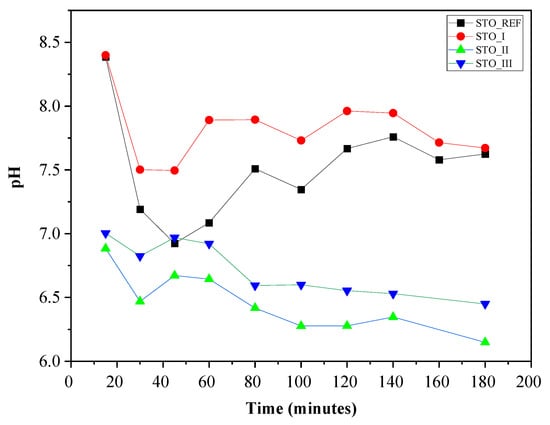
Figure 9.
pH as a function of time following the addition of STO to the soil solution.
It can be observed that the pH changes are similar for STO_I and commercial STO, and stabilize around 7.5. For STO_III and STO_II, the pH stabilizes around 6.5. STO_I contains SrCO3, which is why the pH value shifts to a more basic range. However, the results obtained for STO_II and STO_III are in the acidic region (pH 6.0–6.5), because the surface of nanoparticles can vary with 2.5 pH units while not having SrCO3 [36]. Moreover, based on the literature [36], the isoelectric point variance of STO depends on the particle size (even as large as 7–8 pH), so the high pH of STO_REF can be explained.
4.8. Photocatalytic Activity
The photocatalytic activity of STO NPs was evaluated by phenol degradation. For this purpose, 1 g∙L−1 suspension was prepared containing the model pollutant (c0,phenol = 0.1 mM). The suspension was ultrasonicated and kept for 10 min in the dark to achieve a high degree of homogenization and adsorption–desorption equilibrium (the adsorption of phenol was negligible). The investigation was carried out in a double-walled glass vessel (V = 100 mL) that was surrounded by six fluorescent tubes (Vilber-Lourmat T-6L UV-A, 6 W, Paris, France). Throughout the 3 h of measurements, air was continuously introduced into the suspension to maintain a constant level of dissolved oxygen. The suspensions were stirred in the dark for 10 min before turning on the lamps to allow the adsorption and desorption processes to reach equilibrium. The phenol concentration changes were assessed by high-performance liquid chromatography (HPLC), which consisted of a Merck-Hitachi L-4250 UV-vis detector and a Merck Hitachi L-7100 low-pressure pump (Merck, Darmstadt, Germany; Hitachi, Tokyo, Japan). The cyclic reusability of the base samples was also checked following the first degradation experiment as follows. All the powder was recovered after the experiment via centrifugation at 4400 rpm and the powders were directly introduced into a fresh phenol solution, with the same initial concentration (all the other parameters were also kept constant). The error of the photocatalytic activity assessment process is 2–3%, so in the case of low photoactivity samples, a fluctuation in phenol concentration values is expected.
5. Conclusions
Exposing semiconductor nanoparticles to environmental conditions using laboratory approaches is one way of studying potential scenarios regarding the behavior of nanoparticles in nature. In the present work, solonetz soil solutions were used for this purpose, and their effect on strontium titanate photocatalysts was investigated. It was found that the soil solution influenced the primary crystallite size, bandgap, surface composition, and morphology of the nanoparticles, changing their semiconductive properties. This resulted in enhanced photocatalytic activity in nearly all cases. This means that strontium titanates do not become inactivated under such environmental conditions, possibly leading to unwanted environmental effects. This finding warrants further investigation to better evaluate the risks associated with these perovskite nanomaterials. Moreover, the results here can point out a specific methodology that can be applied to verify the environmentally friendly nature of solar light-active photocatalysts.
Supplementary Materials
The following supporting information can be downloaded at https://www.mdpi.com/article/10.3390/catal15070608/s1. Figure S1: XRD patterns for the STO_II (a) and STO_III (b) in phenol, solonetz soil, and solonetz soil with phenol; Figure S2: IR spectra of STO_II and STO_III in solonetz soil and solonetz soil with phenol; Figure S3: SEM micrographs of STO_II and STO_III photocatalysts; Figure S4: DRS diffractometer of STO_II; Figure S5: DRS diffractometer of STO_III; Figure S6: XPS core spectra of sample STO_REF: Sr 3d (a), Ti 2p (b), O 1s (c) and C 1s (d). Table S1: Physicochemical properties and ionic content of the soil solution; Table S2: Properties of the samples.
Author Contributions
B.A.: conceptualization, investigation, writing, editing; J.C.: investigation; K.S.: conceptualization, investigation, writing, editing; T.G.: investigation, writing—review and editing; Z.-R.T.: investigation; Z.K.: resources, funding acquisition; Á.K.: resources, funding acquisition; G.V.: conceptualization, writing—review and editing; Z.P.: conceptualization, supervision, writing—review and editing, resources, funding acquisition. All authors have read and agreed to the published version of the manuscript.
Funding
T. Gyulavári acknowledges the Bolyai János scholarship (BO/00447/23) provided by the Hungarian Academy of Sciences. The authors are grateful for the financial support of 2021-1.2.6-TÉT-IPARI-MA-2022-00009 from the National Research, Development and Innovation Fund.
Data Availability Statement
Data are contained within the article or Supplementary Material.
Conflicts of Interest
The authors declare no conflicts of interest.
Abbreviations
The following abbreviations are used in this manuscript:
| STO | strontium titanate (SrTiO3) |
| STO_REF | pure/reference STO |
| STO_AP | STO after phenol degradation |
| STO_SOL | STO with solonetz soil solution |
| STO_SOL_AP | STO with solonetz soil solution and phenol degradation |
| STO_I | pure/reference STO_I |
| STO_I_AP | STO_I after phenol degradation |
| STO_I_SOL | STO_I with solonetz soil solution |
| STO_I_SOL_AP | STO_I with solonetz soil solution and phenol degradation |
| STO_II | pure/reference STO_II |
| STO_II_AP | STO_II after phenol degradation |
| STO_II_SOL | STO_II with solonetz soil solution |
| STO_II_SOL_AP | STO_II with solonetz soil solution and phenol degradation |
| STO_III | pure/reference STO_III |
| STO_III_AP | STO_III after phenol degradation |
| STO_III_SOL | STO_III with solonetz soil solution |
| STO_III_SOL_AP | STO_III with solonetz soil solution and phenol degradation |
References
- Qian, Y.; Qin, C.; Chen, M.; Lin, S. Nanotechnology in soil remediation—Applications vs. implications. Ecotoxicol. Environ. Safety 2020, 201, 110815. [Google Scholar] [CrossRef]
- Kurade, M.B.; Ha, Y.-H.; Xiong, J.-Q.; Govindwar, S.P.; Jang, M.; Jeon, B.-H. Phytoremediation as a green biotechnology tool for emerging environmental pollution: A step forward towards sustainable rehabilitation of the environment. Chem. Eng. J. 2021, 415, 129040. [Google Scholar] [CrossRef]
- Phoon, B.L.; Lai, C.W.; Juan, J.C.; Show, P.L.; Chen, W.H. A review of synthesis and morphology of SrTiO3 for energy and other applications. Int. J. Energy Res. 2019, 43, 5151–5174. [Google Scholar] [CrossRef]
- Zhang, Q.; Fan, W.; Gao, L. Anatase TiO2 nanoparticles immobilized on ZnO tetrapods as a highly efficient and easily recyclable photocatalyst. Appl. Catal. B Environ. 2007, 76, 168–173. [Google Scholar] [CrossRef]
- Solymos, K.; Babcsányi, I.; Ariya, B.; Gyulavári, T.; Ágoston, Á.; Szamosvölgyi, Á.; Kukovecz, Á.; Kónya, Z.; Farsang, A.; Pap, Z. Photocatalytic and surface properties of titanium dioxide nanoparticles in soil solutions. Environ. Sci. Nano 2024, 11, 1204–1216. [Google Scholar] [CrossRef]
- Simonin, M.; Martins, J.M.; Uzu, G.; Spadini, L.; Navel, A.; Richaume, A. Low mobility of CuO and TiO2 nanoparticles in agricultural soils of contrasting texture and organic matter content. Sci. Total Environ. 2021, 783, 146952. [Google Scholar] [CrossRef] [PubMed]
- Solymos, K.; Kanász, E.; Ágoston, Á.; Gyulavári, T.; Pálffy, B.; Szamosvölgyi, Á.; Kukovecz, Á.; Kónya, Z.; Pap, Z. Impact of different soil solutions on the stability and photocatalytic activity of commercial zinc oxide nanoparticles. Environ. Sci. Nano 2025, 12, 1328–1339. [Google Scholar] [CrossRef]
- Qamar, M.; Gondal, M.; Yamani, Z. Synthesis of highly active nanocrystalline WO3 and its application in laser-induced photocatalytic removal of a dye from water. Catal. Commun. 2009, 10, 1980–1984. [Google Scholar] [CrossRef]
- Dong, W.; Zhu, C. Optical properties of surface-modified Bi2O3 nanoparticles. J. Phys. Chem. Solids 2003, 64, 265–271. [Google Scholar] [CrossRef]
- Cornelis, G.; Pang, L.; Doolette, C.; Kirby, J.K.; McLaughlin, M.J. Transport of silver nanoparticles in saturated columns of natural soils. Sci. Total Environ. 2013, 463, 120–130. [Google Scholar] [CrossRef]
- Moss, B.; Wan, Q.; Butler, K.T.; Grau-Crespo, R.; Selim, S.; Regoutz, A.; Hisatomi, T.; Godin, R.; Payne, D.J.; Kafizas, A.; et al. Linking in situ charge accumulation to electronic structure in doped SrTiO3 reveals design principles for hydrogen-evolving photocatalysts. Nat. Mater. 2021, 20, 511–517. [Google Scholar] [CrossRef] [PubMed]
- Bhan, C.; Kumar, N.; Elangovan, V. Microplastics pollution in the rivers, its source, and impact on aquatic life: A review. Int. J. Environ. Sci. Technol. 2024, 22, 1937–1952. [Google Scholar] [CrossRef]
- Sarijan, S.; Azman, S.; Said, M.I.M.; Jamal, M.H. Microplastics in freshwater ecosystems: A recent review of occurrence, analysis, potential impacts, and research needs. Environ. Sci. Pollut. Res. 2021, 28, 1341–1356. [Google Scholar] [CrossRef]
- Siddiqi, K.S.; Husen, A. Plant response to engineered metal oxide nanoparticles. Nanoscale Res. Lett. 2017, 12, 92. [Google Scholar] [CrossRef]
- Fazeli Sangani, M.; Owens, G.; Fotovat, A. Transport of engineered nanoparticles in soils and aquifers. Environ. Rev. 2019, 27, 43–70. [Google Scholar] [CrossRef]
- Peralta-Videa, J.R.; Zhao, L.; Lopez-Moreno, M.L.; de la Rosa, G.; Hong, J.; Gardea-Torresdey, J.L. Nanomaterials and the environment: A review for the biennium 2008–2010. J. Hazard. Mater. 2011, 186, 1–15. [Google Scholar] [CrossRef] [PubMed]
- Rizwan, M.; Ali, S.; Qayyum, M.F.; Ok, Y.S.; Adrees, M.; Ibrahim, M.; Zia-ur-Rehman, M.; Farid, M.; Abbas, F. Effect of metal and metal oxide nanoparticles on growth and physiology of globally important food crops: A critical review. J. Hazard. Mater. 2017, 322, 2–16. [Google Scholar] [CrossRef]
- Cañas, J.E.; Qi, B.; Li, S.; Maul, J.D.; Cox, S.B.; Das, S.; Green, M.J. Acute and reproductive toxicity of nano-sized metal oxides (ZnO and TiO2) to earthworms (Eisenia fetida). J. Environ. Monit. 2011, 13, 3351–3357. [Google Scholar] [CrossRef]
- Chai, H.; Yao, J.; Sun, J.; Zhang, C.; Liu, W.; Zhu, M.; Ceccanti, B. The effect of metal oxide nanoparticles on functional bacteria and metabolic profiles in agricultural soil. Bull. Environ. Contam. Toxicol. 2015, 94, 490–495. [Google Scholar] [CrossRef]
- Smita, S.; Gupta, S.K.; Bartonova, A.; Dusinska, M.; Gutleb, A.C.; Rahman, Q. Nanoparticles in the environment: Assessment using the causal diagram approach. Environ. Health 2012, 11, S13. [Google Scholar] [CrossRef]
- Lee, W.-M.; Kim, S.W.; Kwak, J.I.; Nam, S.-H.; Shin, Y.-J.; An, Y.-J. Research trends of ecotoxicity of nanoparticles in soil environment. Toxicol. Res. 2010, 26, 253–259. [Google Scholar] [CrossRef] [PubMed]
- Joseph, B.; Gladis, R.; Aparna, B.; JS, B. Amelioration of Acidity and Iron Toxicity in Lateritic Lowland Rice Soil using Non-Conventional Sources of Calcium. Int. J. Chem. Stud. 2020, 8, 2041–2044. [Google Scholar] [CrossRef]
- Rossel, R.V.; Walvoort, D.; McBratney, A.; Janik, L.J.; Skjemstad, J. Visible, near infrared, mid infrared or combined diffuse reflectance spectroscopy for simultaneous assessment of various soil properties. Geoderma 2006, 131, 59–75. [Google Scholar] [CrossRef]
- Holzwart, U.; Gibson, N. The Scherrer equation versus the ‘Debye-Scherrer equation’. Nat. Nanotechnol. 2011, 6, 534. [Google Scholar] [CrossRef]
- Libnau, F.O.; Kvalheim, O.M.; Christy, A.A.; Toft, J. Spectra of water in the near- and mid-infrared region. Vib. Spectrosc. 1994, 7, 243–254. [Google Scholar] [CrossRef]
- Seo, S.S.A.; Lee, H.N.; Noh, T.W. Infrared spectroscopy of CaTiO3, SrTiO3, BaTiO3, Ba0.5Sr0.5TiO3 thin films, and (BaTiO3)5/(SrTiO3)5 superlattice grown on SrRuO3/SrTiO3(001) substrates. Thin Solid Film. 2005, 486, 94–97. [Google Scholar] [CrossRef]
- Smith, B.C. The C=O Bond, Part VI: Esters and the Rule of Three. Spectroscopy 2018, 33, 20–23. [Google Scholar]
- Smith, B.C. Organic Nitrogen Compounds III: Secondary and Tertiary Amines. Spectroscopy 2019, 34, 22–26. [Google Scholar]
- Oades, J.M. An introduction to organic matter in mineral soils. Miner. Soil Environ. 1989, 1, 89–159. [Google Scholar]
- Pap, Z.; Karácsonyi, É.; Cegléd, Z.; Dombi, A.; Danciu, V.; Popescu, I.; Baia, L.; Oszkó, A.; Mogyorósi, K. Dynamic changes on the surface during the calcination of rapid heat treated TiO2 photocatalysts. Appl. Catal. B Environ. 2012, 111, 595–604. [Google Scholar] [CrossRef]
- Mylsamy, S.; Karazhanov, S.; Subramanian, B. Lattice distortion-driven band gap engineering and enhanced electrocatalytic activity of Mn-substituted nanostructured SrTiO3 materials: A comprehensive investigation. Chemosphere 2024, 346, 140577. [Google Scholar] [CrossRef] [PubMed]
- Vasquez, R.P. SrTiO3 by XPS. Surf. Sci. Spectra 1992, 1, 129–135. [Google Scholar] [CrossRef]
- Boga, B.; Steinfeldt, N.; Moustakas, N.G.; Peppel, T.; Lund, H.; Rabeah, J.; Pap, Z.; Cristea, V.M.; Strunk, J. Role of SrCO3 on Photocatalytic Performance of SrTiO3-SrCO3 Composites. Catalysts 2022, 12, 978. [Google Scholar] [CrossRef]
- Alcaraz de la Osa, R.; Iparragirre, I.; Ortiz, D.; Saiz, J. The extended Kubelka–Munk theory and its application to spectroscopy. ChemTexts 2020, 6, 2. [Google Scholar] [CrossRef]
- ISO 10390:2021; Soil, Treated Biowaste and Sludge—Determination of pH. ISO: Geneva, Switzerland, 2021.
- Zhang, M.; Salvador, P.A.; Rohrer, G.S. Influence of pH and surface orientation on the photochemical reactivity of SrTiO3. ACS Appl. Mater. Interfaces 2020, 12, 23617–23626. [Google Scholar] [CrossRef]
Disclaimer/Publisher’s Note: The statements, opinions and data contained in all publications are solely those of the individual author(s) and contributor(s) and not of MDPI and/or the editor(s). MDPI and/or the editor(s) disclaim responsibility for any injury to people or property resulting from any ideas, methods, instructions or products referred to in the content. |
© 2025 by the authors. Licensee MDPI, Basel, Switzerland. This article is an open access article distributed under the terms and conditions of the Creative Commons Attribution (CC BY) license (https://creativecommons.org/licenses/by/4.0/).