Abstract
Solar glycerol photoreforming was investigated on Au-Ni/CeO2 photocatalysts with an overall metal content equal to 1wt% and different Au/Ni weight ratios. The deposition of gold over ceria was performed by two different methods, deposition–precipitation and photoreduction. Deposition–precipitation was the best method to deposit gold on CeO2 with the formation of small Au nanoparticles (around 4 nm). The most active sample (0.9 wt% Au-0.1 Ni wt%/CeO2) provided a H2 production rate of 350 µmol/gcat∙h, much higher than the corresponding monometallic samples. A higher amount of Ni led to detrimental effects in H2 production, likely due to the covering of the gold surface active sites by Ni. On the contrary, the presence of a small amount of Ni (0.1 wt%) allowed a remarkable improvement of the Au/CeO2 photocatalytic stability after consecutive runs of simulated solar irradiation. This finding, as well as the activation of synergistic effects, the improved charge carrier separation, and the exploitation of the localized surface plasmon resonance property of gold, led to the proposal of an alternative photocatalytic system to the most investigated TiO2-based photocatalysts for H2 production. The enhanced stability is promising to further foster the investigation of these photocatalysts applied to sustainable H2 production.
1. Introduction
The global energy crisis is one of the most urgent current challenges and requires the development of more efficient methods to generate clean energy sources. Sustainable hydrogen (H2) production could be a viable alternative to traditional energy sources, exploiting the high potential of this important energy vector [1,2]. Among the various methods for generating H2, water splitting via solar-driven photocatalysis stands out as a promising approach [3,4,5]. However, conventional photocatalysts have several disadvantages that limit their effectiveness in H2 production. In particular, the low quantum yields of water splitting caused by the substantial thermodynamic barrier of the oxygen evolution reaction (ΔE0 = −1.23 V), the fast recombination of photogenerated charge carriers, and the presence of reverse reactions significantly reduce the overall efficiency of the process [6,7]. Since the discovery of Kawai and Sakata, who observed that irradiating TiO2 catalyst suspensions in a methanol–water mixture with a xenon lamp led to high rates of H2 production [8], researchers have focused on optimizing conditions for H2 generation using similar methods with aqueous suspensions of various biomass-derived substances, such as sugars, cellulose, algae, wood, and ethanol [9,10,11,12]. For these reasons, to further enhance the efficiency of photocatalytic H2 production, an alternative approach combines the water splitting reaction with the photocatalytic oxidation of organic molecules, using biomass or its derivatives as substrates. These substrates (hole scavengers) replace the oxygen evolution reaction by consuming photoexcited holes (h+), thereby improving the overall efficiency. This process is known as biomass photoreforming. Using this approach, a photocatalyst, upon light excitation, produces h+ to oxidize the biomass-derived substrates, while the resulting electrons (e−) reduce protons (H+) in water to produce H2 [13,14]. Compared to overall water splitting, the photoreforming reaction showed important improvements, with an enhanced charge carrier separation and a higher H2 production. The hydrogen indeed can be further evolved, also from the oxidation of the employed organic scavenger [13,14].
Glycerol, the main by-product of biodiesel production, has emerged as a particularly interesting substrate for photocatalytic reforming [15,16]. The widespread availability of glycerol, combined with its role as an efficient electron donor, makes it a promising candidate for sustainable H2 production. Besides improving the separation of charge carriers, enhancing the overall H2 generation efficiency, it also offers the possibility of generating valuable chemicals during the oxidation process. Additionally, the use of glycerol mitigates some of the challenges associated with lignocellulose by providing a simpler, more reactive substrate that requires less energy to be broken down [17]. Moreover, compared to other biomass-derived organic substrates used as sacrificial agents in photoreforming reactions, glycerol facilitates a more efficient hydrogen production, yielding seven moles of H2 for each mole of glycerol (reaction (1)):
C3H8O3 + 3H2O → 7H2 + 3CO2
Among the several semiconductors able to perform this reaction, TiO2 is one of the most widely used photocatalysts [18,19,20,21], despite its disadvantages such as its wide bandgap, which restricts absorption to UV radiation, and the rapid recombination of electron–hole pairs (e−/h+). For this reason, several catalysts have been developed. The most common approaches include coupling TiO2 with other semiconductors that can absorb visible light to form heterojunctions, or incorporating noble metals like Pt, Au, Ru, or Rh on its surface to trap photoexcited electrons and thereby reduce the e−/h+ recombination rate [22,23]. Furthermore, in the last years, research on alternative photocatalysts over the conventional TiO2-based materials is a considerable hot topic [24,25,26].
In this context, replacing TiO2 with CeO2 can offer additional advantages [24,25,26]. On the basis of the peculiar preparation procedures adopted, cerium oxide can have a narrower bandgap than TiO2, allowing it to absorb more efficiently in the visible light region. Moreover, CeO2 possesses high oxygen storage capacity and the ability to switch between Ce3⁺ and Ce4⁺ oxidation states. Such redox properties can enhance its photocatalytic performance by improving charge separation and reducing recombination [24,25,26]. This makes CeO2 particularly promising for applications like glycerol photoreforming.
In this study, we focused on a comparative analysis of glycerol photoreforming under simulated solar light using different bimetallic catalysts, specifically Au-Ni/CeO2. This approach leverages the promoting effect of nickel on gold to enhance photocatalytic activity. Indeed, the addition of gold nanoparticles (Au NPs) to photocatalysts offers substantial improvements in photocatalytic efficiency due to their unique electronic and optical features. Au NPs exhibit a high work function and a strong localized surface plasmon resonance (LSPR) effect, which contribute to enhanced visible light absorption and the efficient separation of photogenerated electron–hole (e−-h⁺) pairs. The high work function of Au facilitates charge transfers, reducing recombination rates, while its LSPR effect creates a large local electric field and tunable resonance wavelengths [27,28].
Moreover, the addition of nickel (Ni) nanoparticles in a bimetallic system offers additional benefits, such as efficient C–C bond cleavage and reduced material costs [29,30]. Additionally, we explore two synthesis methods for gold deposition in deposition–precipitation and photoreduction, aiming to evaluate their impact on the photocatalytic performance.
2. Results and Discussion
The hydrothermal method was used to synthesize CeO2, while two methods were employed to deposit gold particles, the deposition–precipitation and the solar photoreduction methods. Ni was added by wetness impregnation.
2.1. Photocatalytic Activity in the Solar Glycerol Photoreforming Reaction
Figure 1 reports the H2 production rates of the investigated photocatalysts. Gold was deposited by the deposition–precipitation method and by photoreduction. As expected, the bare CeO2 showed negligible photocatalytic activity, as well as the 1% Ni/CeO2. On the contrary, the addition of gold boosted up the H2 production due to the activation under simulated solar irradiation of LSPR effects, with the generation of hot electrons that enhanced the H+ reduction to H2, also improving the charge carrier separation [31,32].
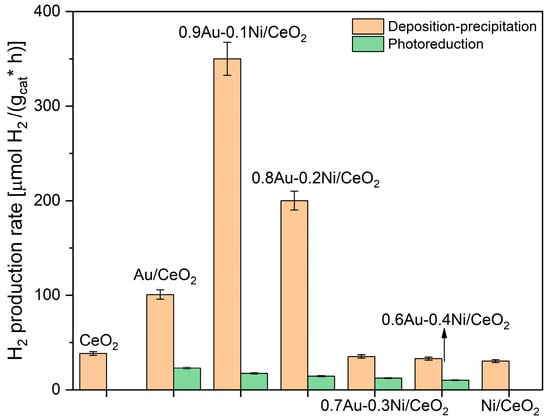
Figure 1.
H2 production rates of the investigated photocatalysts for the solar glycerol photoreforming reaction.
In the present work, the best preparation method for Au deposition on CeO2 was deposition–precipitation, whereas the photoreduction did not allow an efficient gold deposition/nickel interaction. Moreover, the eventual presence of chlorides, as contaminants of these samples, and the use of a large amount of ethanol, as the organic scavenger, can be detrimental for the properties of the deposited metals [33].
Therefore, from this point onward, the discussed catalysts will be only those where gold was deposited by deposition–precipitation. Interestingly, the bimetallic 0.9Au-0.1Ni/CeO2 sample showed a further enhancement in H2 production, likely due to the activation of synergistic effects between the two metals. Moreover, this composition (0.9Au-0.1 Ni wt.%) corresponds to the best amounts of the two metals to exploit their synergy; indeed, a higher loading of nickel led to a decrease of activity, likely due to a growing covering of the Au active sites.
On the highest performing catalyst (0.9Au-0.1Ni/CeO2) and on the monometallic Au sample, the photocatalytic stability after five consecutive runs (Figure 2) was evaluated. Before each run, the samples were centrifugated, dried under vacuum at room temperature, weighted, and re-used without further treatments.
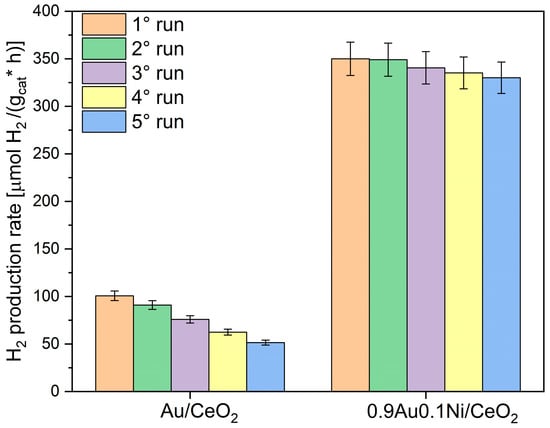
Figure 2.
H2 production rates of the investigated photocatalysts for the solar glycerol photoreforming reaction, during five consecutive runs (each run was of 5 h of simulated solar irradiation).
The photocatalytic activity of Au/CeO2 started to decrease since the second run; in the fifth run, it declined by about 50% with respect to the first run. This can be ascribed to the gradual aggregation of gold particles caused by the prolonged runs of solar irradiation [18,34]. This detrimental effect was limited in the presence of Ni at the optimal amount (0.1 wt.%). Indeed, the 0.9Au-0.1Ni/CeO2 showed an improved stability, with a loss of activity after the fifth run of only 6%. The presence of Ni in this case can prevent the gold particles sintering [35,36].
2.2. Photocatalysts’ Characterization: Textural and Structural Properties
The best catalysts (Au added by deposition–precipitation, with the two most active compositions of the bimetallic samples, i.e., 0.9Au-0.1 Ni and 0.8Au-0.2 Ni wt.%) were characterized by low-temperature nitrogen adsorption and X-ray diffraction (XRD) to evaluate and compare the textural and structural properties. The morphology was investigated with HRTEM, whereas the optical properties were assessed by UV-DRS measurements.
Table 1 presents the values of the specific surface area (SSA) and total pore volume of the samples determined by N2 adsorption/desorption data at the temperature of liquid nitrogen.

Table 1.
Specific surface area (SSA), total pore volume (V), and optical band gap (Eg) of the investigated photocatalysts.
Pure CeO₂ exhibits the highest specific surface area (SSA) of 273.5 m2/g, whereas in the other catalysts a decrease is observed, depending on the catalyst composition. Generally, the introduction of metal species and the calcination treatment at which the catalyst is subjected (250 °C for 3 h in the present work) may lead to a lowering in surface area due to particle agglomeration and pore obstruction. In particular, the Ni/CeO2 catalyst shows a significant decrease in surface area (90.6 m2/g), likely due to the blockage of the ceria porous structure by Ni particles, according with the decrease of the pore volume. Furthermore, it is known that Ni tends to form larger aggregates, which not only occupy the pores but also contribute to sintering effects, further reducing the accessible surface area [37]. In contrast, the decrease in surface area observed for Au/CeO2 (153.5 m2/g) is less pronounced, likely because gold nanoparticles covered a lower specific surface area compared to Ni, thus limiting the blockage of the CeO2 pores. Consequently, in the bimetallic samples, the rising amount of Ni caused a decrease of the surface area. However, although the 0.9Au-0.1Ni/CeO2 showed a surface area (148 m2/g) lower than that of Au/CeO2, it exhibited the highest performance in the H2 production by glycerol photoreforming (Figure 1). This finding points out that the variation in the textural properties did not significantly influence the photocatalytic activity, unlike other key parameters such as the synergistic effects between gold and nickel that promote the charge carrier separation and enhance the solar activation of the photocatalysts.
2.3. XRD Analysis
The XRD patterns presented in Figure 3 correspond to the CeO2, Ni/CeO2, Au/CeO2, and bimetallic Au-Ni/CeO2 samples with different Au/Ni ratios. The diffraction peaks of pure CeO2 exhibit characteristic reflections at approximately 28.5°, 33.0°, 47.5°, and 56.3°, corresponding to the fluorite cubic structure of CeO2 (ICSD #24887).
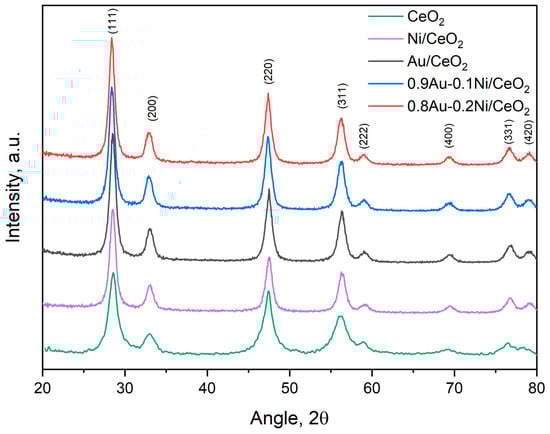
Figure 3.
XRD patterns of the investigated photocatalysts (Au added by the deposition–precipitation method).
The XRD analyses of the Ni/CeO2 and Au/CeO2 samples do not reveal any additional Au- or Ni-based phases. This is likely due to the low Au and Ni content combined with the high dispersion of these phases. Similarly, in the bimetallic Au-Ni/CeO2 samples, no distinct peaks corresponding to NiO or separate Au phases are visible. It is reported in the literature that the the incorporation of Ni2⁺ into the CeO2 lattice, likely through partial substitution of Ce4⁺ due to their similar ionic radii, leads to a contraction of the CeO2 structure along with an enlargement of the peaks due to an increase of the crystallographic disorder [38]. The formation of solid solutions where ionic gold species are strongly interacting with the support or stabilized into the ceria lattice are also reported in the literature [39,40]. Depending on the Au oxidation state and ionic radius, the ceria cell volume can increase or decrease with a consequent shift of the crystalline peaks. In our case, no evident shifts of the ceria peaks were observed in the monometallic samples, nor in the bimetallic ones, probably due to the low amount of Ni and in accordance with the formation of small Au nanoparticles (as detected by HRTEM), likely in the metallic state (as verified by XPS). The only noticeable effect is that the peaks of the pure ceria are broader than those of the other samples; this is consistent with the larger surface area of the ceria, which, in the other catalysts, instead decreases (Table 1).
2.4. UV-DRS Analysis
Figure 4 reports the UV-DRS of the examined catalysts. It is possible to note that the Au-containing samples showed the typical band of the LSPR at about 550 nm. The correlation between the LSPR band and the gold size is affected by the dielectric constant of the surrounding medium [41,42]; then, when Au is deposited on an oxide (such as TiO2 or CeO2), the wavelength of the LSPR band is almost independent of the Au particle size (in the range of 3–20 nm) [41,42], contrary to what is observed for unsupported gold (e.g., in a colloidal solution). The optical band gaps (Eg) of the samples were evaluated by plotting the modified Kubelka–Munk function vs. hν (Tauc plot) [43]. No substantial variation was measured among the investigated samples, with the Eg being in the range of 3.1–3.2 eV (Table 1).
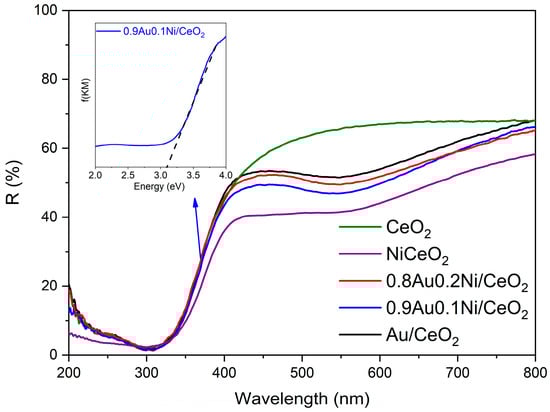
Figure 4.
UV-DRS spectra of the investigated photocatalysts (Au added by the deposition–precipitation method). In the inset, the evaluation of the optical band gap by Tauc plot for the 0.9Au-0.1 Ni/CeO2 catalyst is presented as a representative sample.
2.5. HRTEM Analysis
Figure 5 shows the HRTEM micrographs of the bare CeO2 and of the sample with the best photocatalytic performance (0.9Au-0.1Ni/CeO2). For the bare CeO2 sample, the observed morphology consists of nanorods approximately 57 nm long and about 7 nm wide. The morphology observed for this solid is similar to the one found in the literature for ceria and Y-doped CeO2 samples synthesized with comparable experimental procedures [44,45]. In accordance with the literature, such a nanorod-like structure may contribute to the high surface area of this sample (273.5 m2/g).
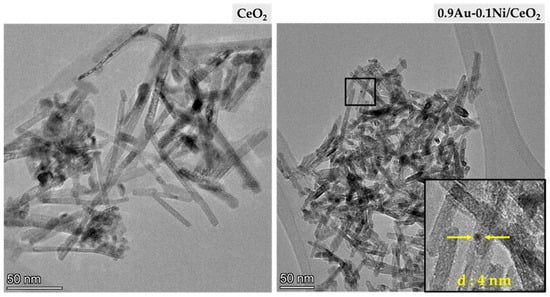
Figure 5.
HRTEM micrographs of bare CeO2 (left) and 0.9Au-0.1Ni/CeO2 (right).
The average size of the metal nanoparticles incorporated on CeO2 was also studied with this technique. Due to the very low amount of Ni incorporated (0.1 wt.%), this element could not be observed through transmission microscopy, and it was assumed that the metal nanoparticles found were gold. The study of the particle size distribution showed that the average Au size was around 4.3 nm. The distribution histograms of the Au average size and the length of the CeO2 nanorods are shown in Figure 6.
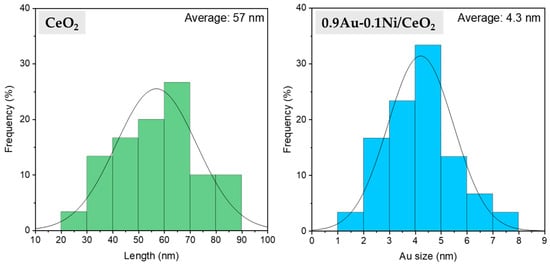
Figure 6.
HRTEM nanorod length distribution of bare CeO2 (left) and particle size distribution of 0.9Au-0.1Ni/CeO2 (right).
The surface properties of the best catalyst (0.9Au-0.1Ni/CeO2 prepared by deposition–precipitation) were determined by X-ray photoelectron spectroscopy (XPS). Figure 7a shows the XPS spectrum in the Au 4f binding energy region. As reported [46,47], the Au 4f7/2,5/2 spin–orbit components at 83.7 and 87.3 eV (3.7 eV spin–orbit coupling), are typical of Au in the metallic state.
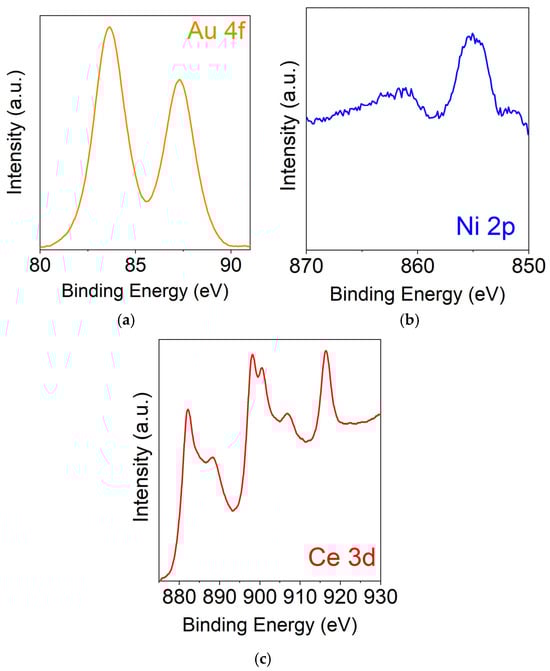
Figure 7.
XPS spectra of the 0.9Au-0.1Ni/CeO2 sample: in the Au 4f binding energy region (a); in the Ni 2p binding energy region (b); and in the Ce 3d binding energy region (c).
In Figure 7b are illustrated the signals in the Ni 2p zone. The main peak at 855.1 eV (Ni 2p3/2) is characteristic of Ni2+ species interacting with CeO2 [48,49].
The Ce 3d binding energy region shows a large envelope consisting of six different peaks (Figure 7c). The signals at 881.9, 888.1, and 898.2 eV are related to the Ce 3d5/2 states, whereas those at 900.5, 907.4, and 916.7 are due to the Ce 3d3/2 states. The peaks at 882.1, 888.4, and 898.2eV are attributed to the Ce4+ electronic states, and the other peaks are associated to Ce4+. There is no evidence of any Ce3+ states, thus excluding a possible reduction of cerium oxide [50,51].
Although a quantitative comparison between the various CeO2-based photocatalysts reported in the literature for solar photoreforming is very tricky due to the different experimental setups used by the various research groups, the present Au-Ni/CeO2 samples showed a good H2 production in comparison with the literature (Table 2). In general, to promote a detectable H2 evolution, CeO2-based photocatalysts require both structural and chemical modifications to work under solar irradiation. Recently, Farhan et al. [52] prepared a heterostructure catalyst, made by N-doped CeO2 combined with ZnIn2S4, able to produce 798 µmolH2/gcat∙h. However, such remarkable H2 production was reached only with a complex S-scheme heterostructure and using inorganic scavengers (Na2SO3/Na2S).
In our case, the addition of a very small amount of Ni on Au/CeO2 significantly enhanced the photocatalyst stability (Figure 2), preventing the gold nanoparticles’ agglomeration. Moreover, the improved charge carrier separation [53] allowed exploitation of the synergistic effects compared to the monometallic samples, with the hydrogen production of the best sample (0.9Au-0.1Ni/CeO2) being higher than the sum of the corresponding monometallic photocatalysts (Figure 1).
Table 2.
Solar photocatalytic H2 production comparison data on CeO2-based samples.
Table 2.
Solar photocatalytic H2 production comparison data on CeO2-based samples.
| Sample | Experimental Conditions | Irradiation Source | H2 Production (µmol/gcat∙h) | Ref. |
|---|---|---|---|---|
| 0.9Au-0.1Ni/CeO2 | 20% (v/v) solution of glycerol in water | 300 W, 10.7 mW/cm2 solar lamp | 350 | This work |
| CeO2-rGO-Au | 10% (v/v) solution of glycerol in MilliQ water | 150 W Xe lamp solar simulator | 270 | [25] |
| CeO2/C quantum dots | 100 mL of water containing 10 vol% methanol | 300 W, 50 mW/cm2 Xe lamp | 60 | [54] |
| N-doped CeO2@ZnIn2S4 | 50 mL aqueous solution having 0.25 M Na2SO3 and 0.35 M Na2S | 300 W Xe lamp | 798 | [52] |
| CeO2/MoS | 100 mL aqueous solution containing 0.3 M Na2SO3/Na2S | 150 W Xe arc lamp (>400 nm) | 125 | [55] |
3. Materials and Methods
3.1. Sample Preparation
Bare CeO2 was prepared according to a published procedure [45], starting from Ce(NO3)3·6H2O using a hydrothermal method. In the synthesis process, cerium nitrate hexahydrate and a solution of sodium hydroxide (NaOH 2.5 M) were mixed in 30 mL of distilled water. Then, the solution was stirred at room temperature for 30 min. Afterward, it was transferred to a Teflon-lined autoclave (Techinstro, Nagpur, Maharashtra, India) which was maintained at a constant temperature of 120 °C for 20 h. Successively, after cooling at room temperature, the final product was collected from the autoclave and washed several times with distilled water and ethanol. The resultant powder was dried at 60 °C for 12 h. The dried sample was calcinated at 400 °C for 4 h with a rate of 2 °C/min.
The gold was added on ceria-based samples in order to obtain the 1 wt% amount of gold using two techniques: the deposition–precipitation method and photoreduction using HAuCl4∙4H2O as precursor. In the deposition–precipitation method, an appropriate volume of HAuCl4 solution (0.01 g/mL) was added into the suspension of CeO2 above, prepared under vigorous stirring, K2CO3 (0.5 mol/L) was used to adjust the pH until it reached 9.0, the slurry was stirred at 65 °C for 12 h, and then the precipitate was washed with distilled water to eliminate the chlorides. The obtained powder was dried at 80 °C overnight. A portion, as dried, was used for Ni deposition by wetness impregnation (see below), and another portion was calcined at 250 °C for 3 h in order to obtain the final Au/CeO2 catalyst. For the photoreduction technique, as-prepared ceria was added to 40 mL of absolute ethanol with the stoichiometric volume of HAuCl4 in aqueous solution. This slurry was put inside in a batch reactor and purged with argon for 1 h in order to remove the oxygen. Then, the slurry was irradiated for 2 h with a solar lamp (OSRAM Vitalux, OSRAM Opto Semiconductors GmbH, Leibniz, Regensburg Germany, 300 W, irradiance of 10.7 mW/cm2) [56]. Finally, the powder was dried at 80 °C and used as-is. A portion of the so-prepared catalyst was used for Ni deposition, as described below.
Ni was added to ceria and to the above prepared Au/CeO2 samples (dried portions) by the wetness impregnation method, using the stoichiometric amount ofNi(NO3)2∙6H2O, dissolved in distilled water, in order to obtain 1 wt% Ni-CeO2 and Au-Ni/CeO2 with different wt% (0.9/0.1; 0.8/0.2; 0.7/0.3; and 0.6/0.4, respectively). Finally, the obtained monometallic Ni/CeO2 and the bimetallic samples were calcined at 250 °C for 3 h.
3.2. Photocatalytic Tests
The photocatalytic hydrogen production was conducted under simulated solar irradiation using a solar lamp (OSRAM Vitalux, OSRAM Opto Semiconductors GmbH, Leibniz, Regensburg Germany, 300 W, irradiance of 10.7 mW/cm2) and with a home-made Pyrex jacketed reactor maintained at 30 °C. In these experiments, 50 mg of powder were added to 50 mL of a water–glycerol solution (40 mL and 10 mL, respectively) under constant stirring. The reaction mixture was purged for 1 h with argon to remove the oxygen, and then the solar lamp was turned on for 5 h. The hydrogen production was measured with a gas chromatograph (Agilent 6890, Agilent Technologies, Santa Clara, CA, USA) equipped with a packed column (Carboxen 1000) (Supelco Inc, 595 North Harrison Road Bellefonte, PA, USA) and a TCD detector. For the H2 quantification, a 1 mL aliquot of reaction gases was withdrawn using a syringe (Hamilton Gastight 1001, Hamilton, Bonaduz AG, Switzerland) and injected in the GC.
3.3. Characterization Techniques
Specific surface areas and pore volumes were determined from N2 adsorption–desorption isotherms at −196 °C using Micromeritics ASAP 2020 equipment, through the Brunauer–Emmett–Teller (BET) method in the standard pressure range 0.05–0.3 P/P0. Before the measurements, the samples were degassed at 250 °C for 2 h.
The crystalline structure of the catalyst was determined by registering powder X-ray diffraction patterns (XRDs), performed on a Bruker D5000 diffractometer (Bruker AXS GmbH, Karlsruhe, Germany) equipped with a Cu K anode and graphite monochromator. The data were recorded in the 20–80° 2θ range with a step size of 0.05 and time per step of 20 s. The crystalline phases were analyzed according to ICSD files (Inorganic Crystal Structure Database, FIZ Karlsruhe) (Bruker AXS GmbH, Karlsruhe, Germany).
The UV–Vis DRS (Diffuse Reflectance Spectroscopy) spectra were carried out with a JASCO V-670 (JASCO Europe Srl, Cremella, Italy). The optical band gap of the samples (Eg) was evaluated by graphing the modified Kubelka–Munk function vs. the hν [43].
High-Resolution Transmission Electron Microscopy (HRTEM) was carried out on a ThermoScientific Talos F200i (Waltham, MA, USA) microscope that operated at 200 kV at the Central Service for Research Support (SCAI) of the University of Córdoba. HRTEM micrographs were used to determine the length of CeO2 nanorods as well as average Au particle size using the software ImageJ (V.1.54m) [57].
The X-ray photoelectron spectroscopy (XPS) measurements were carried out with a K-alpha X-ray photoelectron instrument (Thermo Fisher Scientific, Waltham, MA, USA), employing the C 1s peak at 284.9 eV (of adventitious carbon) as reference.
4. Conclusions
Au-Ni/CeO2 samples were prepared to investigate the most effective gold deposition method and the optimal nickel content for hydrogen production via simulated solar-light glycerol photoreforming. The sample containing 0.9 wt.% Au and 0.1 wt.% Ni on CeO2 exhibited the highest H2 evolution, while increasing the Ni content resulted in detrimental effects. The best method for the deposition of gold was deposition–precipitation, which allowed obtaining Au nanoparticles with a size of about 4 nm. The presence of small amounts of Ni (0.1 wt.%) prevented the gold nanoparticles’ agglomeration, resulting in a stable photocatalyst after consecutive runs of simulated solar irradiation. The proposed bimetallic sample represents a valuable alternative to the most used Au or Pt/TiO2 photocatalysts, thanks to using a low amount of gold and proposing other semiconductor systems such as cerium oxide. Furthermore, the presence of Ni enhanced the stability of the Au/CeO2 photocatalyst, overcoming one of the major drawbacks of the gold-based photocatalysts that limits their application.
Author Contributions
Conceptualization, R.F., E.L.G., L.F.L. and S.S.; methodology, R.F., M.C.H.B., F.J.U.N. and E.L.G.; investigation, E.L.G., M.T.A.I., M.C.H.B. and R.F.; resources, L.F.L., F.J.U.N. and S.S.; data curation, R.F., E.L.G. and M.C.H.B.; writing—original draft preparation, R.F. and E.L.G.; writing—review and editing, R.F., M.C.H.B., F.J.U.N., L.F.L. and S.S.; supervision, R.F., F.J.U.N., L.F.L. and S.S. All authors have read and agreed to the published version of the manuscript.
Funding
Part of this research was funded by MCIU/AEI/10.13039/501100011033 y FEDER, UE (Project PID2022-142275OB-I00) and by the projects “NEST—Network 4 Energy Sustainable Transition” (CUP B53C22004060006) and PNRR AdP ENEA-CNR (CUP B93C22000630006).
Data Availability Statement
The data presented in this study are available on request from the corresponding author.
Acknowledgments
E. La Greca thanks the University of Perugia for the national PhD scholarship in catalysis. F. Giordano (ISMN-CNR, Italy) and N. Gallì (ISMN-CNR, Italy) are acknowledged for carrying out XRD and BET analyses, respectively. We thank the University of Catania Piano della Ricerca 2024–2026 for the support and the COST Action Net4Clean-Air (CA20138), funded by COST (European Cooperation in Science and Technology).
Conflicts of Interest
The authors declare no conflicts of interest.
References
- Ball, M.; Wietschel, M. The Future of Hydrogen—Opportunities and Challenges. Int. J. Hydrogen Energy 2009, 34, 615–627. [Google Scholar] [CrossRef]
- Xu, X.; Zhou, Q.; Yu, D. The Future of Hydrogen Energy: Bio-Hydrogen Production Technology. Int. J. Hydrogen Energy 2022, 47, 33677–33698. [Google Scholar] [CrossRef]
- Nikolaidis, P.; Poullikkas, A. A Comparative Overview of Hydrogen Production Processes. Renew. Sustain. Energy Rev. 2017, 67, 597–611. [Google Scholar] [CrossRef]
- Kudo, A.; Miseki, Y. Heterogeneous Photocatalyst Materials for Water Splitting. Chem. Soc. Rev. 2009, 38, 253–278. [Google Scholar] [CrossRef] [PubMed]
- Zhang, J.; Yu, G.; Yang, C.; Li, S. Recent Progress on S-Scheme Heterojunction Strategy Enabling Polymer Carbon Nitrides C3N4 and C3N5 Enhanced Photocatalysis in Energy Conversion and Environmental Remediation. Curr. Opin. Chem. Eng. 2024, 45, 101040. [Google Scholar] [CrossRef]
- Wang, Z.; Li, C.; Domen, K. Recent Developments in Heterogeneous Photocatalysts for Solar-Driven Overall Water Splitting. Chem. Soc. Rev. 2019, 48, 2109–2125. [Google Scholar] [CrossRef]
- Wu, C.; Xue, S.; Qin, Z.; Nazari, M.; Yang, G.; Yue, S.; Tong, T.; Ghasemi, H.; Hernandez, F.C.R.; Xue, S.; et al. Making G-C3N4 Ultra-Thin Nanosheets Active for Photocatalytic Overall Water Splitting. Appl. Catal. B Environ. 2021, 282, 119557. [Google Scholar] [CrossRef]
- Sakata, T.; Kawai, T. Heterogeneous Photocatalytic Production of Hydrogen and Methane from Ethanol and Water. Chem. Phys. Lett. 1981, 80, 341–344. [Google Scholar] [CrossRef]
- Shimura, K.; Yoshida, H. Heterogeneous Photocatalytic Hydrogen Production from Water and Biomass Derivatives. Energy Environ. Sci. 2011, 4, 2467–2481. [Google Scholar] [CrossRef]
- Banerjee, D.; Kushwaha, N.; Shetti, N.P.; Aminabhavi, T.M.; Ahmad, E. Green Hydrogen Production via Photo-Reforming of Bio-Renewable Resources. Renew. Sustain. Energy Rev. 2022, 167, 112827. [Google Scholar] [CrossRef]
- Shi, C.; Kang, F.; Zhu, Y.; Teng, M.; Shi, J.; Qi, H.; Huang, Z.; Si, C.; Jiang, F.; Hu, J. Photoreforming Lignocellulosic Biomass for Hydrogen Production: Optimized Design of Photocatalyst and Photocatalytic System. Chem. Eng. J. 2023, 452, 138980. [Google Scholar] [CrossRef]
- Puga, A.V. Photocatalytic Production of Hydrogen from Biomass-Derived Feedstocks. Coord. Chem. Rev. 2016, 315, 1–66. [Google Scholar] [CrossRef]
- Navarro, R.M.; Peña, M.A.; Fierro, J.L.G. Hydrogen Production Reactions from Carbon Feedstocks: Fossil Fuels and Biomass. Chem. Rev. 2007, 107, 3952–3991. [Google Scholar] [CrossRef]
- Navarro, R.M.; Sánchez-Sánchez, M.C.; Alvarez-Galvan, M.C.; Del Valle, F.; Fierro, J.L.G. Hydrogen Production from Renewable Sources: Biomass and Photocatalytic Opportunities. Energy Environ. Sci. 2009, 2, 35–54. [Google Scholar] [CrossRef]
- Herrera-Beurnio, M.C.; López-Tenllado, F.J.; Hidalgo-Carrillo, J.; Martín-Gómez, J.; Estévez, R.; Urbano, F.J.; Marinas, A. Glycerol Photoreforming for Photocatalytic Hydrogen Production on Binary and Ternary Pt-g-C3N4-TiO2 Systems: A Comparative Study. Catal. Today 2024, 430, 114548. [Google Scholar] [CrossRef]
- Villachica-Llamosas, J.G.; Sowik, J.; Ruiz-Aguirre, A.; Colón, G.; Peral, J.; Malato, S. Photoreforming of Glycerol to Produce Hydrogen from Natural Water in a Compound Parabolic Collector Solar Photoreactor. J. Environ. Chem. Eng. 2023, 11, 111216. [Google Scholar] [CrossRef]
- Behr, A.; Eilting, J.; Irawadi, K.; Leschinski, J.; Lindner, F. Improved Utilisation of Renewable Resources: New Important Derivatives of Glycerol. Green Chem. 2008, 10, 13–30. [Google Scholar] [CrossRef]
- Balsamo, S.A.; Sciré, S.; Condorelli, M.; Fiorenza, R. Photocatalytic H2 Production on Au/TiO2: Effect of Au Photodeposition on Different TiO2 Crystalline Phases. J 2022, 5, 92–104. [Google Scholar] [CrossRef]
- Hernández, S.; Hidalgo, D.; Sacco, A.; Chiodoni, A.; Lamberti, A.; Cauda, V.; Tresso, E.; Saracco, G. Comparison of Photocatalytic and Transport Properties of TiO2 and ZnO Nanostructures for Solar-Driven Water Splitting. Phys. Chem. Chem. Phys. 2015, 17, 7775–7786. [Google Scholar] [CrossRef]
- Bowker, M.; Morton, C.; Kennedy, J.; Bahruji, H.; Greves, J.; Jones, W.; Davies, P.R.; Brookes, C.; Wells, P.P.; Dimitratos, N. Hydrogen Production by Photoreforming of Biofuels Using Au, Pd and Au-Pd/TiO2 Photocatalysts. J. Catal. 2014, 310, 10–15. [Google Scholar] [CrossRef]
- Vento, F.; Nicosia, A.; Mezzina, L.; Raciti, G.; Gulino, A.; Condorelli, M.; D’Urso, L.; De Guidi, G.; Mineo, P. Photocatalytic Activity of TiO2-Containing Nanocomposites versus the Chemical Nature of the Polymeric Matrices: A Comparison. Adv. Mater. Technol. 2023, 8, 2300391. [Google Scholar] [CrossRef]
- Carozo, A.M.; López-Tenllado, F.J.; Herrera-Beurnio, M.C.; Hidalgo-Carrillo, J.; Martín-Gómez, J.; Estevez, R.; Ariza-Pérez, A.; Urbano, F.J.; Marinas, A. Pt-TiO2 Systems for Enhanced Hydrogen Production from Glycerol: Direct vs. Sequential Incorporation Through Photodeposition. Materials 2024, 17, 5109. [Google Scholar] [CrossRef]
- Puga, A.V.; Forneli, A.; García, H.; Corma, A. Production of H2 by Ethanol Photoreforming on Au/TiO2. Adv. Funct. Mater. 2014, 24, 241–248. [Google Scholar] [CrossRef]
- Kašpar, J.; Fornasiero, P.; Graziani, M. Use of CeO2-Based Oxides in the Three-Way Catalysis. Catal. Today 1999, 50, 285–298. [Google Scholar] [CrossRef]
- Balsamo, S.A.; La Greca, E.; Calà Pizzapilo, M.; Sciré, S.; Fiorenza, R. CeO2-RGO Composites for Photocatalytic H2 Evolution by Glycerol Photoreforming. Materials 2023, 16, 747. [Google Scholar] [CrossRef]
- Fiorenza, R.; Balsamo, S.A.; Condorelli, M.; D’Urso, L.; Compagnini, G.; Scirè, S. Solar Photocatalytic H2 Production over CeO2-Based Catalysts: Influence of Chemical and Structural Modifications. Catal. Today 2021, 380, 187–198. [Google Scholar] [CrossRef]
- Zhao, H.; Liu, P.; Wu, X.; Wang, A.; Zheng, D.; Wang, S.; Chen, Z.; Larter, S.; Li, Y.; Su, B.L.; et al. Plasmon Enhanced Glucose Photoreforming for Arabinose and Gas Fuel Co-Production over 3DOM TiO2-Au. Appl. Catal. B Environ. 2021, 291, 120055. [Google Scholar] [CrossRef]
- Fiorenza, R.; Bellardita, M.; D’Urso, L.; Compagnini, G.; Palmisano, L.; Scirè, S. Au/TiO2-CeO2 Catalysts for Photocatalytic Water Splitting and VOCs Oxidation Reactions. Catalysts 2016, 6, 121. [Google Scholar] [CrossRef]
- Zhang, J.; Zhu, Y.; An, Z.; Shu, X.; Ma, X.; Song, H.; Wang, W.; He, J. Size Effects of Ni Particles on the Cleavage of C-H and C-C Bonds toward Hydrogen Production from Cellulose. ACS Appl. Energy Mater. 2020, 3, 7048–7057. [Google Scholar] [CrossRef]
- Zhao, H.; Li, C.F.; Liu, L.Y.; Palma, B.; Hu, Z.Y.; Renneckar, S.; Larter, S.; Li, Y.; Kibria, M.G.; Hu, J.; et al. N-p Heterojunction of TiO2-NiO Core-Shell Structure for Efficient Hydrogen Generation and Lignin Photoreforming. J. Colloid Interface Sci. 2021, 585, 694–704. [Google Scholar] [CrossRef]
- Chen, Z.; Yan, Y.; Sun, K.; Tan, L.; Guo, F.; Du, X.; Shi, W. Plasmonic Coupling-Boosted Photothermal Composite Photocatalyst for Achieving near-Infrared Photocatalytic Hydrogen Production. J. Colloid Interface Sci. 2024, 661, 12–22. [Google Scholar] [CrossRef]
- Zhang, X.; Wang, C.; Zhang, M.; Luo, D.; Ye, S.; Weng, B. Surface Plasmon Resonance-Mediated Photocatalytic H2 Generation. ChemSusChem 2024, 17, e202400513. [Google Scholar] [CrossRef]
- Jiang, X.; Fu, X.; Zhang, L.; Meng, S.; Chen, S. Photocatalytic Reforming of Glycerol for H2 Evolution on Pt/TiO2: Fundamental Understanding the Effect of Co-Catalyst Pt and the Pt Deposition Route. J. Mater. Chem. A 2015, 3, 2271–2282. [Google Scholar] [CrossRef]
- Zhang, D.-F.; Li, S.; Xu, Q.-H.; Cao, Y. Aggregation-Induced Plasmon Coupling-Enhanced One- and Two-Photon Excitation Fluorescence by Silver Nanoparticles. Langmuir 2020, 36, 4721–4727. [Google Scholar] [CrossRef] [PubMed]
- Oemar, U.; Hidajat, K.; Kawi, S. High Catalytic Stability of Pd-Ni/Y2O3 Formed by Interfacial Cl for Oxy-CO2 Reforming of CH4. Catal. Today 2017, 281, 276–294. [Google Scholar] [CrossRef]
- Zhu, Y.; Shaban, M.; Alharbi, N.S.; Ren, X.; Chen, C. Insight into the Enhanced Removal of U(VI) with Fe–Ni Bimetallic Particles Loaded on Biochar. Langmuir 2025, 41, 2880–2891. [Google Scholar] [CrossRef] [PubMed]
- Meng, F.; Zhong, P.; Li, Z.; Cui, X.; Zheng, H. Surface Structure and Catalytic Performance of Ni-Fe Catalyst for Low-Temperature CO Hydrogenation. J. Chem. 2014, 2014, 534842. [Google Scholar] [CrossRef]
- Jalowiecki-Duhamel, L.; Pirez, C.; Capron, M.; Dumeignil, F.; Payen, E. Hydrogen Production from Ethanol Steam Reforming over Cerium and Nickel Based Oxyhydrides. Int. J. Hydrogen Energy 2010, 35, 12741–12750. [Google Scholar] [CrossRef]
- Venezia, A.M.; Pantaleo, G.; Longo, A.; Di Carlo, G.; Casaletto, M.P.; Liotta, F.L.; Deganello, G. Relationship between Structure and CO Oxidation Activity of Ceria-Supported Gold Catalysts. J. Phys. Chem. B 2005, 109, 2821–2827. [Google Scholar] [CrossRef]
- Liotta, L.F.; Di Carlo, G.; Pantaleo, G.; Venezia, A.M. Supported Gold Catalysts for CO Oxidation and Preferential Oxidation of CO in H2 Stream: Support Effect. Catal. Today 2010, 158, 56–62. [Google Scholar] [CrossRef]
- Kowalska, E.; Mahaney, O.O.P.; Abe, R.; Ohtani, B. Visible-Light-Induced Photocatalysis through Surface Plasmon Excitation of Gold on Titania Surfaces. Phys. Chem. Chem. Phys. 2010, 12, 2344. [Google Scholar] [CrossRef] [PubMed]
- Chen, W.-T.; Chan, A.; Al-Azri, Z.H.N.; Dosado, A.G.; Nadeem, M.A.; Sun-Waterhouse, D.; Idriss, H.; Waterhouse, G.I.N. Effect of TiO2 Polymorph and Alcohol Sacrificial Agent on the Activity of Au/TiO2 Photocatalysts for H2 Production in Alcohol–Water Mixtures. J. Catal. 2015, 329, 499–513. [Google Scholar] [CrossRef]
- Makuła, P.; Pacia, M.; Macyk, W. How To Correctly Determine the Band Gap Energy of Modified Semiconductor Photocatalysts Based on UV–Vis Spectra. J. Phys. Chem. Lett. 2018, 9, 6814–6817. [Google Scholar] [CrossRef] [PubMed]
- Sun, C.; Beaunier, P.; La Parola, V.; Liotta, L.F.; Da Costa, P. Ni/CeO2 Nanoparticles Promoted by Yttrium Doping as Catalysts for CO2 Methanation. ACS Appl. Nano Mater. 2020, 3, 12355–12368. [Google Scholar] [CrossRef]
- Liyanage, A.D.; Perera, S.D.; Tan, K.; Chabal, Y.; Balkus, K.J. Synthesis, Characterization, and Photocatalytic Activity of Y-Doped CeO2 Nanorods. ACS Catal. 2014, 4, 577–584. [Google Scholar] [CrossRef]
- Kaminker, R.; Lahav, M.; Altman, M.; Evmenenko, G.; Dutta, P.; Gulino, A.; van der Boom, M.E. Surface-Confined Core–Shell Structures Based on Gold Nanoparticles and Metal–Organic Networks. Chem. Commun. 2014, 50, 4635–4638. [Google Scholar] [CrossRef]
- Fiorenza, R.; Crisafulli, C.; Condorelli, G.G.; Lupo, F.; Scirè, S. Au–Ag/CeO2 and Au–Cu/CeO2 Catalysts for Volatile Organic Compounds Oxidation and CO Preferential Oxidation. Catal. Lett. 2015, 145, 1691–1702. [Google Scholar] [CrossRef]
- Dativo, G.; La Greca, E.; Liotta, L.F.; La Parola, V.; Condorelli, M.; Impellizzeri, G.; Compagnini, G.; Sciré, S.; Fiorenza, R. Solar Photothermo-Catalytic Conversion of CO2 on Phyllosilicates Modified with Ni and CeO2. J. CO2 Util. 2024, 82, 102765. [Google Scholar] [CrossRef]
- Pantaleo, G.; La Parola, V.; Deganello, F.; Calatozzo, P.; Bal, R.; Venezia, A.M. Synthesis and Support Composition Effects on CH4 Partial Oxidation over Ni–CeLa Oxides. Appl. Catal. B Environ. 2015, 164, 135–143. [Google Scholar] [CrossRef]
- Ji, P.; Zhang, J.; Chen, F.; Anpo, M. Ordered Mesoporous CeO2 Synthesized by Nanocasting from Cubic Ia3d Mesoporous MCM-48 Silica: Formation, Characterization and Photocatalytic Activity. J. Phys. Chem. C 2008, 112, 17809–17813. [Google Scholar] [CrossRef]
- Fiorenza, R.; Spitaleri, L.; Gulino, A.; Scirè, S. Ru–Pd Bimetallic Catalysts Supported on CeO2-MnOX Oxides as Efficient Systems for H2 Purification through CO Preferential Oxidation. Catalysts 2018, 8, 203. [Google Scholar] [CrossRef]
- Farhan, S.; Hassan Raza, A.; Yang, S.; Yu, Z.; Wu, Y. Boosted Photocatalytic Hydrogen Evolution of S-Scheme N-Doped CeO2-Δ@ZnIn2S4 Heterostructure Photocatalyst. J. Colloid Interface Sci. 2024, 669, 430–443. [Google Scholar] [CrossRef] [PubMed]
- Li, S.; Dong, K.; Cai, M.; Li, X.; Chen, X. A Plasmonic S-Scheme Au/MIL-101(Fe)/BiOBr Photocatalyst for Efficient Synchronous Decontamination of Cr(VI) and Norfloxacin Antibiotic. eScience 2024, 4, 100208. [Google Scholar] [CrossRef]
- Qian, J.; Chen, Z.; Sun, H.; Chen, F.; Xu, X.; Wu, Z.; Li, P.; Ge, W. Enhanced Photocatalytic H2 Production on Three-Dimensional Porous CeO2/Carbon Nanostructure. ACS Sustain. Chem. Eng. 2018, 6, 9691–9698. [Google Scholar] [CrossRef]
- Yadav, A.A.; Hunge, Y.M.; Kang, S.-W. Visible Light-Responsive CeO2/MoS2 Composite for Photocatalytic Hydrogen Production. Catalysts 2022, 12, 1185. [Google Scholar] [CrossRef]
- Balsamo, S.A.; Fiorenza, R.; Iapichino, M.T.A.; Lopez-Tenllado, F.J.; Urbano, F.J.; Sciré, S. H2 Production through Glycerol Photoreforming Using One-Pot Prepared TiO2-RGO-Au Photocatalysts. Mol. Catal. 2023, 547, 113346. [Google Scholar] [CrossRef]
- Schneider, C.A.; Rasband, W.S.; Eliceiri, K.W. NIH Image to ImageJ: 25 Years of Image Analysis. Nat. Methods 2012, 9, 671–675. [Google Scholar] [CrossRef]
Disclaimer/Publisher’s Note: The statements, opinions and data contained in all publications are solely those of the individual author(s) and contributor(s) and not of MDPI and/or the editor(s). MDPI and/or the editor(s) disclaim responsibility for any injury to people or property resulting from any ideas, methods, instructions or products referred to in the content. |
© 2025 by the authors. Licensee MDPI, Basel, Switzerland. This article is an open access article distributed under the terms and conditions of the Creative Commons Attribution (CC BY) license (https://creativecommons.org/licenses/by/4.0/).