1. Introduction
Concerns about environmental contamination, water scarcity, and climate change have grown significantly over the recent several decades of rapid industrial activity. People, animals, and plants can all be impacted by the different kinds of dangerous chemicals that are growing in water supplies. A significant volume of industrial wastewater is discharged into the untreated environment. This untreated wastewater often contains contaminants such as pesticides, colors, personal care products, and pharmaceuticals. These contaminants pose a serious risk to the environment and human health, either directly or indirectly [
1,
2,
3].
Photocatalytic degradation provides a workable method of decomposing organic pollutants and reducing the levels of residual contaminants in water bodies using sustainable solar energy. This cost-effective, environmentally responsible, and efficient degradation approach is an excellent strategy to deal with environmental problems. Without the need for additional oxidants or reductants, this mechanism can break down popular antibiotics, pesticides, and colors, thereby halting the spread of pollutant resistance. However, for traditional photocatalytic devices, the band and surface structures of the catalyst are essential. Issues, including delayed electron-hole pair separation and a lack of active surface sites, lead to its poor performance [
4,
5]. There is a constant search for appropriate photocatalysts because of their low efficiency, poor biodegradability, and expensive industrial application, which make them uninteresting for large-scale production. To date, a wide range of materials have been used as photocatalysts, but oxides have certainly been the most researched [
6,
7,
8,
9]. Only UV light, which takes up only 4% of the solar spectrum, can activate them due to their wide band gaps, which is the limiting factor for light exploitation [
10]. Higher photocatalytic efficiency can be achieved by materials using the visible part of the solar spectrum by adjusting the energy gap with convenient methods. Doping is a straightforward process that can be carried out by connecting with other semiconductors, using rare earth (RE) ions, transition metals or other metallic nanoparticles, or using dyes [
11,
12].
Rare earth (RE) elements are particularly useful for the photocatalytic degradation of different pollutants. Their existence in the material suggests a higher rate of e
+/h
− pair formation and a slower recombination rate, owing to the increased number of energy levels coming from RE ions to which photogenerated e
− can be transferred [
13,
14,
15,
16].
In the visible, infrared, and ultraviolet (UV) regions of the electromagnetic spectrum, RE metals from the lanthanide class of elements exhibit exceptional luminescence properties due to their rich energy level structure. Consequently, they have a wide range of applications, such as solid-state lighting, optical amplifiers, bio-imaging, solar cells, photocatalysis, sensing, therapy, and diagnostics [
17,
18,
19,
20,
21]. Because of their 4f–5d transitions, RE elements, which act as the luminescent centers that produce light with carefully controlled color, are commonly doped into the host matrix of luminescent materials. Among the RE trivalent ions (Er
3+, Tm
3+, Ho
3+, Pr
3+, and Nd
3+), Ho
3+ emits visible green light efficiently when combined with Yb
3+, which absorbs near-infrared (NIR) light and transfers it to holmium, producing up-conversion luminescent material. Ho
3+ has multiple long-lived metastable levels that, upon activation, could cause radiative relaxation, leading to the appearance of UV/Vis emission [
22,
23,
24]. On the other hand, because of their multiple energy levels and the wide range of colors they emit, the down-conversion elements (e.g., Dy
3+, Eu
3+, Sm
3+) are particularly relevant for various phosphor applications [
25].
Apart from traditional oxides, mixed oxides are also successfully used as a matrix for photocatalytic applications. Strontium gadolinium oxide (SrGd
2O
4) is an ecologically safe material with favorable features, including good thermal and charge stability, a refractive index (n~2), high density (7.3 g/cm
3), and high chemical strength. The main advantage of this host is its low photon energy (about 475 cm
−1) compared to the most used oxide host, Y
2O
3 (~600 cm
−1). Furthermore, if we compare our host matrix to sulfide-based phosphors, Y
2O
2S, for example, the volatility of sulfur diminishes luminescent efficiency and limits their use in field emission displays. Fluoride-based hosts (like NaYF
4, CsY
2F
7, and RbY
2F
7) are preferred for some phosphor applications because they also have relatively low phonon energies, meaning that non-radiative transitions (energy losses due to lattice vibrations) are less likely to occur, resulting in more efficient luminescence. But on the other hand, major concerns about excessive fluoride intake and related toxicity were raised worldwide, leading several countries to ban the use of fluorides. With all this in mind, it is critical to produce environmentally friendly phosphors capable of withstanding the high temperatures generated by LEDs and FEDs. Furthermore, thermal stability has a significant impact on the lifetime and brightness of display devices. As a result, it can be used as a platform for generating novel multifunctional phosphors [
26,
27].
The claim that materials with strong luminescent qualities cannot be good photocatalysts and vice versa is supported by the findings of several authors [
28,
29,
30,
31,
32]. When an electron returns from the excited state to its ground state, it emits photons, a process known as luminescence, which is actually a recombination. Consequently, a material with a stronger luminescent emission should exhibit a lower level of photocatalytic activity (because of more frequent recombination). In other words, photoluminescence and photocatalysis are two processes that compete with one another. However, while talking about this subject, there are additional things to consider, including different matrix defects, the presence of impurities or dopants, oxygen vacancies, OH
− groups on the material’s surface, etc. Furthermore, photocatalytic effectiveness may also be affected by the influence of the reaction’s medium, particularly the involvement of water molecules [
33,
34].
The literature contains findings that suggest materials with excellent luminescent qualities may also have good photocatalytic efficiency [
33,
35,
36,
37]. Investigating down-conversion SrGd
2O
4:Dy
3+ and up-conversion SrGd
2O
4:Yb
3+, Ho
3+ luminescent materials as photocatalysts is the primary focus of this publication, with an emphasis on the correlation between luminescent and photocatalytic properties.
2. Results
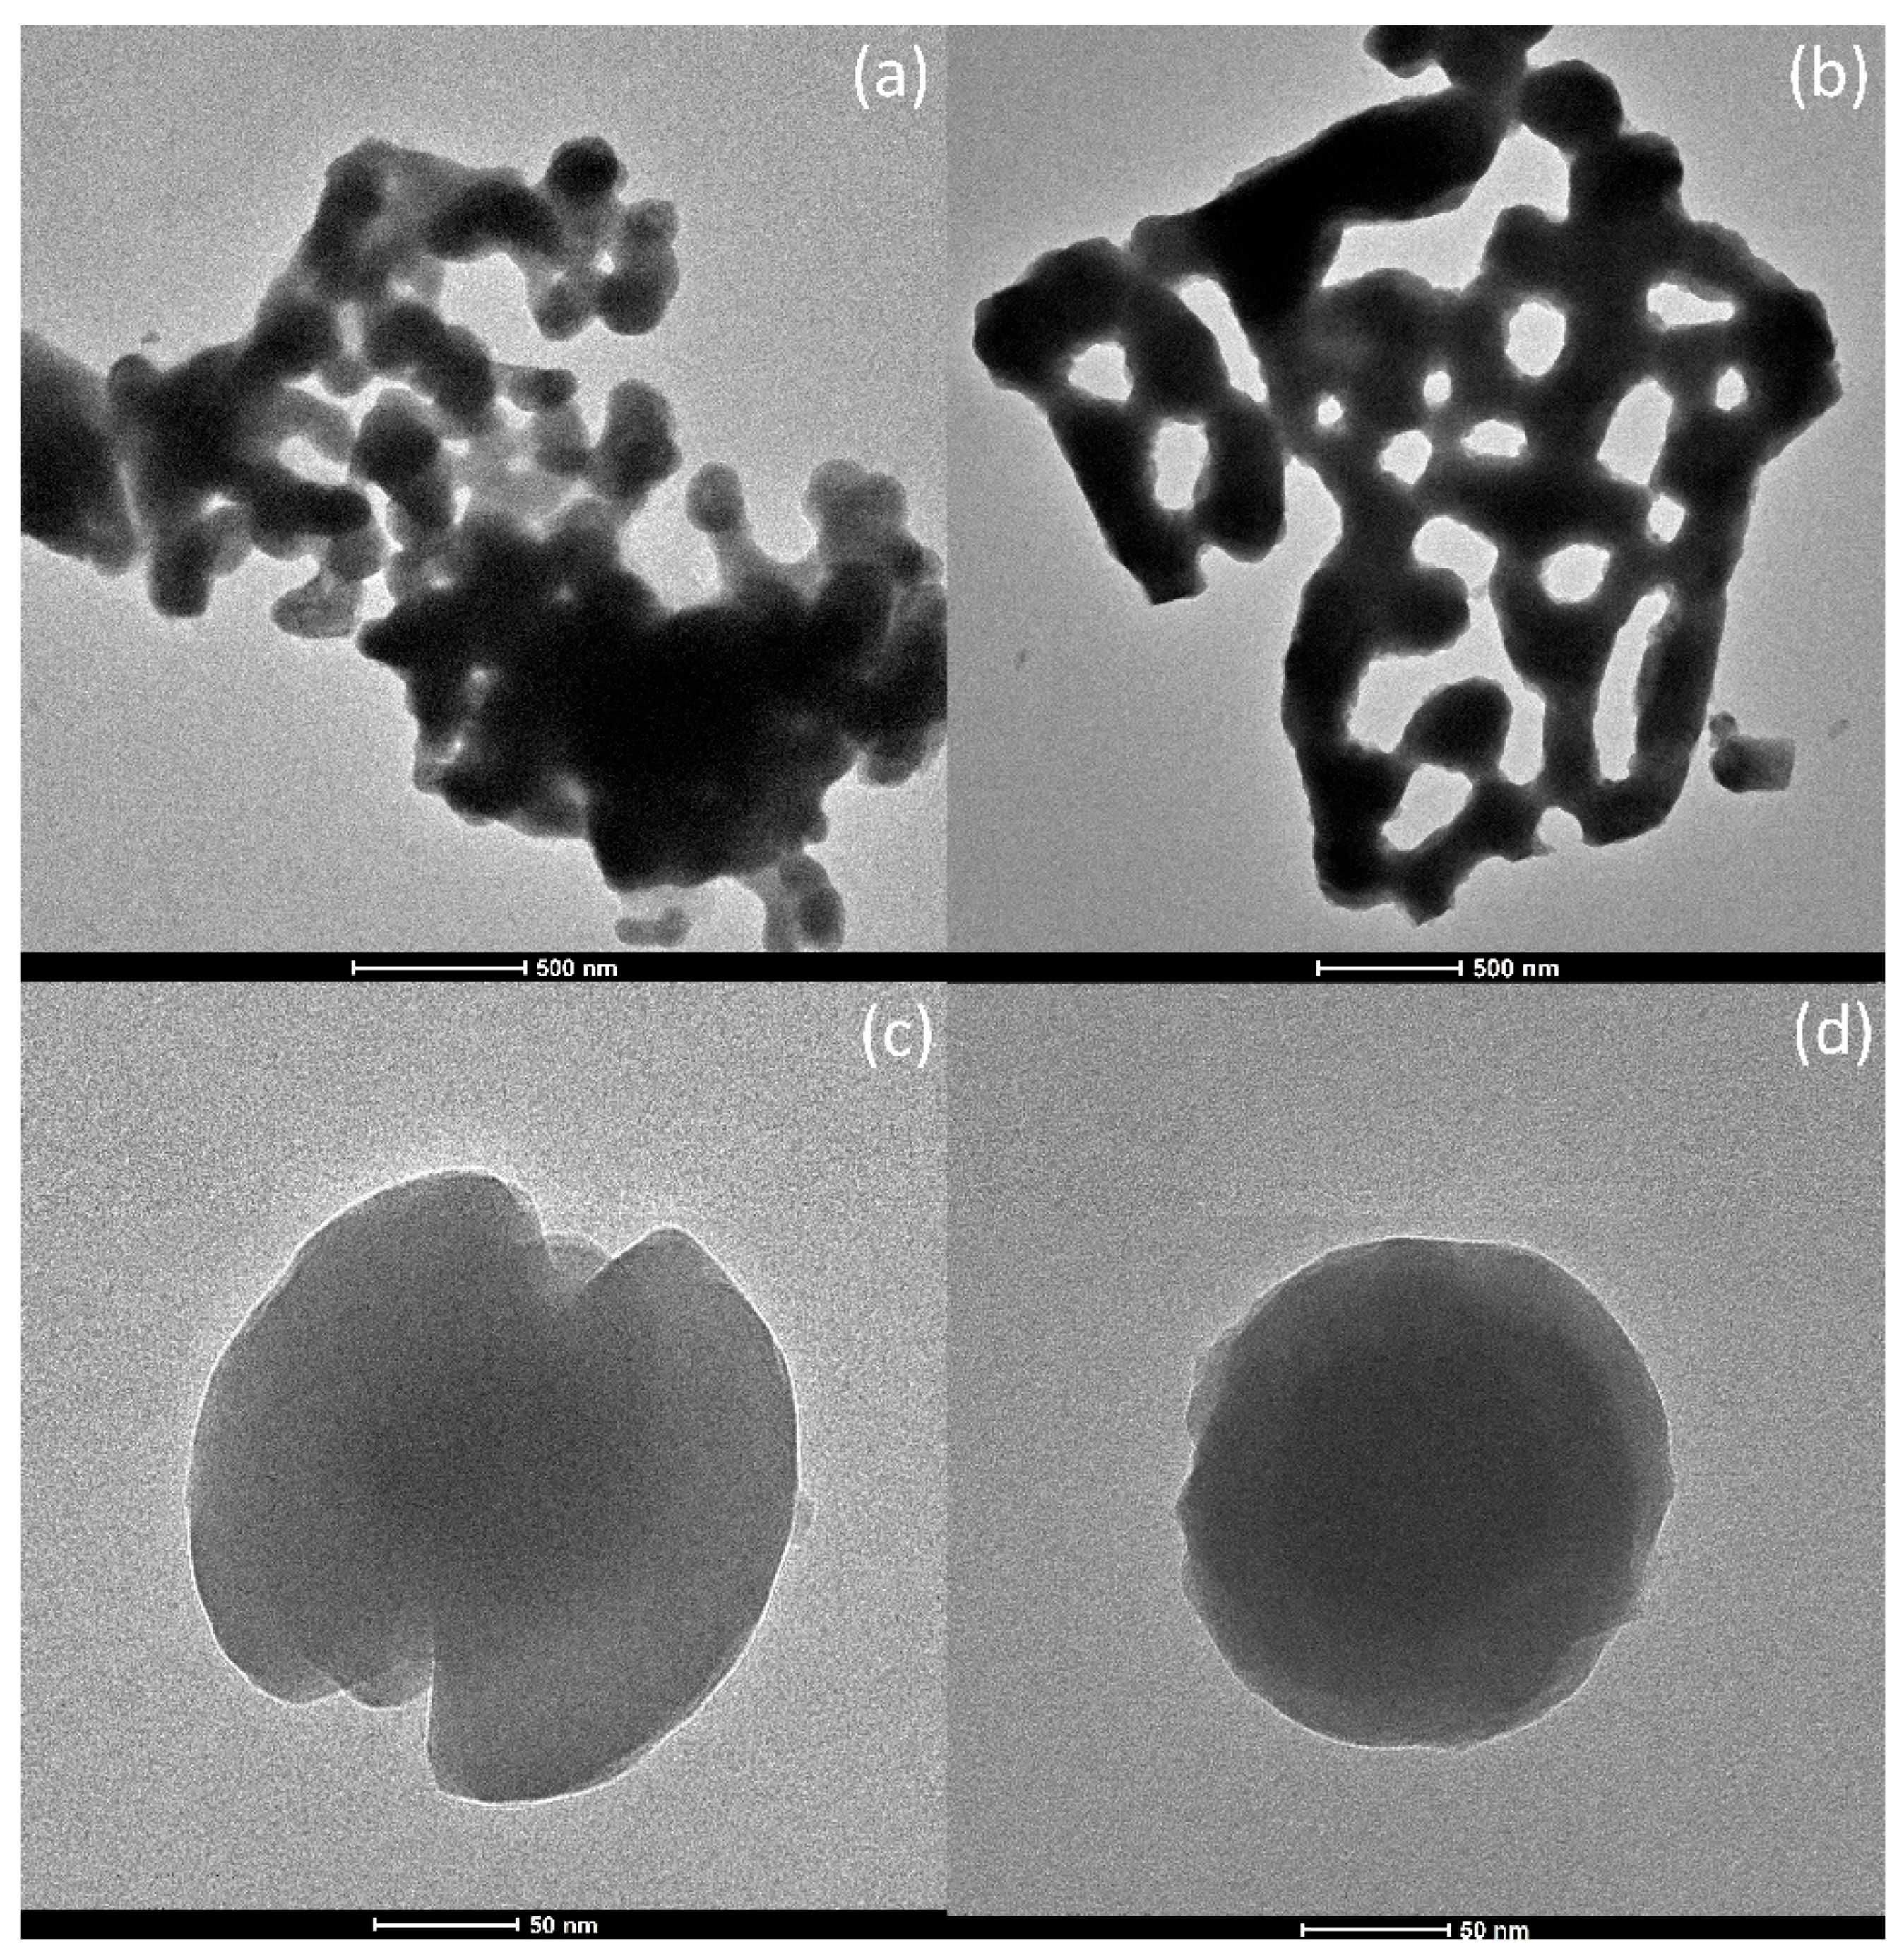
Thorough microstructural analysis of as-synthesized samples was performed by combining conventional transmission electron microscopy (TEM) with high-resolution TEM and selected area electron diffraction (SAED) methods. Low-magnification TEM images for two samples are presented in
Figure 1a−d. Detailed examination demonstrated no significant dissimilarities in the microstructure between the samples; thus, only images of the selected samples were presented.
Figure 1a,b reveals a structure in the form of large agglomerates composed of smaller irregularly shaped particles. It can be observed that the structure is porous, which is the anticipated effect of the selected combustion synthesis. The size of the particles can vary from 100 nm to a few hundred nm. Particles that are smaller than 150 nm can also be observed, and some of them are presented in
Figure 1c,d.
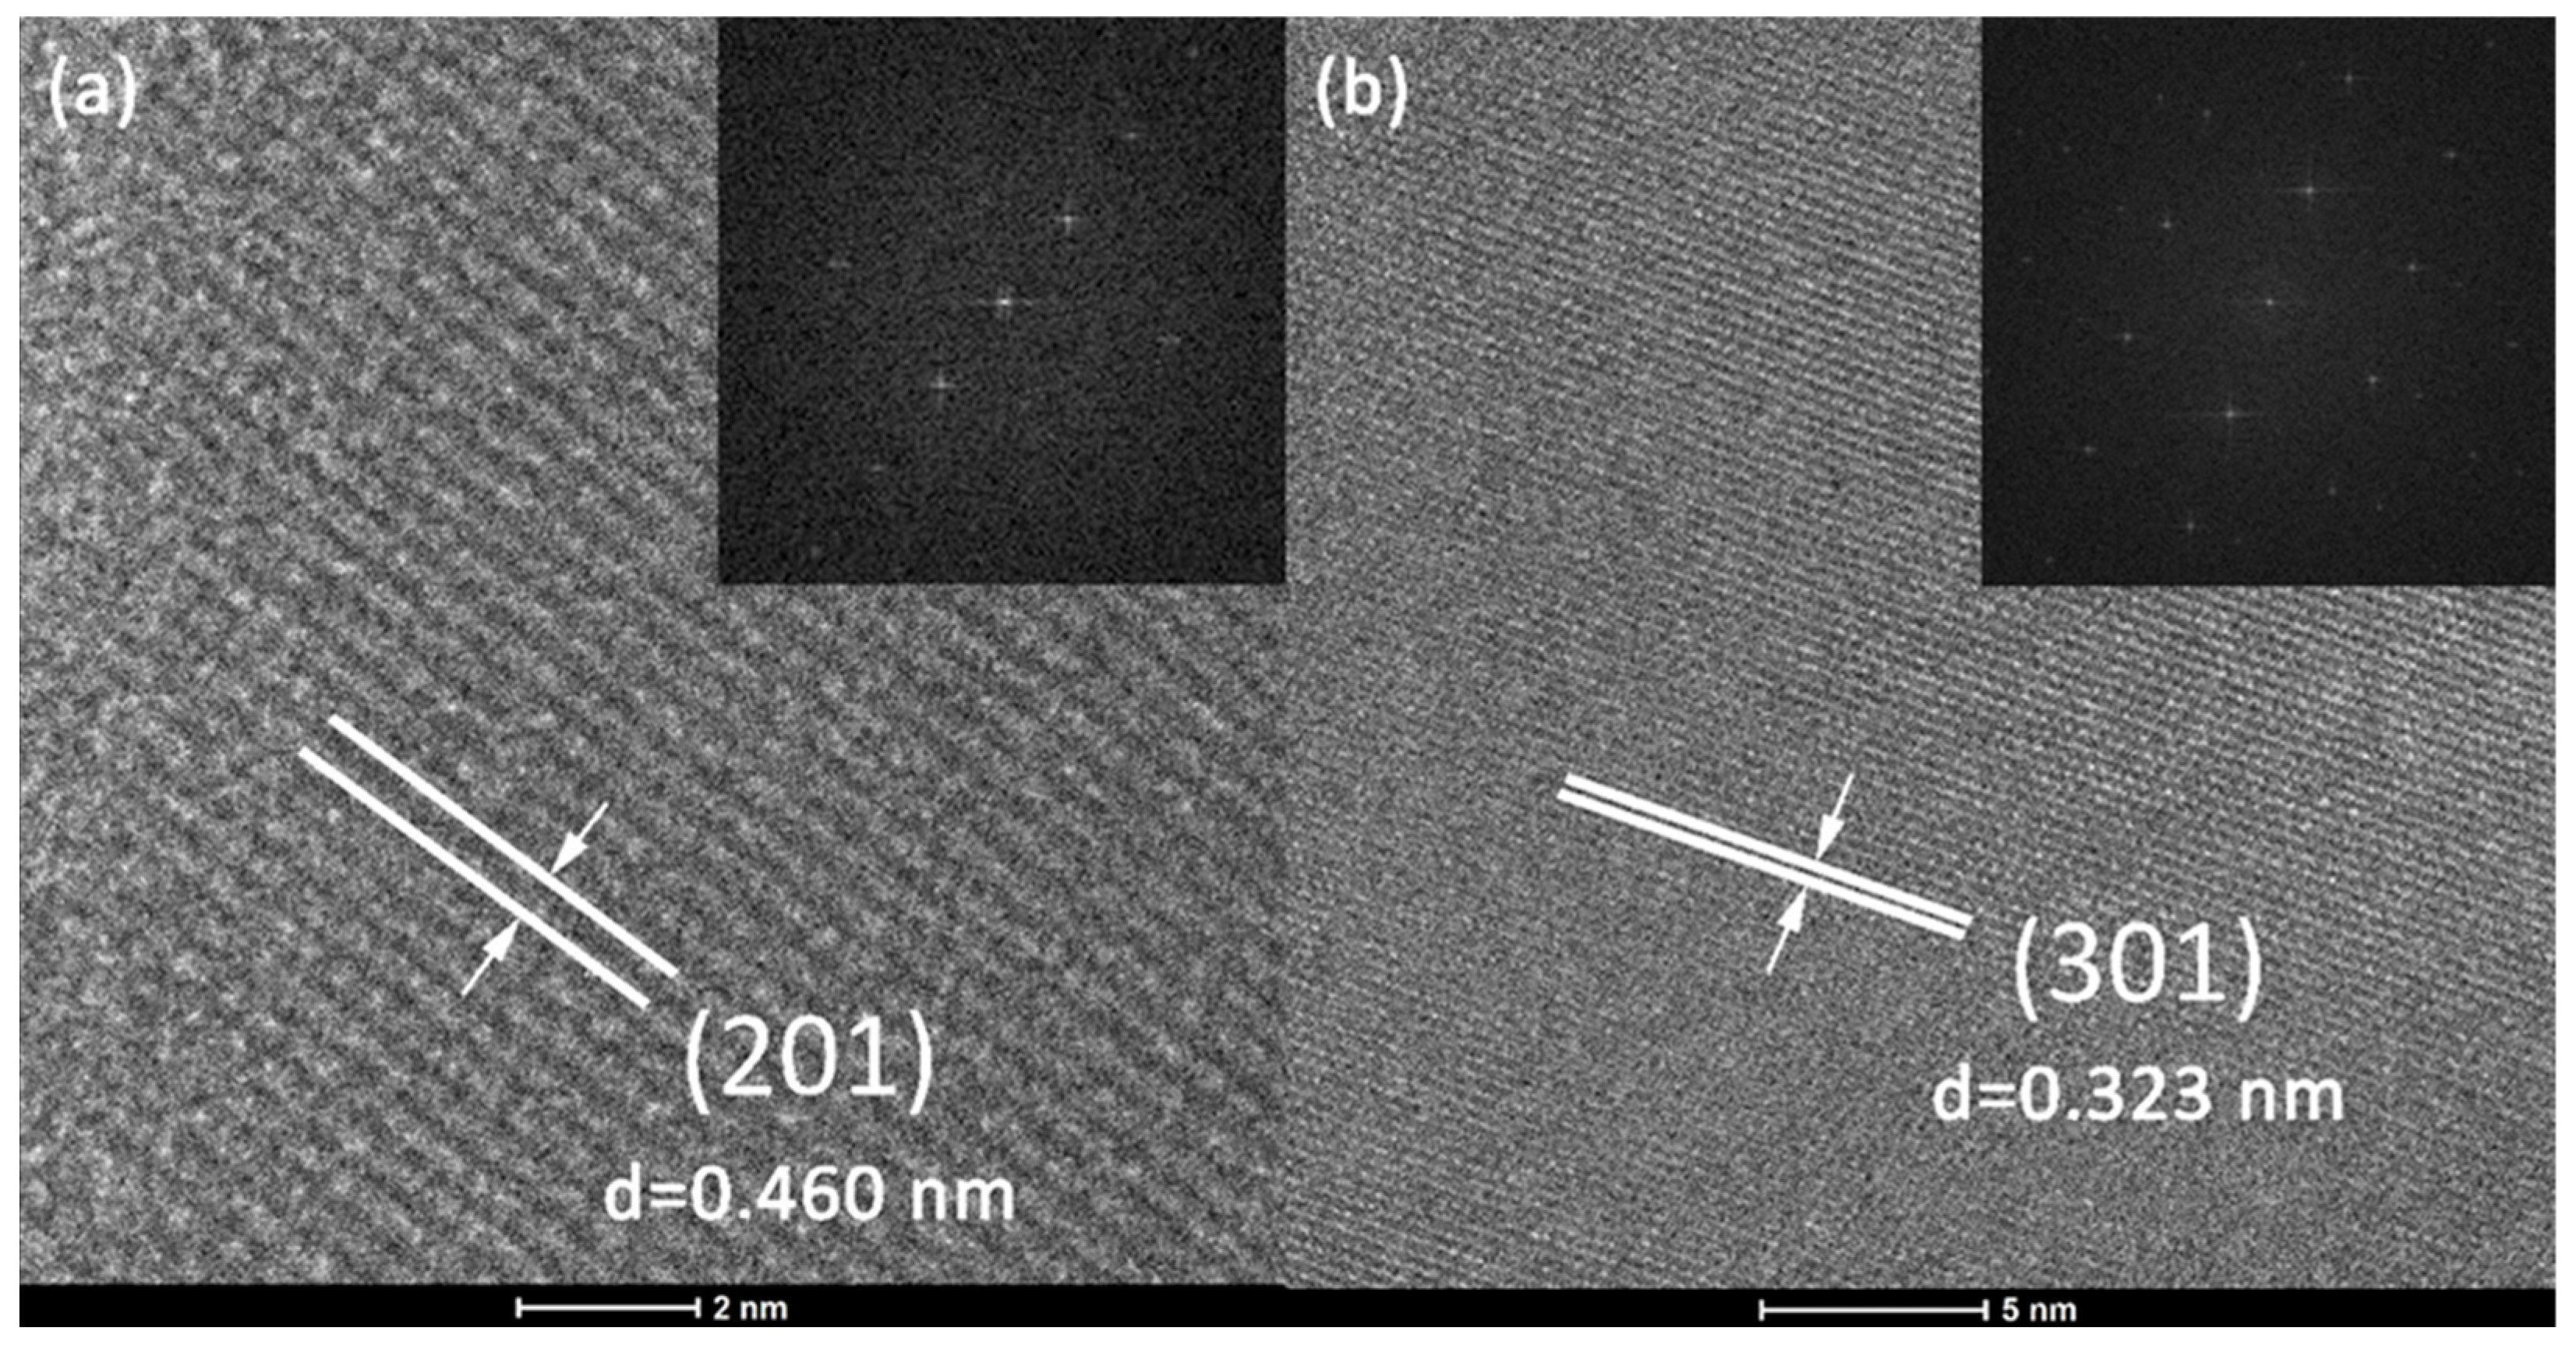
To perform a thorough inspection of the crystalline structure, HR-TEM micrographs were recorded at high magnification, and FFT analysis was performed. The appropriate HR-TEM images of the magnified sections of two distinct particles are presented in
Figure 2a,b with corresponding FFT images as insets. The existence of clearly visible crystallographic planes indicates the crystalline structure of the samples. Established lattice planes are (201) and (301), with calculated d-spacing values of 0.460 and 0.323 nm for SrGd
2O
4: Dy
3+ (1 at%) and SrGd
2O
4: Ho
3+ (1 at%), Yb
3+ (6 at%), respectively. These findings are in agreement with the JCPDS Card No. 01-072-6387 for the pure SrGd
2O
4. Furthermore, the exact same highly ordered lattice stripes can also be distinguished by the FFT analysis, endorsing previously described discoveries.
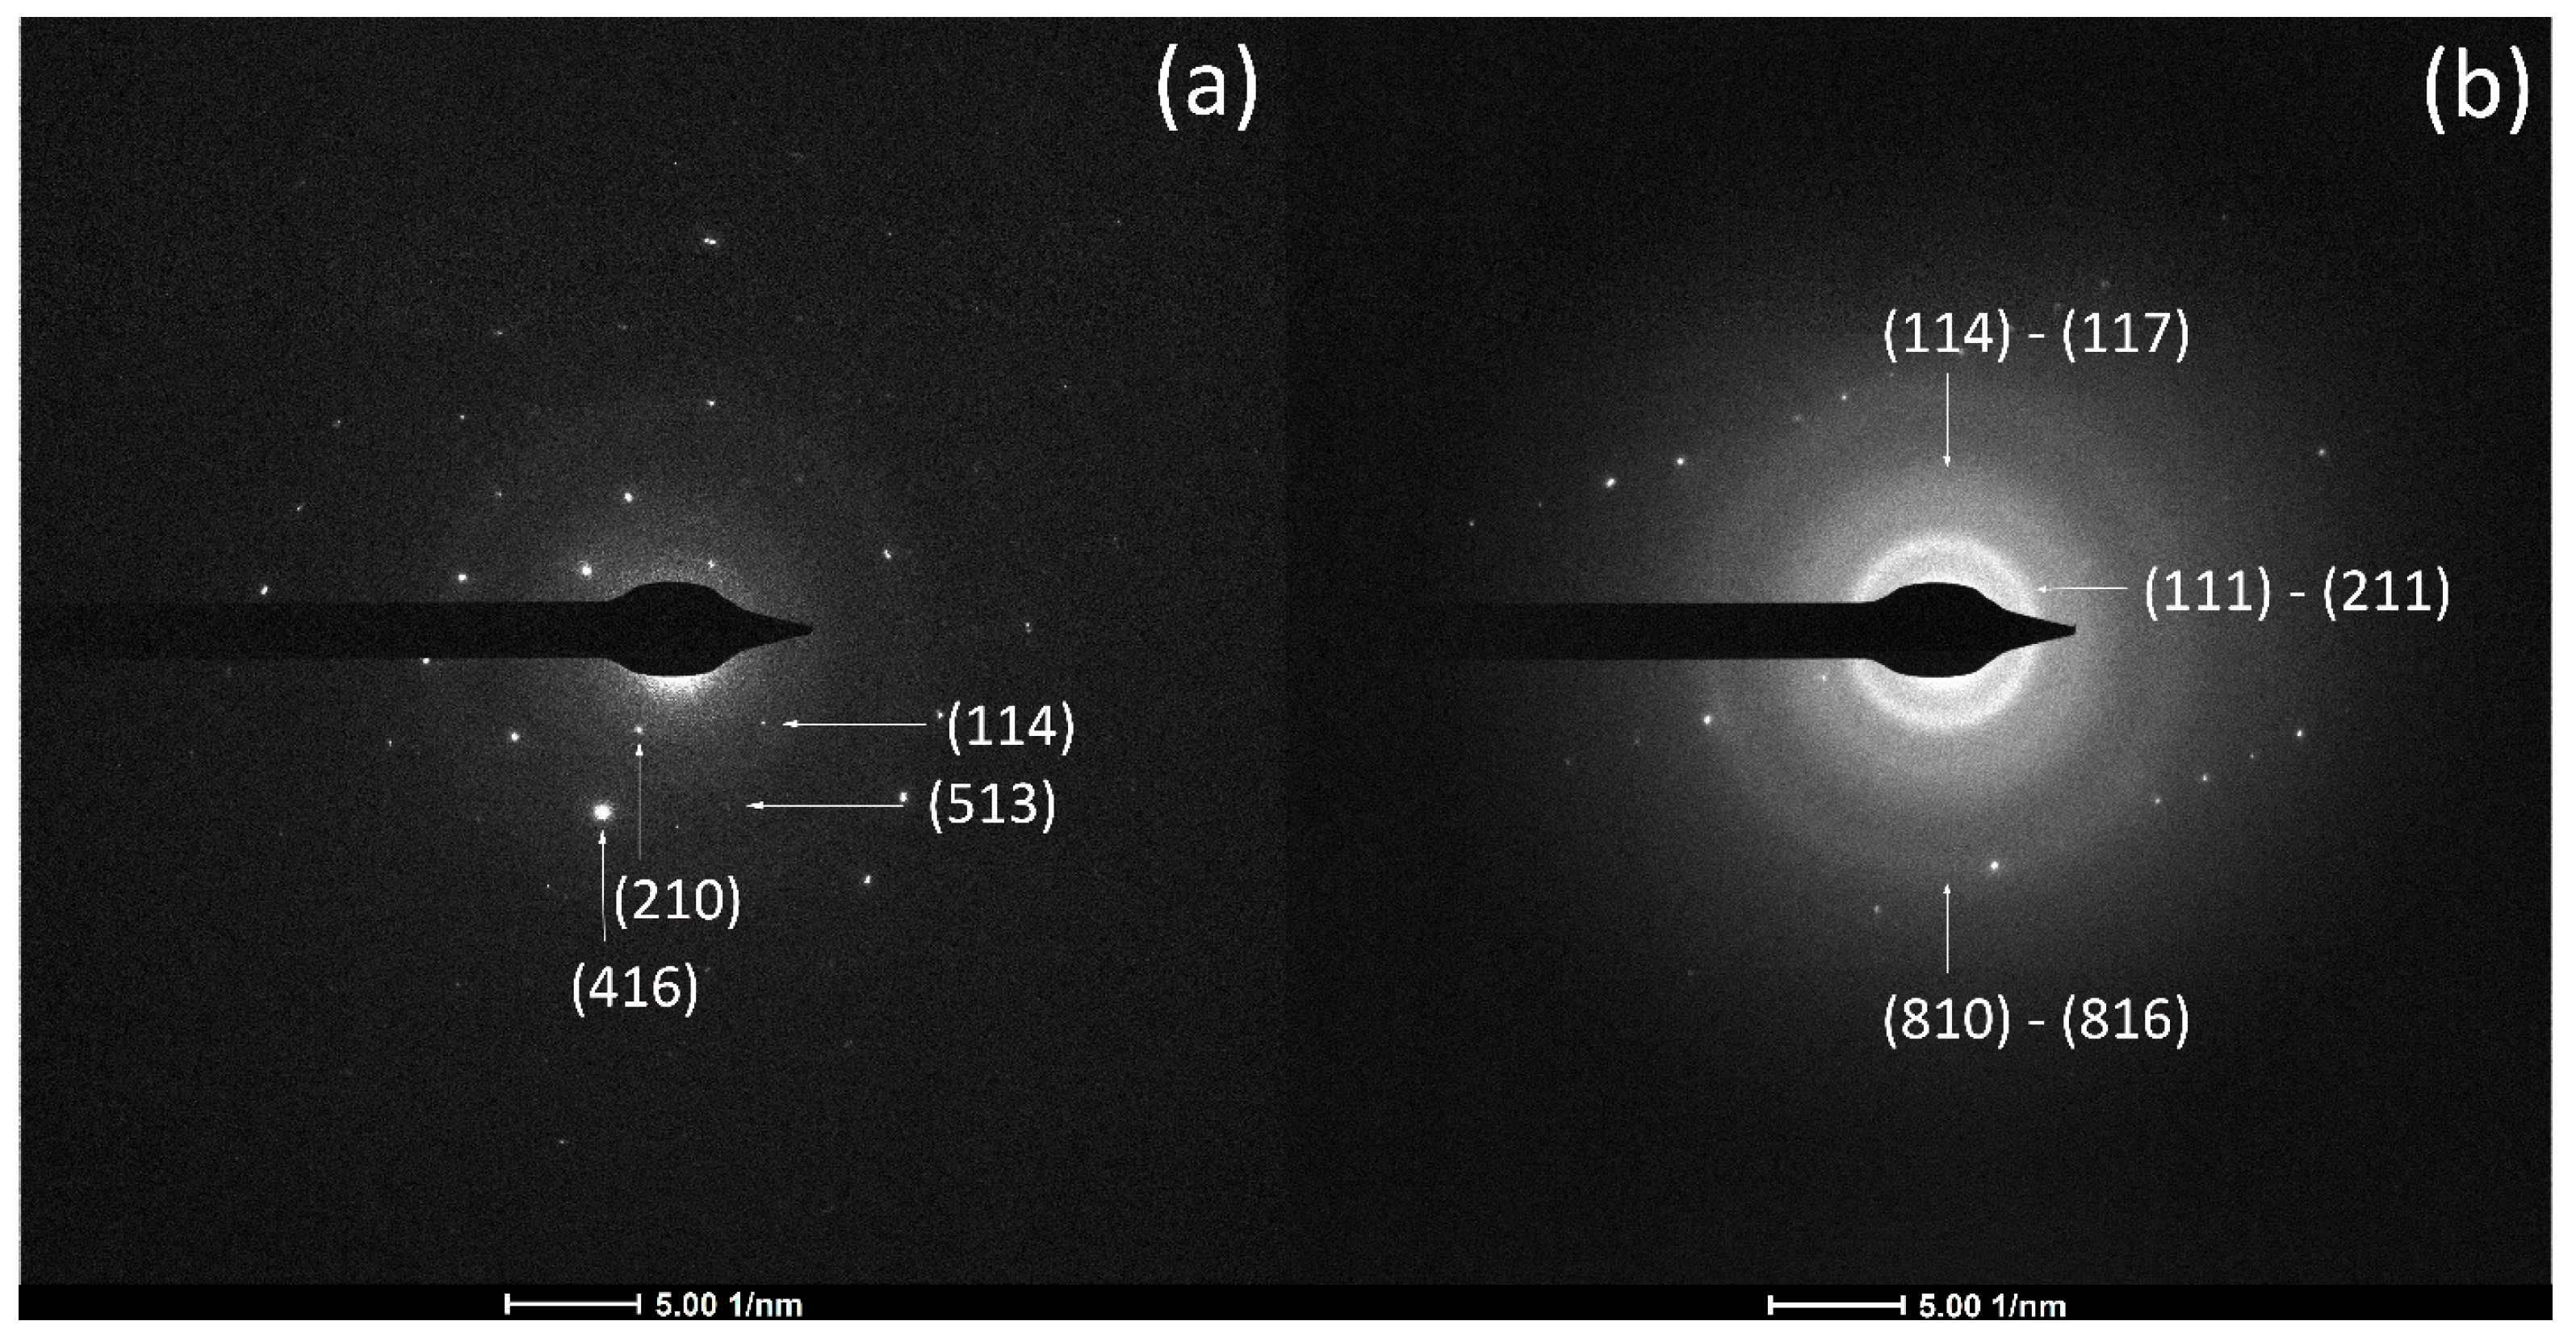
The results of the SAED investigation are demonstrated in
Figure 3a,b revealing diffraction patterns for SrGd
2O
4: Dy
3+ (1 at%) and SrGd
2O
4: Ho
3+ (1 at%), Yb
3+ (6 at%), respectively. The polycrystalline structure of the samples is verified by the diffraction patterns visible as many bright spots (
Figure 3a) and/or few thick diffraction rings (
Figure 3b).
Figure 3a reveals highly ordered bright spots, implying that particular grains exist as typical monocrystals. Nonetheless, distances between the diffraction center and bright spots were measured, exposing planes with Miller indexes (210), (114), (416), and (513), with d-spacing values of 0.283, 0.220, 0.143, and 0.160 nm, respectively. Calculated d-spacing values somewhat differ from the reference values for the planes (210) and (114), which can be ascribed to the adjustment of the unit cell parameters due to the ion swapping. Dy
3+ ions are smaller than Gd
3+ ions; hence, decreased interplanar spacing values after inserting Dy
3+ instead of Gd
3+ in the crystal lattice are anticipated. As for the sample doped with Ho/Yb,
Figure 3b displays a diffraction pattern in the form of three thick diffraction rings, along with some bright spots. The appearance of diffraction rings suggests the polycrystalline structure of the sample. Since SrGd
2O
4 occurs as an orthorhombic lattice, which is verified by numerous diffraction peaks (JCPDS Card No. 01-072-6387), thick rings in the SAED image may refer to a few distinct but narrowly located diffraction rings merged altogether to form one thick ring. Having that in mind, it can be measured that the inner circle corresponds to the planes from (111) to (211), with d-spacing values from 0.316 to 0.278 nm, respectively. The middle and also the thickest diffraction circle indicate the presence of interplanar spacing distances from (114) to (117), with d-spacing values from 0.222 to 0.152 nm, respectively, while the outer circle corresponds to plane orientations with Miller indexes from (810) to (816), having d-spacing values from 0.118 to 0.102 nm, respectively. All presented results agree with the JCPDS Card No. 01-072-6387 assigned to SrGd
2O
4.
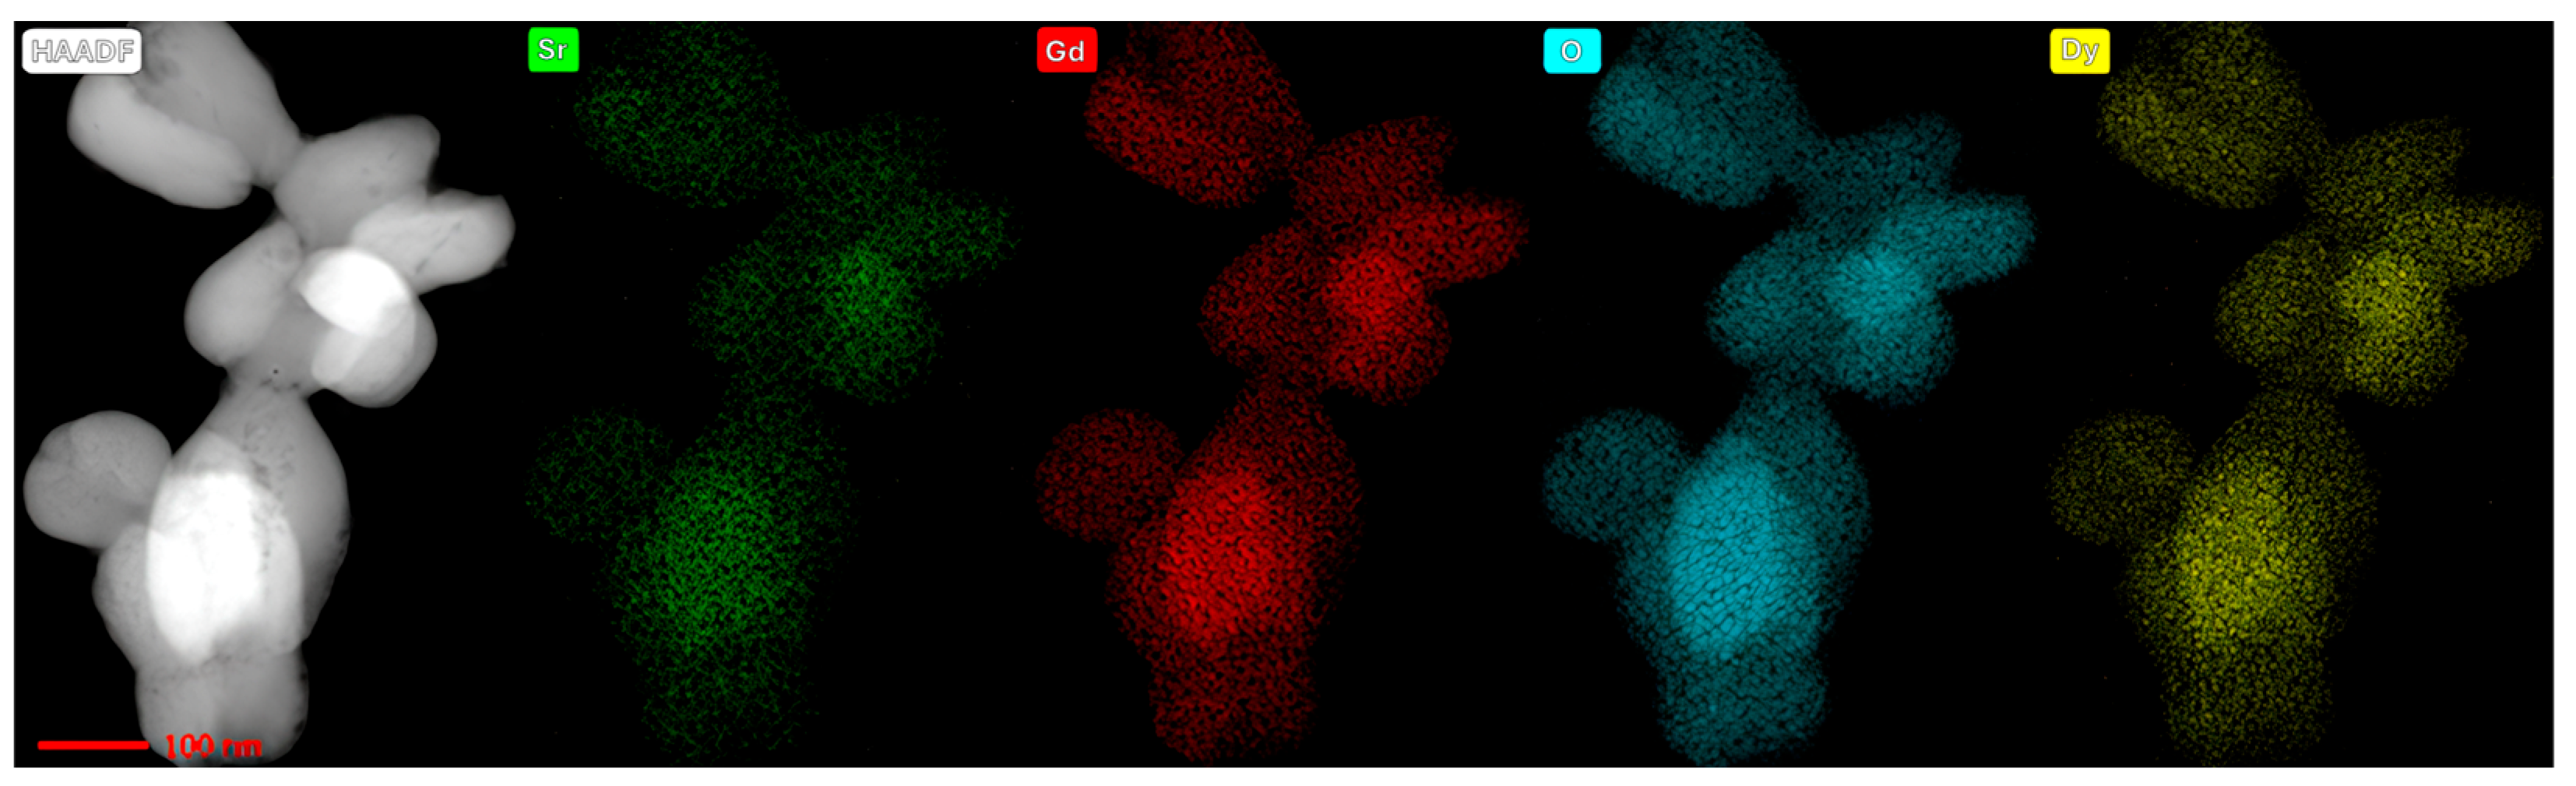
Acquired micrographs in the STEM mode, joined with EDS mapping, delivered significant understanding regarding the elemental composition of the as-synthesized samples. This investigation also provided valuable information on the dispersal of elements throughout the particles. STEM-HAADF micrographs with elemental mapping for the sample doped with Dy
3+ are displayed in
Figure 4, while the results of the same analysis for the sample doped with Ho
3+ and Yb
3+ are presented in
Figure 5. Each chemical element is colored differently, showing the efficacious integration of dopants into the SrGd
2O
4 host lattice, as well as even distribution of all elements through the grains.
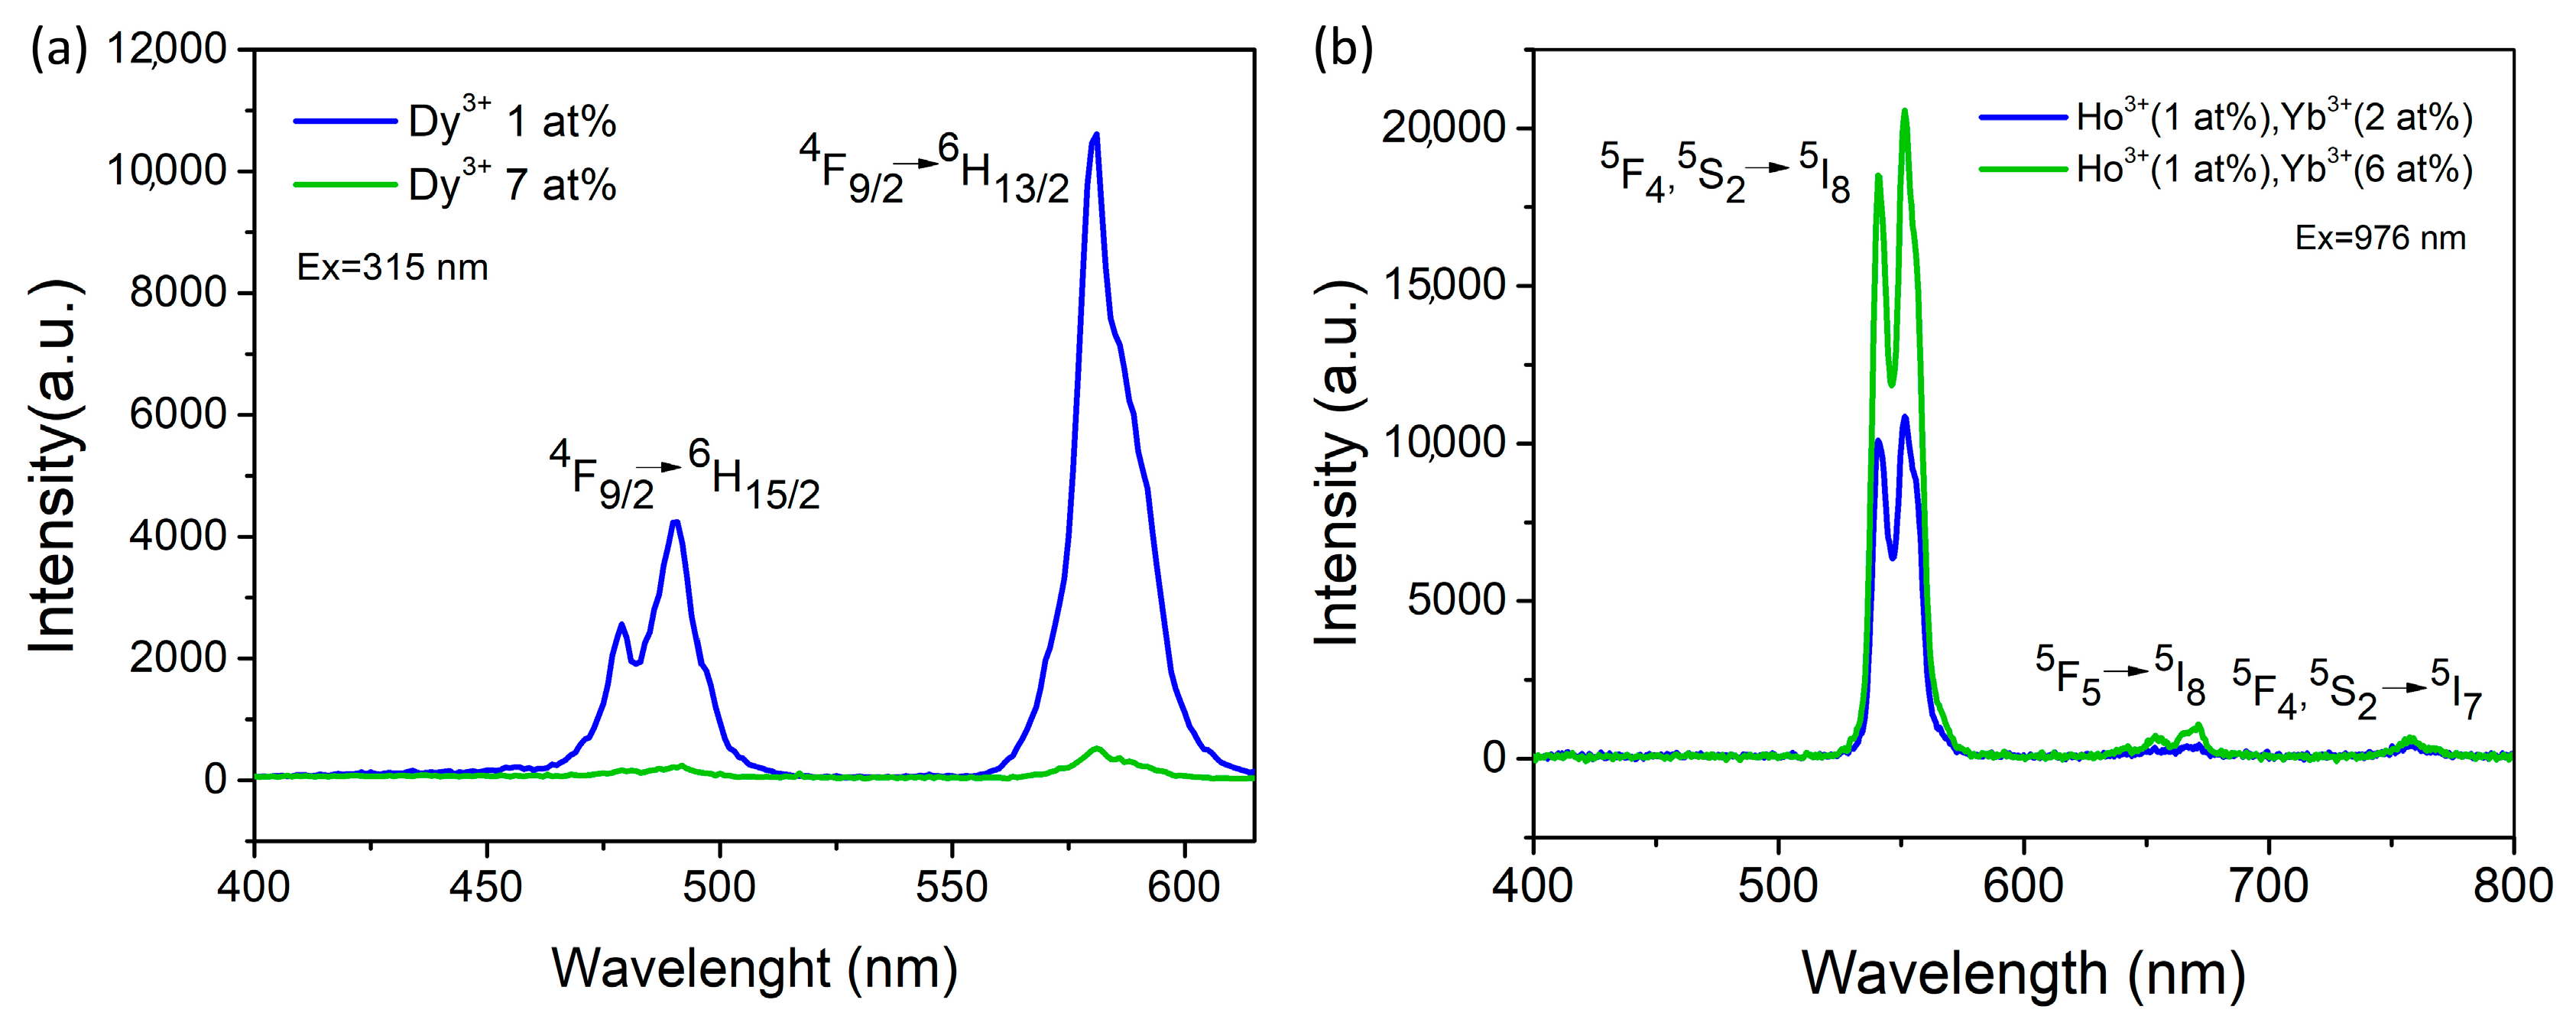
Figure 6a displays the emission spectra of SrGd
2O
4 doped with varying Dy
3+ concentrations (1 and 7 at%) that were recorded at an excitation wavelength of 315 nm. The two dominant emissions at 490 nm and 581 nm are associated with the
4F
9/2→
6H
15/2 and
4F
9/2→
6H
13/2 transitions, respectively. The peak intensity decreases as the Dy
3+ concentration rises, while the sample with the lowest dopant concentration has the maximum intensity.
Figure 6b depicts the concentration-dependent emission spectra of SrGd
2O
4 doped with varying Yb
3+ (2 and 6 at%) and Ho
3+ (1 at%) measured at the 976 nm excitation wavelength. The sample with the highest Yb
3+ concentration had the most intense luminescence intensity. The main peaks correspond to two green emissions (centered at 540 and 550 nm), which are caused by electron transitions between the closely packed
5F
4 and
5S
2 levels and the
5I
8 ground level. The weaker emission is due to the red emission (centered at 671 nm) caused by the
5F
5→
5I
8 transition. The emission with the lowest intensity is NIR at 758 nm, produced from the
5F
4,
5S
2→
5I
7 transition.
Based on the results of the photoluminescent study, we selected samples with the highest photoluminescence intensity for the demonstration of the results acquired from the UV-VIS measurements.
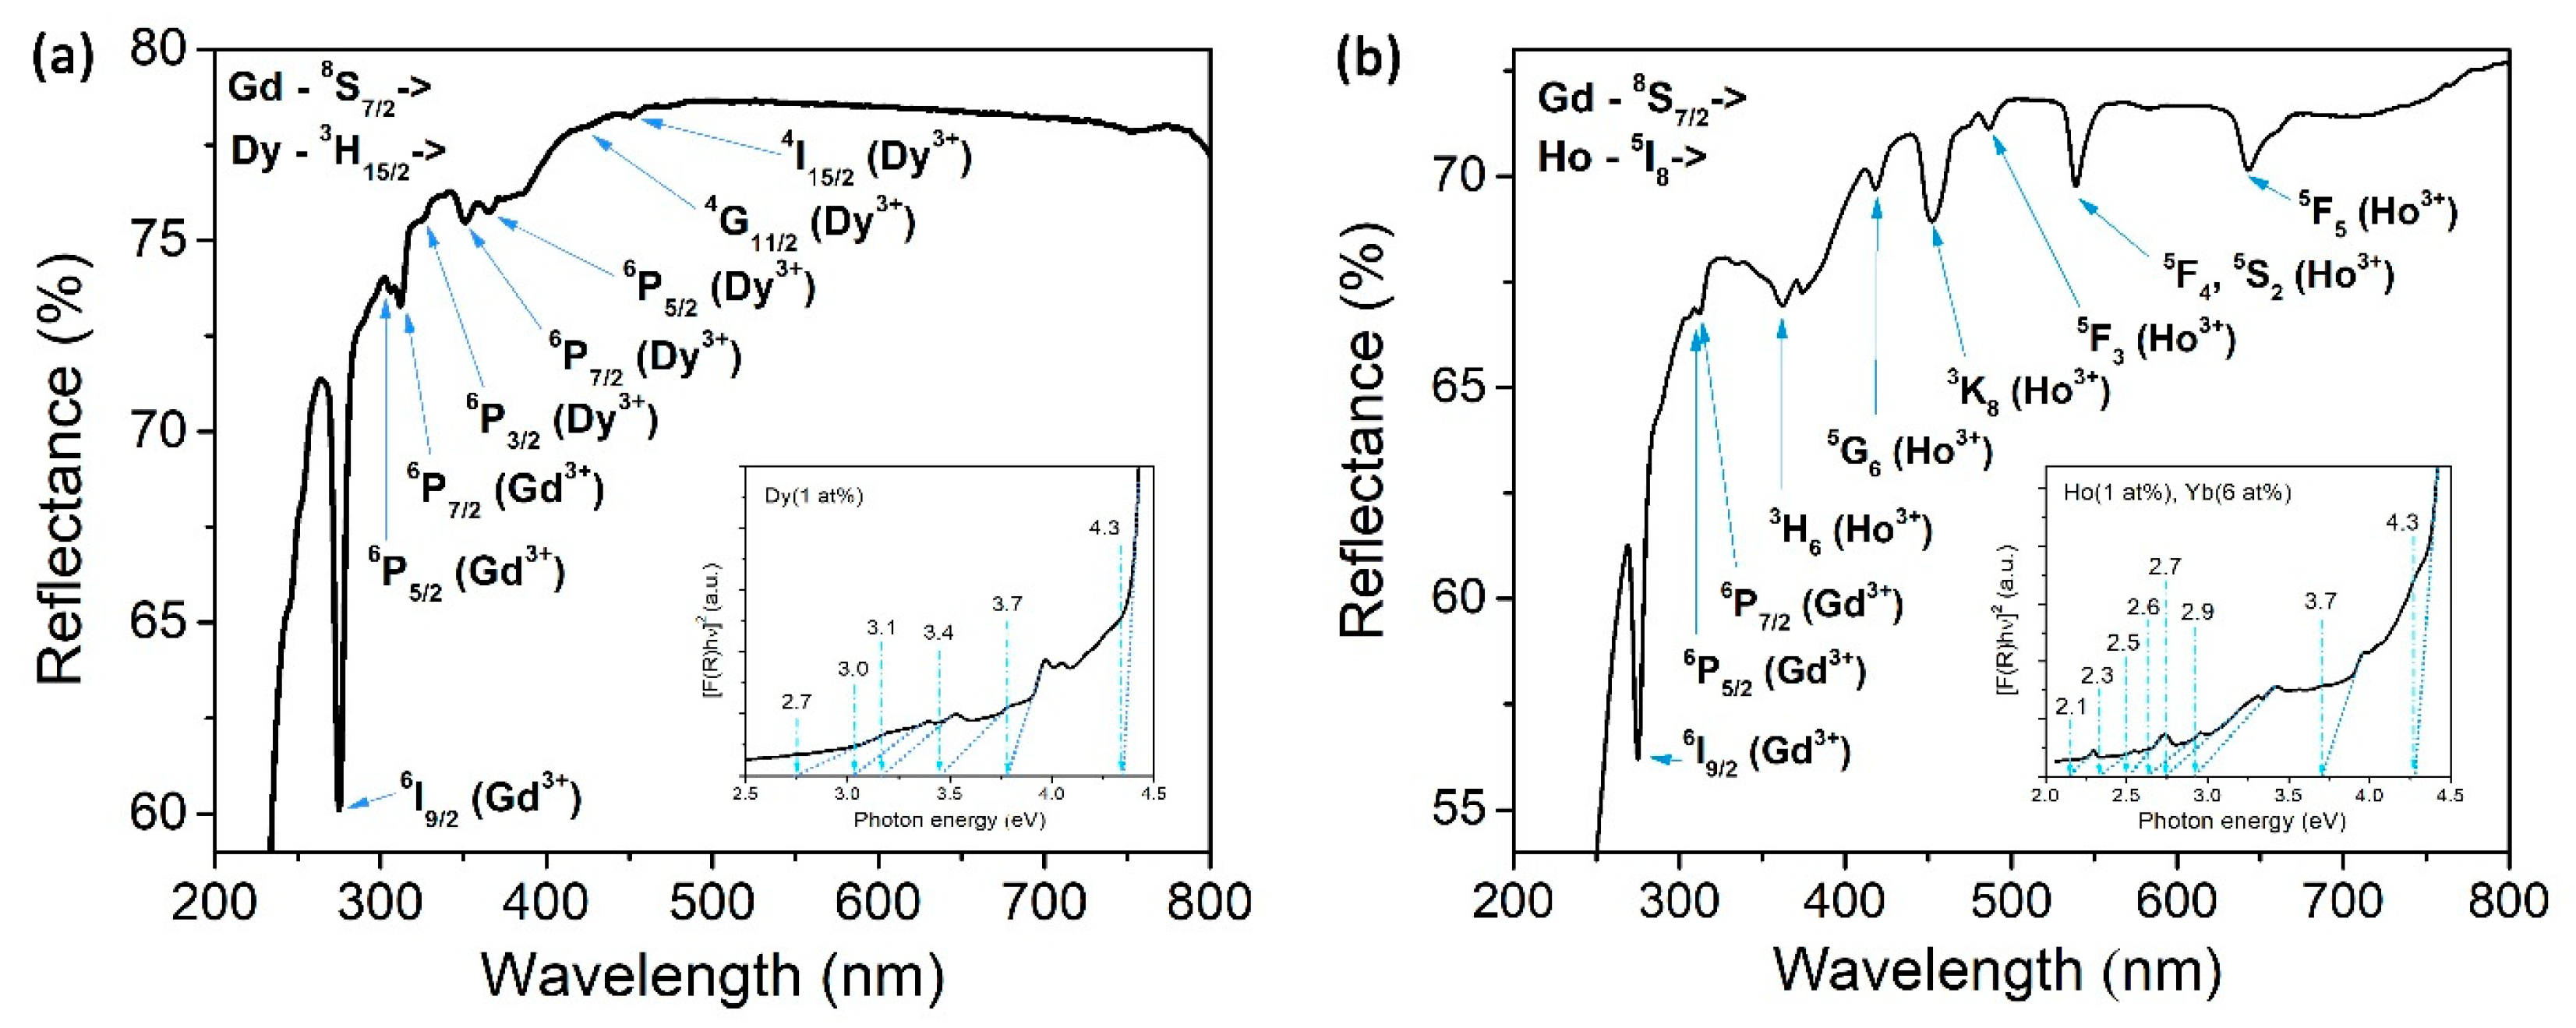
Optical measurements obtained by UV-VIS spectrophotometry can provide information on the material’s band gap energy, demonstrating its potential to be used as a photocatalyst. Diffuse reflectance spectra for selected samples doped with Dy
3+ and Ho
3+/Yb
3+ are shown in
Figure 7a,b respectively, along with derivative Kubelka-Munk functions as insets. Both DRS spectra showed maximums that can be assigned to Dy
3+ and Gd
3+ or Ho
3+ and Gd
3+ transitions, marked in each graph. Introducing various dopants clearly incites modifications in DRS spectra, noticeable in the region above 320 nm. Discovered peaks are a direct verification of the effective incorporation of dopants into the host lattice. Moreover, revealed peaks in the visible region are another indicator for a potentially good luminescent emission, which was previously demonstrated in the PL spectra shown in
Figure 6.
The Kubelka-Munk function was completed in the form of a direct allowed transition, where R is the diffuse reflectance of the examined material, and according to the equation:
Eg values were estimated by linear extrapolation from the absorption edge down to the energy axis [
38,
39]. The obtained results were around 4.3 eV for each sample, regardless of the used dopant ions. Furthermore, it can clearly be noticed from the K-M graphs that the experimental signal is not the same for each system. Accompanying levels appear in the energy band gap, implying that dopant incorporation introduces defects in the matrix. However, these levels are positioned at various energies, meaning that each dopant has a different influence on the material’s optical properties. Moreover, these extra levels can have a positive impact on the photocatalytic properties of the prepared materials by enhancing the degradation rate of the chosen pollutant. This is the consequence of forming oxygen vacancies or some other defects inside the crystal lattice or on the surface, which can reduce the recombination rate or act as scavengers for photogenerated electrons and therefore promote photocatalytic degradation [
40,
41].
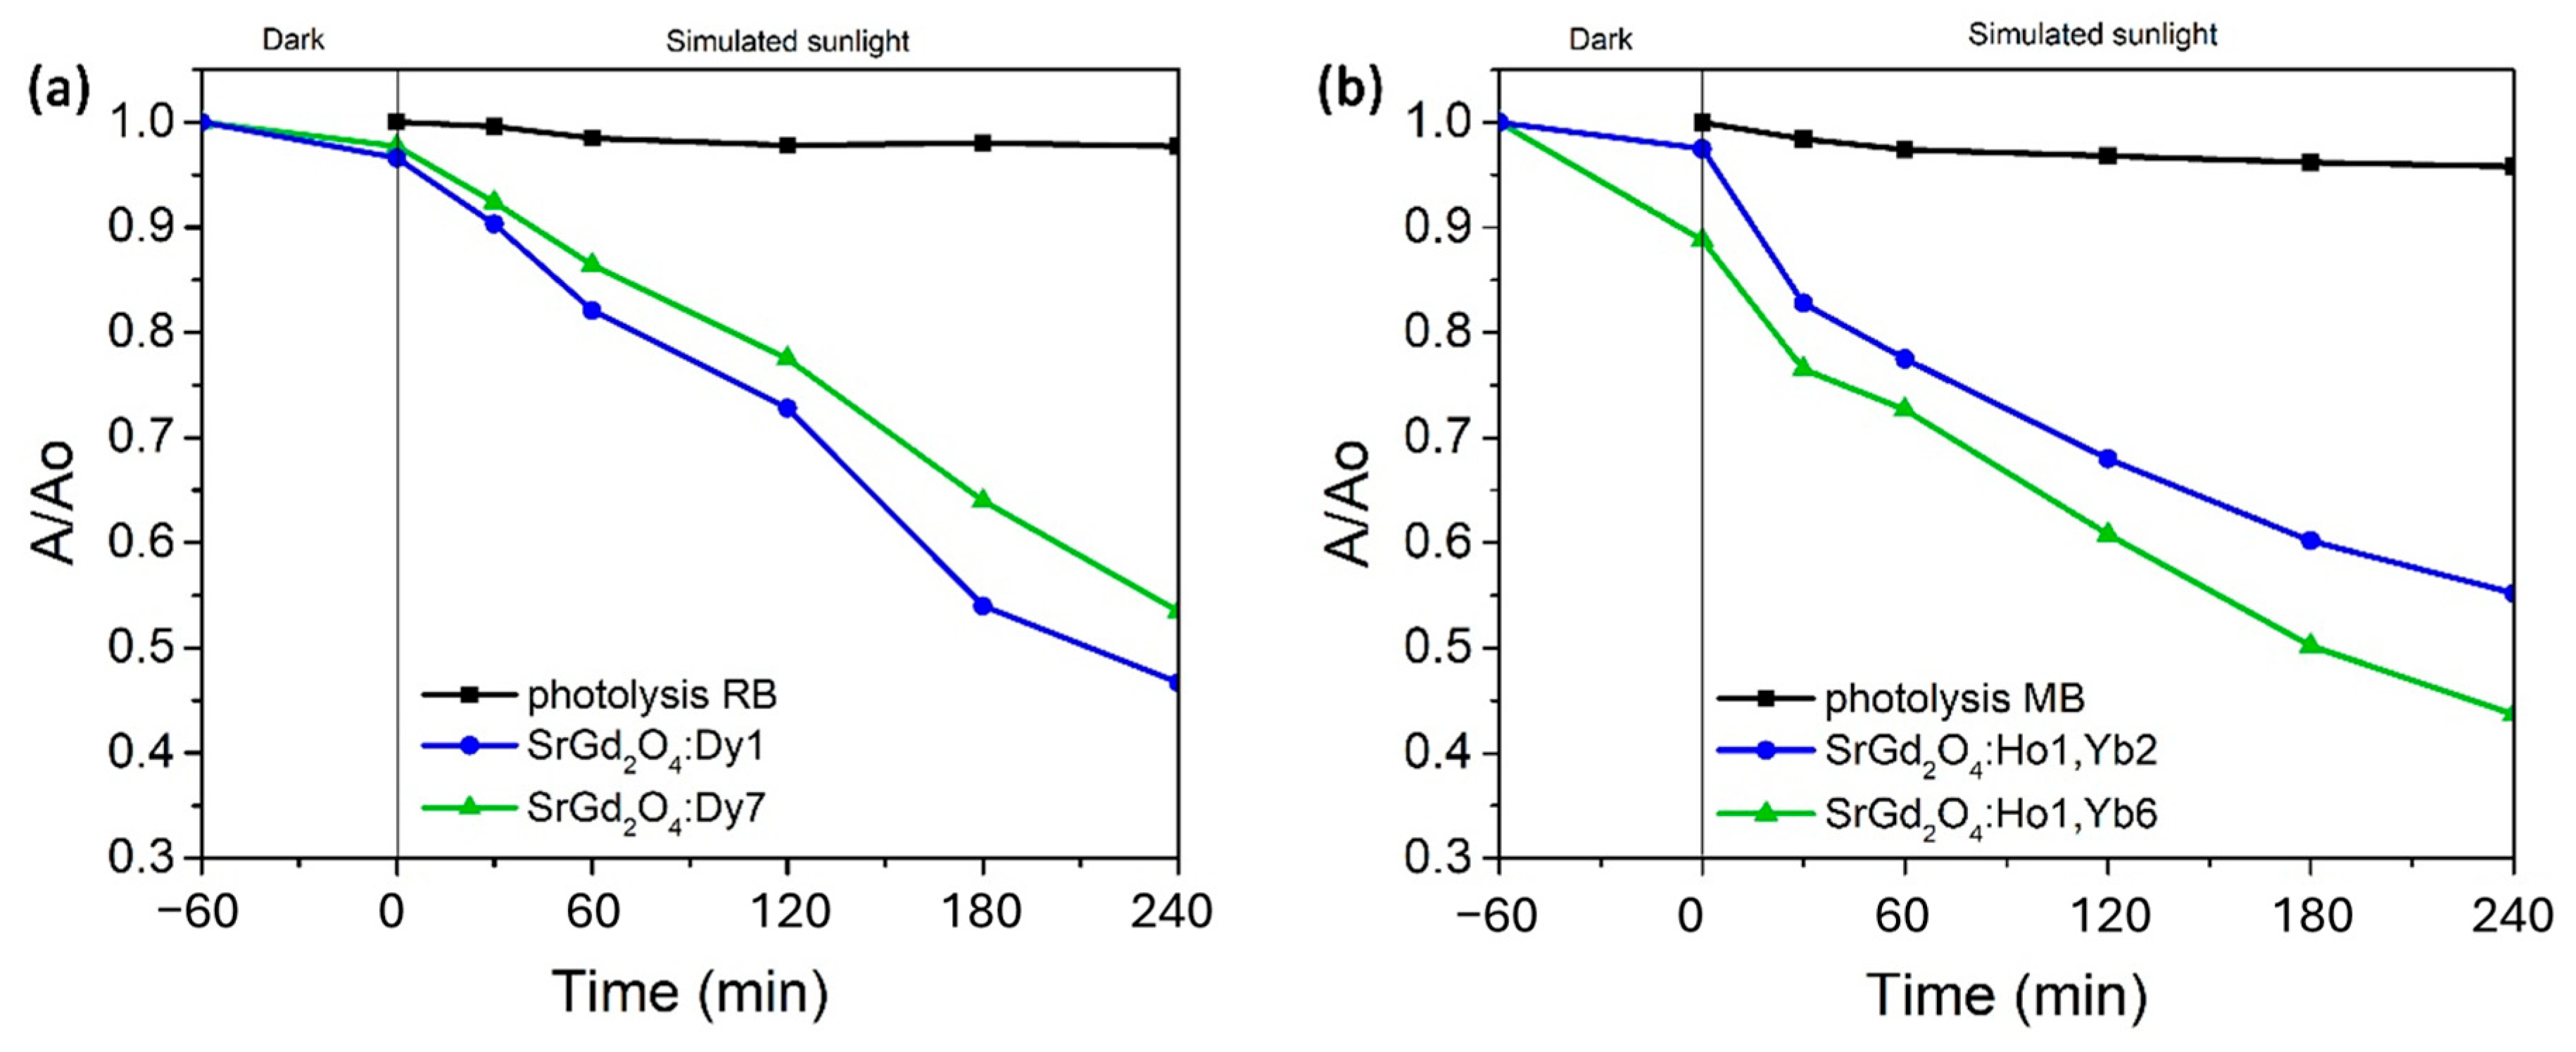
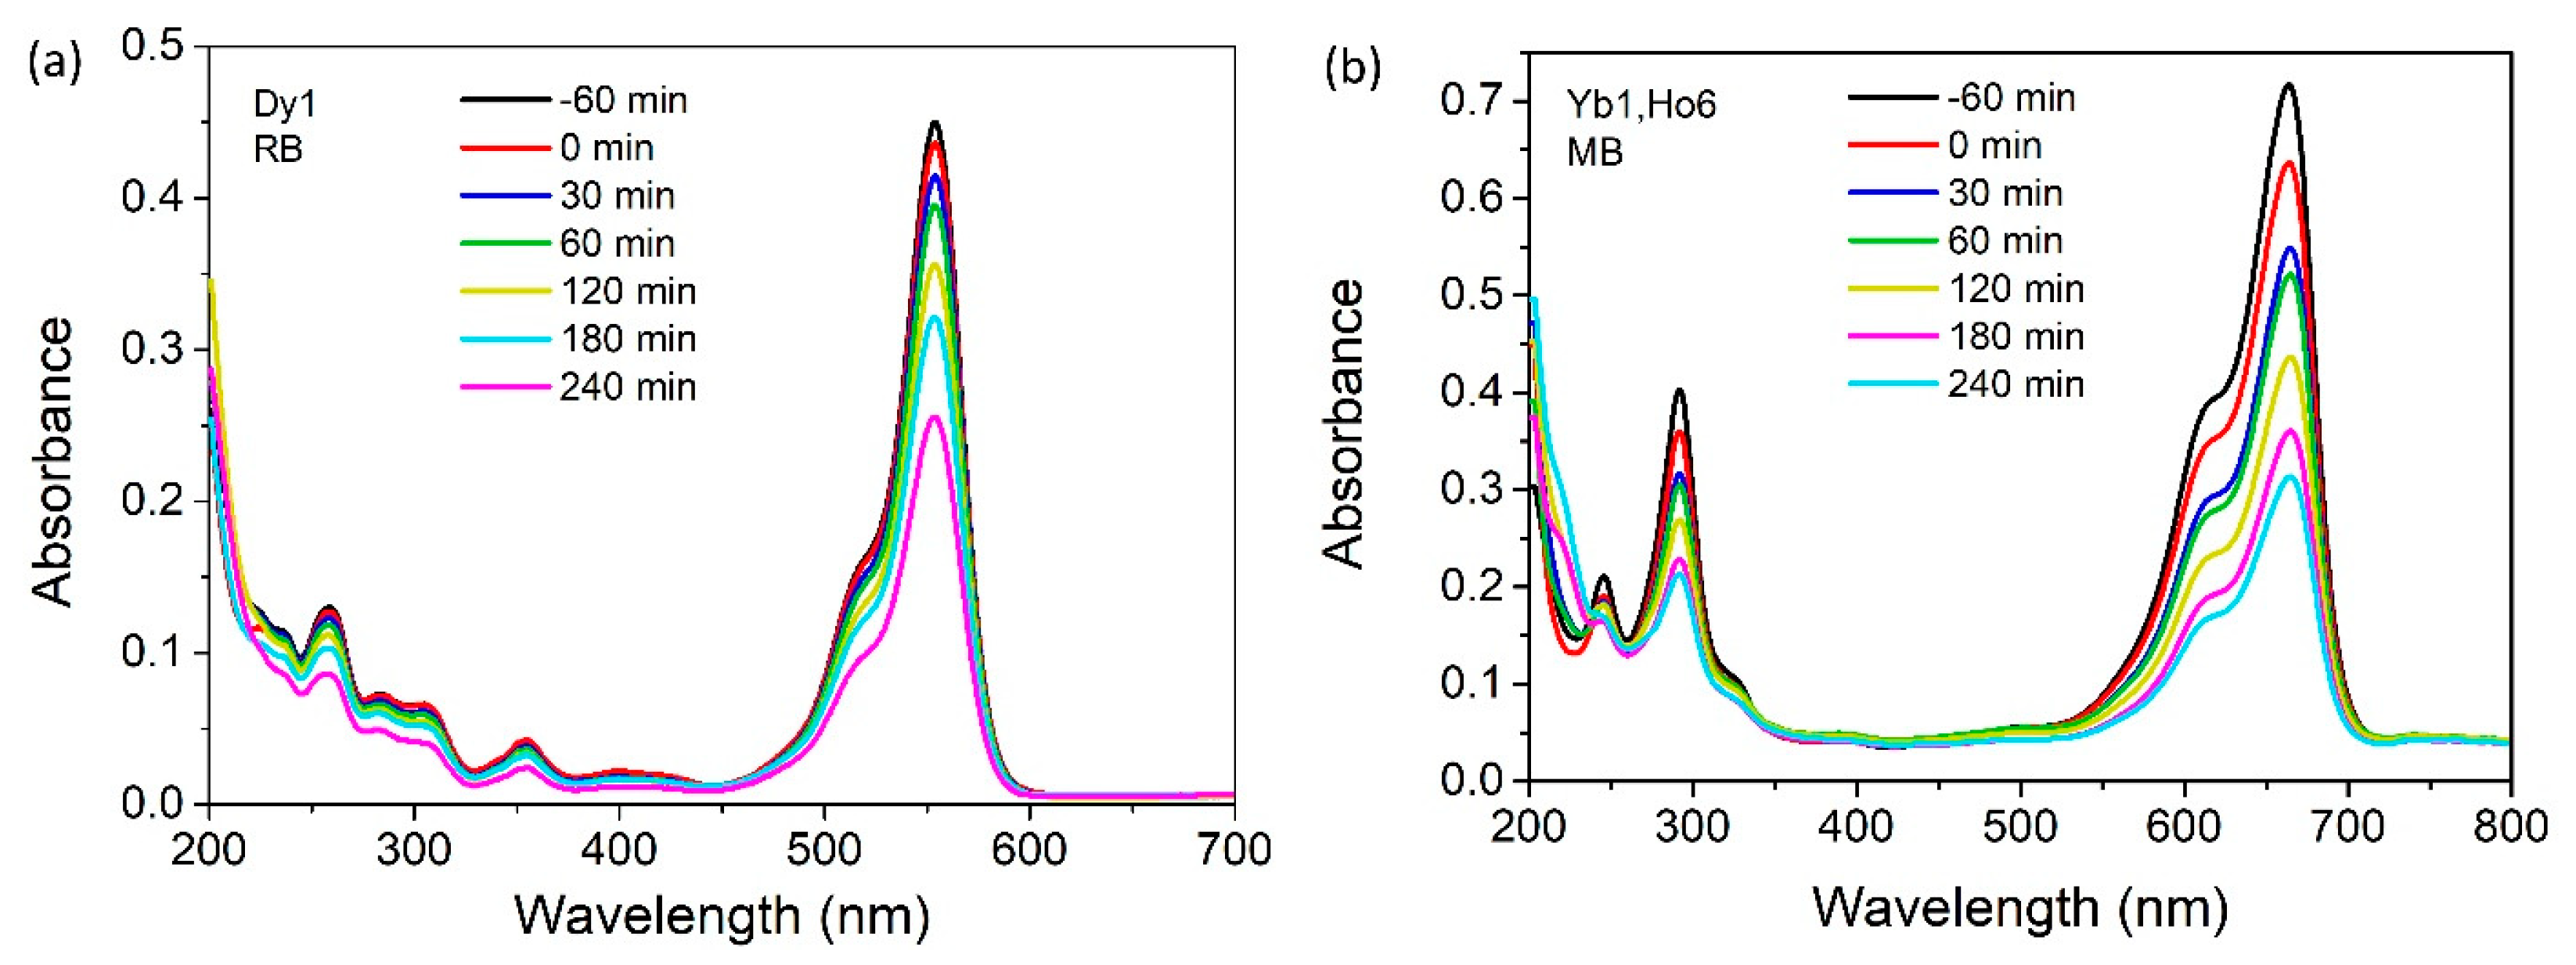
The photocatalytic activity of as-synthesized powders was examined in the degradation reactions of organic dyes rhodamine B and methylene blue as model pollutants. The results are presented as comparative kinetic curves in
Figure 8, where
Figure 8a refers to the reaction of the photocatalytic degradation of RB using down-convertor nanopowder, while
Figure 8b shows the degradation rate for MB over the up-convertor photocatalyst. The absorbance ratio A/A
0 was measured at 554 nm or 664 nm for RB or MB, respectively.
In the beginning, the photolysis of 3 ppm RB or MB aqueous solution was conducted to investigate the stability of the color under the light source, but without a photocatalyst (black line). Dye degradation was minimal, so the experiments of the photocatalytic degradation in the presence of down- or up-converting nanoparticles were conducted under the same conditions. Before the illumination, the dye solution with the photocatalyst was mixed in the dark to obtain adsorption-desorption equilibrium, which took one hour to complete. Dye adsorption onto the photocatalyst surface was proven to be sufficient to enable photocatalytic reaction. Next, the photocatalytic experiment continued for four hours under simulated sunlight. At the end of the photocatalytic experiment, the degradation rate for RB revealed that the initial dye concentration was reduced by 46% with SrGd
2O
4 doped with 7 at% Dy
3+ and by 54% after using SrGd
2O
4 doped with 1 at% Dy
3+, as illustrated in
Figure 8a. As for the MB mineralization, the degradation rate showed a decrease in the starting concentration of 45% when SrGd
2O
4 doped with 1 at% Ho
3+ and 2 at% Yb
3+ was used and of 56% with the sample doped with 1 at% Ho
3+ and 6 at% Yb
3+, as depicted in
Figure 8b.
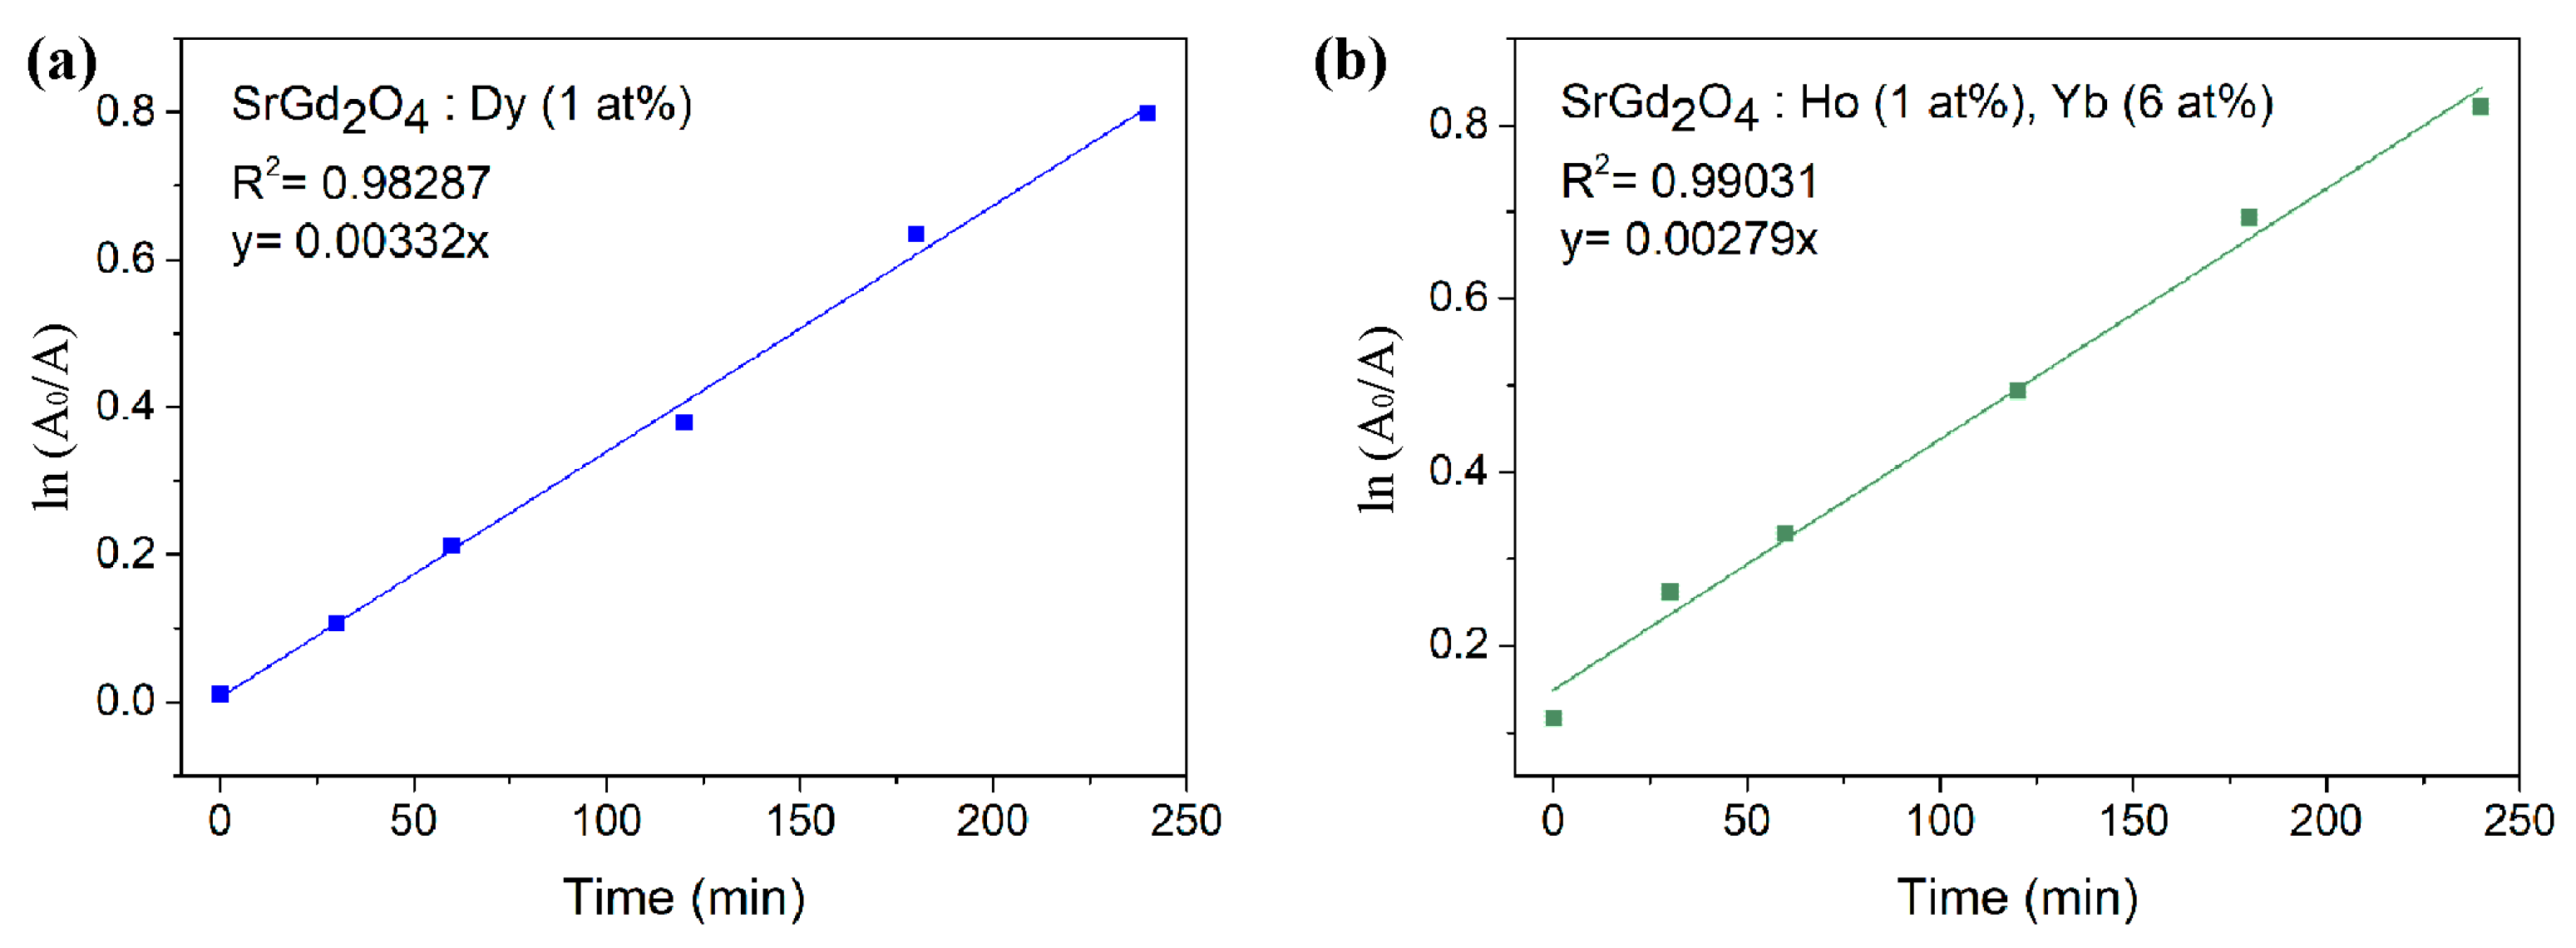
To evaluate the kinetics of the photocatalytic degradation reaction of RB, it was hypothesized that this reaction follows pseudo-first-order kinetics, since the dye is sufficiently diluted.
Figure 9a depicts the results obtained for the photocatalytic degradation of the dye in the presence of the synthesized catalyst SrGd
2O
4 doped with 1 at% of Dy
3+. This is confirmed by a line that passes through the origin with a coefficient of adjustment equal to 0.99559, demonstrating that the hypothesis is correct. Thus, under these conditions, the specific reaction rate, k, is 0.00332 min
−1. The same assumption is made for the catalyst SrGd
2O
4 doped with 1 at% Ho
3+ and 6 at% Yb
3+ to evaluate its kinetics. The findings of the dye’s photocatalytic degradation are shown in
Figure 9b. A coefficient of adjustment is equal to 0.99031, while the specific rate of reaction, k, is 0.00279 min
−1.
Two different mechanisms for the photocatalytic degradation of RB and MB exist [
42,
43]. The first one implies a breaking of the conjugated structure in the dye molecule by OH
•, reaching a complete mineralization. In this case, the intensity of the main peak drops down simultaneously, as does the smaller peak at lower wavelengths. The second degradation mechanism involves the de-ethylation process, recognizable by the uneven decrease of the previously mentioned peaks, either by the rise of the peak at lower wavelengths or by shifting the main peak to lower wavelengths, depending on the chosen color. As can be clearly seen from both
Figure 10a,b, the intensity of RB and MB peaks is reduced simultaneously during reaction, implying direct degradation, which would ultimately cause total dye mineralization, forming non-toxic products such as H
2O, CO
2, and others.
In the up-conversion process, Yb3+ ions absorb low-energy photons at 976 nm from simulated sunlight and transmit them to Ho3+ ions. Following the excitation of Ho3+ ions, many relaxation processes occur, resulting in two green, red, and NIR emissions. Down-conversion recorded at an excitation wavelength of 315 nm shows blue and green emissions. The extra levels in the band gap (acquired following the addition of Yb3+/Ho3+ and Dy3+ ions) that permit absorption of light at 590 nm and lower allow SrGd2O4 to absorb the up- and down-conversion emission. The production of reactive species OH• and O2−• is subsequently encouraged by the creation of a new bundle of e−/h+ pairs, which significantly improves photocatalytic degradation of certain pollutants.
When discussing the photocatalytic process with down-converting nanoparticles, it can be concluded that material with lower dopant concentration exhibits better photocatalytic efficiency. On the other hand, in the case with the up-convertor, better photocatalytic activity was revealed with materials that contain higher dopant concentration. Nevertheless, both experiments have one thing in common, and that is the fact that in both cases material that demonstrated higher luminescence intensity also exhibited better photocatalytic properties. This means that as-synthesized powders evinced multifunctionality, demonstrating suitable characteristics to be used in applications as a light source, but also in the environmental fields for photocatalytic degradation of various pollutants. Reasons for this behavior of as-synthesized materials are yet to be studied, since many factors can incite revealed effects. Surface groups, oxygen vacancies, or some other defects inside the material can be created by incorporating diverse dopant ions in various concentrations into the host [
40,
41]. Since some data in the literature state that a good photocatalyst cannot be good luminescent material, this study undeniably represents the opposite claim and a valuable discovery, leaving the resolving of the obtained results to be a challenging task for future analysis.
3. Materials and Methods
3.1. Sample Preparation
For the sample preparation and the photocatalytic experiments, strontium nitrate (Puratonic, Thermo Fisher Scientific, Waltham, MA, USA, 99.9%), gadolinium nitrate hexahydrate (Acros Organics, Thermo Fisher Scientific, Waltham, MA, USA, 99.9%), holmium nitrate hexahydrate (Acros Organics, Thermo Fisher Scientific, Waltham, MA, USA, 99.9%), ytterbium nitrate pentahydrate (Sigma Aldrich, St. Louis, MI, USA, 99.9%), dysprosium nitrate pentahydrate (Sigma Aldrich, St. Louis, MI, USA, 99.9%), citric acid (Kemika, Zagreb, Croatia, 99%), glycine (Kemika, Zagreb, Croatia, 99.5%), methylene blue (MB, Thermo Fisher Scientific, Waltham, MA, USA), and rhodamine B (RhB, Merck, Darmstadt, Germany, 99.8%) were used without further purification.
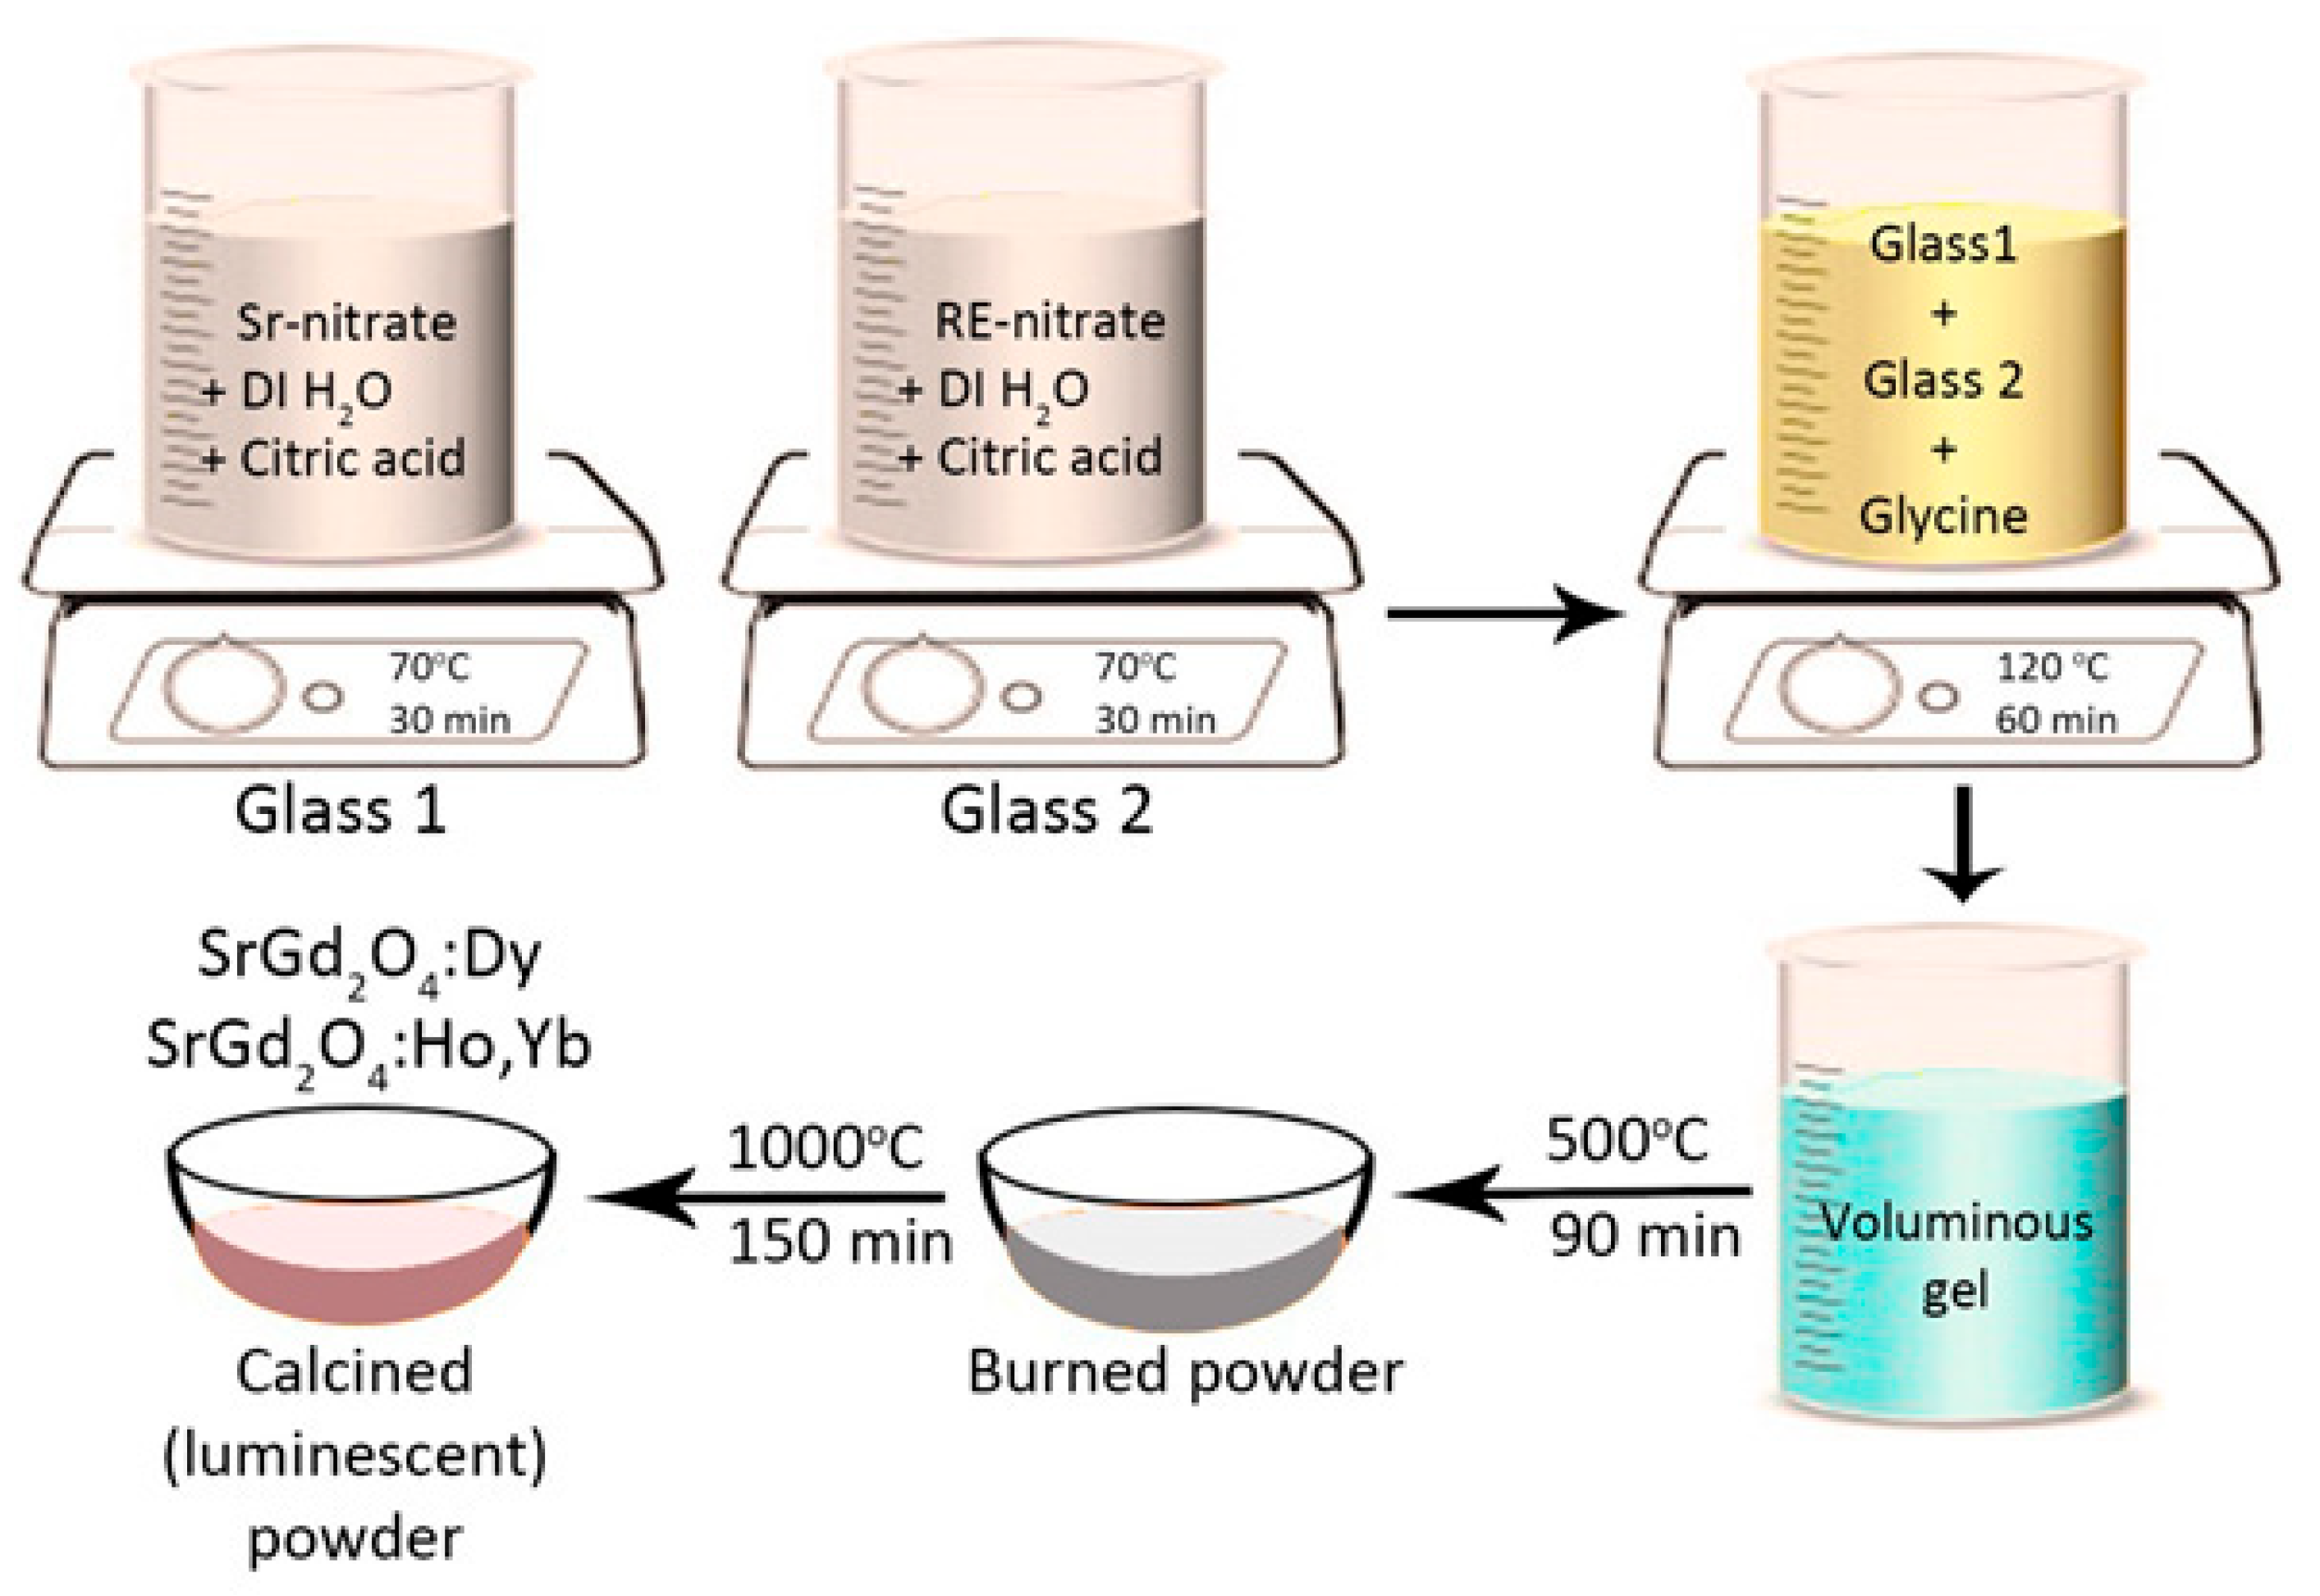
Up-conversion SrGd
2O
4 doped with Yb
3+ (2 and 6 at%) and Ho
3+ (1 at%) ions and down-conversion SrGd
2O
4 doped with Dy
3+ (1 and 7 at%) samples were prepared via sol-gel combustion synthesis. Citric acid was utilized as a chelator and glycine as fuel. Our earlier papers provided a detailed explanation of this preparation technique [
38,
39]. To summarize, deionized water was used in a different beaker to dissolve strontium nitrate and rare-earth nitrates. Each solution was then mixed with citric acid and left to dissolve for half an hour at 70 °C on a magnetic stirrer. Glycine was then added after the solutions had been combined and heated to 120 °C. The mixing proceeded until a gel formed, which was then burned for 1.5 h at 500 °C, followed by 2.5 h of calcination at 1000 °C. A schematic presentation of the synthesis is presented in
Figure 11.
3.2. Characterization Methods
A FEI Talos F200X microscope (Thermo Fisher Scientific, Waltham, MA, USA) equipped with an X-FEG source and a maximum accelerating voltage of 200 kV was used for microstructural examination utilizing transmission electron microscopy (TEM). Investigations were conducted using scanning transmission electron microscopy (STEM), high-angle annular dark-field (HAADF) with energy dispersive spectroscopy (EDS), and conventional and high-resolution transmission electron microscopy (TEM and HR-TEM). A tiny quantity of powder was dissolved in ethanol to prepare the sample for TEM analysis. A drop of the mixture was then placed onto a copper grid coated with carbon and allowed to dry in the open air. ImageJ software, version 1.54g, was used for image analysis and interplanar distance computations.
A Spex Fluorolog (Horiba, Kyoto, Japan) spectrofluorometer was utilized to measure the luminescence spectra of the Dy3+ doped samples, while a TE-Cooled CCD fluorescence spectrometer (Edmund Optics, Barrington, NJ, USA) and a 976 nm laser diode (Thorlabs) were utilized for photoluminescence emission measurements at room temperature for the Yb3+/Ho3+ doped samples.
A Shimadzu (Kyoto, Japan) UV-2600I spectrophotometer with an integrated sphere attachment was used for detecting UV–VIS. After recording the 200–1200 nm spectral region using diffuse reflectance spectroscopy (DRS), the band gap value was estimated using the Kubelka–Munk algorithm.
3.3. Photocatalytic Performance Test
The photocatalytic degradation of MB was performed in 3 ppm aqueous solution using 20 mg up-conversion SrGd2O4:Yb, Ho samples under light illumination (Osram Vitalux lamp, 300 W, 270 V, sunlight simulation; white light: UVB radiated power from 280 to 315 nm, 3.0 W; UVA radiated power 315–400 nm, 13.6 W; the rest of the spectrum corresponds to visible and IR light, positioned 30 cm over the reaction solution). Under the same conditions, the degradation of RB was carried out using SrGd2O4: Dy samples as photocatalysts. To reach the adsorption-desorption equilibrium, the reaction solution was placed in the dark for one hour before illumination. To keep the reaction solution from heating up and evaporating, the system was frequently iced. Throughout the photocatalysis, a constant flow of O2 was bubbled through either MB or RB aqueous solutions. After centrifuging 2 cm3 aliquots for 30 min, the supernatant’s absorption spectra were recorded. The first aliquot was obtained just before the start of the procedure, and the second one was obtained one hour after adsorption in the absence of light. Following a 30-min break, the third and fourth aliquots were taken during light irradiation. The final three aliquots were drowned out one at a time, after one hour, for the next three hours. To ensure that the catalyst particles were evenly distributed throughout the experiment, MB or RB aqueous solutions were maintained on the magnetic stirrer.


