Article

Optimized Tandem Affinity Purification Strategy Enables High-Yield Isolation and Functional Characterization of Native COMPASS in Saccharomyces cerevisiae

1
Shanghai Frontiers Science Center of Optogenetic Techniques for Cell Metabolism, School of Biotechnology, East China University of Science and Technology, Shanghai 200237, China
2
State Key Laboratory of Microbial Metabolism, School of Life Sciences and Biotechnology, Shanghai Jiao Tong University, Shanghai 200240, China
3
Zhangjiang Institute for Advanced Study, Shanghai Jiao Tong University, Shanghai 201203, China
*
Authors to whom correspondence should be addressed.
Catalysts 2025, 15(6), 521; https://doi.org/10.3390/catal15060521
Submission received: 20 March 2025 / Revised: 15 May 2025 / Accepted: 22 May 2025 / Published: 26 May 2025
(This article belongs to the Special Issue Enzyme Engineering—the Core of Biocatalysis)

Abstract

:
Histone 3 lysine 4 methylation (H3K4me) is an evolutionarily conserved epigenetic marker associated with transcriptional activation, playing a crucial role in growth and development. In yeast, all forms of H3K4 methylation are catalyzed by the COMPASS complex. However, purifying endogenous COMPASS remains challenging due to its low abundance, compositional complexity, and structural instability, resulting in low yield, poor purity, and heterogeneity in isolated complexes. These technical limitations have impeded the structural elucidation of the intact COMPASS complex and contributed to inconsistencies in reported in vitro enzymatic activity, thereby limiting a comprehensive understanding of its functions. Here, we present an optimized tandem affinity purification strategy that enables the high-yield isolation of native COMPASS from Saccharomyces cerevisiae with >99% purity and intact subunit composition, as validated by biochemical analyses. Using recombinant nucleosomes as substrates, we systematically characterized its catalytic properties and found that endogenously purified COMPASS exhibited strict dependence on H2B ubiquitination for catalyzing H3K4 methylation. This work establishes an efficient purification strategy for future structural and functional studies of COMPASS and provides critical insights into its catalytic properties.

Graphical Abstract

1. Introduction

Chromatin dynamics, governed by post-translational histone modifications, represent a cornerstone of epigenetic regulation across eukaryotes [1,2,3]. Among these modifications, histone H3 lysine 4 (H3K4) methylation is an evolutionarily conserved hallmark of transcriptionally active chromatin, spanning from yeast to mammals [4]. The trimethylated form (H3K4me3) is enriched at the promoters of actively transcribed genes [5,6], while mono- and di-methylation (H3K4me1/me2) demarcate enhancers and elongating transcription units, respectively [7,8,9]. These methylation states orchestrate critical processes, such as cell differentiation and oncogenesis, by recruiting chromatin remodelers and transcription machinery [4].
Methylation of H3K4 is catalyzed by the complex of proteins associated with Set1 (COMPASS), which is highly conserved from yeast to humans. Unlike mammals, which have evolved at least six SET1/MLL family members to catalyze H3K4 methylation [10], budding yeast presents a simplified model, with Set1/COMPASS serving as its sole H3K4 methyltransferase [10,11,12]. The COMPASS complex catalyzes H3K4 methylation through its core subunit Set1, which transfers a methyl group from S-adenosylmethionine (AdoMet) to nucleophilic ε-amino group of H3K4 [13,14,15]. However, the methyltransferase activity of Set1 is relatively weak and requires assembly into a multi-subunit complex with Swd1, Swd2, Swd3, Bre2, Sdc1, Spp1, and Shg1 to achieve robust catalytic potency [12,16,17,18,19,20]. These regulatory subunits differentially influence complex integrity, structural stability, and the establishment of distinct H3K4 methylation patterns. Specifically, Swd1 and Swd3 are essential for maintaining complex stability and integrity [21,22]. Sdc1 and Bre2 stimulate the H3K4me2/3 catalytic activity of Set1, while Spp1 facilitates H3K4me3 [22,23]. Unraveling the structural architecture and catalytic mechanism of the COMPASS complex will not only deepen our understanding of its biological functions but also provide mechanistic insights into its mammalian homologs and H3K4-related diseases.
Recent studies have partially elucidated the interaction networks and catalytic mechanisms of core COMPASS subcomplexes, which comprise truncated Set1 fragments and a subset of regulatory subunits [24,25,26,27,28,29]. However, critical gaps remain in understanding the assembly of the intact complex and the precise regulation of its methyltransferase activity [30,31,32]. While cryo-EM structures of core COMPASS have been determined [25,26,29,33,34,35,36], high-resolution structures of the fully assembled complex remain elusive, hindering a mechanistic understanding of its assembly and subunit coordination. Furthermore, functional studies on individual subunits have revealed inconsistencies in in vitro analyses. For instance, one study reported that Bre2-deficient COMPASS retains residual di-methylation activity, whereas another found a complete loss of activity [37,38], raising concerns about whether the native catalytic activity of COMPASS is fully preserved during purification and in vitro assays. These unresolved challenges highlight the need for high-purity, fully intact COMPASS with native conformation and activity to facilitate future investigations.
The endogenous COMPASS complex exhibits considerable purification challenges, primarily due to its low cellular abundance and inherent instability. The core subunit Set1 is present at only ~980 molecules per cell, making it one of the least abundant proteins, ranking at the bottom 10% of the proteome [39]. Additionally, the dynamic assembly of the complex, mediated by weak and indirect subunit interactions, renders it inherently labile and prone to dissociation during purification [16,40]. A comprehensive review of methodological studies over the past two decades reveals three major obstacles in native COMPASS complex purification: (1) low yields, with affinity-purified recovery typically below 5% [16]; (2) structural incompleteness due to the dissociation or degradation of labile subunits, such as Shg1 and Set1 [16,29,41,42,43]; and (3) co-purification of heterogeneous contaminants, with compositions varying significantly across different experimental systems [16,20,29,41,42,43]. To overcome these challenges, it is essential to develop optimized purification strategies that enhance yield, preserve structural integrity, and retain native catalytic activity, thereby enabling comprehensive structural and functional characterization of the intact COMPASS complex.
Here, we present an optimized strategy for endogenous COMPASS purification. By optimizing culture conditions, refining cell lysis, and improving affinity purification protocols, we successfully obtained 50 μg of intact COMPASS from a 10 L S. cerevisiae cell culture with >99% purity while preserving its native subunit composition. Furthermore, our systematic characterization of its substrate specificity revealed a strict dependency on H2B ubiquitination for H3K4 methylation activity. Our work establishes a standardized purification strategy that overcomes conventional challenges in isolating the intact COMPASS complex, paving the way for future structural and functional studies. Moreover, our systematic biochemical analyses provide new insights into the regulation of COMPASS activity through histone cross-talk.

2. Results and Discussion

2.1. Conventional TAP-Based Purification Fails to Efficiently Isolate Endogenous COMPASS from Yeast

To obtain the intact endogenous COMPASS complex from Saccharomyces cerevisiae for in vitro structural analysis and biochemical characterization, a robust purification method is required to isolate the complex in its native form. We initially employed a classical tandem affinity purification (TAP) strategy, which has been widely used to isolate multi-protein complexes through the affinity tagging of specific subunits [44,45,46]. We chose Bre2 as the TAP-tag fusion partner to target the COMPASS complex, based on previous evidence indicating that tagging this subunit yields higher-purity complexes compared to other COMPASS components [16,47].
To establish a TAP-compatible yeast strain for COMPASS purification, a TAP tag comprising two IgG binding domains of Staphylococcus aureus protein A (ProA), a Tobacco Etch Virus (TEV) protease cleavage site, and a calmodulin-binding peptide (CBP) was integrated in-frame downstream of the BRE2 locus in wild-type BY4742 strains. Simultaneously, a HIS3 selectable marker cassette was introduced to enable the selection of recombinant strains on histidine-deficient plates (Figure 1a). The resulting engineered strain was named YTP-Bre2.
To express TAP-tagged COMPASS complexes, YTP-Bre2 strain was cultured in 6 L YPD media and harvested at mid-log phase. Cells were lysed using high-pressure homogenization and clarified lysates were subjected to a two-step tandem affinity purification process as previously described [16]. Protein A-tagged COMPASS complexes were first captured by IgG Sepharose chromatography, followed by stringent washing to remove non-specific proteins and TEV protease cleavage to elute Bre2-CBP with other COMPASS components. A second purification step using calmodulin affinity chromatography further enriched the complex. Final elution under calcium chelation conditions yielded enriched COMPASS (Figure 1b).
Despite achieving a high level of enrichment, several limitations remained with this protocol (Figure 1c). While the eluted complexes retained most of the expected subunits, the Shg1 subunit was notably absent. Additionally, the purified complex exhibited substantial heterogeneity, with considerable variation in the relative abundance of individual components. The presence of non-specific protein contaminants and potential degradation products further indicated a lack of purity. These observations are consistent with previous reports on COMPASS purification [16,41,43,48], and reflect the common challenges associated with endogenous purification approaches, including subunit dissociation, compositional variability, and contamination.

2.2. Optimizing Culture Conditions Leads to Enhanced Expression of COMPASS Core Subunit Set1

Given the challenges associated with endogenous COMPASS purification, improving the expression and stability of its subunits is essential for obtaining an intact, functional complex. Previous studies have shown that delaying the diauxic shift—a metabolic transition in which cells switch from a preferred carbon source to an alternative one after its depletion, typically causing a temporary growth lag—can enable a more efficient biosynthesis of proteins with inherent expression barriers [49,50]. Since some COMPASS components are relatively low in abundance, we hypothesized that prolonging the pre-diauxic growth phase might enhance overall COMPASS expression and facilitate complex assembly.
To test this, we implemented a glucose supplementation strategy during the late respiro-fermentative phase (OD600 ≈ 3.0) to delay the diauxic shift and sustain higher cell proliferation rates. A single addition of 2% (w/v) glucose solution was supplied to replenish the rapidly depleted carbon source, and agitation was increased to 220 rpm to optimize oxygenation [51]. After 26 h of cultivation, glucose-supplemented cultures exhibited a 17% increase in biomass (OD600 = 6.2 ± 0.2) compared to conventional batch culture (OD600 = 5.3 ± 0.02, p = 0.02), confirming that this approach effectively enhanced cell growth (Figure 2a).
To determine whether this metabolic modulation influenced COMPASS protein levels, we constructed TAP-tagged strains for each subunit and performed Western blot analysis using TAP-specific antibodies to evaluate the expression of each subunit. The results showed that the expression levels of most COMPASS subunits remained comparable (Figure 2b,c), with the notable exception of Set1, whose protein level increased significantly by 1.6-fold in glucose-supplemented cultures (Figure 2b,c). Given that Set1 is the only catalytic subunit of COMPASS, its inherently low expression level may represent a bottleneck in complex assembly. In fact, Set1 has been reported to function as a co-translational ‘driver’ subunit, forming the SET1RC (SET1 mRNA-associated complex) to coordinate COMPASS assembly with proper stoichiometry and regulate its abundance [52,53]. Thus, this increase in Set1 levels is likely to enhance the stoichiometric balance of COMPASS subunits, ultimately facilitating the assembly of functional complex and improving the yield of intact COMPASS.

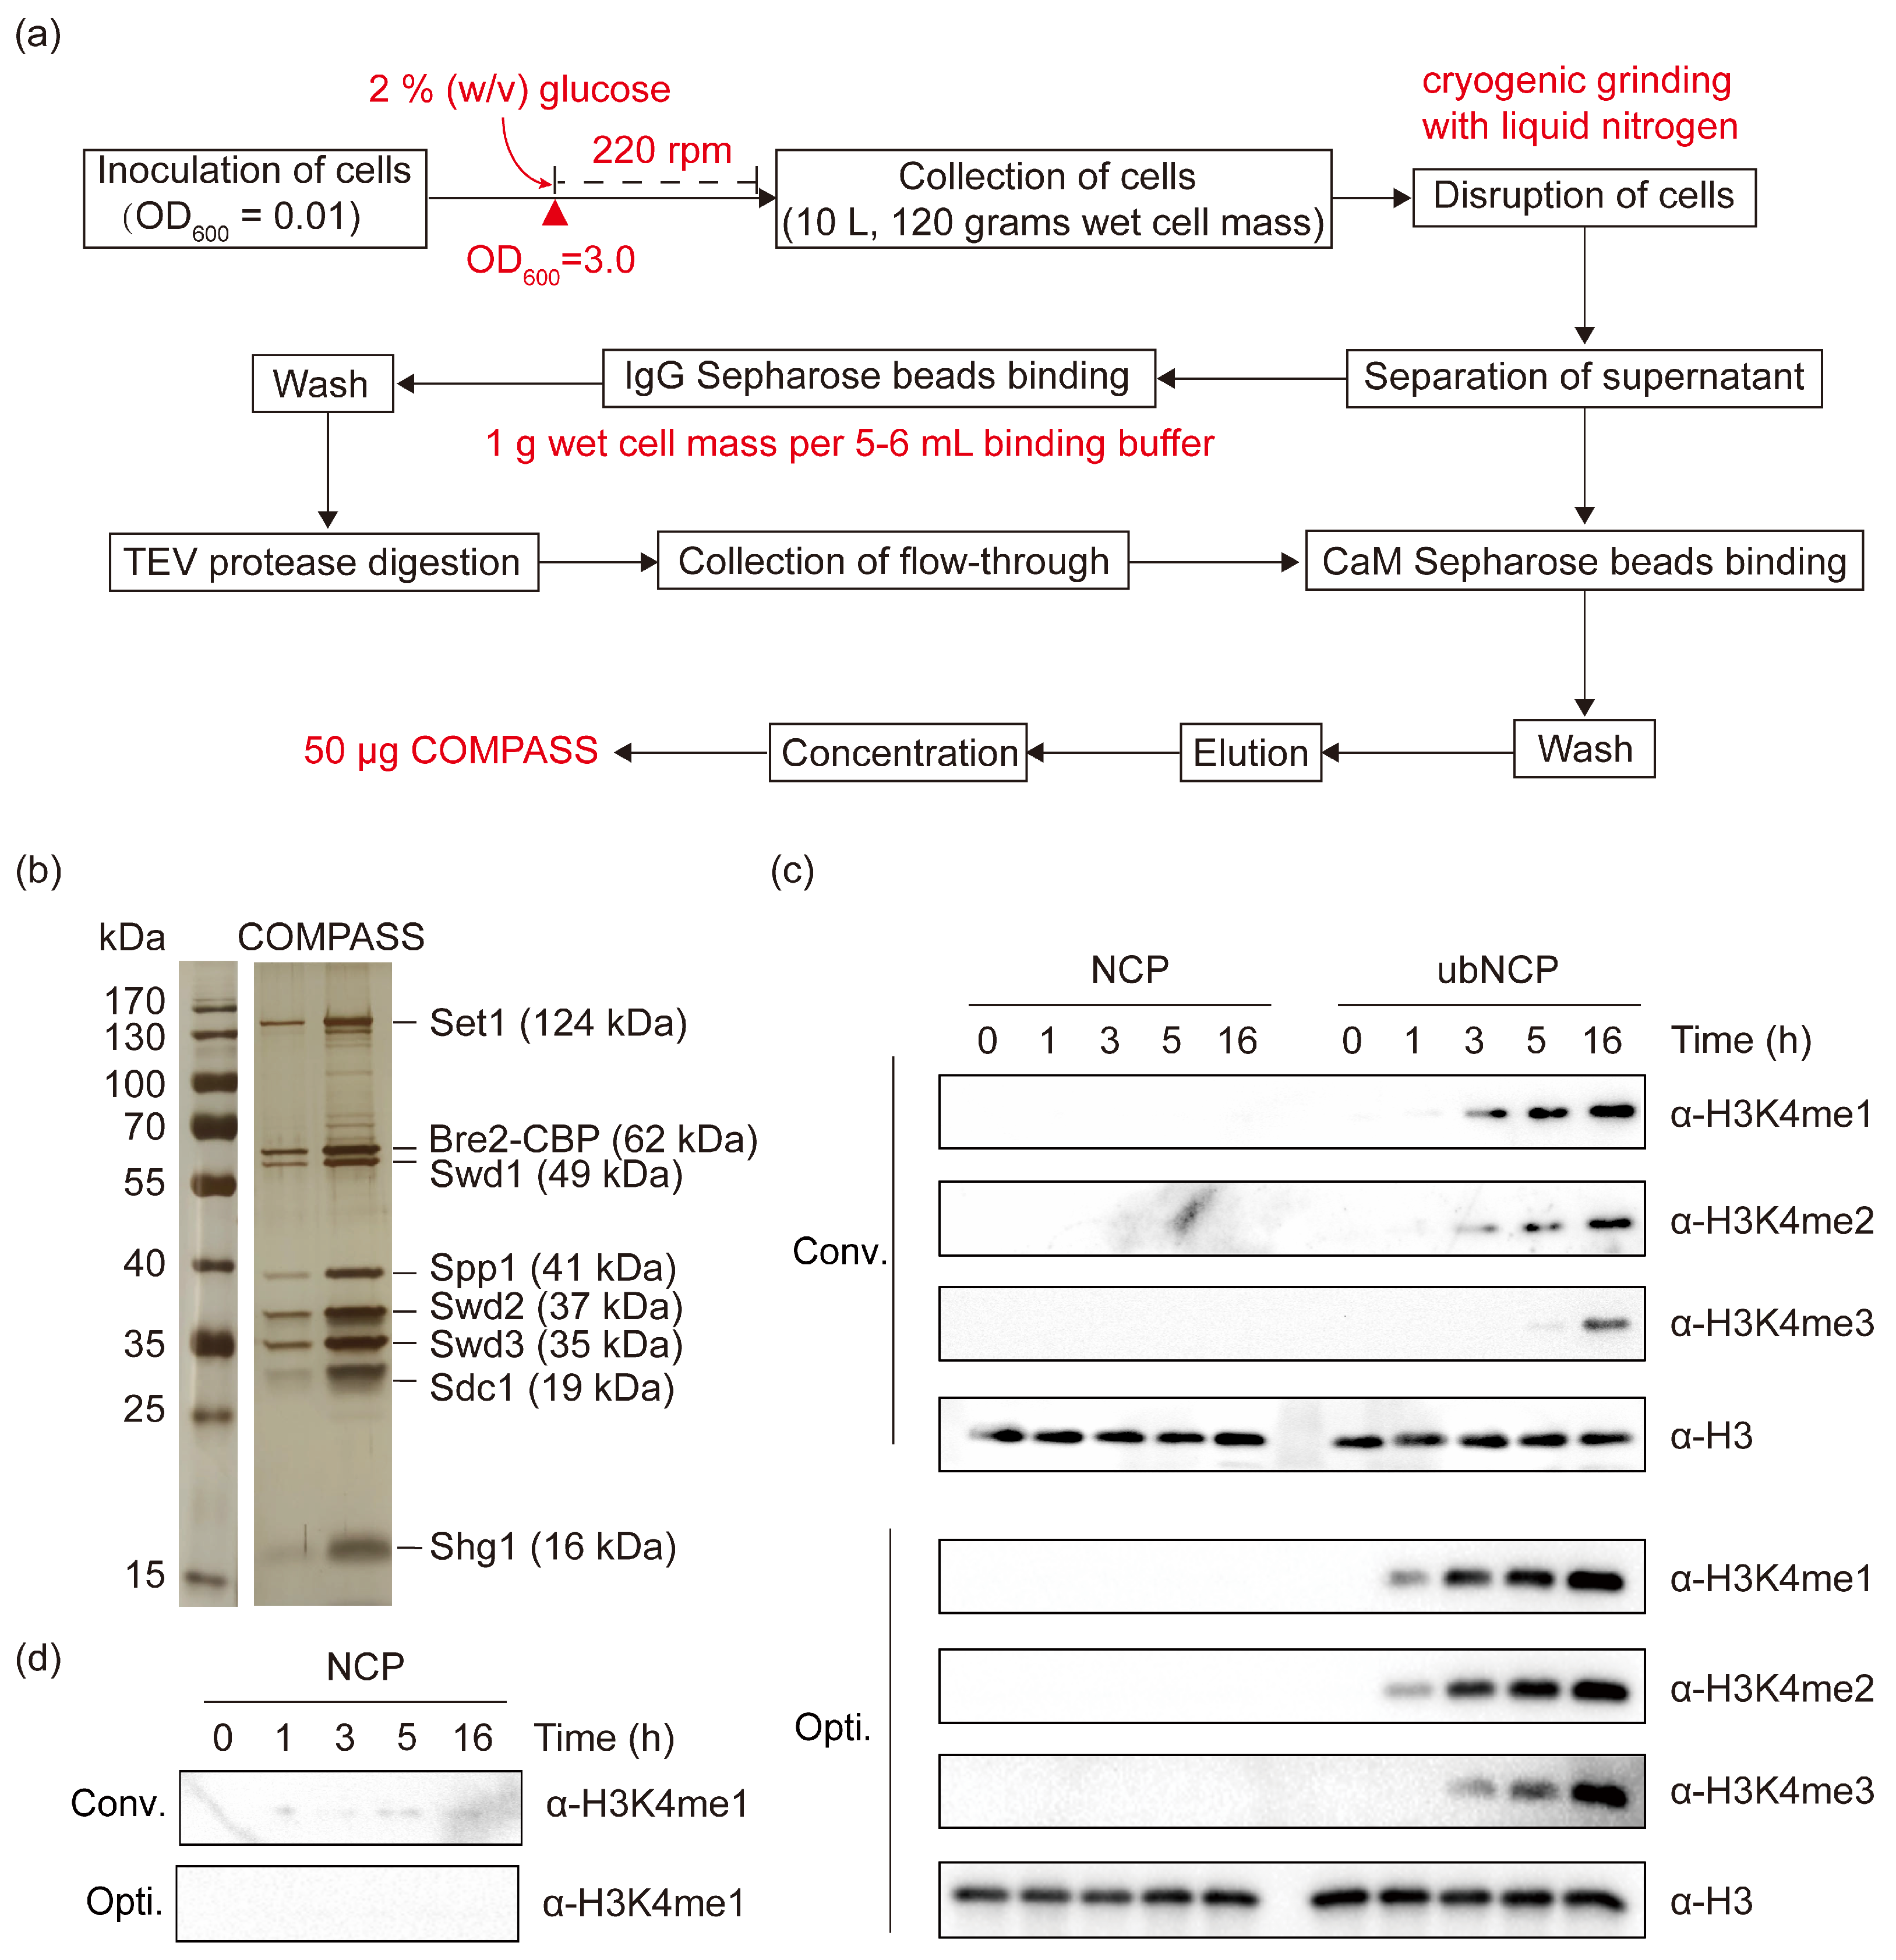
2.3. Optimized Cell Lysis and Affinity Purification Enable Efficient Preparation of High-Quality COMPASS

To systematically identify key limitations in previously reported COMPASS TAP purification approaches [16,41,43,48], we purified COMPASS from 120 g of wet weight cells grown under optimized culture conditions using the previous purification method described in Section 3.4 and analyzed the distribution of Bre2 and Set1 in samples collected at each step of the purification process (Figure 3a).
Western blot analysis revealed significant inefficiencies in the previous purification method, including inadequate cell lysis, insufficient affinity capture, and excessive protein degradation. First, we observed a persistent accumulation of Bre2 in pellet fractions after cell lysis (Figure 3b, left, lane 2, indicated by an arrow), suggesting incomplete cellular disruption by conventional high-pressure homogenization (>1000 bar) or potential protein aggregation. This phenomenon indicates that excessive shear forces and local heating during cell disruption may destabilize Bre2, leading to its precipitation and irreversible aggregation. Second, approximately 45% of Bre2 remained in the IgG binding flow-through fraction under standard affinity binding conditions (Figure 3b, left, lane 3, indicated by an arrow), demonstrating inefficient affinity capture by IgG beads. This inefficiency may arise from protein aggregation in highly concentrated lysates, which could shield the affinity tag, reduce diffusion rates, and impair binding efficiency. Third, Western blot analysis using a Set1-specific antibody revealed multiple bands smaller than the full-length Set1 (Figure 3c, left, lane 3–6), further indicating Set1 instability, likely due to proteolytic degradation during purification.
To address these challenges, we employed cryogenic grinding with liquid nitrogen to minimize thermal denaturation while enhancing mechanical disruption efficiency. Additionally, lysates were strategically diluted before affinity binding (1 g of wet cell mass per 5–6 mL binding buffer) to reduce aggregation and improve capture efficiency (Figure 3b, right) [54,55]. All other experimental procedures followed established protocols as previously described.
Western blot analysis confirmed significant improvements in cell lysis efficiency, affinity capture capacity, and core subunit stability under the optimized protocol. Cryogenic grinding effectively eliminated insoluble Bre2 aggregates (Figure 3b, right, lane 2), ensuring a superior release of soluble components while preventing protein aggregation. Combined with optimized binding conditions, this approach achieved a near-complete depletion of Bre2 in the IgG binding flow-through fraction (Figure 3b, right, lane 3), indicating highly efficient affinity enrichment. Crucially, Set1 degradation, an important indicator of complex integrity, was reduced by 70% (Figure 3c). This marked improvement directly contributed to the preservation of both the native architecture and catalytic competence of COMPASS, which are essential for downstream functional assays.

2.4. Endogenous COMPASS Purified Using the Optimized Procedure Exhibits Strict H2B Ubiquitination Dependency for Catalyzing H3K4 Methylation

Using the optimized TAP strategy (Figure 4a), we isolated the COMPASS complex from 10 L of yeast cultures, yielding 50 μg of highly purified complex—an amount sufficient to support cryo-EM analysis, as previously reported [34]. Silver-stained SDS-PAGE resolved eight discrete bands, corresponding to all canonical subunits, including Shg1, which was retained in our optimized protocol but frequently lost in conventional purification approaches. The bands exhibited balanced intensities with minimal background contamination (Figure 4b), demonstrating exceptional purity (>99% by densitometric analysis) and homogeneity. While previous studies have consistently reported Set1 fragmentation [16,20,29,43], our silver-stained SDS-PAGE showed no obvious degradation products (Figure 4b), corroborating the improved protein stability observed in Western blot analyses (Figure 3c). This improvement, along with subunit retention and high purity, establishes our strategy as a robust approach for isolating high-quality COMPASS complexes suitable for downstream functional and structural studies.
To evaluate the methyltransferase activity of our high-quality, native COMPASS complex isolated using the optimized strategy (opti-COMPASS), we performed in vitro methylation assays comparing it with conventionally purified COMPASS (conv-COMPASS) using both recombinant nucleosome core particles (NCPs) and H2Bub-modified NCPs (ubNCPs) as substrates. Notably, opti-COMPASS demonstrated enhanced catalytic efficiency on ubNCPs substrates compared to conv-COMPASS, generating robust H3K4me1, H3K4me2, and H3K4me3 (Figure 4c). Furthermore, conv-COMPASS exhibited a low basal mono-methylation activity on unmodified NCPs (Figure 4d), consistent with previous studies on its reconstituted counterpart in Sf9 cells [26,35,37]. In contrast, opti-COMPASS showed absolute substrate specificity—no enzymatic activity was detected on unmodified NCPs, while ubNCPS elicited complete methylation progression (Figure 4c,d). This strict H2Bub dependency mirrors in vivo observations [25,37], underscoring the subtle advantage of using intact, high-purity endogenous COMPASS complexes to accurately reproduce its physiological catalytic behavior.
Another interesting contrast emerges when comparing opti-COMPASS’s activity to that of the COMPASS catalytic module (CM) and extended CM (eCM). These subcomplexes, which include truncated versions of Set1 along with four essential regulatory subunits (Swd3, Swd1, Bre2, and Sdc1), exhibit robust H3K4 methylation activity on unmodified NCPs and do not necessarily require H2Bub for activation [26]. This intriguing discrepancy suggests that Set1 truncation or incomplete complex composition profoundly alters its intrinsic catalytic properties. The intact COMPASS complex may adopt an autoinhibitory conformation that constrains its catalytic activity, emphasizing the need for future structural studies of fully intact COMPASS-nucleosome complexes to gain deeper insights into its regulatory mechanisms.

3. Materials and Methods

3.1. Yeast Strains

The YTP-Bre2 strain was utilized for the endogenous COMPASS purification. To generate this recombinant strain, Saccharomyces cerevisiae BY4742 (MATα his3Δ1 leu2Δ0 lys2Δ0 ura3Δ0) was used as the background strain, and the DNA fragment encoding the CBP, TEV cleavage site, 2×ProA, and HIS3 cassette was integrated into the downstream of the BRE2 gene by homologous recombination. Briefly, DNA fragments encoding the CBP, TEV cleavage site, 2×ProA, and a HIS3 cassette were fused by overlap PCR and flanked by the 60-bp upstream and downstream sequences of the BRE2 stop codon. The fused construct was then transformed into BY4742, followed by selection on synthetic complete (SC) media lacking histidine. Successful TAP tag integration was confirmed by colony PCR. Using the same method, TAP tags were also integrated into the COMPASS subunits Swd1, Spp1, Swd2, Swd3, Sdc1, and Shg1 to construct different recombinant strains.

3.2. Culture Conditions

Yeast strains for DNA transformation and protein expression were cultured in YPD media (1% yeast extract, 2% peptone, 2% glucose) at 30 °C with shaking at 180 rpm unless otherwise specified.

3.3. Growth Curve of Yeast Under Different Culture Conditions

Overnight yeast cultures were diluted to an initial OD600 of 0.01 and divided into two experimental groups: an optimized culture condition group and a conventional culture condition group. In the optimized group, a single addition of 2% (w/v) glucose solution was supplied when cultures reached OD600 ≈ 3.0, with an increase in agitation speed to 220 rpm. The conventional group maintained constant conditions at 180 rpm without glucose supplementation. Cell growth was monitored every 6 h for total 50 h by measuring OD600 using a UV–Vis spectrophotometer (Thermo Fisher Scientific, Waltham, MA, USA). Each experiment included two biological replicates, with three technical replicates.

3.4. Conventional TAP-Tagged COMPASS Purification

Recombinant yeast strains were cultured in 6 L of YPD media at 30 °C with shaking at 180 rpm. Cells were harvested at mid-log phase (OD600 = 0.8–1) by centrifugation (5000× g, 15 min) and washed once with ultrapure water yielding approximately 11 g of wet cell mass. Cells were resuspended in 30 mL buffer A (50 mM Tris-HCl, pH 8.0, 150 mM NaCl, 10% glycerol, 0.1% NP-40, 1 mM EDTA, 1 mM DTT) supplemented with protease inhibitor cocktails and lysed using a high-pressure homogenizer (1000 bar, 30 min). Lysates were first clarified by centrifugation at 18,000× g for 20 min at 4 °C. The resulting supernatant was then subjected to a second centrifugation step at 40,000× g for 60 min at 4 °C.
For the first affinity purification step, clarified lysates were incubated with 60 μL IgG Sepharose beads (GE Healthcare, Chicago, IL, USA) at 4 °C for 4 h. Beads were washed with 30 mL high-salt and detergent-containing buffer (buffer B: 50 mM Tris-HCl, pH 8.0, 350 mM NaCl, 10% glycerol, 0.05% NP-40, 1 mM DTT) to remove non-specifically bound proteins. Bound complexes were eluted by 0.4 mg TEV protease cleavage in 1 mL mild elution buffer (buffer C: 50 mM Tris-HCl, pH 8.0, 150 mM NaCl, 10% glycerol, 0.05% NP-40, 0.5 mM EDTA, 1 mM DTT) at 4 °C for 12 h. For the second affinity purification step, the eluate from the previous step was incubated with 30 μL CaM Sepharose beads (GE Healthcare) in the presence of calcium (buffer D: 50 mM Tris-HCl, pH 8.0, 150 mM NaCl, 10% glycerol, 0.05% NP-40, 0.5 mM EDTA, 1 mM DTT, 5mM CaCl2) for 4 h at 4 °C to capture the CBP-tagged complex in 1.5 mL system. Beads were washed with 15 mL low salt buffer (buffer E: 25 mM HEPES, pH 8.0, 150 mM NaCl, 2 mM CaCl2, 10% glycerol, 1 mM DTT) to remove contaminants. Finally, a 5 mL calcium chelation elution (buffer F: 25 mM HEPES, pH 8.0, 150 mM NaCl, 10% glycerol, 2 mM EGTA, 1 mM DTT) was performed to disrupt the calmodulin-CBP interaction, yielding COMPASS complex. The eluate was concentrated to a total volume of 30 μL using a 100 kDa MWCO concentrator (MilliporeSigma, Burlington, MA, USA) and flash frozen in liquid nitrogen.

3.5. Optimized Tandem Affinity Purification of Native COMPASS Complex

Recombinant yeast strains were cultured in 10 L of YPD media at 30 °C with shaking at 180 rpm. When cultures reached an OD600 of approximately 3.0, 2% (w/v) sterile glucose was added, and the agitation speed was increased to 220 rpm. Cells were harvested at an OD600 of 6–7, yielding 120 g of wet cell mass.
Unlike the conventional purification protocol, cells were resuspended in buffer A at a volume corresponding to one-fifth of the wet cell mass (24 mL), followed by immediate dropwise freezing in liquid nitrogen. The frozen cells were then disrupted under cryogenic conditions using a SPEX 6785 Freezer Mill (SPEX SamplePrep, Metuchen, NJ, USA) with the following parameters: 5 min pre-cooling, 2 min run time, 2 min cooling, for 8 cycles at 12 cps). After reorienting the sample, an additional 8 cycles were performed. The frozen cell powder was thawed by gentle rotation for 30 min in 120 mL lysis buffer, with Benzonase nuclease (1:16,000 v/v) added during the thawing process. Once fully dissolved, the extracts were clarified by centrifugation at 18,000× g for 20 min at 4 °C followed by a second centrifugation step at 40,000× g for 60 min at 4 °C.
For the first affinity purification step, clarified lysates were diluted to a ratio of 1 g of wet cell mass per 5–6 mL buffer A to optimize binding conditions and incubated with 750 μL IgG Sepharose beads at 4 °C for 4 h. Beads were washed with 350 mL buffer B. Bound complexes were eluted by 2 mg TEV protease cleavage in 7 mL buffer C at 4 °C for 12 h. For the second affinity purification step, the eluate from the previous step was incubated with 350 μL CaM Sepharose beads in 15 mL buffer D for 4 h at 4 °C. Beads were washed with 200 mL buffer E. Finally, 35 mL buffer F was used to disrupt the calmodulin-CBP interaction, yielding COMPASS complex. The eluate was concentrated to a total volume of 250 μL using a 100 kDa MWCO concentrator (Millipore) and flash frozen in liquid nitrogen.

3.6. SDS-PAGE for Purity and Integrity Analysis

The purity and subunit composition of COMPASS complex were estimated by sodium dodecyl sulfate-polyacrylamide gel electrophoresis (SDS-PAGE). The resolving gel consisted of 7.5% acrylamide, while the stacking gel contained 5% acrylamide. Proteins were visualized using Fast Silver Stain Kit (Beyotime, Shanghai, China).

3.7. Western Blot Analysis of Purification Efficiency

To evaluate the efficiency of protein purification, we purified COMPASS from 120 g of wet weight cells using both the previous purification method and the optimized purification method. Samples collected at each step of the purification process were analyzed by Western blot. Protein samples (8 μL) were separated on 7.5% SDS-PAGE and transferred onto 0.45 μM PVDF membranes (MilliporeSigma, Burlington, MA, USA). Membranes were blocked in TBST buffer containing 5% non-fat milk powder and 0.1% Tween 20, followed by overnight incubation at 4 °C with anti-TAP (Med Chem Express, Monmouth Junction, NJ, USA, YA887) and anti-Set1 (Santa Cruz Biotechnology, Santa Cruz, CA, USA, sc-101858) as primary antibodies. Chemiluminescence was detected by Sparkjade ECL star (Spark jade, Shanghai, China) on a ChemiDoc™ MP Imaging System (BIO-RAD Laboratories, Hercules, CA, USA). Immunoblot signals were quantified using ImageJ 1.54d software.

3.8. In Vitro COMPASS Methyltransferase Assays

Methylation reactions were performed using 15 nM COMPASS complex, 1 μM NCPs/ubNCPs substrates, and 0.2 mM S-adenosyl-L-methionine (SAM) in a buffer containing 25 mM HEPES (pH 7.4) and 150 mM NaCl. Reactions were incubated at 30 °C, with samples collected at 0, 1, 3, 5, and 16 h, then quenched with 0.2% Trifluoroacetic acid (TFA). Reaction samples were separated on 12% SDS-PAGE and transferred onto 0.22 μM PVDF membranes (Millipore). Western blot analysis was performed as described above. The following primary antibodies were used: anti-H3 total (Cell Signaling Technology, Danvers, MA, USA, 4499S); anti-H3K4me1 (Active Motif, Carlsbad, CA, USA, 39297); anti-H3K4me2 (MilliporeSigma, Burlington, MA, USA, 07-030); anti-H3K4me3 (Cell Signaling Technology, Danvers, MA, USA, 9751S).

3.9. Statistical Analysis

All data are presented as mean ± S.D. from three independent experiments. Statistical analysis was determined using two-tailed unpaired Student’s t test in GraphPad Prism 9.5. A p-value < 0.05 was considered statistically significant.

4. Conclusions

In this study, we established a robust, standardized purification strategy that enables the efficient isolation of endogenous COMPASS complex from S. cerevisiae. This approach retains the native catalytic properties of the purified complex while enhancing yield, preserving structural integrity, and achieving exceptional purity. The purified COMPASS exhibits a strict dependence on H2B ubiquitination for H3K4 methyltransferase activity, offering new insights into its regulatory mechanisms. By addressing key technical challenges, this method provides a reliable workflow for obtaining fully intact endogenous COMPASS, paving the way for future structural and mechanistic studies.

Author Contributions

Conceptualization, Y.Z. and S.Q.; methodology, Y.L. and Y.Z.; validation, Y.L. and Y.Z.; investigation, Y.L.; resources, Y.Z. and S.Q.; data curation, Y.L. and Y.Z.; writing—original draft preparation, Y.L.; writing—review and editing, Y.Z. and S.Q.; visualization, Y.L.; supervision, Y.Z. and S.Q.; project administration, Y.Z.; funding acquisition, Y.Z. and S.Q. All authors have read and agreed to the published version of the manuscript.

Funding

This research was funded by the National Natural Science Foundation of China (NSFC), Grant Numbers: 32301059 and 32222049. Shanghai Municipal Science and Technology Major Project; The Shanghai Frontier Science Center of Optogenetic Techniques for Cell Metabolism, Shanghai Municipal Education Commission, Grant Number: 2021 Sci & Tech 03 28.

Data Availability Statement

The data presented in this study are available upon request from the corresponding author.

Acknowledgments

We thank Yong Chen (Center for Excellence in Molecular Cell Science, CAS) for sharing strains and valuable suggestions. We also appreciate Muchun Li (Center for Excellence in Molecular Cell Science, CAS) and Tingting Li (Hangzhou Institute for Advanced Study, UCAS) for experimental support on protein purification and nucleosome reconstitution, as well as helpful discussions.

Conflicts of Interest

The authors declare that they have no known competing financial interests or personal relationships that could have appeared to influence the work reported in this paper.

Abbreviations

COMPASSComplex of proteins associated with Set1
H3K4meHistone 3 lysine 4 methylations
H3K4me1Histone 3 lysine 4 mono-methylation
H3K4me2Histone 3 lysine 4 di-methylation
H3K4me2Histone 3 lysine 4 trimethylated
AdoMetS-adenosylmethionine
TAPTandem affinity purification
ProAProtein A
TEVTobacco Etch Virus
CaMCalmodulin
CBPCalmodulin-binding peptide
OD600Optical density at 600 nm
SET1RCSET1 mRNA-associated complex
H2BubH2B ubiquitination
NCPsNucleosome core particles
UbNCPsH2Bub-modified NCPs
CMCatalytic module
eCMExtended CM
SDS-PAGESodium dodecyl sulfate-polyacrylamide gel electrophoresis

References

  1. Lawrence, M.; Daujat, S.; Schneider, R. Lateral Thinking: How Histone Modifications Regulate Gene Expression. Trends Genet. 2016, 32, 42–56. [Google Scholar] [CrossRef] [PubMed]
  2. Tolsma, T.O.; Hansen, J.C. Post-Translational Modifications and Chromatin Dynamics. Essays Biochem. 2019, 63, 89–96. [Google Scholar] [CrossRef] [PubMed]
  3. Yao, W.; Hu, X.; Wang, X. Crossing Epigenetic Frontiers: The Intersection of Novel Histone Modifications and Diseases. Signal Transduct. Target. Ther. 2024, 9, 232. [Google Scholar] [CrossRef] [PubMed]
  4. Wang, H.; Helin, K. Roles of H3K4 Methylation in Biology and Disease. Trends Cell Biol. 2025, 35, 115–128. [Google Scholar] [CrossRef]
  5. Santos-Rosa, H.; Schneider, R.; Bannister, A.J.; Sherriff, J.; Bernstein, B.E.; Emre, N.C.T.; Schreiber, S.L.; Mellor, J.; Kouzarides, T. Active Genes Are Tri-Methylated at K4 of Histone H3. Nature 2002, 419, 407–411. [Google Scholar] [CrossRef]
  6. Chong, S.Y.; Cutler, S.; Lin, J.-J.; Tsai, C.-H.; Tsai, H.-K.; Biggins, S.; Tsukiyama, T.; Lo, Y.-C.; Kao, C.-F. H3K4 methylation at active genes mitigates transcription-replication conflicts during replication stress. Nat. Commun. 2020, 11, 809. [Google Scholar] [CrossRef]
  7. Heintzman, N.D.; Stuart, R.K.; Hon, G.; Fu, Y.; Ching, C.W.; Hawkins, R.D.; Barrera, L.O.; Van Calcar, S.; Qu, C.; Ching, K.A.; et al. Distinct and Predictive Chromatin Signatures of Transcriptional Promoters and Enhancers in the Human Genome. Nat. Genet. 2007, 39, 311–318. [Google Scholar] [CrossRef]
  8. Kim, T.; Buratowski, S. Dimethylation of H3K4 by Set1 Recruits the Set3 Histone Deacetylase Complex to 5′ Transcribed Regions. Cell 2009, 137, 259–272. [Google Scholar] [CrossRef]
  9. Yan, J.; Chen, S.-A.A.; Local, A.; Liu, T.; Qiu, Y.; Dorighi, K.M.; Preissl, S.; Rivera, C.M.; Wang, C.; Ye, Z.; et al. Histone H3 Lysine 4 Monomethylation Modulates Long-Range Chromatin Interactions at Enhancers. Cell Res. 2018, 28, 204–220. [Google Scholar] [CrossRef]
  10. Ruthenburg, A.J.; Allis, C.D.; Wysocka, J. Methylation of Lysine 4 on Histone H3: Intricacy of Writing and Reading a Single Epigenetic Mark. Mol. Cell 2007, 25, 15–30. [Google Scholar] [CrossRef]
  11. Deshpande, N.; Jordan, R.; Henderson Pozzi, M.; Bryk, M. Histone 3 Lysine 4 Monomethylation Supports Activation of Transcription in S. Cerevisiae During Nutrient Stress. Curr. Genet. 2022, 68, 181–194. [Google Scholar] [CrossRef] [PubMed]
  12. Dehé, P.-M.; Dichtl, B.; Schaft, D.; Roguev, A.; Pamblanco, M.; Lebrun, R.; Rodríguez-Gil, A.; Mkandawire, M.; Landsberg, K.; Shevchenko, A.; et al. Protein Interactions within the Set1 Complex and Their Roles in the Regulation of Histone 3 Lysine 4 Methylation. J. Biol. Chem. 2006, 281, 35404–35412. [Google Scholar] [CrossRef] [PubMed]
  13. Nieborak, A.; Schneider, R. Metabolic Intermediates—Cellular Messengers Talking to Chromatin Modifiers. Mol. Metab. 2018, 14, 39–52. [Google Scholar] [CrossRef] [PubMed]
  14. Al Temimi, A.H.K.; Amatdjais-Groenen, H.I.V.; Reddy, Y.V.; Blaauw, R.H.; Guo, H.; Qian, P.; Mecinović, J. The Nucleophilic Amino Group of Lysine Is Central for Histone Lysine Methyltransferase Catalysis. Commun. Chem. 2019, 2, 1–14. [Google Scholar] [CrossRef]
  15. Krautkramer, K.A.; Rey, F.E.; Denu, J.M. Chemical Signaling between Gut Microbiota and Host Chromatin: What Is Your Gut Really Saying? J. Biol. Chem. 2017, 292, 8582–8593. [Google Scholar] [CrossRef]
  16. Miller, T.; Krogan, N.J.; Dover, J.; Erdjument-Bromage, H.; Tempst, P.; Johnston, M.; Greenblatt, J.F.; Shilatifard, A. COMPASS: A Complex of Proteins Associated with a Trithorax-Related SET Domain Protein. Proc. Natl. Acad. Sci. USA 2001, 98, 12902–12907. [Google Scholar] [CrossRef]
  17. Li, T.; Kelly, W.G. A Role for Set1/MLL-Related Components in Epigenetic Regulation of the Caenorhabditis elegans Germ Line. PLoS Genet. 2011, 7, e1001349. [Google Scholar] [CrossRef]
  18. Mersman, D.P.; Du, H.-N.; Fingerman, I.M.; South, P.F.; Briggs, S.D. Charge-Based Interaction Conserved within Histone H3 Lysine 4 (H3K4) Methyltransferase Complexes Is Needed for Protein Stability, Histone Methylation, and Gene Expression. J. Biol. Chem. 2012, 287, 2652–2665. [Google Scholar] [CrossRef]
  19. Howe, F.S.; Fischl, H.; Murray, S.C.; Mellor, J. Is H3K4me3 Instructive for Transcription Activation? BioEssays 2017, 39, 1–12. [Google Scholar] [CrossRef]
  20. Bae, H.J.; Dubarry, M.; Jeon, J.; Soares, L.M.; Dargemont, C.; Kim, J.; Geli, V.; Buratowski, S. The Set1 N-Terminal Domain and Swd2 Interact with RNA Polymerase II CTD to Recruit COMPASS. Nat. Commun. 2020, 11, 2181. [Google Scholar] [CrossRef]
  21. Dehé, P.-M.; Géli, V. The Multiple Faces of Set1. Biochem. Cell Biol. 2006, 84, 536–548. [Google Scholar] [CrossRef] [PubMed]
  22. Serrano-Quílez, J.; Roig-Soucase, S.; Rodríguez-Navarro, S. Sharing Marks: H3k4 Methylation and H2b Ubiquitination as Features of Meiotic Recombination and Transcription. Int. J. Mol. Sci. 2020, 21, 4510. [Google Scholar] [CrossRef] [PubMed]
  23. South, P.F.; Fingerman, I.M.; Mersman, D.P.; Du, H.-N.; Briggs, S.D. A Conserved Interaction between the SDI Domain of Bre2 and the Dpy-30 Domain of Sdc1 Is Required for Histone Methylation and Gene Expression. J. Biol. Chem. 2010, 285, 595–607. [Google Scholar] [CrossRef] [PubMed]
  24. Li, Y.; Ge, K.; Li, T.; Cai, R.; Chen, Y. The Engagement of Histone Lysine Methyltransferases with Nucleosomes: Structural Basis, Regulatory Mechanisms, and Therapeutic Implications. Protein Cell 2023, 14, 165–179. [Google Scholar] [CrossRef]
  25. Xue, H.; Yao, T.; Cao, M.; Zhu, G.; Li, Y.; Yuan, G.; Chen, Y.; Lei, M.; Huang, J. Structural Basis of Nucleosome Recognition and Modification by MLL Methyltransferases. Nature 2019, 573, 445–449. [Google Scholar] [CrossRef]
  26. Hsu, P.L.; Shi, H.; Leonen, C.; Kang, J.; Chatterjee, C.; Zheng, N. Structural Basis of H2B Ubiquitination-Dependent H3K4 Methylation by COMPASS. Mol. Cell 2019, 76, 712–723.e4. [Google Scholar] [CrossRef]
  27. Han, J.; Li, T.; Li, Y.; Li, M.; Wang, X.; Peng, C.; Su, C.; Li, N.; Li, Y.; Xu, Y.; et al. The Internal Interaction in RBBP5 Regulates Assembly and Activity of MLL1 Methyltransferase Complex. Nucleic Acids Res. 2019, 47, 10426–10438. [Google Scholar] [CrossRef]
  28. Li, Y.; Han, J.; Zhang, Y.; Cao, F.; Liu, Z.; Li, S.; Wu, J.; Hu, C.; Wang, Y.; Shuai, J.; et al. Structural Basis for Activity Regulation of MLL Family Methyltransferases. Nature 2016, 530, 447–452. [Google Scholar] [CrossRef]
  29. Wang, Y.; Ding, Z.; Liu, X.; Bao, Y.; Huang, M.; Wong, C.C.L.; Hong, X.; Cong, Y. Architecture and Subunit Arrangement of the Complete Saccharomyces Cerevisiae COMPASS Complex. Sci. Rep. 2018, 8, 17405. [Google Scholar] [CrossRef]
  30. D’Urso, A.; Takahashi, Y.-H.; Xiong, B.; Marone, J.; Coukos, R.; Randise-Hinchliff, C.; Wang, J.-P.; Shilatifard, A.; Brickner, J.H. Set1/COMPASS and Mediator Are Repurposed to Promote Epigenetic Transcriptional Memory. eLife 2016, 5, e16691. [Google Scholar] [CrossRef]
  31. Giaever, G.; Lissina, E.; Nislow, C. Network Dynamics of the Yeast Methyltransferome. Microb. Cell 2019, 6, 356–369. [Google Scholar] [CrossRef] [PubMed]
  32. Janna, A.; Davarinejad, H.; Joshi, M.; Couture, J.-F. Structural Paradigms in the Recognition of the Nucleosome Core Particle by Histone Lysine Methyltransferases. Front. Cell Dev. Biol. 2020, 8, 600. [Google Scholar] [CrossRef] [PubMed]
  33. Worden, E.J.; Zhang, X.; Wolberger, C. Structural Basis for COMPASS Recognition of an H2B-Ubiquitinated Nucleosome. eLife 2020, 9, e53199. [Google Scholar] [CrossRef] [PubMed]
  34. Qu, Q.; Takahashi, Y.-H.; Yang, Y.; Hu, H.; Zhang, Y.; Brunzelle, J.S.; Couture, J.-F.; Shilatifard, A.; Skiniotis, G. Structure and Conformational Dynamics of a COMPASS Histone H3K4 Methyltransferase Complex. Cell 2018, 174, 1117–1126.e12. [Google Scholar] [CrossRef]
  35. Hsu, P.L.; Li, H.; Lau, H.-T.; Leonen, C.; Dhall, A.; Ong, S.-E.; Chatterjee, C.; Zheng, N. Crystal Structure of the COMPASS H3K4 Methyltransferase Catalytic Module. Cell 2018, 174, 1106–1116.e9. [Google Scholar] [CrossRef]
  36. Cho, U.-S. The Core Complex of Yeast COMPASS and Human Mixed-Lineage Leukemia (MLL), Structure, Function, and Recognition of the Nucleosome. Subcell. Biochem. 2024, 104, 101–117. [Google Scholar] [CrossRef]
  37. Kim, J.; Kim, J.-A.; McGinty, R.K.; Nguyen, U.T.T.; Muir, T.W.; Allis, C.D.; Roeder, R.G. The N-SET Domain of Set1 Regulates H2B Ubiquitylation-Dependent H3K4 Methylation. Mol. Cell 2013, 49, 1121–1133. [Google Scholar] [CrossRef]
  38. Schneider, J.; Wood, A.; Lee, J.-S.; Schuster, R.; Dueker, J.; Maguire, C.; Swanson, S.K.; Florens, L.; Washburn, M.P.; Shilatifard, A. Molecular Regulation of Histone H3 Trimethylation by COMPASS and the Regulation of Gene Expression. Mol. Cell 2005, 19, 849–856. [Google Scholar] [CrossRef]
  39. Ho, B.; Baryshnikova, A.; Brown, G.W. Unification of Protein Abundance Datasets Yields a Quantitative Saccharomyces Cerevisiae Proteome. Cell Syst. 2018, 6, 192–205.e3. [Google Scholar] [CrossRef]
  40. Kouzarides, T. Chromatin Modifications and Their Function. Cell 2007, 128, 693–705. [Google Scholar] [CrossRef]
  41. Lee, J.-S.; Shukla, A.; Schneider, J.; Swanson, S.K.; Washburn, M.P.; Florens, L.; Bhaumik, S.R.; Shilatifard, A. Histone Crosstalk between H2B Monoubiquitination and H3 Methylation Mediated by COMPASS. Cell 2007, 131, 1084–1096. [Google Scholar] [CrossRef] [PubMed]
  42. Bhojoo, U.; Biggar, K.K. Single-Step Purification of Intrinsic Protein Complexes in Saccharomyces Cerevisiae Using Regenerable Calmodulin Resin. MethodsX 2018, 5, 613–619. [Google Scholar] [CrossRef] [PubMed]
  43. Schlichter, A.; Cairns, B.R. Histone Trimethylation by Set1 Is Coordinated by the RRM, Autoinhibitory, and Catalytic Domains. EMBO J. 2005, 24, 1222–1231. [Google Scholar] [CrossRef] [PubMed]
  44. Puig, O.; Caspary, F.; Rigaut, G.; Rutz, B.; Bouveret, E.; Bragado-Nilsson, E.; Wilm, M.; Séraphin, B. The Tandem Affinity Purification (TAP) Method: A General Procedure of Protein Complex Purification. Methods 2001, 24, 218–229. [Google Scholar] [CrossRef]
  45. Li, Y. The Tandem Affinity Purification Technology: An Overview. Biotechnol. Lett. 2011, 33, 1487–1499. [Google Scholar] [CrossRef]
  46. Valero, M.L.; Sendra, R.; Pamblanco, M. Tandem Affinity Purification of Histones, Coupled to Mass Spectrometry, Identifies Associated Proteins and New Sites of Post-Translational Modification in Saccharomyces Cerevisiae. J. Proteom. 2016, 136, 183–192. [Google Scholar] [CrossRef]
  47. Roguev, A.; Schaft, D.; Shevchenko, A.; Pijnappel, W.W.M.P.; Wilm, M.; Aasland, R.; Stewart, A.F. The Saccharomyces Cerevisiae Set1 Complex Includes an Ash2 Homologue and Methylates Histone 3 Lysine 4. EMBO J. 2001, 20, 7137–7148. [Google Scholar] [CrossRef]
  48. Woo, H.; Oh, J.; Cho, Y.-J.; Oh, G.T.; Kim, S.-Y.; Dan, K.; Han, D.; Lee, J.-S.; Kim, T. N-Terminal Acetylation of Set1-COMPASS Fine-Tunes H3K4 Methylation Patterns. Sci. Adv. 2024, 10, eadl6280. [Google Scholar] [CrossRef]
  49. Tapia, H.; Morano, K.A. Hsp90 Nuclear Accumulation in Quiescence Is Linked to Chaperone Function and Spore Development in Yeast. Mol. Biol. Cell 2010, 21, 63–72. [Google Scholar] [CrossRef]
  50. Alberghina, L. The Warburg Effect Explained: Integration of Enhanced Glycolysis with Heterogeneous Mitochondria to Promote Cancer Cell Proliferation. Int. J. Mol. Sci. 2023, 24, 15787. [Google Scholar] [CrossRef]
  51. Torello Pianale, L.; Caputo, F.; Olsson, L. Four Ways of Implementing Robustness Quantification in Strain Characterisation. Biotechnol. Biofuels Bioprod. 2023, 16, 195. [Google Scholar] [CrossRef] [PubMed]
  52. Halbach, A.; Zhang, H.; Wengi, A.; Jablonska, Z.; Gruber, I.M.L.; Halbeisen, R.E.; Dehé, P.-M.; Kemmeren, P.; Holstege, F.; Géli, V.; et al. Cotranslational Assembly of the Yeast SET1C Histone Methyltransferase Complex. EMBO J. 2009, 28, 2959–2970. [Google Scholar] [CrossRef] [PubMed]
  53. Bernardini, A.; Mukherjee, P.; Scheer, E.; Kamenova, I.; Antonova, S.; Mendoza Sanchez, P.K.; Yayli, G.; Morlet, B.; Timmers, H.T.M.; Tora, L. Hierarchical TAF1-Dependent Co-Translational Assembly of the Basal Transcription Factor TFIID. Nat. Struct. Mol. Biol. 2023, 30, 1141–1152. [Google Scholar] [CrossRef] [PubMed]
  54. Urh, M.; Simpson, D.; Zhao, K. Chapter 26 Affinity Chromatography. General Methods. In Methods in Enzymology; Elsevier Inc.: New York City, NY, USA, 2009; Volume 463, pp. 417–438. [Google Scholar] [CrossRef]
  55. Singh, M.R.; Roy, S.; Bellare, J.R. Influence of Cryogenic Grinding on Release of Protein and DNA from Saccharomyces Cerevisiae. Int. J. Food Eng. 2009, 5, 1–23. [Google Scholar] [CrossRef]
Figure 1. Purification of the COMPASS complex using a classical TAP strategy. (a) Schematic diagram illustrating recombinant strain engineering for COMPASS purification. The Bre2 subunit was C-terminally fused with a TAP tag (comprising Protein A, a TEV protease cleavage site, and calmodulin-binding peptide), which was integrated into the genome using a HIS3 selectable marker. (b) Workflow for COMPASS complex purification using tandem affinity purification. (c) Silver-stained SDS-PAGE analysis of TAP-purified COMPASS. Tentative bands corresponding to COMPASS subunits, inferred based on their theoretical molecular weights, are indicated.
Catalysts 15 00521 g001
Figure 2. Glucose supplementation increases biomass and Set1 protein levels. (a) Growth curves of cultures under the conventional condition (Conv. cult, blue) and optimized condition (Opti. cult, orange). Arrow indicates glucose supplementation (2% w/v) and agitation adjustment (220 rpm). (b) Western blot analysis of COMPASS subunits (Set1, Bre2-TAP, Swd1-TAP, Spp1-TAP, Swd2-TAP, Swd3-TAP, Sdc1-TAP, and Shg1-TAP) protein levels in Opti. cult and Conv. Cult using Set1-specific antibody and TAP-specific antibody. After 50 h of cultivation, 3 OD cells were collected for further analysis, with GAPDH as a loading control. (c) Protein levels of COMPASS subunits were determined by densitometric analysis using ImageJ 1.54d software, with relative protein levels normalized to Conv. cult to reflect changes following optimization. Data are presented as bar graphs.
Catalysts 15 00521 g002
Figure 3. Systematic optimization of cell lysis and affinity purification enhances capture efficacy and reduces Set1 degradation. (a) Schematic workflow comparing previous (left) and optimized (right) purification protocols, with critical modifications highlighted in red. Sampling points are denoted at each purification step. (b) Western blot analysis of Bre2-TAP across purification stages using an antibody against TAP tag. Lanes: (1) Supernatant, (2) Cell pellet, (3) IgG beads flow-through, (4) IgG beads-bound fraction, (5) TEV cleavage eluate, and (6) IgG beads after TEV digestion. The asterisk (*) indicates non-specific bands, while red arrows denote the expected Bre2-TAP bands and black arrows denote the expected Bre2-CBP bands in corresponding fractions. (c) Western blot analysis of Set1 using a Set1-specific antibody. Lanes: (1) Supernatant, (2) IgG beads flow-through, (3) IgG beads-bound fraction, (4) TEV cleavage eluate, (5) CBP eluate, and (6) Concentrated final product. The asterisk (*) indicates non-specific bands.
Catalysts 15 00521 g003
Figure 4. Optimized purification and functional characterization of the endogenous COMPASS complex. (a) Optimized purification workflow for efficient COMPASS complex isolation. (b) Silver-stained SDS-PAGE analysis of purified COMPASS complex. (c) Time-course analysis of H3K4me1/me2/me3 formation catalyzed by the endogenous COMPASS complex isolated using the optimized strategy (opti-COMPASS) and conventional strategy (conv-COMPASS). Purified COMPASS complex (15 nM) was incubated with NCP or ubNCP (1 μM) in a reaction buffer containing 20 mM Tris-HCl (pH 7.5), 100 mM NaCl, and 0.2 mM SAM. Samples were collected at 0, 1, 3, 5, and 16 h for subsequent analysis. Reaction products were detected by Western blot using specific antibodies against H3K4me1, H3K4me2, and H3K4me3, with unmodified H3 serving as the loading control. (d) A long exposure image illustrates the detection of the H3K4me1 antibody using NCP as the substrate of panel (c).
Catalysts 15 00521 g004
Disclaimer/Publisher’s Note: The statements, opinions and data contained in all publications are solely those of the individual author(s) and contributor(s) and not of MDPI and/or the editor(s). MDPI and/or the editor(s) disclaim responsibility for any injury to people or property resulting from any ideas, methods, instructions or products referred to in the content.

