Article

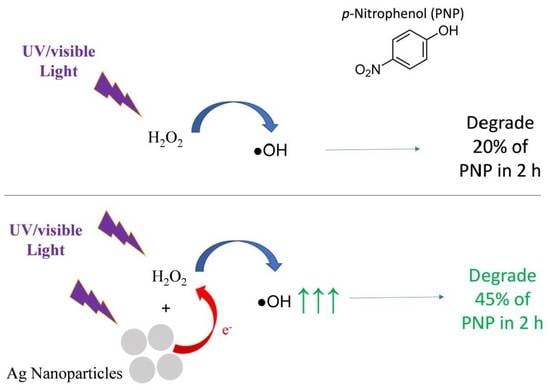
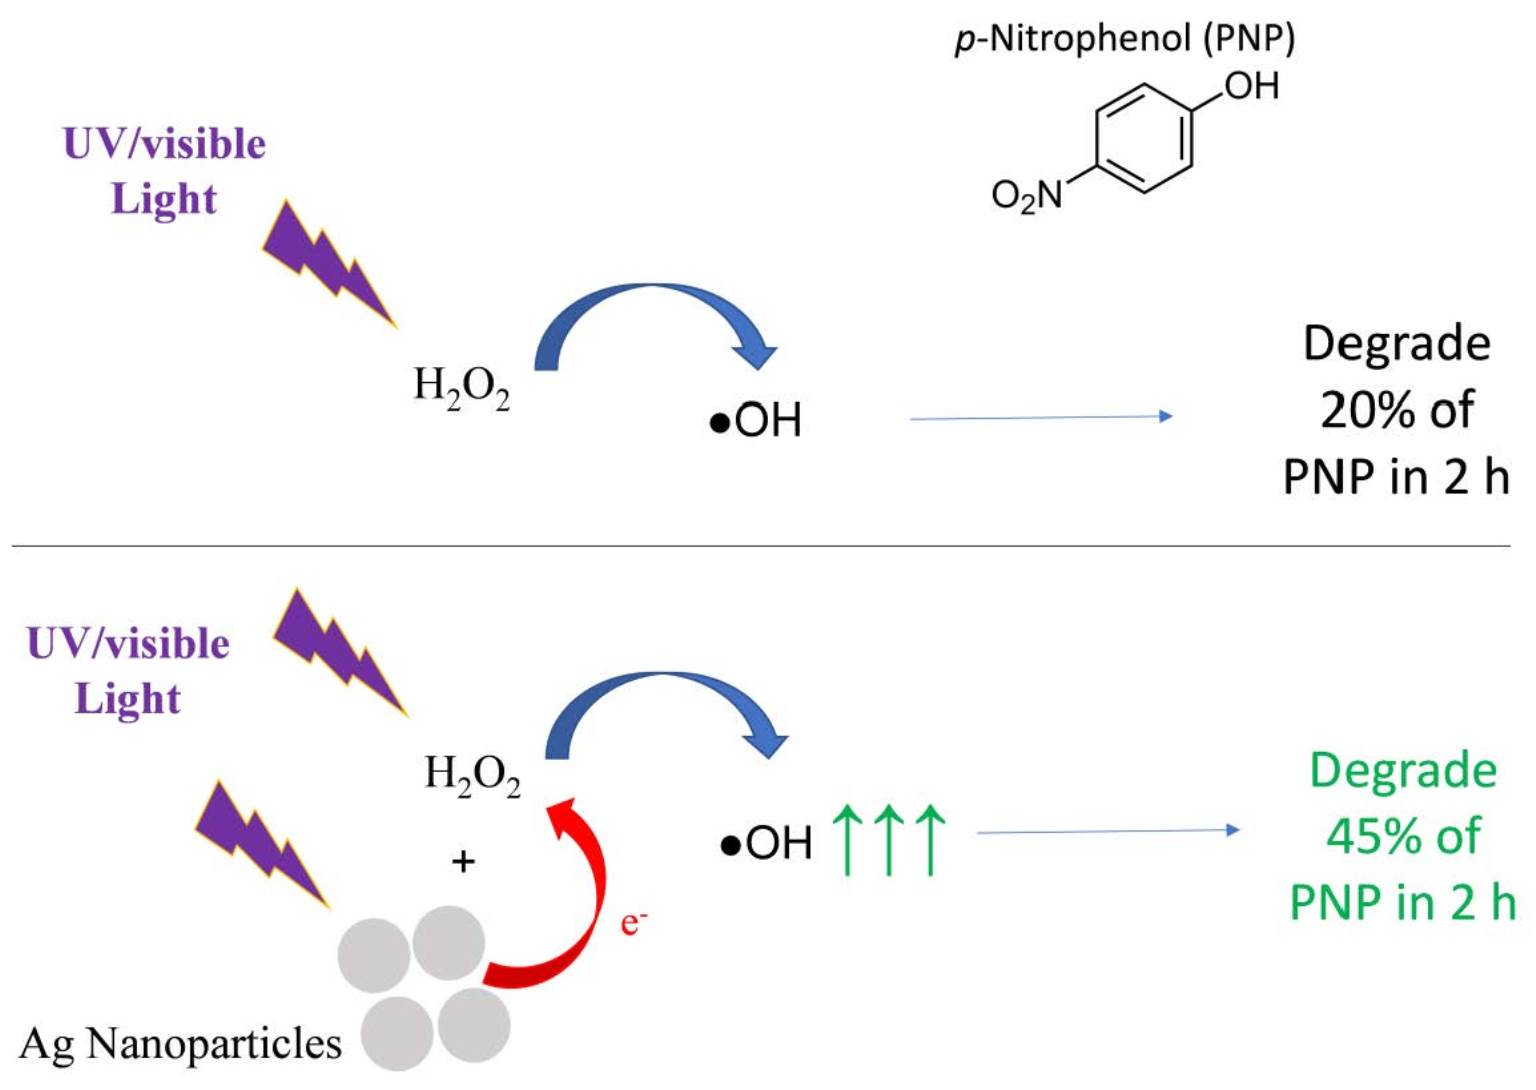
Enhanced Decomposition of H2O2 Using Metallic Silver Nanoparticles under UV/Visible Light for the Removal of p-Nitrophenol from Water

1
Department of Chemical Engineering—Nanomaterials, Catalysis & Electrochemistry, University of Liège, B6a, Quartier Agora, Allée du Six Août 11, 4000 Liège, Belgium
2
Institut National de la Recherche Scientifique (INRS), Centre-Eau Terre Environnement, Université du Québec, 490, Rue de la Couronne, Quebec, QC G1K 9A9, Canada
*
Author to whom correspondence should be addressed.
Catalysts 2023, 13(5), 842; https://doi.org/10.3390/catal13050842
Submission received: 31 January 2023 / Revised: 24 April 2023 / Accepted: 1 May 2023 / Published: 5 May 2023
(This article belongs to the Special Issue Morphological Effects on Catalytic Reactions)

Abstract

:
Three Ag nanoparticle (NP) colloids are produced from borohydride reduction of silver nitrate in water by varying the amount of sodium citrate. These nanoparticles are used as photocatalysts with H2O2 to degrade a p-nitrophenol (PNP) solution. X-ray diffraction patterns have shown the production of metallic silver nanoparticles, whatever the concentration of citrate. The transmission electron microscope images of these NPs highlighted the evolution from spherical NPs to hexagonal/rod-like NPs with broader distribution when the citrate amount increases. Aggregate size in solution has also shown the same tendency. Indeed, the citrate, which is both a capping and a reducing agent, modifies the resulting shape and size of the Ag NPs. When its concentration is low, the pH is higher, and it stabilizes the formation of uniform spherical Ag NPs. However, when its concentration increases, the pH decreases, and the Ag reduction is less controlled, leading to broader distribution and bigger rod-like Ag NPs. This results in the production of three different samples: one with more uniform spherical 20 nm Ag NPs, one intermediate with 30 nm Ag NPs with spherical and rod-like NPs, and one with 50 nm rod-like Ag NPs with broad distribution. These three Ag NPs mixed with H2O2 in water enhanced the degradation of PNP under UV/visible irradiation. Indeed, metallic Ag NPs produce localized surface plasmon resonance under illumination, which photogenerates electrons and holes able to accelerate the production of hydroxyl radicals when in contact with H2O2. The intermediate morphology sample presents the best activity, doubling the PNP degradation compared to the irradiated experiment with H2O2 alone. This better result can be attributed to the small size of the NPs (30 nm) but also to the presence of more defects in this intermediate structure that allows a longer lifetime of the photogenerated species. Recycling experiments on the best photocatalyst sample showed a constant activity of up to 40 h of illumination for a very low concentration of photocatalyst compared to the literature.

Graphical Abstract

1. Introduction

Throughout the 20th century, industrialization intensified in a growing number of countries around the world. This intense industrialization has resulted in the emergence of Refractory Organic Compounds (ROCs) such as dyes, aromatics, pesticides, solvents, EDCs (Endocrine Disrupting Chemicals), and PPCPs (Pharmaceuticals and Personal Care Products, such as ibuprofen), causing disturbances to aquatic life and bringing risks to human health. These contaminants escape most conventional wastewater treatments. In order to limit the dispersion of these organic contaminants into the environment, wastewater must be subjected to more advanced (and yet-to-be-developed) pollution abatement treatments.
In these past decades, advanced oxidation processes (AOPs) have attracted increasing attention for water treatment [1,2]. These processes consist of treatments performed at room temperature and atmospheric pressure and are based on the in situ generation of a powerful oxidizing agent, such as hydroxyl radicals (OH), at a sufficient concentration to efficiently decontaminate water [1]. Among the AOPs are heterogeneous photocatalysis under UV and/or visible light [3,4,5,6,7], homogeneous phase chemical oxidation processes: H2O2/Fe2+ (Fenton’s reagent) [8] and O3/OH (ozonation) [9], photochemical processes: UV only, H2O2/UV, O3/UV, and H2O2/Fe3+/UV (photo-Fenton) [8,10], electrochemical processes [11,12] (anodic oxidation and electro-Fenton), etc.
Concerning the use of H2O2, which can be used as a chemical [13] or electrochemically generated [14,15], it is an environmentally metastable molecule. Indeed, H2O2 presents strong disinfecting and oxidizing properties, and it is able to convert toxic organics into less harmful molecules [14,15]. Likewise, electrochemical treatment is generally characterized by simple equipment, easy operation, brief retention time, and negligible supply of chemicals [14,15]; however, it requires a continuous electrical current for H2O2 production. Under UV illumination [8], H2O2 can be converted into hydroxyl radicals that can effectively degrade organic pollutants. The conversion of H2O2 into hydroxyl radicals, and, as such, its effectiveness in pollutant degradation, can be increased using some metallic nanoparticles or ions [13].
Among the metallic nanoparticles, silver nanoparticles are very attractive due to their unique properties of nano-sensing [16,17,18,19,20], antibacterial activity [21,22], photocatalytic activity for organic pollutant degradation [23,24,25,26,27], localized surface plasmon resonance (LSPR) [16,17,28,29], and non-linear optical activity [30,31,32]. Moreover, silver as a noble metal is very stable in a water environment compared to other cheaper metals such as copper or iron [33], and it is the less expensive noble metal. Many syntheses are reported to produce Ag nanoparticles with different sizes and shapes, such as calcination/H2 reduction [31,34], chemical reduction [16,20,32,35,36,37], photoreduction [25], bio-based reduction [30,38], pulse laser ablation [39], or biosynthesis [22,40,41,42]. Nevertheless, the chemical reduction method is one of the most versatile synthesis techniques [43,44,45,46], using a reducing and a capping agent. This technique allows the production of Ag nanoparticles of various shapes and sizes. The nanoparticles are prepared, and they are stable in water; they are produced at ambient temperature, and a small amount of reducing agent is required (usually NaBH4, which is already currently used in the industry [47]). Furthermore, the reaction time is short. All these advantages make the process easily up scalable. The process can be considered eco-friendly, requiring a low amount of reagent, versatile nanoparticle production, water solvent, and no heating, and is safe.
In this work, three Ag nanoparticle colloids are synthesized by NaBH4 reduction with different amounts of sodium citrate, the capping agent that can also act as a reducing agent. The Ag nanoparticles are characterized by X-ray diffraction, dynamic light scattering, transmission electron microscopy, and UV/visible spectroscopy. Then, these nanoparticles are used to enhance H2O2 conversion into hydroxyl radicals under UV/visible light to degrade organic pollution in water. The model pollutant used is p-nitrophenol (PNP) because it is commonly found in pesticides, herbicides, and insecticides, and it can cause methemoglobinemia and eye and skin irritation upon contact [48]; its elimination is therefore paramount.

2. Results and Discussion

The three silver colloids are called AgX, being X the amount of citrate used (either 200, 400, or 800 mg).

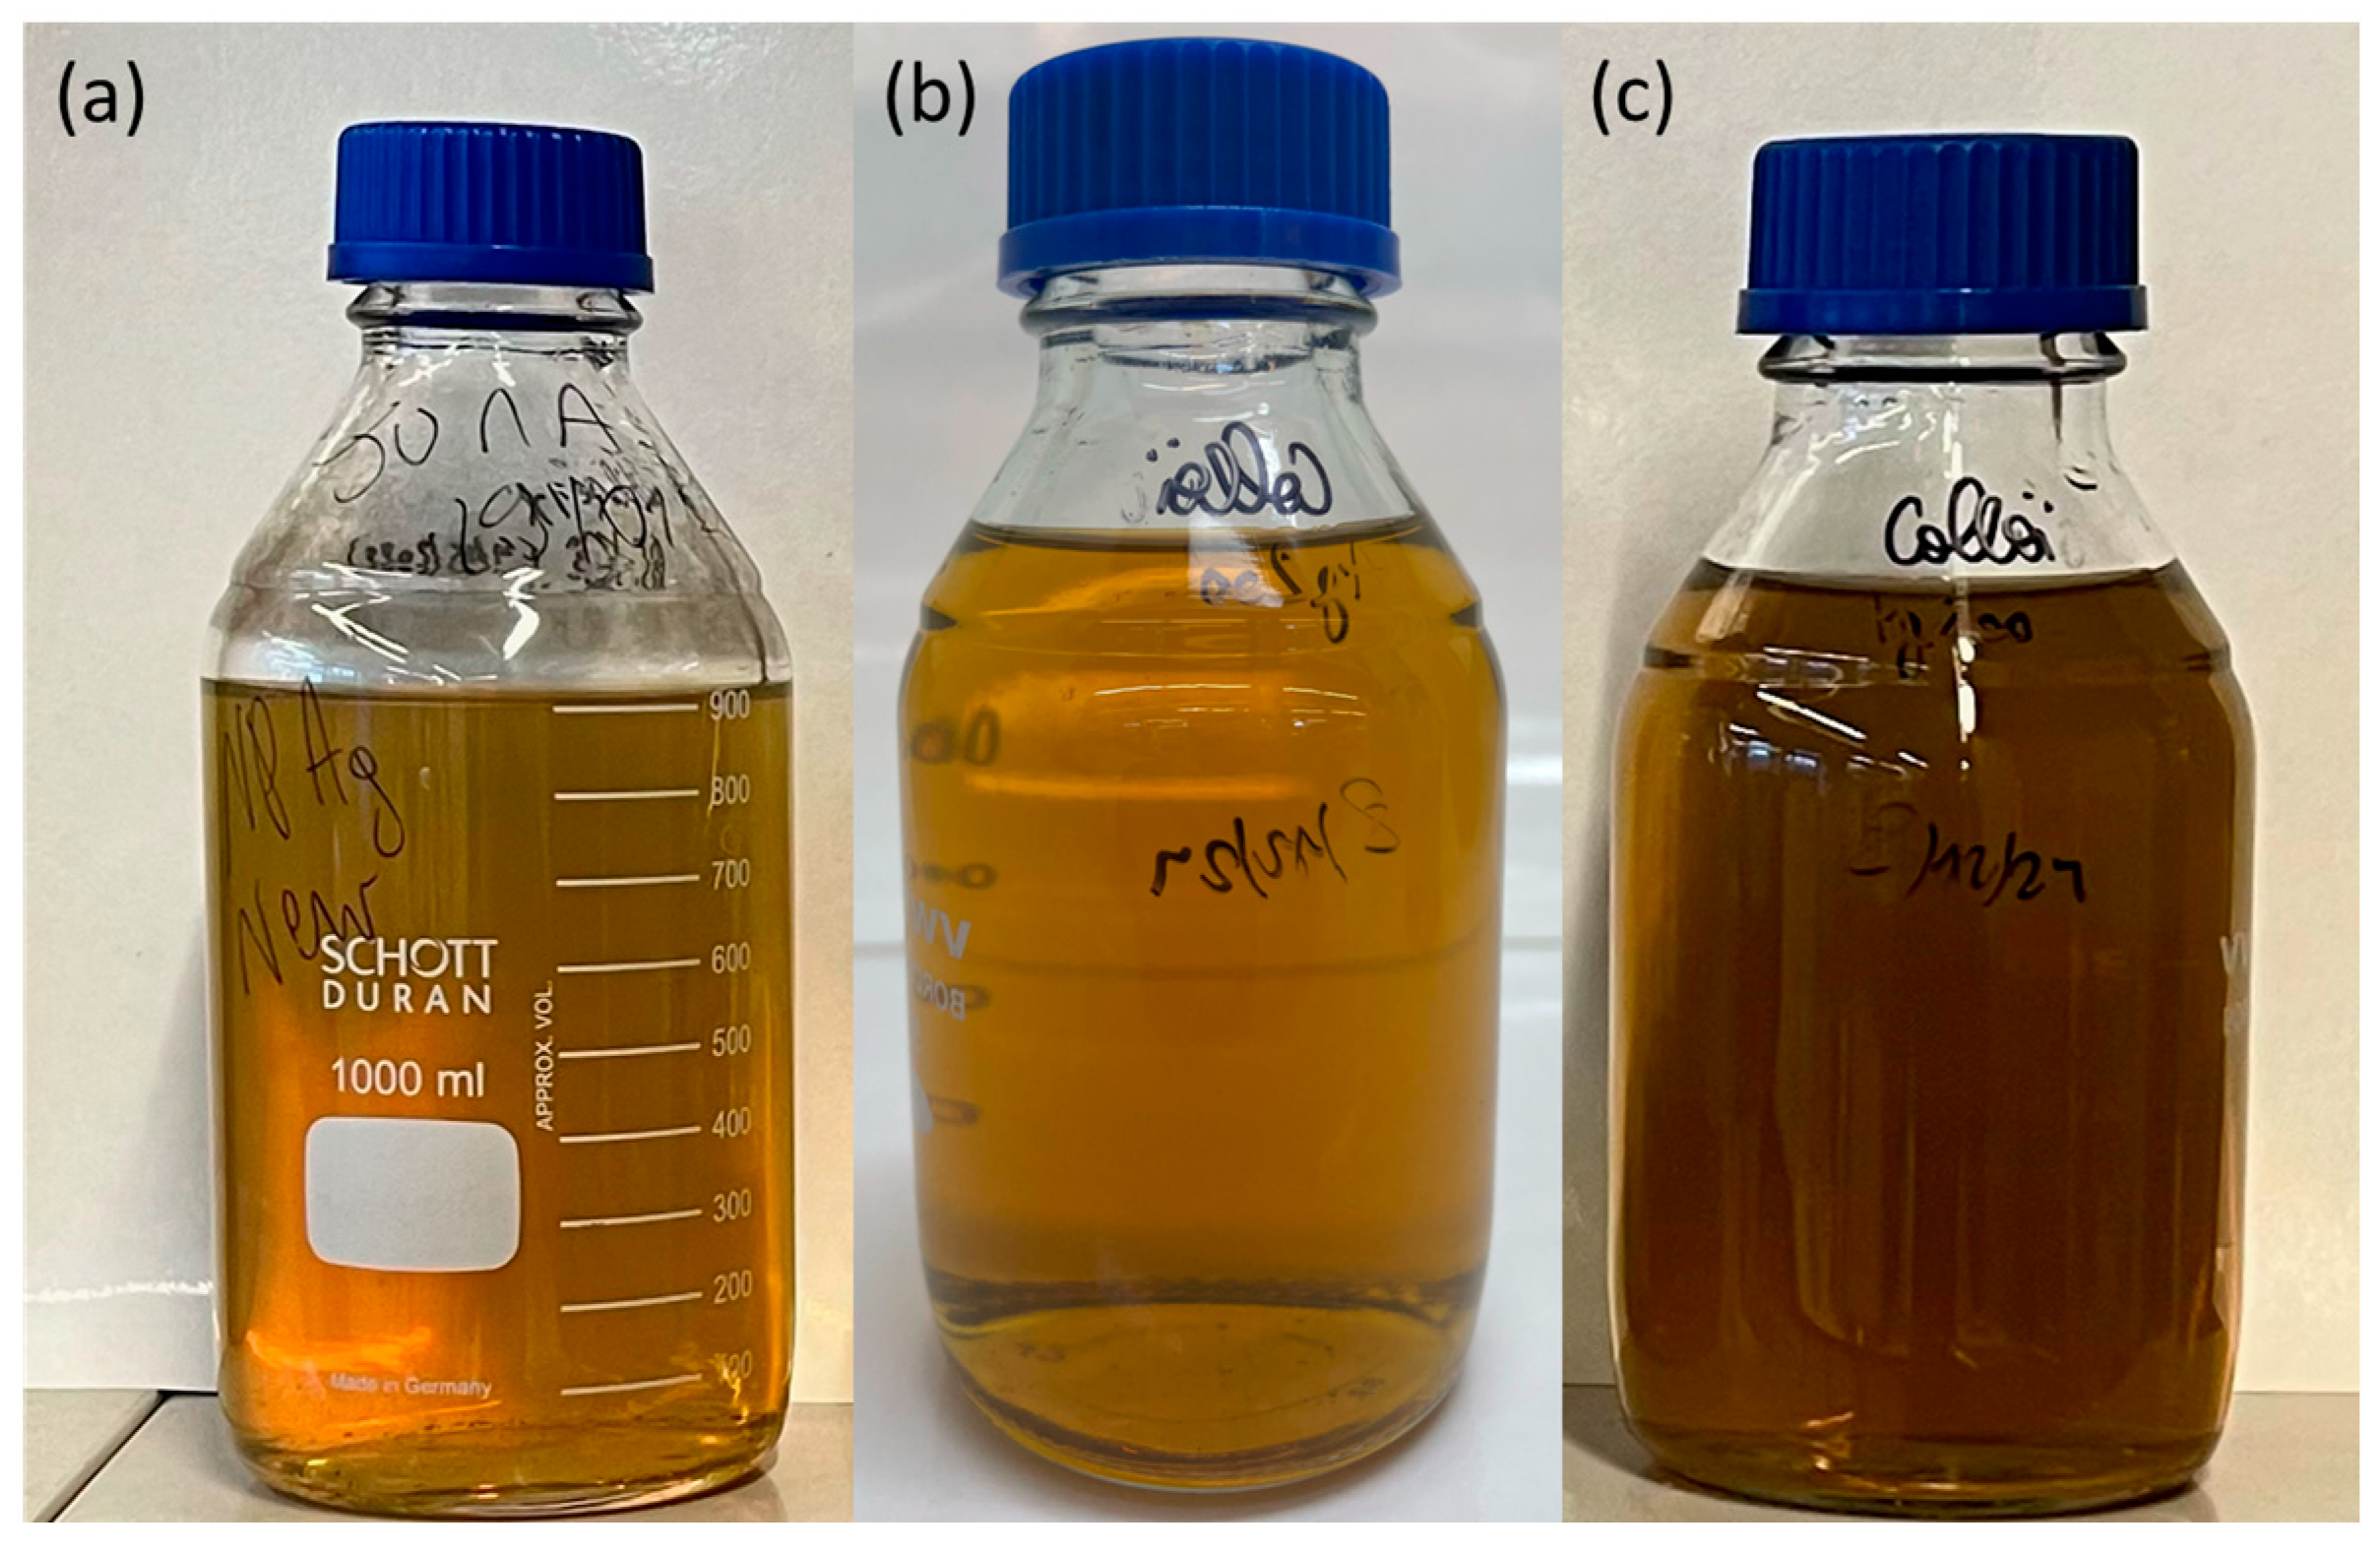
2.1. Macroscopic Aspect of the Ag Colloids

During the synthesis, Ag precursor (AgNO3 salt) is dissolved with citrate in water resulting in a transparent solution. When the reducing agent is added (NaBH4), the Ag nitrate salt is reduced in metallic silver nanoparticles resulting in a yellowish suspension characteristic of Ag nanocolloid [35]. Figure 1 shows the Ag200, Ag400, and Ag800 colloids. Ag200 and Ag400 have similar visual aspects, but Ag800 is darker. This change in color is linked to the Ag nanoparticle size. Indeed, based on the color, it seems that Ag200 and Ag400 have similar sizes, whereas Ag800 has a bigger size. This can be verified in the next section by TEM, DLS, and XRD measurements.

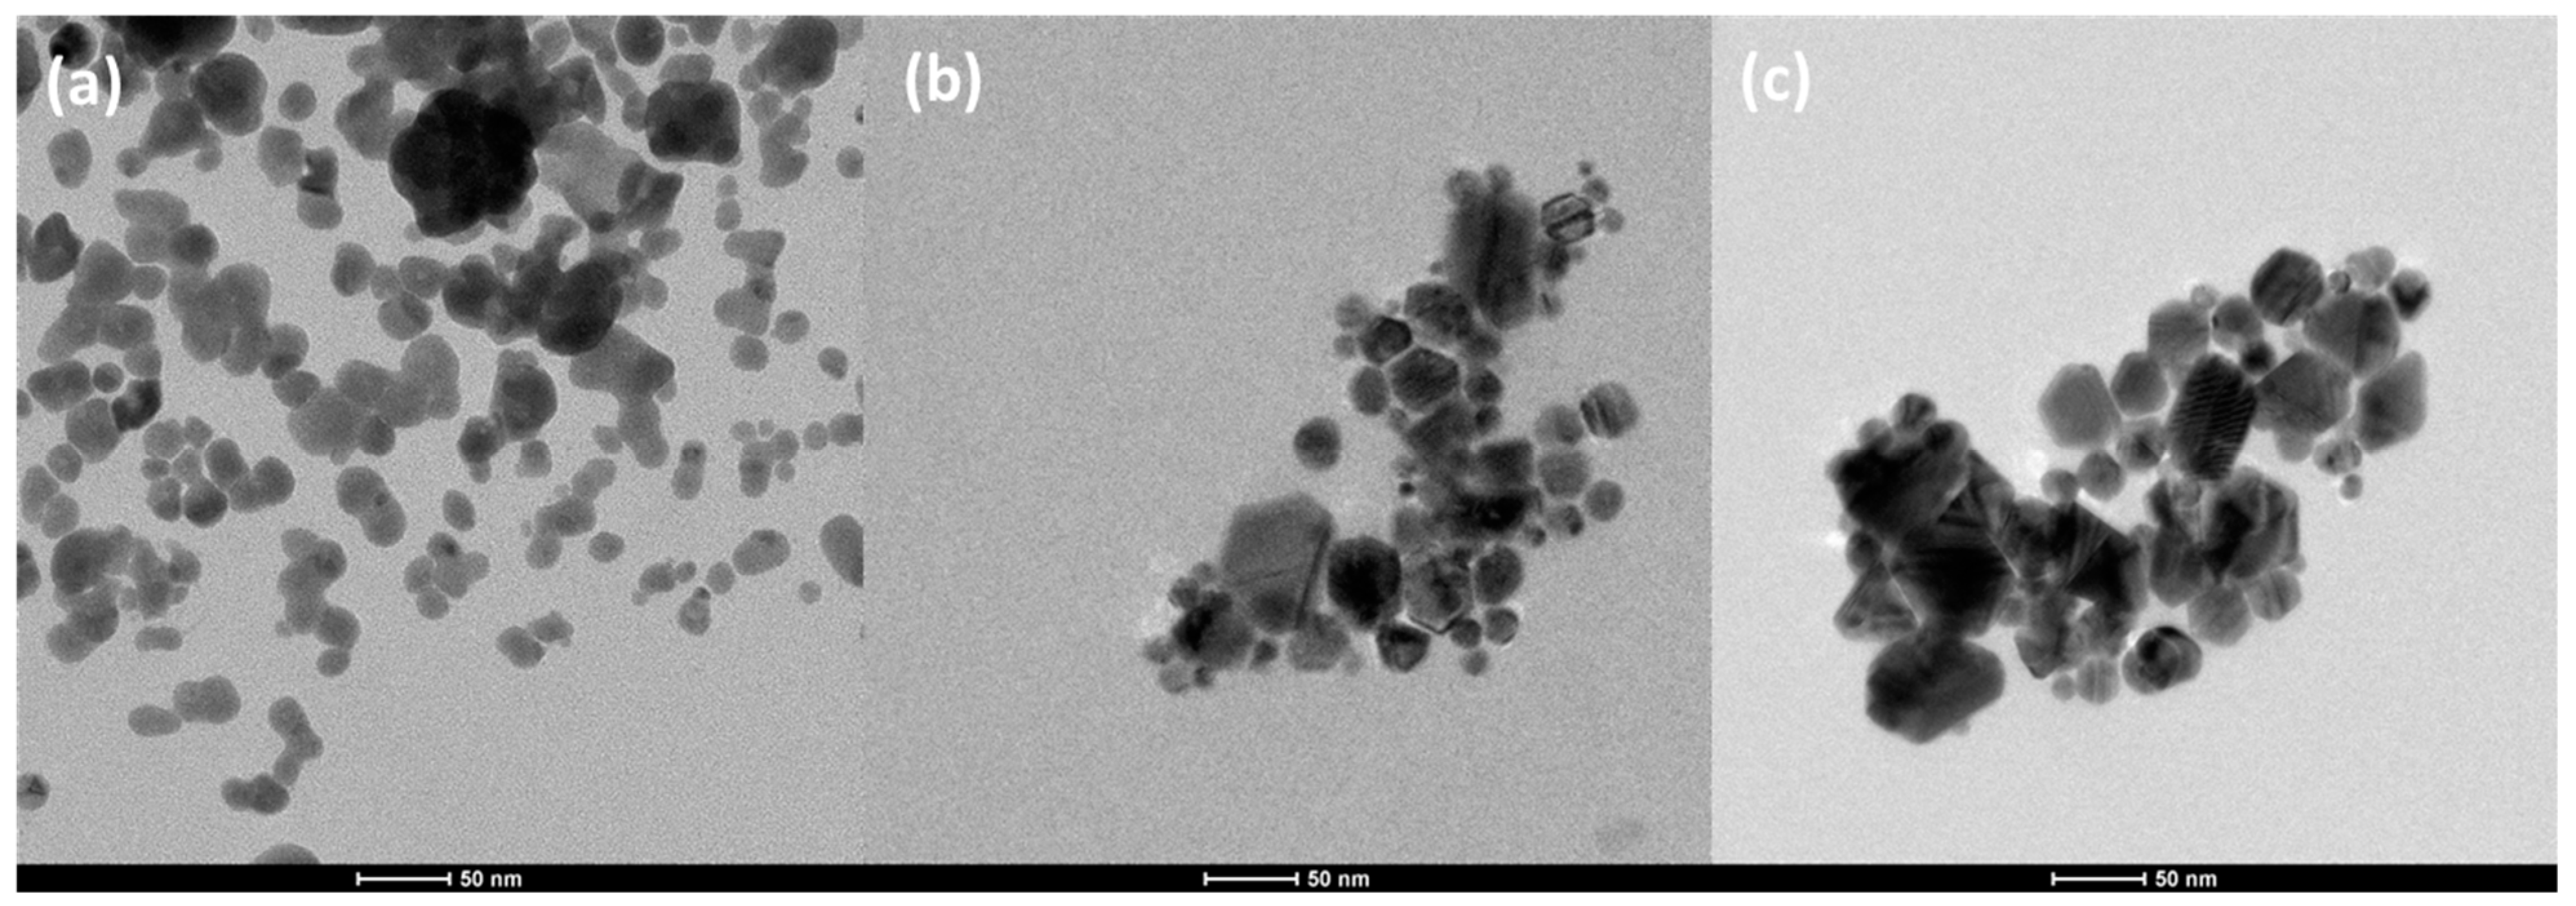
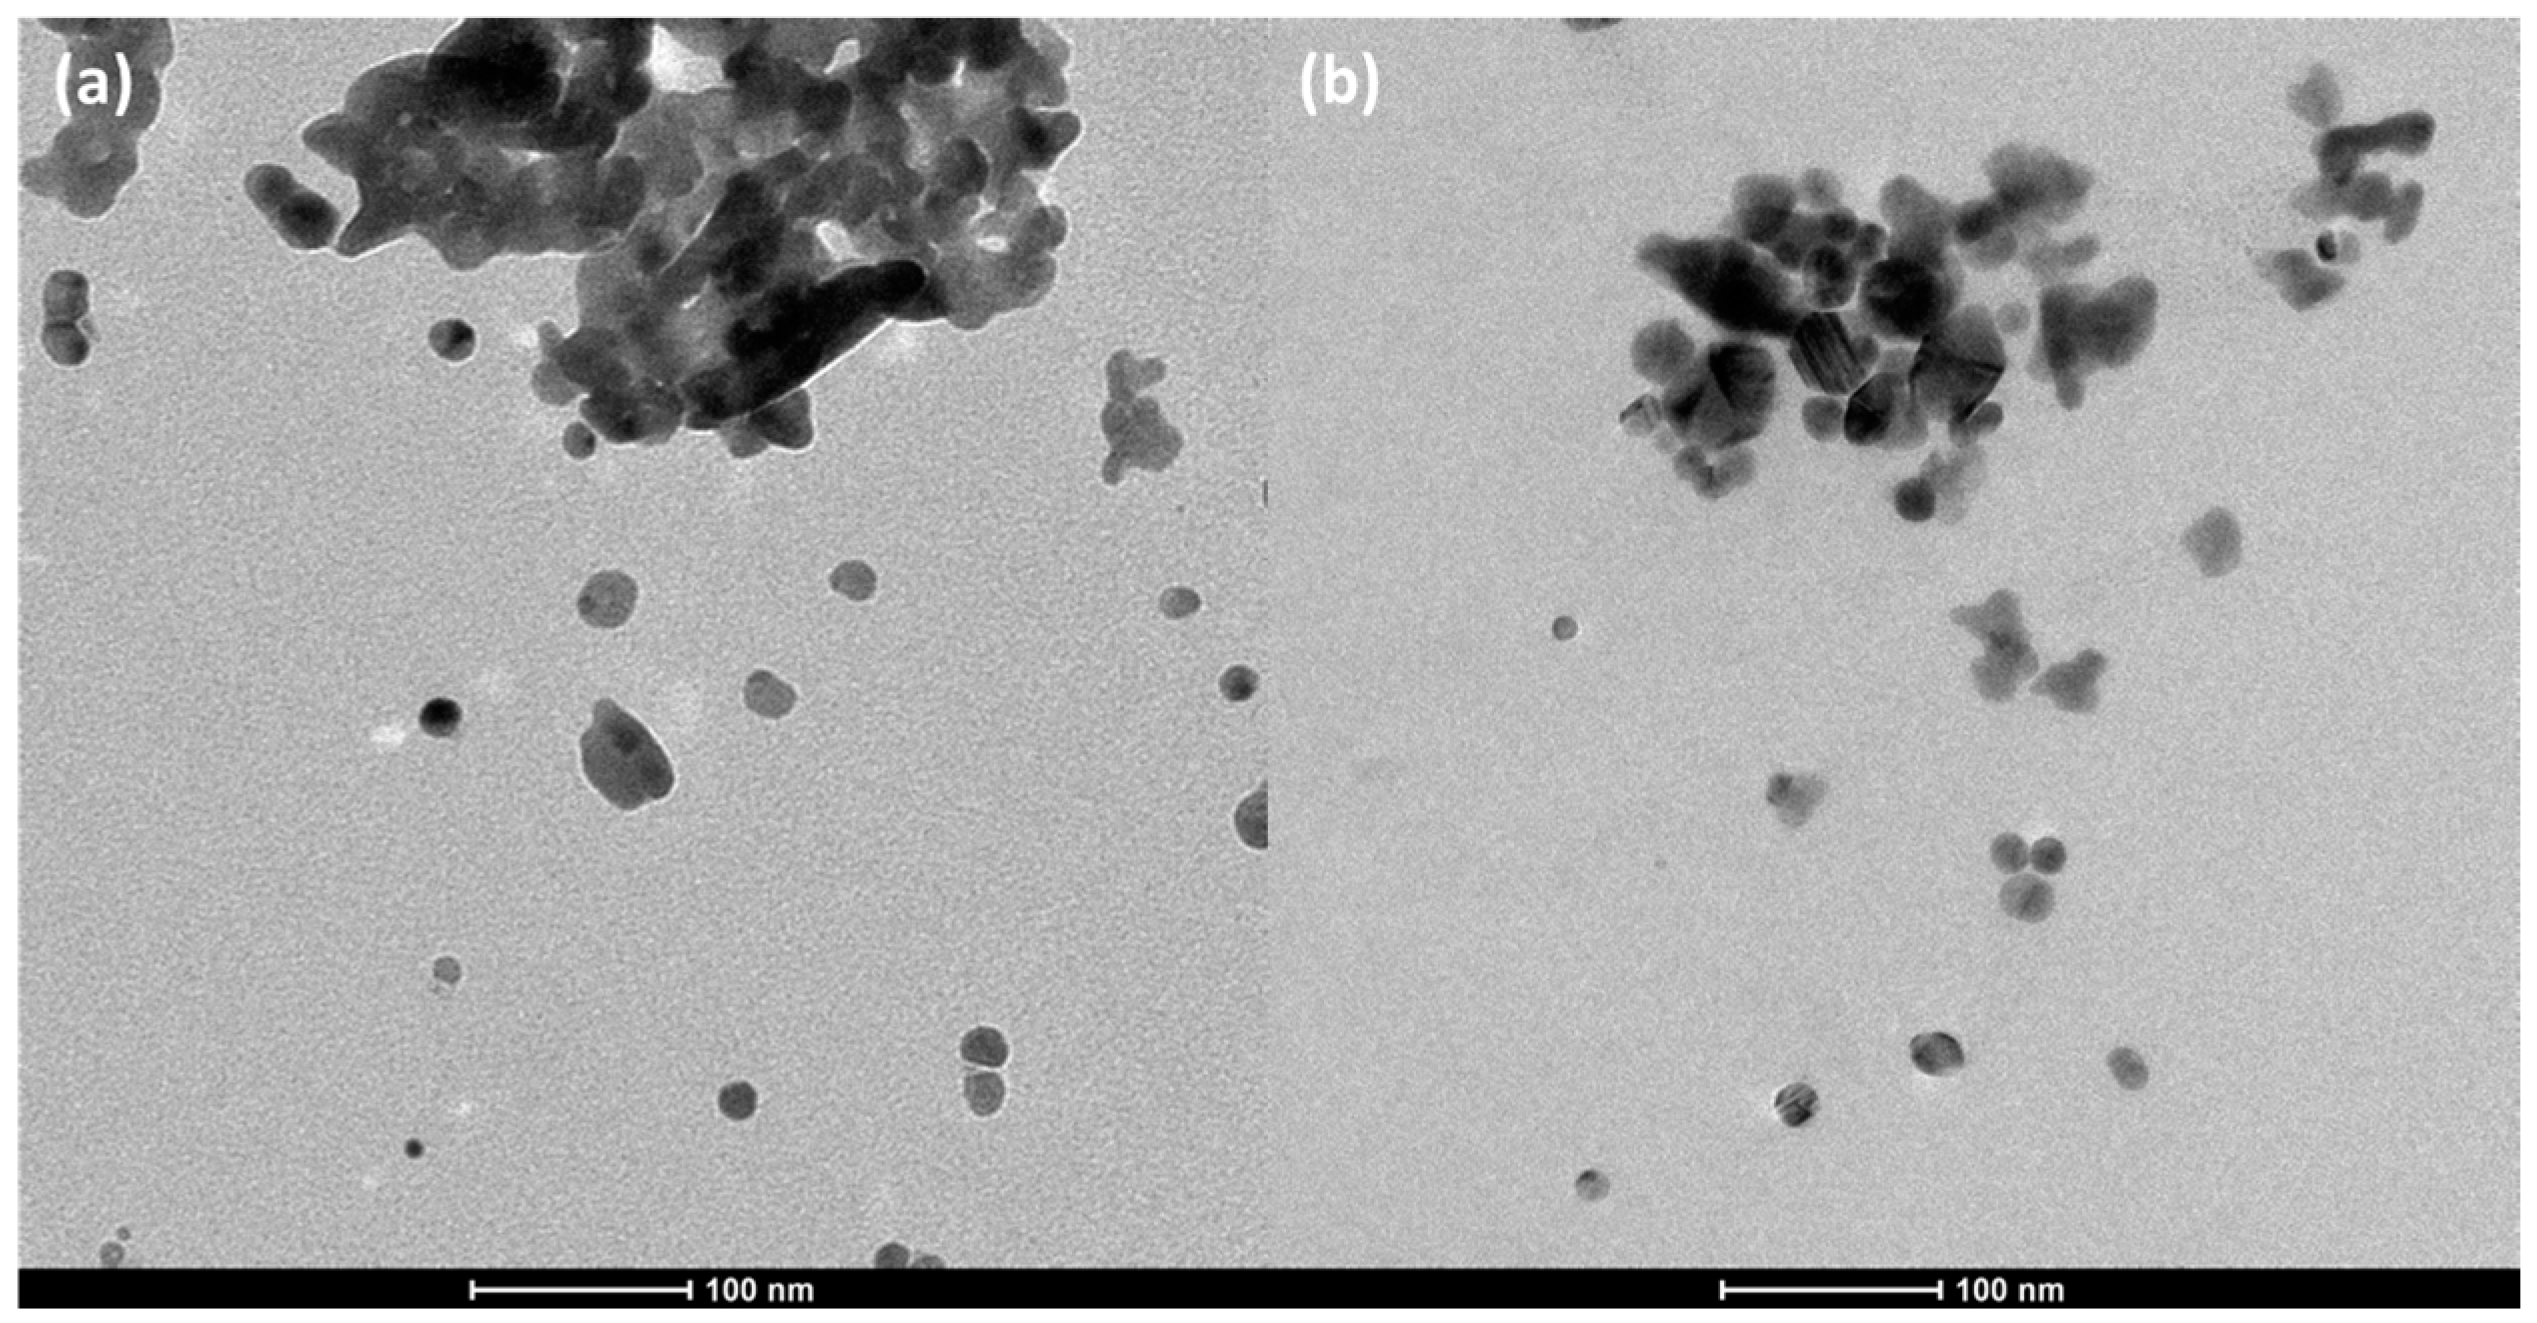
2.2. Composition and Morphology of the Ag Nanoparticles

The colloid suspensions are subjected to DLS analysis in order to have information about the nanoparticle/aggregate size in an aqueous medium. The data are summarized in Table 1. Different hydrodynamic diameters are given depending on the calculations. Between the three samples, it is observed that the size of the aggregates increases from sample Ag200 to Ag800 for each hydrodynamic diameter. Ag200 and Ag400 samples have a similar polydispersity index (~0.35), while the Ag800 sample has a bigger one (~0.45), meaning that its distribution of particle/aggregate size is broader (Table 1). The hydrodynamic diameter can be different for the same sample because of the way it is estimated. For some diameters, bigger particles would have a bigger impact on the calculated value, and for some other diameters, smaller will have a bigger impact. For instance, for the Ag200 sample, the hydrodynamic diameter calculated from the intensity of the particles, DDLSintensity, is 103 nm, while the hydrodynamic diameter calculated from the number of particles, DDLSnumber, is only 12 nm. The first gives more importance to bigger particles having a higher intensity signal, whereas the latter counts every particle, no matter the size. The hydrodynamic diameter usually used from DLS measurement is the DDLScumulant, which is between 58 and 85 nm for the three samples. These values correspond to the aggregate size in suspension, as it is later confirmed by the size observed by TEM (dTEM, Table 1), which is smaller than the hydrodynamic ratio for the three samples. In photocatalysis, bigger aggregates lead to a shadow effect and less efficient absorption of the light, and thus less photoactivity [10].
In order to have more information about particle size and better interpret the DLS results, two other techniques are used in the next paragraphs (XRD and TEM) for size estimation. A comparison of the different particle sizes obtained with XRD, DLS, and TEM is made in the following paragraphs.
In order to measure the samples with XRD, they are deposited on carbon xerogel. Figure 2 shows the XRD patterns of the three colloids deposited on the same carbon. For the three samples, the three diffraction peaks of metallic silver as a face-centered cubic (fcc) structure [36] are observed at 38°, 44°, and 64° (plan 111, 200, and 220, JCPDS card n° 4-0783 [36]). Thanks to the Scherrer equation (Equation (7)), the size of the crystallite, dXRD, can be estimated (Table 1). For Ag200 and Ag400, similar sizes are estimated (25 and 28 nm, respectively). For Ag800, a bigger size is measured (53 nm).
The colloids are observed by TEM. Figure 3 represents the three colloid pictures. From colloid Ag200 to Ag800, it is observed that the size of the nanoparticles increases from a mean size of 21 nm to 45 nm (dTEM, Table 1). The Ag800 sample also has a larger distribution with double the standard deviation of Ag200 and Ag400 (Table 1). The shape is also a bit different: (i) the Ag200 sample takes the form of spherical particles; (ii) the Ag400 sample seems to contain a mix of spherical and hexagonal/rod-like nanoparticles, and (iii) the Ag800 sample takes the form of hexagonal particles. Globally, in each sample, the nanoparticles tend to aggregate, as noticed with the DLS measurements.
From the DLS, XRD, and TEM results, a better comparison of the three samples can be made (Table 1). From dTEM and dXRD, it can be concluded that the crystallite size is similar to the particle size and that each particle is made of one single nanocrystal of Ag. The DDLScumulant corresponds to aggregates of two Ag nanoparticles. The TEM and DLS measurements confirm that the Ag800 sample has a broader distribution of Ag nanoparticle size. It seems that the hydrodynamic diameter measured from the particle volume, DDLSvolume, is closer to the real size of the nanoparticles measured by TEM, dTEM.
Finally, the Ag200 sample is comprised of spherical Ag nanoparticles having a mean diameter of around 20 nm. By comparison, Ag400 is comprised of hexagonal/rod-like and spherical Ag nanoparticles having a mean diameter of around 30 nm with a narrow distribution, whereas the Ag800 sample is made of hexagonal/rod-like Ag nanoparticles having 50 nm of mean diameter with a broad distribution.
The increase in citrate concentration in the Ag nanoparticle synthesis (from 200 to 800 mg) leads to the formation of broader distribution, hexagonal/rod-like shape, and bigger Ag nanoparticles. In fact, sodium citrate is a capping agent that can help to better disperse the produced nanoparticles, but it is also a reducing agent (less strong than NaBH4) [17,35]. If the amount is too high, the reduction will be increased, leading to the formation of bigger particles with less homogeneous size due to a less-controlled reduction.
Moreover, the influence of the pH can also modify the size and shape of the resulting Ag NPs. It has been shown [43] that at lower pH (around 7), bigger rod-like, hexagonal, and triangular shapes are produced, while high pH favors the production of small spherical shape particles.
In this study, when the amount of citrate increases from Ag200 to Ag800, the amount of reducing molecules increases, and the pH decreases as sodium citrate is a weak acidic molecule (pH of 8.5, 8.3, and 7.8 for Ag200, Ag400, and Ag800, respectively). This leads to the evolution of the particle shape from spherical, for the Ag200 sample in Figure 3a, to hexagonal/rod-like, for the Ag800 sample in Figure 3c, and to a larger particle size with broader distribution (Table 1). The ag400 sample has nanoparticles with intermediate shapes and sizes between Ag200 and Ag800.
The mechanism of Ag NPs formation can be considered as follows: the sodium citrate acts as a capping and reducing agent of silver surrounding the Ag NPs, as shown in Figure 4A of Darweesh et al. [49]. This produces a specific structure like a micelle that allows the growth of spherical nanoparticles with a reducing rate identical all around the nanoparticle, and the citrate also limits the size of the nanoparticle. However, when the amount of citrate is too high, this structure is destabilized, and growth in a preferential direction can happen, leading to the formation of rod-like particles. It is what happens between the samples here from a lower citrate content (Ag200) to higher content (Ag800).

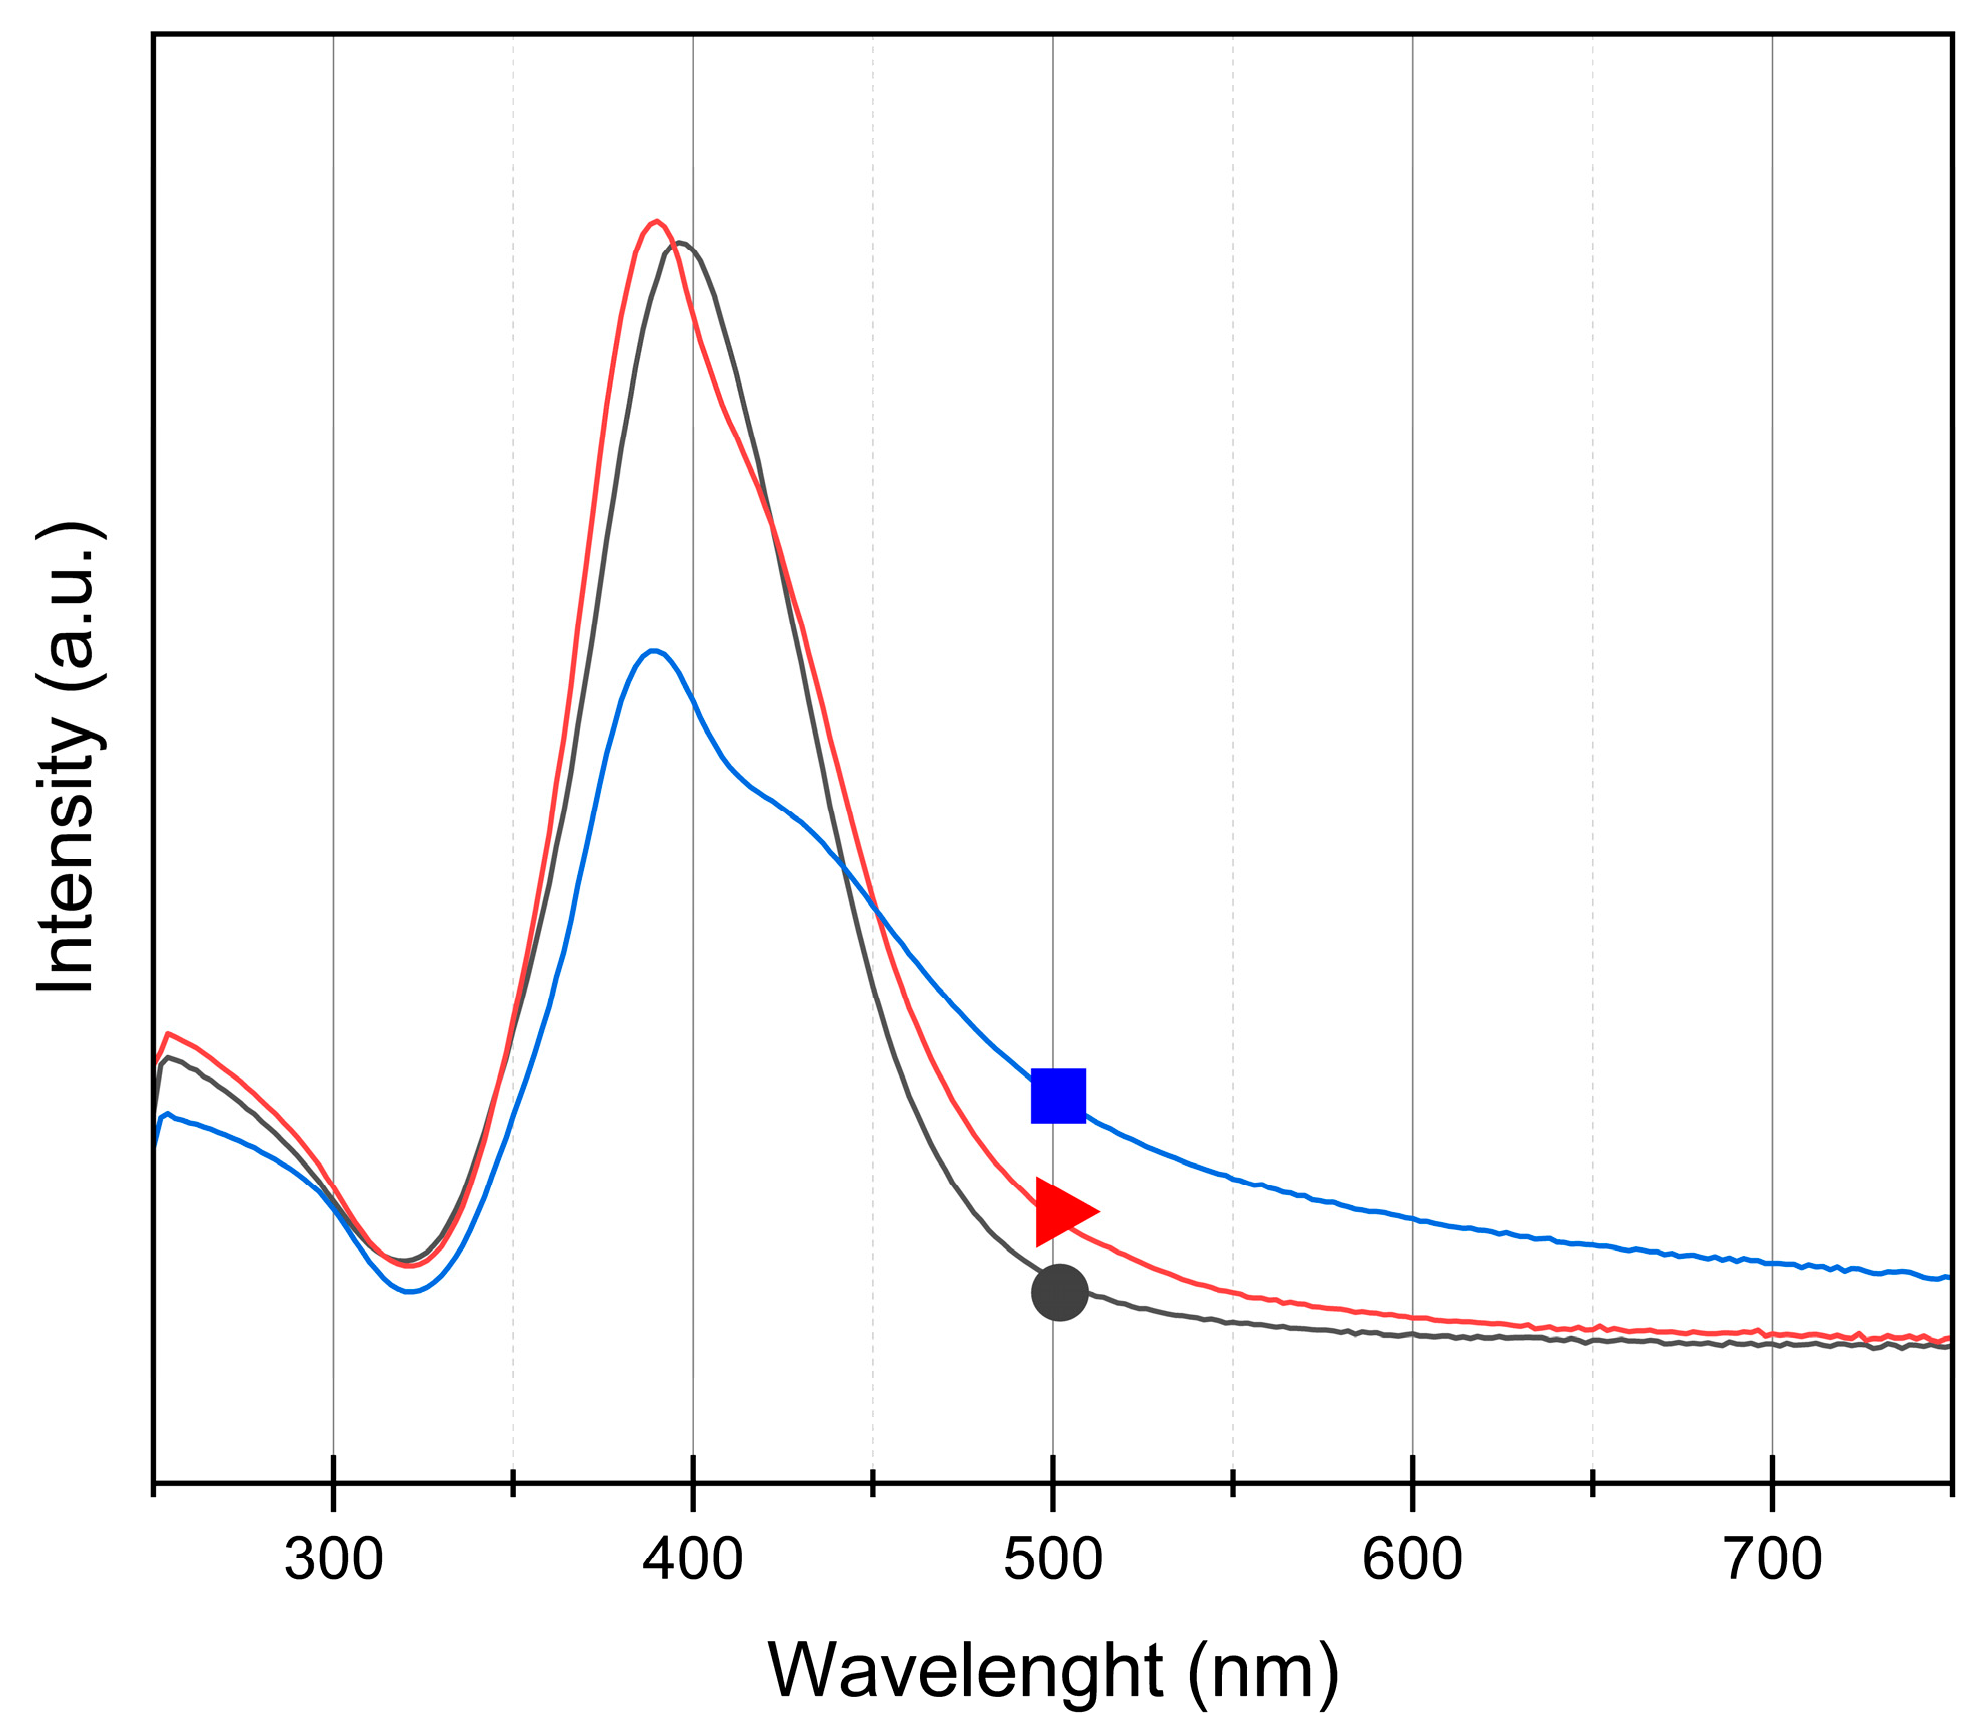
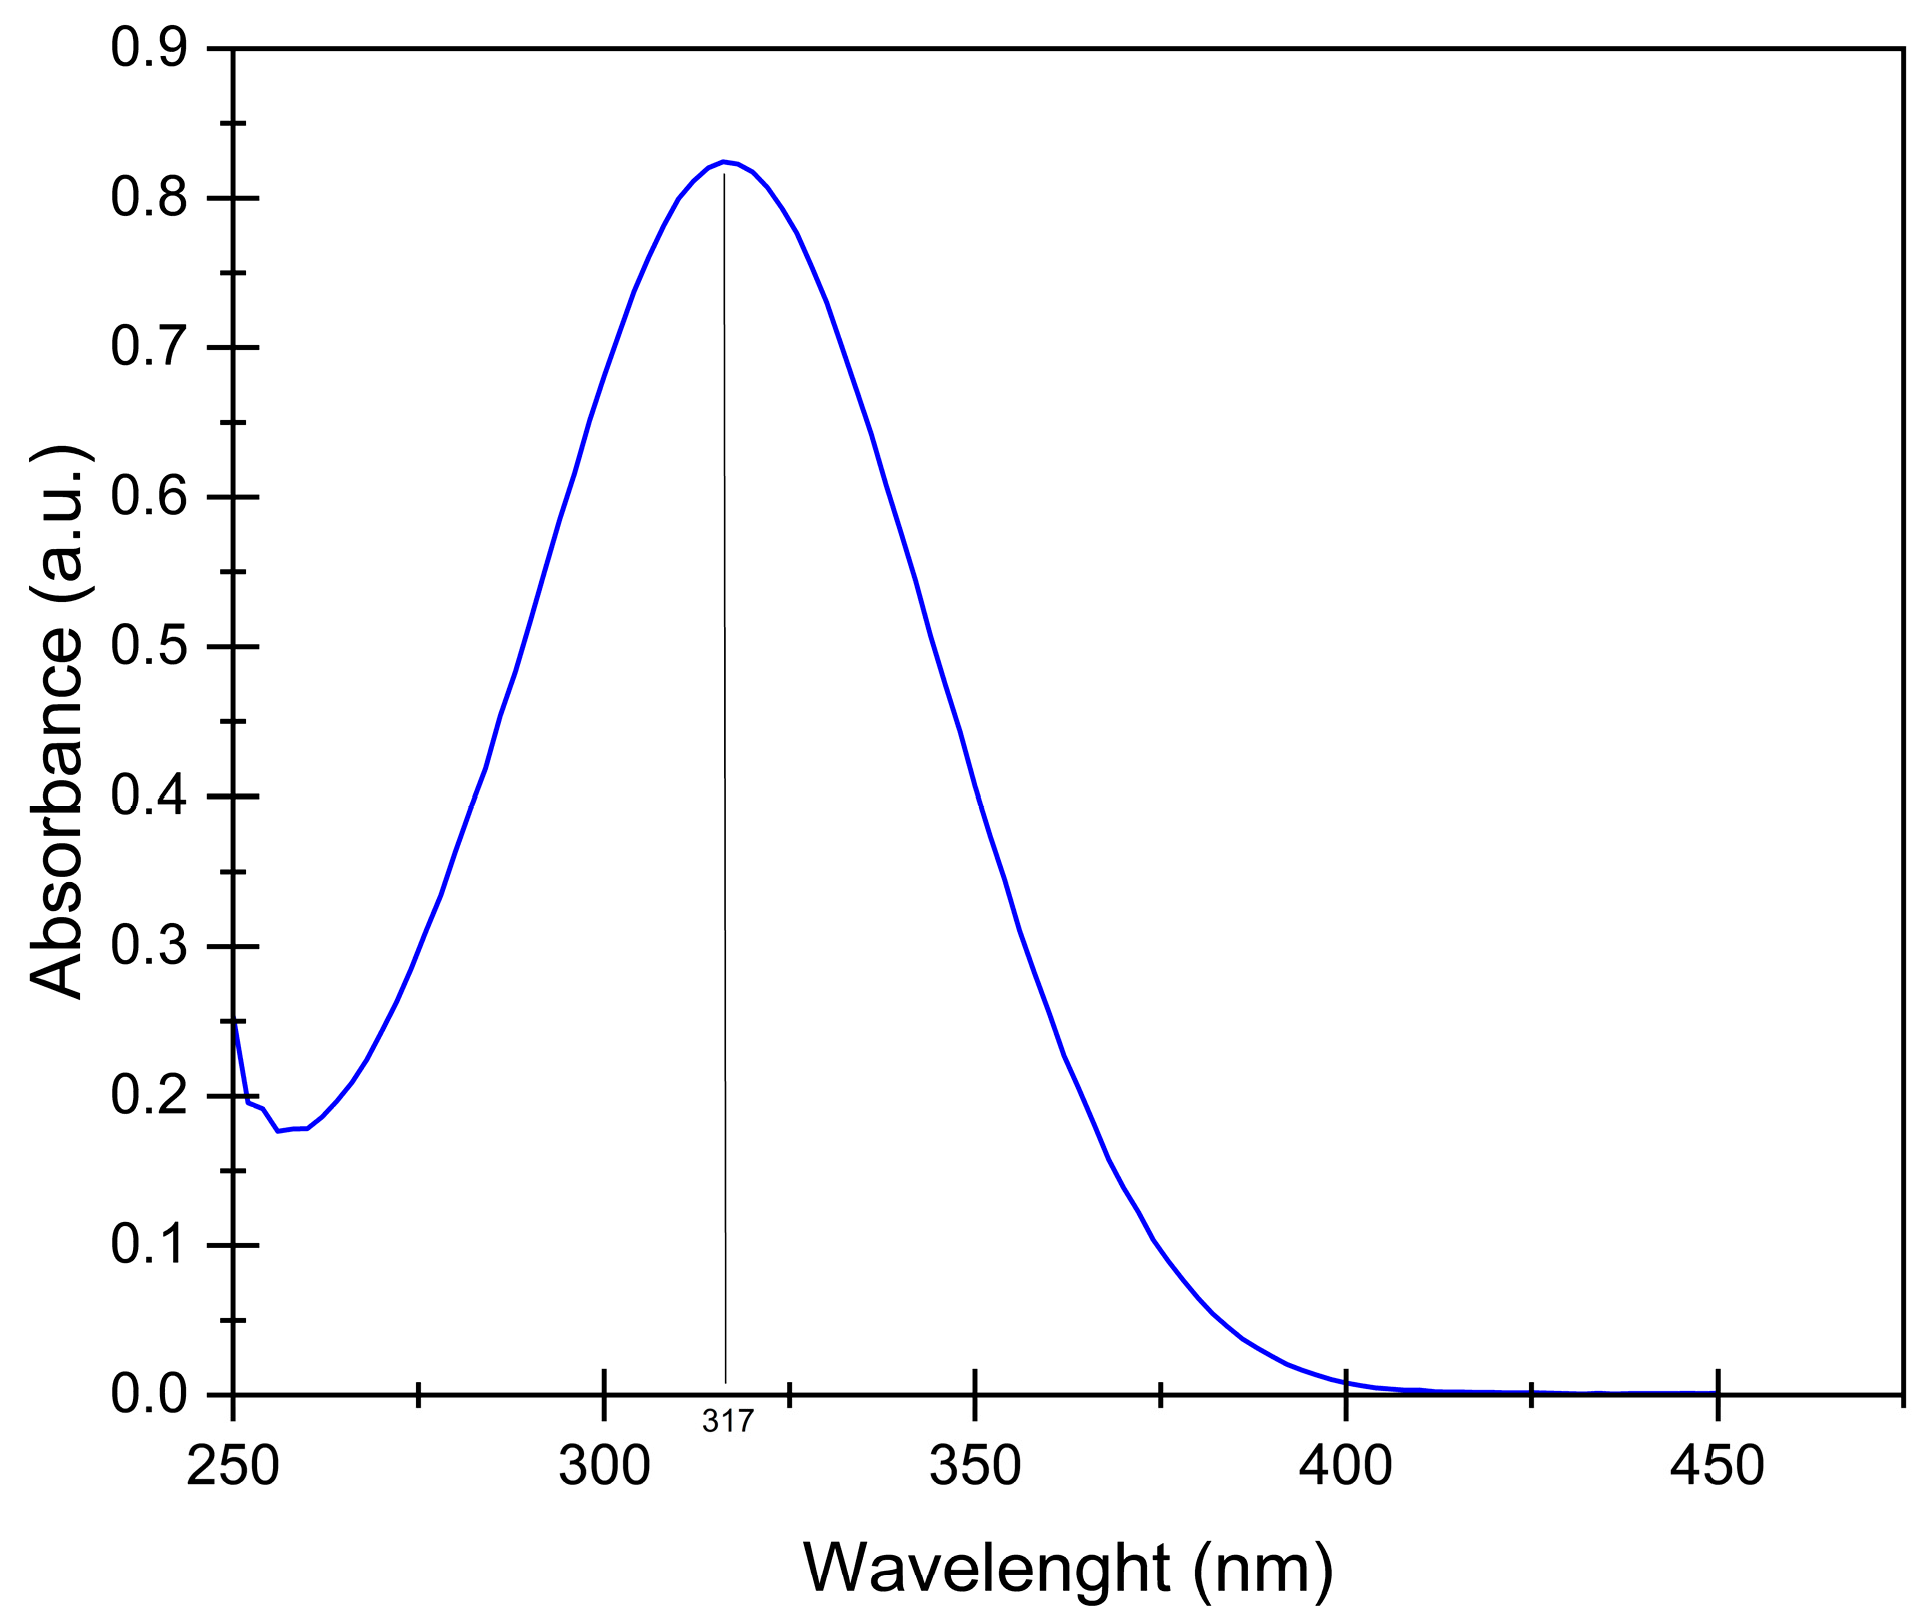
2.3. Optical Property of the Ag Colloids

The UV/visible spectra of the three colloids are represented in Figure 4 between 250 and 800 nm. For each sample, a main absorption peak is observed around 395 nm, which is characteristic of Ag nanoparticles [35]. The maximum peak values are 396, 390, and 390 nm for Ag200, Ag400, and Ag800, respectively. This peak is due to the localized surface plasmon resonance (LSPR) of Ag nanoparticles which is located in the UV/visible region [29]. The spectra are similar for Ag200 and Ag400 samples, where only a small displacement can be observed that can be linked to the different sizes of the nanoparticles [35] between the two samples (20 and 30 nm, respectively, Table 1). For Ag400, a small shoulder is observed around 400 nm, which can be attributed to a less homogeneous distribution as in Ag200, showing that Ag400 is intermediate between Ag200 and Ag800. For Ag800, the peak is broader than the two other samples, which can be explained by the broad size distribution and the bigger nanoparticle size [28,35] of this sample observed by TEM and DLS.
Due to the absorption peak around 390–400 nm, these Ag nanoparticles can have interesting properties if they are illuminated with light in this region. The next section explores its photocatalytic properties in the UV/visible range.

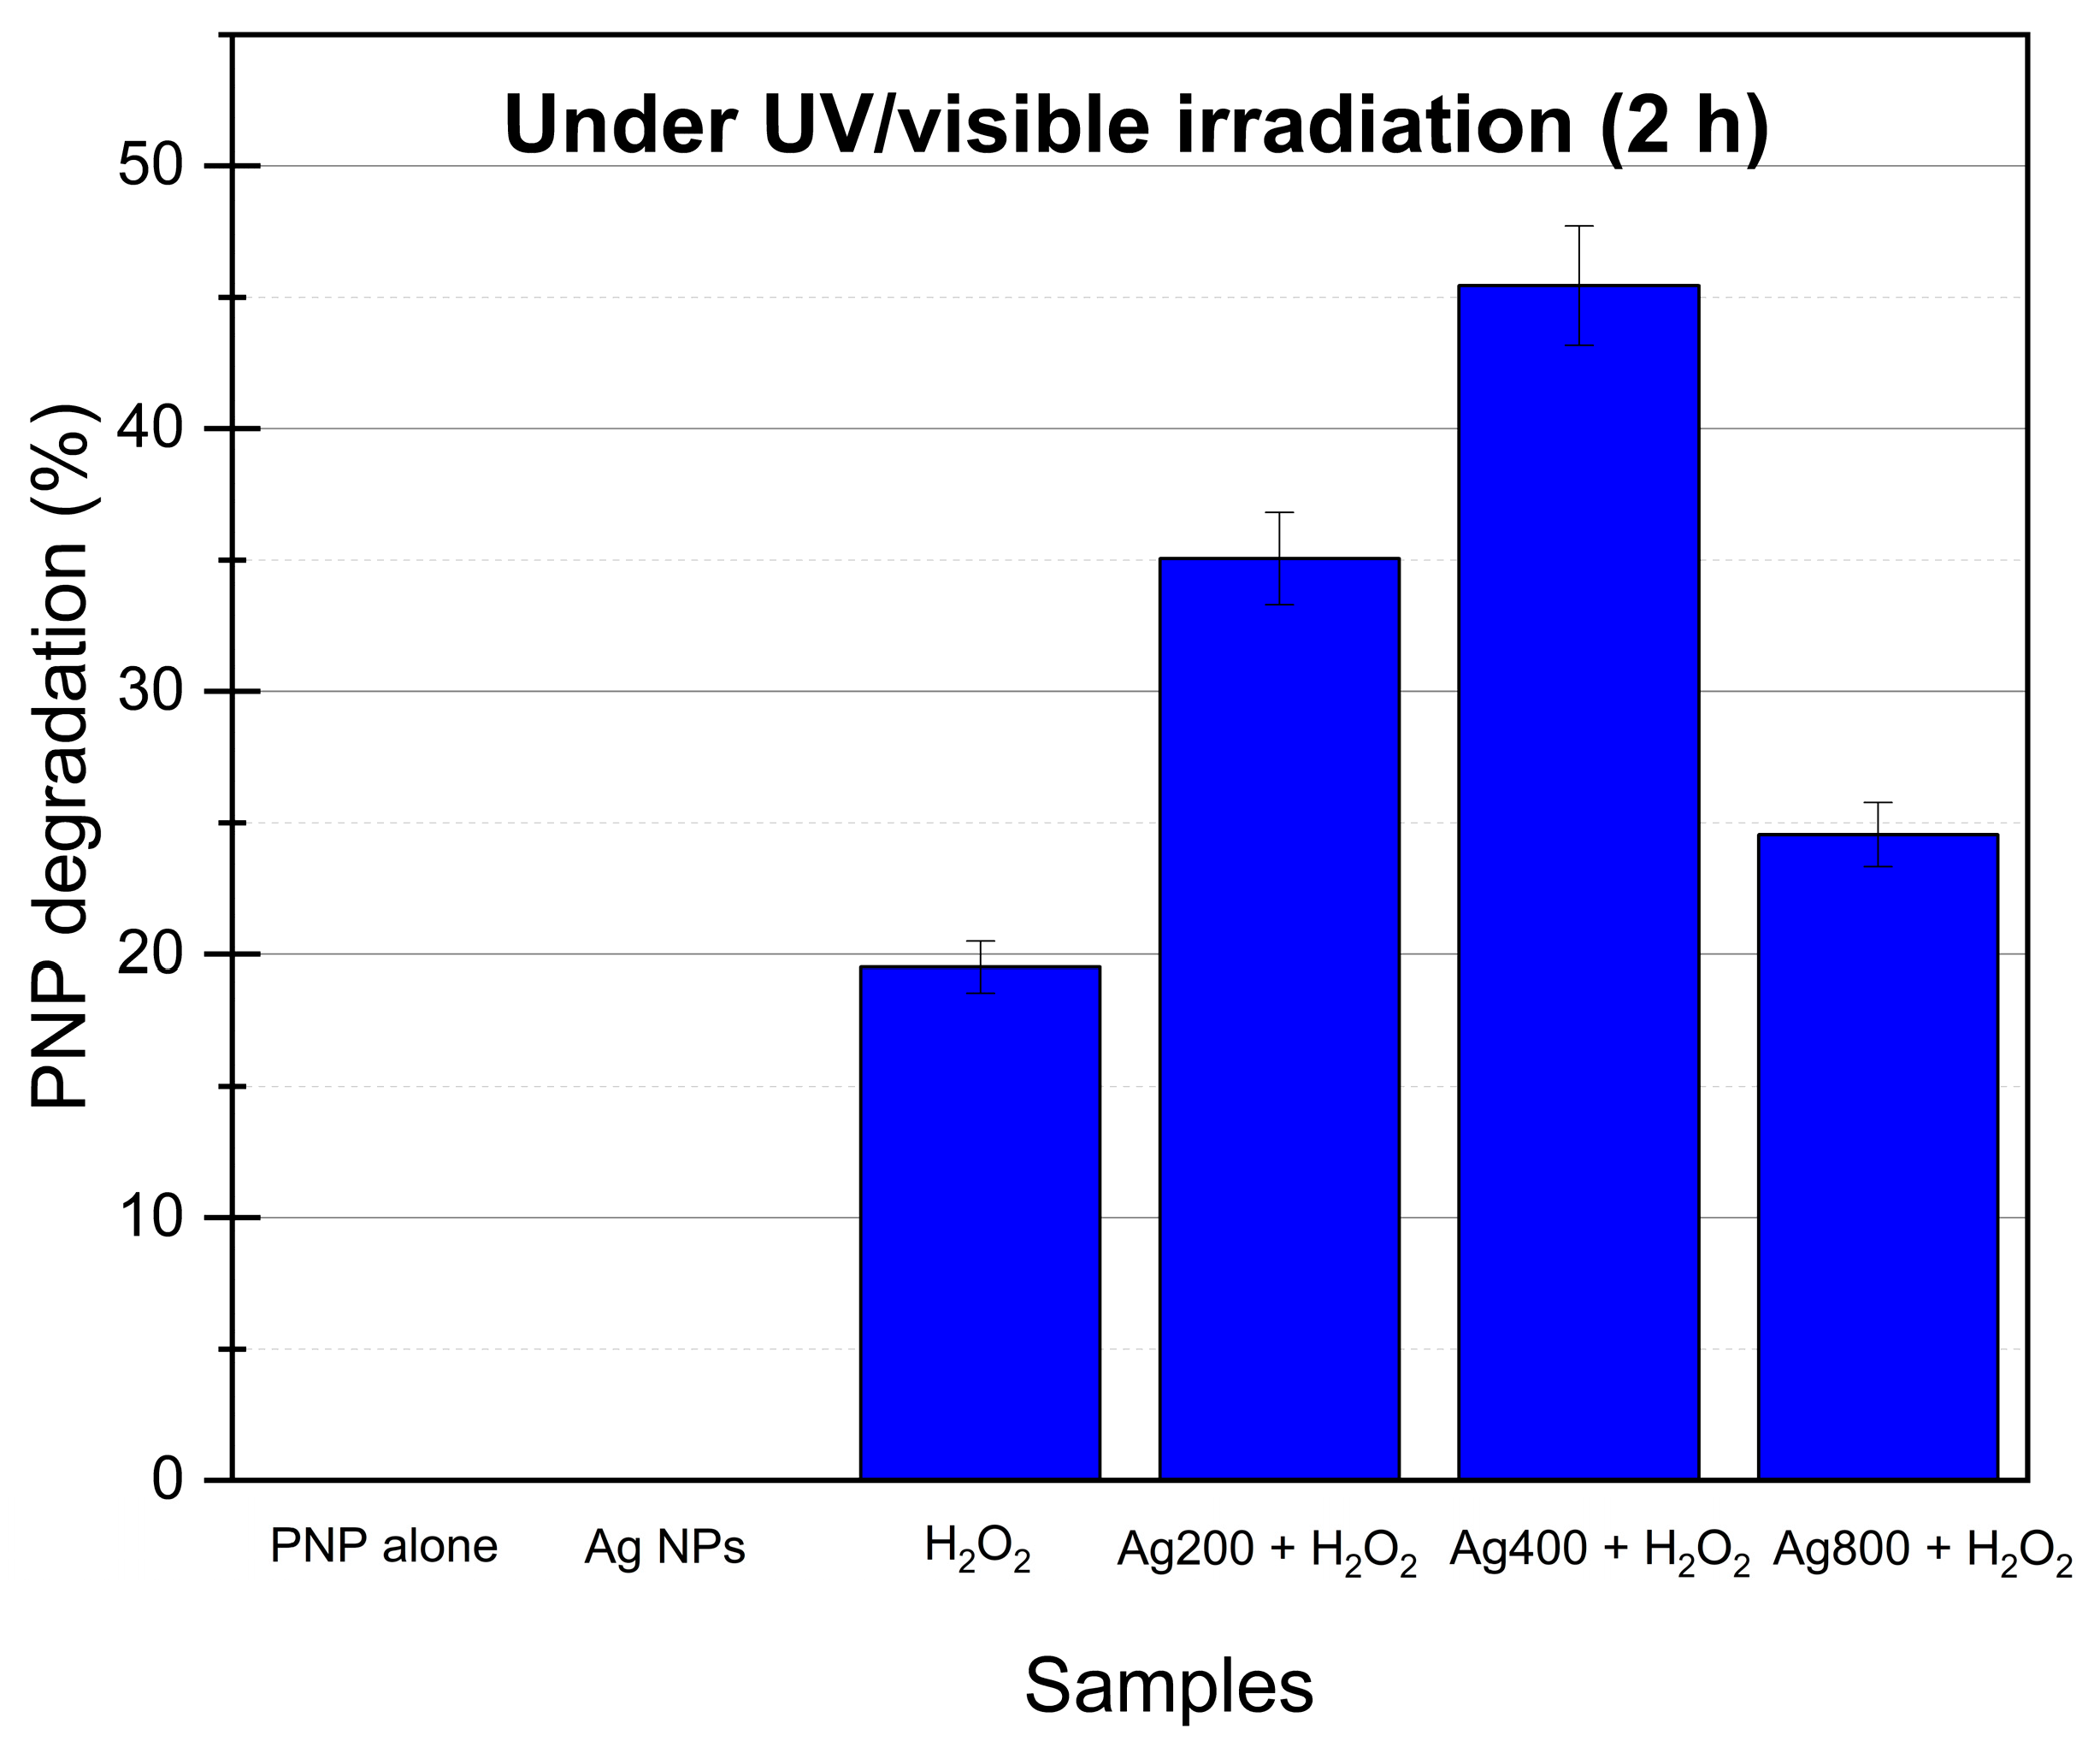
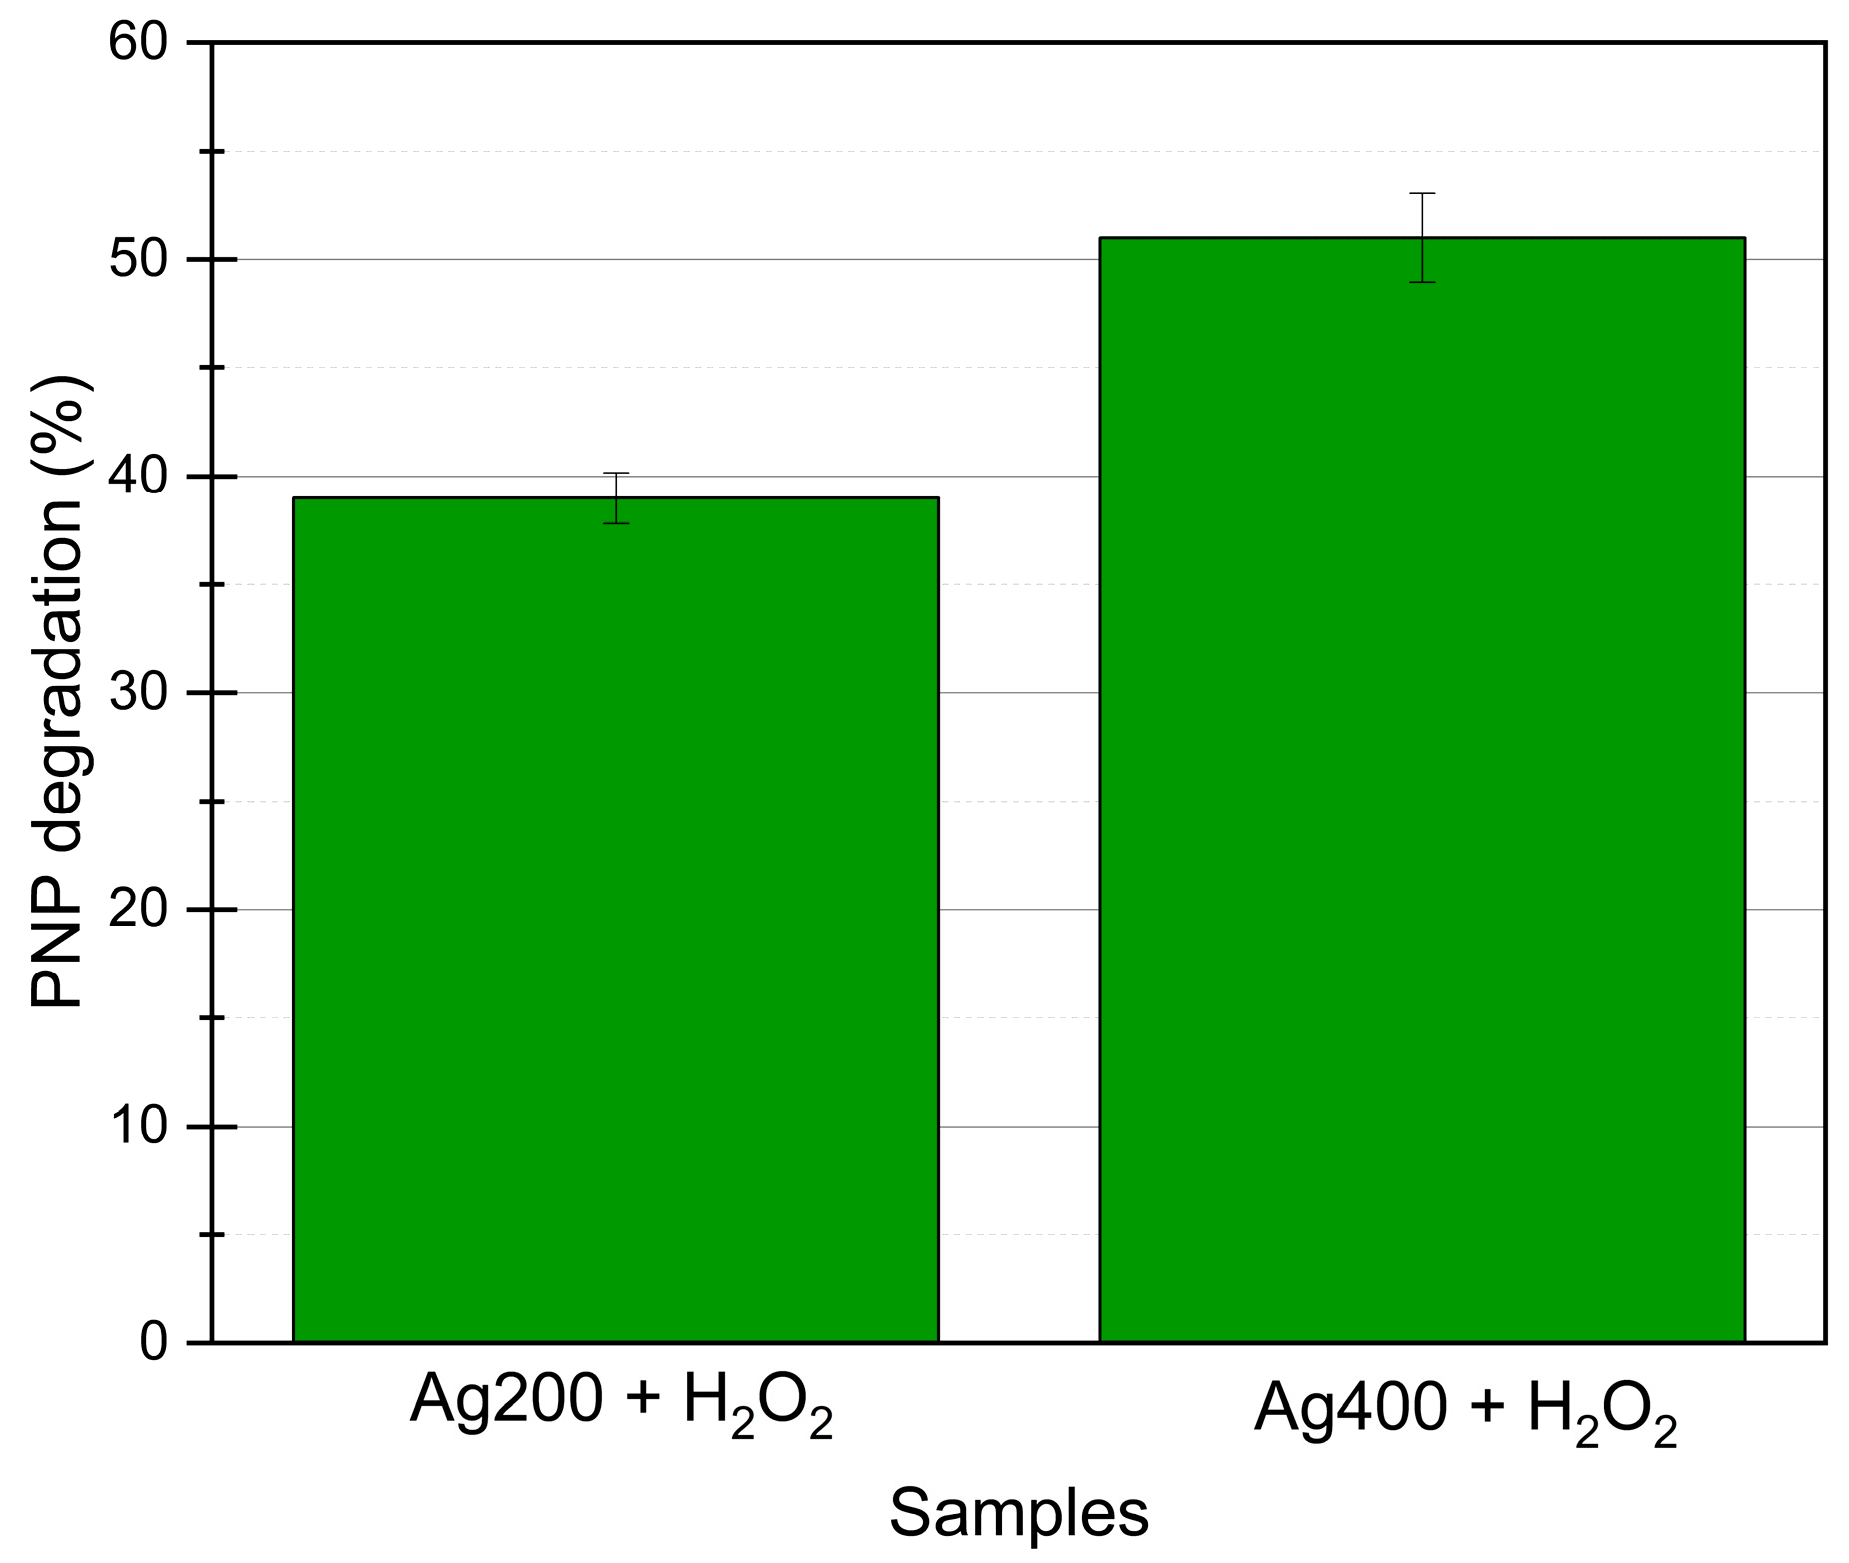
2.4. Photocatalytic Activity of Ag Nanoparticles with H2O2

The photocatalytic activity of the Ag nanocolloids is evaluated on the PNP degradation in water in the presence of H2O2 under UV/visible illumination.
First, dark experiments are performed with and without H2O2. The results indicate that no degradation of PNP is observed after 24 h. It means that no adsorption of PNP occurs on the Ag NPs for the samples Ag NPs + PNP in the dark. For the samples, H2O2 + PNP and H2O2 + PNP + Ag NPs in the dark, no degradation happens.
Then, experiments under illumination are performed, and the results of PNP degradation are presented in Figure 5. It is worth noting that when the UV/visible light (continuous spectrum between 300 and 800 nm) is used alone in the presence of only the PNP solution (direct photolysis) or with PNP and Ag NPs without H2O2, no degradation is observed as it was previously observed by Samuel et al. [42].
When PNP solution with H2O2 alone is illuminated, around 20% of PNP is degraded after 2 h of irradiation (Figure 5). Indeed, when the H2O2 solution is exposed to illumination with a wavelength < 360 nm [10,50], there is homolytic cleavage of hydrogen peroxide into hydroxyl radicals (Equation (1)) [8]. These radicals can then degrade the organic pollutant, i.e., PNP (~20%, Figure 5).
When Ag nanocolloid is added, the degradation of PNP is enhanced to 46% by using Ag400. In fact, when Ag nanoparticles are illuminated by UV/visible light, it produces a localized surface plasmon resonance (LSPR) of the Ag nanoparticles. This LSPR produces electrons and holes [34,51,52,53] that can easily react with H2O2 and H2O to catalyze and enhance the decomposition of hydrogen peroxide into hydroxyl radicals and also produce some radicals from water. The more OH and O2 radicals are produced, the more effective the process for degradation of PNP is. Based on the literature [34,53,54,55], the following mechanism can be considered for the photocatalytic degradation of PNP with H2O2 and Ag NPs under UV/visible irradiation (Equations (1)–(6)):
H2O2 + → 2 OH
Ag + → Ag(h+) + e
e + H2O2OH
e + O2O2
Ag(h+) + H2O → OH + H+
PNP + OH/O2 →…→ CO2 + H2O
where h is the Planck constant (6.63 × 10⁻³⁴ J·s), ν is the light frequency (Hz), e is an electron, and h+ is a hole.
In order to ensure that complete mineralization of PNP happens during the photocatalytic experiments, total organic carbon measurements are performed in parallel to the UV/visible spectroscopy measurements on the PNP sampling solutions. The numeric results are presented in Table 2 and compared with the numeric degradation obtained from UV/visible spectroscopy. It is noticed that the two measurements give very similar PNP degradation percentages. For example, for the photocatalytic experiment with Ag400 and H2O2, the PNP degradations are 45% and 46% with TOC and UV/visible, respectively. This confirms that the PNP is well mineralized when it is degraded and that no toxic by-product remains after the photocatalytic experiments.
The ag800 catalyst is less effective than the other two (Ag200 and Ag400). This discrepancy can be attributed to the large size of the Ag nanoparticles and the broader distribution. Indeed, it is observed in Figure 4 that the absorption intensity of the Ag800 sample is lower than the other two samples, resulting in a lower LSPR and a lower electron transfer to H2O2. Moreover, the DLS results (Table 1) show that the dispersion in solution for this sample is the least efficient. So, larger aggregates of Ag NPs are present, which results in less efficient contact with the pollutant and lower light absorption.
Ag400 catalytic activity is superior to that recorded with the Ag200 sample. The ag400 sample has a narrow distribution (similar to that recorded with Ag200) but a slightly bigger nanoparticle size (30 vs. 20 nm, Table 1). Likewise, the Ag400 sample takes the form of spherical and hexagonal/rod-like nanoparticles, compared to the Ag200 sample, whose shape of nanoparticles is spherical only. It suggests that the mix of spherical and hexagonal/rod-like nanoparticles is the most efficient nanocolloid to enhance H2O2 conversion into hydroxyl radicals and to increase the PNP degradation. As a matter of fact, when the Ag NPs’ shape evolved from spherical to hexagonal/rod-like, it produced more defects in the structure [43]. It is known that photocatalysts with defects, up to a certain amount, have a better e-h+ charge separation [56,57]. The better activity of Ag400 can be due to this phenomenon, with this sample being an intermediate between the Ag200 (spherical shapes with low defects) and Ag800 (hexagonal/rod-like shapes with many defects) structures.

2.5. Recycling and Photocatalytic Stability

The two best photocatalysts, Ag200 and Ag400, are tested on successive photocatalytic experiments (10 tests leading to 40 h of irradiation). Figure 6 represents the mean PNP degradation activity obtained after 10 cycles. It is observed that the activity stays constant throughout the cycles, showing the great stability of the samples. The photoactivity is even a bit higher than in the first cycle (4–5% more PNP degradation). It is possible that during the first experiment, the remaining citrate molecules are degraded in parallel to the PNP by the radicals, and then, on the following cycles, all the radicals can focus only on the PNP, increasing the degradation by a few percent. Moreover, these two materials are observed with TEM after the 10 experiments, which is represented in Figure 7. No visual modification is noticeable, and the photocatalysts keep their integrity when exposed to UV/visible light.

2.6. Comparison with Literature and Evonik P25 Commercial TiO2 Product

In Table 3, the present study is compared to the literature by summarizing the most important parameters and results of each study concerning the photodegradation of organic pollutants (mainly p-nitrophenol) using Ag-based materials.
Firstly, it can be observed that making a comparison is quite difficult because many conditions, such as the pollutant, the photocatalyst composition, the amount of photocatalyst, the pollutant concentration, the H2O2 concentration, or the illumination, differ greatly from one study to another.
Secondly, it can be observed that the photocatalysts developed in this study allow PNP degradation by mineralization in CO2 and H2O2, which is almost never reported in other studies. The PNP degradation in this study can seem lower compared to the other studies, but the Ag NPs amount is very low, as well as the H2O2 concentration. The work by Samuel et al. [42] has the closest photocatalytic conditions to those presented here for comparison purposes. They obtained a PNP degradation of 100% after 20 min, but they noticed that other peaks were found in the UV/visible spectrum during the photocatalytic experiments, showing that the degradation of PNP is not complete; it is a conversion of PNP in degradation products. Moreover, they used 4 times more H2O2 and 20 times more silver, which can lead to faster PNP degradation. It can be highlighted that this present study allows the mineralization of PNP with a low amount of catalysts and H2O2.
For a more complete comparison, the commercial Evonik P25 TiO2 photocatalyst, which is the reference in photocatalysis, was tested in the photocatalytic reactor of this study at a classical concentration of 0.25 g/L with no H2O2. The results are also presented in Table 3. The degradation of PNP reaches 25% after 2 h, which also corresponds to mineralization. So, with the Ag400 + H2O2 system, it is possible to nearly double the PNP degradation obtained with P25, showing the great potential of this system.

3. Materials and Methods

3.1. Silver Nanoparticle Photocatalysts Synthesis

The Ag colloids are produced from silver nitrate (AgNO3, ACS reagent, ≥99.0%, Sigma-Aldrich) and a reduction with sodium borohydride (NaBH4, fine granular for synthesis, Merck). The procedure is as follows: the corresponding metallic salt is dissolved in 800 mL of milli-Q water to a concentration of 0.2 × 10⁻³ M. Then, 25 mL of 200, 400, or 800 mg of tri-sodium citrate dihydrate (Na3C6H5O7·2H2O, ACS, for analysis, Merck) is added. After 5 min under stirring, 60 mL of ultrapure water containing 30 mg of sodium borohydride is added to the solution. The formation of the colloid is characterized by a change in the color of the solution from transparent to yellow-orange. This synthesis method is adapted from the Turkevich method [46]. The three colloids are called AgX, being X the amount of citrate used (either 200, 400, or 800).
In order to characterize the Ag colloids by X-ray diffraction, the Ag nanoparticles are deposited on a carbon xerogel obtained from [58]. A total of 250 mg of carbon xerogel powder is mixed with the Ag colloid for 48 h. Then, the suspension is filtered, and the precipitate is washed three times using water [59]. Samples of silver nanoparticles supported on a carbon xerogel are obtained and named AgX/C, where X denotes the amount of citrate.

3.2. Material Characterizations

The crystallographic properties are observed through the X-Ray Diffraction (XRD) patterns recorded with a Bruker D8 Twin-Twin powder diffractometer using Cu-Kα radiation (Bruker, Billerica, MA, USA). The Scherrer formula (Equation (7)) is used to determine the size of the Ag crystallites (i.e., dXRD) [60]:
d X R D = 0.9 λ ( B cos ( θ ) )
where dXRD is the crystallite size of Ag (nm), B is the full peak width at half maximum after correction of the instrumental broadening (rad), λ is the wavelength (nm), and θ is the Bragg angle (rad).
The Ag colloids are measured by UV/visible spectroscopy (Genesys 150 UV-VIS from Thermo Scientific, Waltham, MA, USA) to locate their absorption peak.
In the sol, the sizes of Ag aggregates are estimated by dynamic light scattering (DLS) in a DelsaNano C device from Beckman Coulter (Brea, CA, USA). This measurement gives the hydrodynamic diameter of the aggregates [61].
The sizes of Ag nanoparticles are estimated from transmission electron microscopy (TEM) with a Tecnai G2 TWIN device from FEI (Hillsborough, OR, USA) with measurements of around one hundred particles.

3.3. Photocatalytic Experiments

The degradation of p-nitrophenol (PNP) is studied under UV/visible light (λ between 300 and 800 nm) in the presence of H2O2 and Ag nanoparticles (Ag NPs). A halogen lamp is used (300 W, 220 V) for irradiation.
Each sample is placed in a glass tube with 10 mL of 10−4 M of PNP solution in water, 0.01 M of H2O2, and 0.5 10−5 M of Ag colloid sample (0.54 mg of Ag NPs per tube). The tubes are placed around the lamp in a double envelop reactor maintained at 20 °C; the suspension in the tube is mixed by magnetic stirring. The degradation of PNP is evaluated from absorbance measurements using a Genesys 150S UV-Vis spectrophotometer (Thermo Scientific) at λ = 317 nm, and the spectrum is always recorded between 250 and 550 nm to follow the PNP degradation and ensure the position of the peak. An example of spectrum is given in Figure 8. To assess that complete mineralization of PNP occurs when measuring the degradation with UV/visible spectroscopy, the samples of the photocatalytic experiments are measured using a total organic carbon analyzer (TOC-L CPN from Shimadzu, Kyoto, Japan).
First, tests are performed in the dark (dark tests) to show whether PNP is degraded with H2O2 and/or adsorbed by the surface of Ag nanoparticles. A blank test, consisting in irradiating the pollutant solution for 24 h without any catalyst nor H2O2, shows that PNP concentrations under UV/visible illumination remained constant. The test tubes with the colloids, H2O2, and pollutants are constantly stirred and irradiated for 4 h. Aliquots of PNP are sampled at 0, 2, and 4 h. Each photocatalytic measurement is triplicated to assess reproducibility of the data.

3.4. Recycling Experiments

In order to assess the stability of the Ag photocatalytic activity, recycling experiments are performed on Ag200 and Ag400 samples. These tests consist of doing successive photocatalytic experiments on the samples with centrifugation and washing steps in between; ultrasonic bath is used to resuspend the Ag NPs. After 4 h of the photocatalytic test described in Section 3.3 (after 4 h, all the PNP is completely degraded), the catalysts are recovered by centrifugation (15,000 rpm for 20 min). Then, the same test is executed again for another 4 h. This recycling is made 10 successive times, corresponding to 40 h of total irradiation. After the 10 experiments, the two samples are observed by TEM. The volume of solution (300 mL) used is bigger this time to have more Ag NPs and to be sure to recover them with the washing step.

4. Conclusions

In this paper, Ag nanoparticles (Ag NPs) are produced from the chemical reduction of silver nitrate salt by sodium borohydride. Three Ag colloids are synthesized in water by varying the amount of citrate added in the synthesis (200, 400, and 800 mg of citrate). The citrate molecule can play the role of a capping but also a reducing agent. These colloids are characterized and then used as photocatalysts to increase the decomposition of H2O2 into hydroxyl radicals in order to degrade p-nitrophenol pollutants in water under UV/visible irradiation.
The results show the production of spherical and hexagonal/rod-like Ag nanoparticles with a size varying between 20 and 50 nm for the different samples, as observed in the TEM pictures. The metallic state of silver is confirmed on XRD patterns with a face-centered cubic (fcc) structure for the three samples. The UV/visible spectra of the colloids show a maximum peak absorption between 390 and 396 nm for the three samples. When the amount of citrate is lower or equal to 400 mg, the absorption peak is narrow, while for a citrate quantity of 800 mg, a broader absorption peak of lower intensity is observed. DLS measurements show that an increase in the citrate concentration leads to higher Ag aggregates in water suspension. The increase in citrate concentration between the three samples leads to a decrease in pH, which influence the size and distribution of the Ag NPs.
Therefore, the increase in citrate concentration in the synthesis leads to the formation of broader distribution, hexagonal/rod-like shape, and bigger Ag nanoparticles. There is an evolution from 20 nm spherical Ag NPs to 50 nm rod-like Ag NPs from sample Ag200 to Ag800, with sample Ag400 being intermediate between the other two in terms of shape and size.
These Ag nanoparticles are then used together with H2O2 to degrade an organic pollutant, the p-nitrophenol (PNP), under UV/visible illumination. Indeed, H2O2 is decomposed into hydroxyl radicals when exposed to UV/visible light, which degrades the PNP. When Ag nanoparticles are added, it enhances the production of hydroxyl radicals thanks to electron transfer from the Ag nanoparticles to H2O2. These electrons are produced with the localized surface plasmon resonance (LSPR) of the Ag nanoparticles under illumination. The best sample allows to double the PNP degradation and is made of the intermediate morphology between the spherical and hexagonal/rod-like Ag NPs. Total organic carbon measurements show that the PNP is mineralized during the photocatalytic experiments.
A comparison with the literature on Ag-based photocatalysts for PNP and organic pollutant degradation shows that several parameters are different from one study to another, making it difficult to distinguish which the best are. Nevertheless, the comparison demonstrates that the present study allows the mineralization of PNP using a very low amount of Ag NPs and H2O2 when compared to other works. A dispersion of the Ag NPs developed in this work on a substrate could enhance even further the photoactivity of these promising materials.
Finally, recycling experiments have shown that the two best photocatalysts keep a constant activity even after 10 successive cycles corresponding to 40 h of irradiation.

Author Contributions

J.G.M.: conceptualization, methodology, investigation, formal analysis, funding acquisition, writing—original draft, and writing—review and editing. M.K.: investigation, formal analysis, and writing—review and editing. A.F.: investigation, formal analysis, and writing—review and editing. P.D.: methodology, writing—review and editing, funding acquisition, and project administration. All authors have read and agreed to the published version of the manuscript.

Funding

This research received no external funding.

Data Availability Statement

The raw/processed data required to reproduce these findings cannot be shared at this time as these data are part of an ongoing study.

Acknowledgments

Julien G. Mahy thanks the F.R.S.-FNRS for his Postdoctoral Researcher position. J.G.M. is grateful to the Rotary for a District 2160 grant, and to the University of Liège and the FNRS for financial support for a postdoctoral stay in INRS Centre Eau, Terre, Environnement in Québec, Canada. The authors thank Bruno Correia for his English corrections.

Conflicts of Interest

The authors declare no conflict of interest.

References

  1. Oturan, M.A.; Aaron, J.J. Advanced oxidation processes in water/wastewater treatment: Principles and applications. A review. Crit. Rev. Environ. Sci. Technol. 2014, 44, 2577–2641. [Google Scholar] [CrossRef]
  2. Mahy, J.G.; Wolfs, C.; Mertes, A.; Vreuls, C.; Drot, S.; Smeets, S.; Dircks, S.; Boergers, A.; Tuerk, J.; Lambert, S.D. Advanced photocatalytic oxidation processes for micropollutant elimination from municipal and industrial water. J. Environ. Manag. 2019, 250, 109561. [Google Scholar] [CrossRef]
  3. Mahy, J.G.; Lejeune, L.; Haynes, T.; Body, N.; de Kreijger, S.; Elias, B.; Marcilli, R.H.M.; Fustin, C.A.; Hermans, S. Crystalline ZnO Photocatalysts Prepared at Ambient Temperature: Influence of Morphology on p-Nitrophenol Degradation in Water. Catalysts 2021, 11, 1182. [Google Scholar] [CrossRef]
  4. Douven, S.; Mahy, J.G.; Wolfs, C.; Reyserhove, C.; Poelman, D.; Devred, F.; Gaigneaux, E.M.; Lambert, S.D. Efficient N, Fe Co-Doped TiO2 Active under Cost-Effective Visible LED Light: From Powders to Films. Catalysts 2020, 10, 547. [Google Scholar] [CrossRef]
  5. Bodson, C.J.; Heinrichs, B.; Tasseroul, L.; Bied, C.; Mahy, J.G.; Man, M.W.C.; Lambert, S.D. Efficient P- and Ag-Doped Titania for the Photocatalytic Degradation of Waste Water Organic Pollutants. J. Alloys Compd. 2016, 682, 144–153. [Google Scholar] [CrossRef]
  6. Mahy, J.G.; Deschamps, F.; Collard, V.; Jérôme, C.; Bartlett, J.; Lambert, S.D.; Heinrichs, B. Acid Acting as Redispersing Agent to Form Stable Colloids from Photoactive Crystalline Aqueous Sol–Gel TiO2 Powder. J. Solgel Sci. Technol. 2018, 87, 568–583. [Google Scholar] [CrossRef]
  7. Mahy, J.G.; Tilkin, R.G.; Douven, S.; Lambert, S.D. TiO2 Nanocrystallites Photocatalysts Modified with Metallic Species: Comparison between Cu and Pt Doping. Surf. Interfaces 2019, 17, 100366. [Google Scholar] [CrossRef]
  8. Pignatello, J.J.; Oliveros, E.; MacKay, A. Advanced Oxidation Processes for Organic Contaminant Destruction Based on the Fenton Reaction and Related Chemistry. Crit. Rev. Environ. Sci. Technol. 2006, 36, 1–84. [Google Scholar] [CrossRef]
  9. Issaka, E.; AMU-Darko, J.N.O.; Yakubu, S.; Fapohunda, F.O.; Ali, N.; Bilal, M. Advanced Catalytic Ozonation for Degradation of Pharmaceutical Pollutants―A Review. Chemosphere 2022, 289, 133208. [Google Scholar] [CrossRef]
  10. Mahy, J.G.; Tasseroul, L.; Zubiaur, A.; Geens, J.; Brisbois, M.; Herlitschke, M.; Hermann, R.; Heinrichs, B.; Lambert, S.D. Highly Dispersed Iron Xerogel Catalysts for P-Nitrophenol Degradation by Photo-Fenton Effects. Microporous Mesoporous Mater. 2014, 197, 164–173. [Google Scholar] [CrossRef]
  11. Hu, Z.; Cai, J.; Song, G.; Tian, Y.; Zhou, M. Anodic Oxidation of Organic Pollutants: Anode Fabrication, Process Hybrid and Environmental Applications. Curr. Opin. Electrochem. 2021, 26, 100659. [Google Scholar] [CrossRef]
  12. Drogui, P.; Blais, J.-F.; Mercier, G. Review of Electrochemical Technologies for Environmental Applications. Recent. Pat. Eng. 2007, 1, 257–272. [Google Scholar] [CrossRef]
  13. Bokare, A.D.; Choi, W.J. Review of Iron-Free Fenton-like Systems for Activating H2O2 in Advanced Oxidation Processes. Hazard. Mater. 2014, 275, 121–135. [Google Scholar] [CrossRef]
  14. Guitaya, L.; Drogui, P.; Blais, J.F. In Situ Reactive Oxygen Species Production for Tertiary Wastewater Treatment. Environ. Sci. Pollut. Res. 2015, 22, 7025–7036. [Google Scholar] [CrossRef] [PubMed]
  15. Drogui, P.; Elmaleh, S.; Rumeau, M.; Bernard, C.; Rambaud, A. Hydrogen Peroxide Production by Water Electrolysis: Application to Disinfection. J. Appl. Electrochem. 2001, 31, 877–882. [Google Scholar] [CrossRef]
  16. Song, H.; Zhang, H.; Sun, Z.; Ren, Z.; Yang, X.; Wang, Q. Triangular Silver Nanoparticle U-Bent Fiber Sensor Based on Localized Surface Plasmon Resonance. AIP Adv. 2019, 9, 085307. [Google Scholar] [CrossRef]
  17. Chen, J.; Shi, S.; Su, R.; Qi, W.; Huang, R.; Wang, M.; Wang, L.; He, Z. Optimization and Application of Reflective LSPR Optical Fiber Biosensors Based on Silver Nanoparticles. Sensors 2015, 15, 12205–12217. [Google Scholar] [CrossRef] [PubMed]
  18. Rithesh Raj, D.; Prasanth, S.; Vineeshkumar, T.V.; Sudarsanakumar, C. Ammonia Sensing Properties of Tapered Plastic Optical Fiber Coated with Silver Nanoparticles/PVP/PVA Hybrid. Opt. Commun. 2015, 340, 86–92. [Google Scholar] [CrossRef]
  19. Amri, F.; Kasim, W.; Rochliadi, A.; Patah, A. Facile One-Pot Microwave-Assisted Synthesis of Rod-like and Hexagonal Plate-like AgNP@Ni-BTC Composites for a Potential Salivary Glucose Sensor. Sens. Actuators Rep. 2023, 5, 100141. [Google Scholar] [CrossRef]
  20. Zhang, Y.; Yang, Z.; Zou, Y.; Farooq, S.; Li, Y.; Zhang, H. Novel Ag-Coated Nanofibers Prepared by Electrospraying as a SERS Platform for Ultrasensitive and Selective Detection of Nitrite in Food. Food Chem. 2023, 412, 135563. [Google Scholar] [CrossRef]
  21. Hu, G.; Jin, W.; Chen, Q.; Cai, Y.; Zhu, Q.; Zhang, W. Antibacterial Activity of Silver Nanoparticles with Different Morphologies as Well as Their Possible Antibacterial Mechanism. Appl. Phys. A Mater. Sci. Process. 2016, 122, 874. [Google Scholar] [CrossRef]
  22. Abou Elez, R.M.M.; Attia, A.S.A.; Tolba, H.M.N.; Anter, R.G.A.; Elsohaby, I. Molecular Identification and Antiprotozoal Activity of Silver Nanoparticles on Viability of Cryptosporidium Parvum Isolated from Pigeons, Pigeon Fanciers and Water. Sci. Rep. 2023, 13, 3109. [Google Scholar] [CrossRef] [PubMed]
  23. Pan, L.; Li, L.; Chen, Y. Synthesis of Ag/Cu 2O Hybrids and Their Photocatalytic Degradation Treatment of p-Nitrophenol. Micro Nano Lett. 2011, 6, 1019–1022. [Google Scholar] [CrossRef]
  24. Zhu, C.; Zheng, J.; Fang, L.; Hu, P.; Liu, Y.; Cao, X.; Wu, M.J. Advanced Visible-Light Driven Photocatalyst with Enhanced Charge Separation Fabricated by Facile Deposition of Ag3PO4 Nanoparticles on Graphene-like h-BN Nanosheets. Mol. Catal. A Chem. 2016, 424, 135–144. [Google Scholar] [CrossRef]
  25. Truong, T.K.; Nguyen, T.Q.; La, H.P.P.; Le, H.V.; Van Man, T.; Cao, T.M.; Van Pham, V. Insight into the Degradation of P-Nitrophenol by Visible-Light-Induced Activation of Peroxymonosulfate over Ag/ZnO Heterojunction. Chemosphere 2021, 268, 129291. [Google Scholar] [CrossRef] [PubMed]
  26. Dinari, M.; Dadkhah, F. Visible Light Photodegradation of 4-Nitrophenol by New High-Performance and Easy Recoverable Fe3O4/Ag2O-LDH Hybrid Photocatalysts. Appl. Organomet. Chem. 2021, 35, e6355. [Google Scholar] [CrossRef]
  27. Alshorifi, F.T.; Alswat, A.A.; Mannaa, M.A.; Alotaibi, M.T.; El-Bahy, S.M.; Salama, R.S. Facile and Green Synthesis of Silver Quantum Dots Immobilized onto a Polymeric CTS-PEO Blend for the Photocatalytic Degradation of p-Nitrophenol. ACS Omega 2021, 6, 30432–30441. [Google Scholar] [CrossRef]
  28. Kumar, M.; Reddy, G.B. Effect of Atmospheric Exposure on the Growth of Citrate-Capped Silver Nanoparticles. Physica E. Low. Dimens. Syst. Nanostruct 2010, 42, 1940–1943. [Google Scholar] [CrossRef]
  29. Lismont, M.; Páez, C.A.; Dreesen, L. One-Step Short-Time Synthesis of Ag@SiO2 Core-Shell Nanoparticles. J. Colloid. Interface Sci. 2015, 447, 40–49. [Google Scholar] [CrossRef]
  30. Dhanya, N.P. Non Linear Optical Investigations of Silver Nanoparticles Synthesised by Curcumin Reduction. Opt. Mater. 2017, 73, 384–387. [Google Scholar] [CrossRef]
  31. Majles Ara, M.H.; Dehghani, Z.; Sahraei, R.; Nabiyouni, G. Non-Linear Optical Properties of Silver Nanoparticles Prepared by Hydrogen Reduction Method. Opt. Commun. 2010, 283, 1650–1653. [Google Scholar] [CrossRef]
  32. Saeed, W.; Abbasi, Z.; Bilal, M.; Shah, S.H.; Waseem, A.; Shaikh, A.J. Interactive Behavior of Graphene Quantum Dots towards Noble Metal Surfaces. Physica E. Low. Dimens. Syst. Nanostruct 2023, 147, 115596. [Google Scholar] [CrossRef]
  33. Wijnhoven, S.W.P.; Peijnenburg, W.J.G.M.; Herberts, C.A.; Hagens, W.I.; Oomen, A.G.; Heugens, E.H.W.; Roszek, B.; Bisschops, J.; Gosens, I.; Van De Meent, D.; et al. A Review of Available Data and Knowledge Gaps in Human and Environmental Risk Assessment. Nanotoxicology 2009, 3, 109–138. [Google Scholar] [CrossRef]
  34. Jiao, J.; Wan, J.; Ma, Y.; Wang, Y. Enhanced Photocatalytic Activity of AgNPs-in-CNTs with Hydrogen Peroxide under Visible Light Irradiation. Environ. Sci. Pollut. Res. 2019, 26, 26389–26396. [Google Scholar] [CrossRef] [PubMed]
  35. Bulavinets, T.; Varyshchuk, V.; Yaremchuk, I.; Bobitski, Y. Design and Synthesis of Silver Nanoparticles with Different Shapes Under the Influence of Photon Flows. In Springer Proceedings in Physics; Fesenko, A., Yatsenko, L., Eds.; Springer Science and Business Media, LLC: Berlin/Heidelberg, Germany, 2018; pp. 231–241. [Google Scholar] [CrossRef]
  36. Koohpeima, F.; Mokhtari, M.J.; Khalafi, S. The Effect of Silver Nanoparticles on Composite Shear Bond Strength to Dentin with Different Adhesion Protocols. J. Appl. Oral. Sci. 2017, 25, 367–373. [Google Scholar] [CrossRef]
  37. Van Cleve, T.; Gibara, E.; Linic, S. Electrochemical Oxygen Reduction Reaction on Ag Nanoparticles of Different Shapes. ChemCatChem 2016, 8, 256–261. [Google Scholar] [CrossRef]
  38. Wasilewska, A.; Klekotka, U.; Zambrzycka, M.; Zambrowski, G.; Święcicka, I.; Kalska-Szostko, B. Physico-Chemical Properties and Antimicrobial Activity of Silver Nanoparticles Fabricated by Green Synthesis. Food Chem. 2023, 400, 133960. [Google Scholar] [CrossRef]
  39. Alnayli, R.S.; Alkazaali, H. Properties Studies of Silver Nanoparticles Colloids in Ethanol Prepared by Means Pulses Laser. J. Nano Res. 2019, 60, 154–161. [Google Scholar] [CrossRef]
  40. Manikandan, D.B.; Sridhar, A.; Sekar, R.K.; Perumalsamy, B.; Veeran, S.; Arumugam, M.; Karuppaiah, P.; Ramasamy, T. Green Fabrication, Characterization of Silver Nanoparticles Using Aqueous Leaf Extract of Ocimum Americanum (Hoary Basil) and Investigation of Its in Vitro Antibacterial, Antioxidant, Anticancer and Photocatalytic Reduction. J. Environ. Chem. Eng. 2021, 9, 104845. [Google Scholar] [CrossRef]
  41. Rahman, A.U.; Khan, A.U.; Yuan, Q.; Wei, Y.; Ahmad, A.; Ullah, S.; Khan, Z.U.H.; Shams, S.; Tariq, M.; Ahma, W.D. Tuber Extract of Arisaema Flavum Eco-Benignly and Effectively Synthesize Silver Nanoparticles: Photocatalytic and Antibacterial Response against Multidrug Resistant Engineered E. Coli QH4. J. Photochem. Photobiol. B. 2019, 193, 31–38. [Google Scholar] [CrossRef] [PubMed]
  42. Samuel, M.S.; Jose, S.; Selvarajan, E.; Mathimani, T.; Pugazhendhi, A. Biosynthesized Silver Nanoparticles Using Bacillus Amyloliquefaciens; Application for Cytotoxicity Effect on A549 Cell Line and Photocatalytic Degradation of p-Nitrophenol. J. Photochem. Photobiol. B. 2020, 202, 111642. [Google Scholar] [CrossRef] [PubMed]
  43. Alqadi, M.K.; Noqtah, O.A.A.; Alzoubi, F.Y.; Alzouby, J.; Aljarrah, K. PH Effect on the Aggregation of Silver Nanoparticles Synthesized by Chemical Reduction. Mater. Sci. Pol. 2014, 32, 107–111. [Google Scholar] [CrossRef]
  44. El-Naka, M.A.; El-Dissouky, A.; Ali, G.Y.; Ebrahim, S.; Shokry, A. Garlic Capped Silver Nanoparticles for Rapid Detection of Cholesterol. Talanta 2023, 253, 123908. [Google Scholar] [CrossRef]
  45. Pasqualeti, A.M.; Olu, P.-Y.; Chatenet, M.; Lima, F.H.B. Borohydride Electrooxidation on Carbon-Supported Noble Metal Nanoparticles: Insights into Hydrogen and Hydroxyborane Formation. ACS Catal. 2015, 2778–2787. [Google Scholar] [CrossRef]
  46. Turkevich, J.; Stevenson, P.C.; Hillier, J. A Study of the Nucleation and Growth Processes in the Synthesis of Colloidal Gold. Discuss. Faraday Soc. 1951, 11, 55–75. [Google Scholar] [CrossRef]
  47. Niir Project Consultancy Services. Manufacturing of Sodium Borohydride (Sodium Tetrahydridoborate) Using Trimethyl Borate: Most Demanding Profitable Business Idea in Chemical Industry. 2020. Available online: https://www.niir.org/blog/wp-content/uploads/2020/09/Manufacturing-of-Sodium-Borohydride-.pdf. (accessed on 20 March 2023).
  48. Tasseroul, L.; Pirard, S.L.; Lambert, S.D.; Páez, C.A.; Poelman, D.; Pirard, J.P.; Heinrichs, B. Kinetic Study of P-Nitrophenol Photodegradation with Modified TiO2 Xerogels. Chem. Eng. J. 2012, 191, 441–450. [Google Scholar] [CrossRef]
  49. Darweesh, R.S.; Ayoub, N.M.; Nazzal, S. Gold Nanoparticles and Angiogenesis: Molecular Mechanisms and Biomedical Applications. Int. J. Nanomedicine 2019, 14, 7643–7663. [Google Scholar] [CrossRef] [PubMed]
  50. El-morsi, T.M.; Emara, M.M.; Abd, H.M.H.; Bary, E.; Abd-el-aziz, A.S.; Friesen, K.J. Homogeneous Degradation of 1,2,9,10-Tetrachlorodecane in Aqueous Solutions Using Hydrogen Peroxide, Iron and UV Light. Chemosphere 2002, 47, 343–348. [Google Scholar] [CrossRef] [PubMed]
  51. Espinosa, J.C.; Navalõn, S.; Álvaro, M.; García, H. Silver Nanoparticles Supported on Diamond Nanoparticles as a Highly Efficient Photocatalyst for the Fenton Reaction under Natural Sunlight Irradiation. ChemCatChem 2015, 7, 2682–2688. [Google Scholar] [CrossRef]
  52. Uma, K.; Arjun, N.; Pan, G.T.; Yang, T.C.K. The Photodeposition of Surface Plasmon Ag Metal on SiO2@α-Fe2O3 Nanocomposites Sphere for Enhancement of the Photo-Fenton Behavior. Appl. Surf. Sci. 2017, 425, 377–383. [Google Scholar] [CrossRef]
  53. Saratale, G.D.; Saratale, R.G.; Cho, S.K.; Ghodake, G.; Bharagava, R.N.; Park, Y.; Mulla, S.I.; Kim, D.S.; Kadam, A.; Nair, S.; et al. Investigation of Photocatalytic Degradation of Reactive Textile Dyes by Portulaca Oleracea-Functionalized Silver Nanocomposites and Exploration of Their Antibacterial and Antidiabetic Potentials. J. Alloys Compd. 2020, 833, 155083. [Google Scholar] [CrossRef]
  54. Yue, R.; Raisi, B.; Rahmatinejad, J.; Ye, Z.; Barbeau, B.; Rahaman, M.S. A Photo-Fenton Nanocomposite Ultrafiltration Membrane for Enhanced Dye Removal with Self-Cleaning Properties. J. Colloid. Interface Sci. 2021, 604, 458–468. [Google Scholar] [CrossRef]
  55. Wang, L.; Yang, H.; Kang, L.; Wu, M.; Yang, Y. Highly Dispersed of Ag/AgCl Nanoparticles on Exfoliated FeOCl Nanosheets as Photo-Fenton Catalysts for Pollutants Degradation via Accelerating Fe(II)/Fe(III) Cycle. Chemosphere 2022, 296, 134039. [Google Scholar] [CrossRef]
  56. Wang, T.; Lang, J.; Zhao, Y.; Su, Y.; Zhao, Y.; Wang, X. Simultaneous Doping and Heterojunction of Silver on Na2Ta2O6 Nanoparticles for Visible Light Driven Photocatalysis: The Relationship between Tunable Optical Absorption, Defect Chemistry and Photocatalytic Activity. CrystEngComm 2015, 17, 6651–6660. [Google Scholar] [CrossRef]
  57. Jeong, H.; Lee, J. Ag/AgCl Nanoparticles Embedded in Porous TiO2: Defect Formation Triggered by Light Irradiation. New. J. Chem. 2021, 45, 11160–11166. [Google Scholar] [CrossRef]
  58. Zubiaur, A.; Chatenet, M.; Maillard, F.; Lambert, S.D.; Pirard, J.-P.; Job, N. Using the Multiple SEA Method to Synthesize Pt/Carbon Xerogel Electrocatalysts for PEMFC Applications. Fuel Cells 2014, 14, 343–349. [Google Scholar] [CrossRef]
  59. Mahy, J.G.; Lambert, S.D.; Léonard, G.L.-M.; Zubiaur, A.; Olu, P.-Y.; Mahmoud, A.; Boschini, F.; Heinrichs, B. Towards a Large Scale Aqueous Sol-Gel Synthesis of Doped TiO2: Study of Various Metallic Dopings for the Photocatalytic Degradation of p-Nitrophenol. J. Photochem. Photobiol. A Chem. 2016, 329, 189–202. [Google Scholar] [CrossRef]
  60. Sing, K.S.W.; Rouquerol, J. 3 Characterization of Solid Catalysts. Handb. Heterog. Catal. 1997, 438, 428–582. [Google Scholar] [CrossRef]
  61. Chu, B. Dynamic Light Scattering, In Soft Matter Characterization; Springer: Cham, The Netherlands, 2008; pp. 335–372. [Google Scholar]
Figure 1. Macroscopic aspect of (a) Ag200, (b) Ag400, and (c) Ag800 colloids after synthesis. The nanoparticles are dispersed in water.
Catalysts 13 00842 g001
Figure 2. XRD patterns of (●) Ag200/C, (▲) Ag400/C, and (■) Ag800/C samples. Peaks are assigned to diffraction from the (111), (200), and (220) planes of silver as a face-centered cubic (fcc) structure (JCPDS n° 4-0783).
Catalysts 13 00842 g002
Figure 3. TEM micrographs of (a) Ag200, (b) Ag400, and (c) Ag800 samples at the same magnification.
Catalysts 13 00842 g003
Figure 4. UV/visible spectra of (●) Ag200, (▲) Ag400, and (■) Ag800 samples between 250 and 800 nm. The maximum peak values occur at 396, 390, and 390 nm for Ag200, Ag400, and Ag800 samples, respectively.
Catalysts 13 00842 g004
Figure 5. PNP degradation under UV/visible light after 2 h of illumination for PNP alone, Ag NPs (same result for the 3 samples, no degradation), H2O2 (0.01 M), and the three Ag NP samples with H2O2; the mass of Ag NPs photocatalyst is 0.54 mg for each sample where present. The other conditions (without light) present no degradation.
Catalysts 13 00842 g005
Figure 6. Mean PNP degradation under UV/visible light with H2O2 for 10 successive photocatalytic tests (40 h of illumination); the mean values correspond to the mean PNP degradation values measured after 2 h of degradation in each of the 10 experiments.
Catalysts 13 00842 g006
Figure 7. TEM micrographs of (a) Ag200 and (b) Ag400 samples after 10 successive photocatalytic tests (40 h of illumination).
Catalysts 13 00842 g007
Figure 8. UV/visible spectrum of aqueous PNP solution of 10−4 M. The maximum peak value is obtained at 317 nm.
Catalysts 13 00842 g008
Table 1. Ag nanoparticle sizes measured by DLS, TEM, and XRD.
SampleDDLScumulant
(nm)
DDLSintensity
(nm)
DDLSnumber
(nm)
DDLSvolume
(nm)
P.I.
(−)
dTEM
(nm)
dXRD
(nm)
Ag20058 ± 8103 ± 7512 ± 418 ± 110.35721 ± 325 ± 5
Ag40072 ± 3150 ± 10020 ± 629 ± 150.35930 ± 328 ± 5
Ag80085 ± 3157 ± 13825 ± 936 ± 210.44945 ± 653 ± 5
DDLScumulant = Ag aggregate hydrodynamic diameter measured by cumulant analysis; DDLSintensity = Ag aggregate hydrodynamic diameter measured from intensity distribution; DDLSnumber = Ag aggregate hydrodynamic diameter measured from number distribution; DDLSvolume = Ag aggregate hydrodynamic diameter measured from volume distribution; P.I. = polydispersity index from DLS measurements; dTEM = Ag nanoparticle size measured by TEM; and dXRD = Ag crystallite size measured by XRD thanks to the Scherrer formula.
Table 2. Total organic carbon (TOC) measurements after photocatalytic experiments (2 h of illumination) compared to the PNP degradation measured by UV/visible spectroscopy.
Photocatalytic Experiments after 2 h of Illumination with H2O2Remaining Organic Carbon by TOC Measurements (%)
±1
PNP Degradation Measured by UV/Visible Spectroscopy (%)
±3
Remaining PNP from UV/Visible Spectroscopy (%)
±3
With H2O2 only822080
With Ag200 643565
With Ag400554654
With Ag800732575
The remaining organic carbon was calculated from the TOC measurement before and after the catalytic experiment = T O C f i n a l T O C i n i t i a l × 100 .
Table 3. Literature comparison of silver-based photocatalysts for organic pollutant degradation.
ReferencePhotocatalyst (Best Composition)Photocatalytic Experiment ConditionsMain Results
Present study
  • Pure Ag NPs
  • UV/visible light
  • PNP (14 mg/L in 10 mL)
  • H2O2 (0.01 M)
  • Photocatalyst mass of 0.54 mg
  • Degradation of 45% after 2 h
  • Mineralization verified by TOC
Jiao et al. 2019, [34]
  • Ag NPs/CNT (35 wt% of Ag)
  • Visible light (>400 nm)
  • Rhodamine B (RB) (20 mg/L in 100 mL)
  • H2O2 (0.03 M)
  • Photocatalyst mass of 20 mg (~7 mg of Ag)
  • Degradation of 99% after 50 min
  • No mineralization verified by TOC
Pan et al. 2011, [23]
  • Ag/Cu2O (25 wt% of Ag)
  • Visible light
  • PNP (20 mg/L in 200 mL)
  • H2O2 (0.024 M)
  • Photocatalyst mass of 100 mg (~25 mg of Ag)
  • Degradation of 98% after 3 h
  • No mineralization verified by TOC
Zhu et al. 2016, [24]
  • Ag3PO4/ hexagonal boron nitride (h-BN) nanosheet
  • Visible light (>420 nm)
  • Methylene Blue (MB) (20 mg/L in 50 mL)
  • Mix of MB, PNP, RB, and Methyl Orange (50, 5, 20, and 10 mg/L, respectively, all mixed in 50 mL)
  • No H2O2
  • Photocatalyst mass of 50 mg
  • Degradation of 100% after 50 min with MB solution alone, with a TOC degradation of 25%, so only partial mineralization.
  • Degradation of 100% after 120 min with the pollutant mix but no mineralization verified by TOC in this case
Samuel et al., 2020 [42]
  • Pure Ag NPs
  • UV/visible light (>360 nm)
  • PNP (10 mg/L in 25 mL)
  • H2O2 (0.04 M)
  • Photocatalyst mass of 12.5 mg
  • Degradation of 100% after 20 min
  • No mineralization verified by TOC
Truong et al., 2021 [25]
  • Ag/ZnO (3 wt% of Ag)
  • Visible light (>420 nm)
  • PNP (30 mg/L in 100 mL)
  • Peroxymonosulfate (PMS) (0.004 M)
  • Photocatalyst mass of 50 mg (~1.5 mg of Ag)
  • Degradation of 100% after 90 min
  • No mineralization verified by TOC
Dinari et al., 2021 [26]
  • Fe3O4/Ag2O (5 wt% of Ag)
  • Visible light
  • PNP (10 mg/L in 100 mL)
  • No H2O2
  • Photocatalyst mass of 250 mg (~12.5 mg of Ag)
  • Degradation of 93% after 180 min
  • No mineralization verified by TOC
Alshorifi et al., 2021 [27]
  • Ag/Chitosan + polyethylene oxide (12 wt% of Ag)
  • Sunlight (UV/visible)
  • PNP (10 mg/L in 500 mL)
  • No H2O2
  • Photocatalyst mass of 60 mg (~7.2 mg of Ag)
  • Degradation of 91% after 180 min
  • No mineralization verified by TOC
Manikandan et al., 2021 [40]
  • Pure Ag NPs
  • UV light (365 nm) and sunlight (UV/visible)
  • Eosin yellow (EY) (66 mg/L in 150 µL)
  • Rhodamine 123 (R123) (66 mg/L in 150 µL)
  • No H2O2
  • Photocatalyst mass of 0.05 mg (0.33 mg/mL in 150 µL)
  • Under UV, EY, and R123, degradation of 91% and 75% after 180 min
  • Under sunlight, EY and R123 degradation of 37% and 29% after 180 min
  • No mineralization verified by TOC
Rahman et al., 2019 [41]
  • Pure Ag NPs
  • Visible light
  • MB (10 mg/L in 20 mL)
  • No H2O2
  • Photocatalyst mass of 8 mg
  • Degradation of 87% after 20 min
  • No mineralization verified by TOC
Evonik P25 tested in this study
  • TiO2 (80% anatase/20% rutile)
  • UV/visible light
  • PNP (14 mg/L in 10 mL)
  • No H2O2
  • Photocatalyst mass of 2.5 mg
  • Degradation of 25% after 2 h
  • Mineralization verified by TOC
Disclaimer/Publisher’s Note: The statements, opinions and data contained in all publications are solely those of the individual author(s) and contributor(s) and not of MDPI and/or the editor(s). MDPI and/or the editor(s) disclaim responsibility for any injury to people or property resulting from any ideas, methods, instructions or products referred to in the content.

