Abstract
E. coli thioesterase ‘TesA is an important enzyme in fatty acid production. Medium-chain fatty acids (MCFAs, C6-C10) are of great interest due to their similar physicochemical properties to petroleum-based oleo-chemicals. It has been shown that wild-type ‘TesA had better selectivity for long-chain acyl substrates (≥C16), while the two mutants ‘TesAE142D/Y145G and ‘TesAM141L/E142D/Y145G had better selectivity for medium-chain acyl substrates. However, it is difficult to obtain the selectivity mechanism of substrates for proteins by traditional experimental methods. In this study, in order to obtain more MCFAs, we analyzed the binding mode of proteins (‘TesA, ‘TesAE142D/Y145G and ‘TesAM141L/E142D/Y145G) and substrates (C16/C8-N-acetylcysteamine analogs, C16/C8-SNAC), the key residues and catalytic mechanisms through molecular docking, molecular dynamics simulations and the molecular mechanics Poisson–Boltzmann surface area (MM/PBSA). The results showed that several main residues related to catalysis, including Ser10, Asn73 and His157, had a strong hydrogen bond interaction with the substrates. The mutant region (Met141-Tyr146) and loop107–113 were mainly dominated by Van der Waals contributions to the substrates. For C16-SNAC, except for ‘TesAM141L/E142D/Y145G with large conformational changes, there were strong interactions at both head and tail ends that distorted the substrate into a more favorable high-energy conformation for the catalytic reaction. For C8-SNAC, the head and tail found it difficult to bind to the enzyme at the same time due to insufficient chain length, which made the substrate binding sites more variable, so ‘TesAM141L/E142D/Y145G with better binding sites had the strongest activity, and ‘TesA had the weakest activity, conversely. In short, the matching substrate chain and binding pocket length are the key factors affecting selectivity. This will be helpful for the further improvement of thioesterases.
1. Introduction
Medium-chain fatty acids (MCFAs, C6-C10) [1] are important intermediates for bio-gasoline, industrial oleo-chemicals and therapeutic drugs [2]. They are of great interest due to their low melting points, high carbon conversion and similar physicochemical properties to petroleum-based oleo-chemicals [3,4], which are used as lubricant detergents and cosmetic oleo-chemicals, among other things [5,6,7]. E. coli thioesterases are currently considered the most suitable proteases for fatty acid production, but the microbial production of MCFAs has been hampered by the lack of high selectivity for medium-chain acyl substrates by the wild-type E. coli thioesterase ‘TesA [8].
E. coli thioesterase ‘TesA has the activity of hydrolyzing thioester bonds into fatty acids and thiols. It only has one chain containing 180 residues with parallel β-sheets in the center and several α-helices covering both sides of the β-sheets, forming an α/β/α structure with a slit above the central β-sheets, which can form a large “binding pocket”. The amino acid sequence of E. coli thioesterase ‘TesA contains five conserved sequence regions (Part I–V), as shown in Figure 1. The highest value of homology for all conserved regions has to be more than 80%. Among them, Ser10 in conserved sequence region Part I (8–12, green), Gly44 in conserved sequence region Part II (39~47, red), Asn73 in conserved sequence region Part III (70–74, blue) and Asp154 and His157 in conserved sequence region Part V (154~159, purple) are the five residues that have been shown to play key roles in catalysis [9,10]. The three residues Ser10, His157 and Asp154 together form the catalytic triad [11]. The three residues Ser10, Gly44 and Asn73 together form the oxygen anion hole of ‘TesA [12]. Each residue is more than 3.5 Å away from another, indicating that all three residues are highly polarized when the substrate is bound in the oxygen anion hole. The presence of the oxygen anion hole composed of three highly polarized residues compensates for the absence of hydrogen bonding between the catalytic residue His and the carbonyl group of the main chain. Additionally, a unique hydrogen bonding network provides stability to the active center.

Figure 1.
Cartoon representation of E. coli thioesterase ‘TesA.
The catalytic mechanism of wild-type E. coli thioesterase ‘TesA is shown in Figure S1. When the substrate enters the binding pocket, the proton in the hydroxyl group of Ser10 is transferred to the imidazole ring of His157 by forming a hydrogen bond [13,14,15]. Additionally, the charged hydroxyl oxygen atom on Ser10 nucleophilically attacks the carbonyl carbon atom on the thioester bond in the substrate, which in turn assists in the breaking of the ester bond to form the free alcohol. Then, His157 activates the water molecule to attack the carbonyl carbon atom again and eventually form the free carboxyl compound. During the whole process, the -NH- in the peptide plane of Asn73 in the oxygen anion hole can form a hydrogen bond with the carbonyl oxygen atom and thus reduce the reaction potential. Asp154 binds to His157 through hydrogen bonds or ionic bonds, which serves to stabilize the position of His157 as well as to activate the nitrogen atom on the imidazole ring [16].
In order to study the activity of E. coli thioesterase ‘TesA and its mutants, the acyl-acyl carrier protein (acyl-ACP) is commonly used as the substrate for enzymatic reactions in experiments (as shown in Figure 2c). However, in the previous molecular dynamics (MD) simulations, the protein part of ACP was often removed and only retained N-acetylcysteamine analog (SNAC), which has the same structure as the acyl thioester bond on acyl-ACP, as a structural analog of ACP for the study [17,18,19,20,21,22]. Therefore, we also used SNAC as part of the acyl substrate.
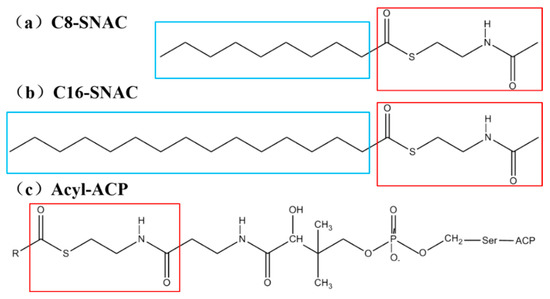
Figure 2.
The structures of the substrates commonly used in experiments and MD simulations. Compound (a) and compound (b) are the substrates octanoyl-N-acetylcysteamine analog (C8-SNAC) and hexadecanoyl acyl-N-acetylcysteamine analog (C16-SNAC) in MD simulations, respectively, and compound (c) is the substrate acyl-acyl carrier protein (Acyl-ACP) in experiments. The red rectangles are the same parts of the structures of the three compounds, representing the polar amide end. The blue rectangles represent the non-polar aliphatic chain ends containing 8 and 16 carbons, respectively.
The structures of SNACs with 8 and 16 carbons in the R group are shown in Figure 3a,b. The regions boxed in red in the figure are the structurally identical parts of the three molecules. In this study, we call the polar amide end (red box) the head and the nonpolar aliphatic chain end (blue box) the tail.
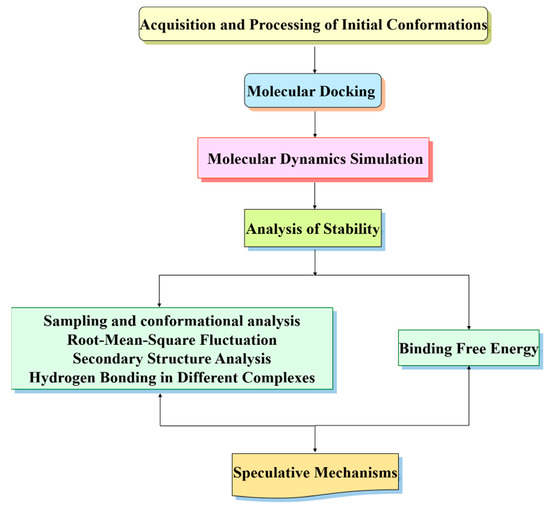
Figure 3.
Workflow diagram of the computational study.
Deng et al. [3] produced two variants of the wild-type enzyme ‘TesA by rational design, which were the double mutant ‘TesAE142D/Y145G and the triple mutant ‘TesAM141L/E142D/Y145G. E142 and Y145 located at the bottom of the substrate binding pocket have extensive interactions with the acyl chain of the long-chain substrate. The side chain of E142 pointed toward the substrate similar to Y145, which may introduce a cooperative effect to enhance selectivity for medium-chain substrates when they have mutations in E142D and Y145G. Deng et al. found that the triple mutant ‘TesAM141L/E142D/Y145G had a higher selectivity for C8-ACP than WT ‘TesA in the experiment. This can be at least partially explained by the loss of activity for the C16-ACP substrate resulting from the introduction of the M141L mutation. From the experimental results [3], it can be seen that the enzymes are more active against all long-chain substrates than against medium-chain substrates. However, for the same substrate, the order of activity is reversed for different mutants. Among them, the order of activity and selectivity of enzymes toward long-chain substrates is ‘TesA > ‘TesAE142D/Y145G > ‘TesAM141L/E142D/Y145G. Therefore, these two mutants are considered to be important for solving the problem of insufficient selectivity of ‘TesA for medium-chain substrates.
For the different selectivity between different mutants for long- and medium-chain substrates, Deng et al. conducted molecular docking calculations. Additionally, it was speculated that compared with the wild-type/the double mutant, the reason why the triple mutant catalyzed the long-chain substrate to reduce its activity was mainly because the conformational changes of the loop107-115 and loop139-145 led to changes in the substrate chain structure. However, this did not give an explanation for the difference in activity toward long-chain substrates between the wild-type and the double mutation. Additionally, they only roughly assumed that the difference in activity of the three different proteins toward the medium-chain substrate was caused by the widely increased hydrophobic forces in the binding pocket. The reason for this situation is that molecular docking cannot perform energy optimization and trajectory analysis, and the binding free energy cannot be calculated for the quantitative study of intermolecular forces. In our study, we investigated the binding patterns and key residues of two substrates, C8-SNAC and C16-SNAC, in ‘TesA, ‘TesAE142D/Y145G and ‘TesAM141L/E142D/Y145G by using various methods, such as molecular docking, MD simulations and the molecular mechanics Poisson–Boltzmann surface area (MM/PBSA) calculations. Additionally, it is speculated that the mechanism of different reactivity and selectivity in different mutants will have a profound impact on the industrial production of octanoic acid in the future.
In the following, we provide a workflow diagram (as shown in Figure 3) for researchers to use as a reference for their computational work.
2. Results and Discussion
2.1. Acquisition and Processing of Initial Conformations
In order to study the selective mechanism of wild-type E. coli thioesterase ‘TesA, the double mutant ‘TesAE142D/Y145G and the triple mutant ‘TesAM141L/E142D/Y145G for medium- and long-chain acyl substrates, we obtained the X-ray crystal structures of wild-type E. coli thioesterase ‘TesA (PDB ID: 1IVN), the double mutant ‘TesAE142D/ Y145G (PDB ID: 6LFB) and the triple mutant ‘TesAM141L/E142D/Y145G (PDB ID: 6LFC) from the Protein Data Bank (PDB, http://www.rcsb.org/pdb (accessed on 18 January 2022)) [23]. We obtained the pure wild-type ‘TesA, the double mutant ‘TesAE142D/Y145G and the triple mutant ‘TesAM141L/E142D/Y145G by removing the auxiliary crystallization compounds, equilibrium ions and crystalline water molecules. The missing residues were added by the SWISS-MODEL web server [24] (https://swissmodel.expasy.org (accessed on 7 August 2021)).
Previous studies [12] have shown that the loop75–80 (also known as the “switch loop”) has two conformations: an “open” conformation when the protein is bound to a short-chain substrate and a “closed” conformation when the substrate chain length is greater than or equal to eight carbons. The three proteins obtained from the Protein Data Bank are in the “open” conformation, and if this conformation is used as the basis for docking, the substrate cannot bind to the appropriate site. Therefore, we performed MD simulations for 20 ns for each of the three proteins. Then, we obtained the least energetic stable conformation from them as the pure protein conformation required for further studies.
To obtain reasonable initial structures of the acyl substrates, we used Gauss View 6.0.16 (Roy D. Dennington II, Todd A. Keith and John M. Millam, Wallingford, CT, USA) to construct the geometrical structures of the substrates C8-SNAC and C16-SNAC. We then used the Gaussian 09 program to optimize the bond lengths and bond angles of the geometric conformations of the acyl substrates at the B3LYP/6-31G(d) level.
2.2. Molecular Docking Results
We docked each of the proteins and two acyl substrates by using the AutoDock Vina software (Oleg Trott the Scripps Research Institute, La Jolla, CA, USA) [25,26,27,28]. We selected results with higher scores (top two) and better binding of the substrate near the key residues reported in the literature [29]. Additionally, the six complexes obtained were ‘TesA_C16-SNAC, ‘TesAE142D/Y145G_C16-SNAC, ‘TesAM141L/E142D/Y145G_C16-SNAC, ‘TesA_C8-SNAC, ‘TesAE142D/Y145G_C8-SNAC and ‘TesAM141L/E142D/Y145G_C8-SNAC. In all complexes, the heads of the substrates were all located on the side of the oxygen anion hole. The tails of long-chain substrates were all inserted between the mutant region (Met141-Tyr146) and loop107–113, while the medium-chain substrates had not yet fully reached these two regions. Regardless of the long- or medium-chain substrates, the protein conformation of the two mutants showed distinct secondary structures in the mutant region (Met141-Tyr146) compared to the wild-type ‘TesA. The mutant region in ‘TesAE142D/Y145G had a tendency to partially transform into a flexible loop, whereas the mutant region in ‘TesAM141L/E142D/Y145G formed a completely flexible loop. The docking configurations of them are shown in Figure S2.
2.3. Molecular Dynamics (MD) Simulation and Stability of the Results
After obtaining six sets of docking results, we took the six complexes as the initial conformation and used the GROMACS 2019.6 program [30,31,32,33] to perform MD simulations for 200 ns, respectively. The root mean square deviation (RMSD) values of them are shown in Figure 4. As can be seen from the figure, the RMSD values of them reached the equilibrium state after an initial rapid rise of 20 ns, and the systems remained relatively stable. The solvent accessible surface area (SASA) and radius of gyration (Rg) also indicated that the simulated systems reached stable equilibrium states, and the results are shown in Figure S3.
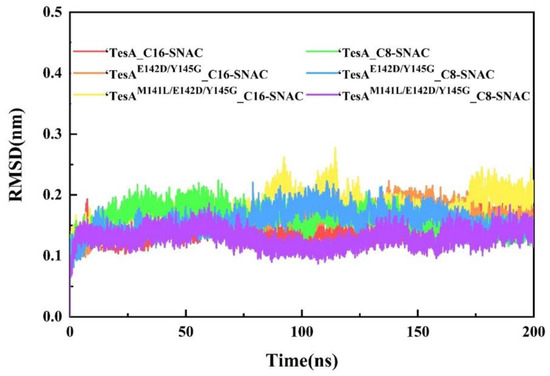
Figure 4.
Profiles of the backbone Cα atom RMSD of the six complexes as functions of time.
2.4. Sampling and Conformational Analysis
Next, we used the free-energy landscape (FEL) [34,35] to sample in the lower energy clusters for later conformational analysis. We projected the MD simulation trajectories of the conformations of the six complexes onto the first two principal components PC1 and PC2 to obtain the FEL. As shown in Figure 5, the blue part is the lower energy clusters, and the red part is the higher energy clusters. For each complex, we sampled two frames from the cluster with the lowest energy. In the later conformational analysis, we use one of the frames as the basis, but all the results obtained are corroborated in the other frame.
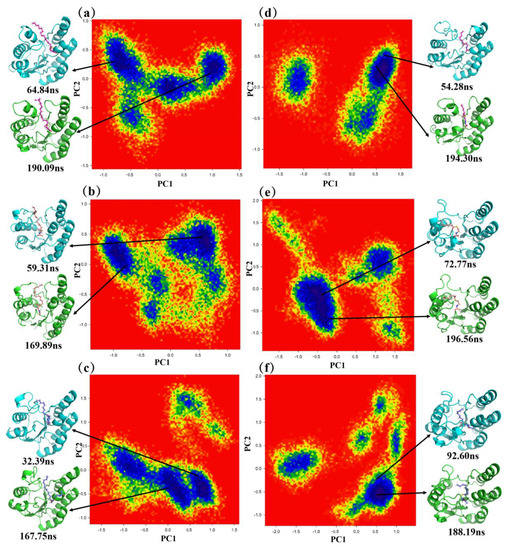
Figure 5.
Free–energy landscape analysis of the six complexes and two representative conformations in the MD simulation trajectories. The purple region has the lowest energy, and the red region has the highest energy. (a) ‘TesA_C16-SNAC, (b) ‘TesAE142D/Y145G_C16-SNAC, (c) ‘TesAM141L/E142D/Y145G_C16- SNAC, (d) ‘TesA_C8- SNAC, (e) ‘TesAE142D/Y145G_C8-SNAC, (f) ‘TesAM141L/E142D/Y145G _C8-SNAC.
The conformational analysis of the samples showed that the binding positions of the substrates in the six complexes were different, but there was no significant change compared with the initial conformations obtained by molecular docking. In all three long-chain complexes, the head of the substrates was bound near the oxygen anion hole, which was similar to the initial conformations. The tail was inserted between the mutant region (Met141-Tyr146) and loop107–113. In ‘TesA_C16-SNAC, the tail was closer to the mutant region and away from the loop107–113 region. The opposite was true in ‘TesAE142D/Y145G_C16-SNAC. In ‘TesAM141L/E142D/Y145G_C16-SNAC, the tail was farther away from both of these regions. In fact, the tail region had partially left the binding pocket and was exposed to the solvent due to the weak tail interactions and the long carbon chain of the substrate in this complex. In the three medium-chain complexes, the head binding position was similar in the long-chain complexes. In ‘TesA_C8-SNAC, the substrate as a whole was closer to loop73–80 near the oxygen anion hole, and the tail was farther away from the mutant region due to the lack of chain length. In ‘TesAE142D/Y145G_C8-SNAC, due to some conformational changes in the mutant region, it was closer to the tail of the substrate and attracted the substrate toward the mutant region. However, the distance between the mutant region and the oxygen anion hole was still longer than the length of the substrate chain, so the substrate moved slightly away from loop73–80 toward the mutant region. In ‘TesAM141L/E142D/Y145G_C8-SNAC, the conformational change in the mutant region was greater, resulting in the shorter length of the binding pocket and the closer distance between the substrate and the mutant region/loop73–80.
By using the protein–ligand interaction profiler (PLIP, https://plip-tool.biotec.tu-dresden.de/plip-web/plip/index (accessed on 18 January 2022)) procedure, we showed the hydrogen bonds and hydrophobic interactions between the protein and the substrate in the six complexes obtained by sampling in Figure 6. Figure 6a shows the interaction diagram of ‘TesA_C16-SNAC. Among them, Ser10, Leu11, Gly72, Asn73, Ile156 and His157 had hydrogen bond interactions with the substrates, and Ile107, Arg108, Leu109, Pro110, Met141, Glu142, Tyr145 and Leu146 had hydrophobic interactions with the substrates. The residues forming hydrogen bonds were mainly distributed in the oxygen anion hole and the catalytic triad regions, and the residues with hydrophobic interactions were mainly distributed in loop107–113 and the mutant regions. Figure 6b shows the interaction diagram of ‘TesAE142D/Y145G_C16-SNAC. Compared with Figure 6a, the residues that formed interactions with the substrate were significantly reduced. The interactions of ‘TesAM141L/E142D/Y145G_C16-SNAC are shown in Figure 6c. We found that the hydrophobic interaction of the substrate tail with loop107–113 and the mutant region was almost completely lost. The number of hydrogen bonds in the head was similar to that of ‘TesAE142D/Y145G_C16-SNAC.
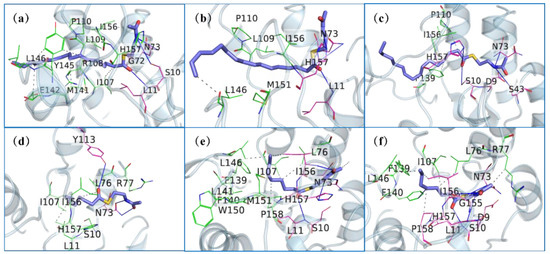
Figure 6.
Key residues of hydrogen bonds and hydrophobic interactions of the six complexes. The key residues for the formation of hydrogen bonds with the acyl substrate C8/C16-SNAC (blue-purple stick) for each of the six proteins are shown as pink lines, and bond formation is shown as solid lines. The key residues for hydrophobic interactions are shown as green lines, and bond formation is shown as dashed lines. (a) ‘TesA_C16-SNAC, (b) ‘TesAE142D/Y145G_C16-SNAC, (c) ‘TesAM141L/E142D/Y145G_C16- SNAC, (d) ‘TesA_C8- SNAC, (e) ‘TesAE142D/Y145G_C8-SNAC, (f) ‘TesAM141L/E142D/Y145G _C8-SNAC.
Figure 6d–f show the interactions of ‘TesA_C8-SNAC, ‘TesAE142D/Y145G_C8-SNAC and ‘TesAM141L/E142D/Y145G_C8-SNAC, respectively. By comparing the three complexes, we can find that there were many interactions between the oxygen anion hole, catalytic triad, loop107–113 and the mutant region with the substrate in ‘TesAE142D/Y145G_C8-SNAC and ‘TesAM141L/E142D/Y145G_C8-SNAC. The number of residues with which ‘TesA was the substrate was lower than in ‘TesAE142D/Y145G, and in particular, the mutant region had no interaction at all.
2.5. Root Mean Square Fluctuation (RMSF)
The RMSF can be used to analyze the overall fluctuation of each residue of the protein. The RMSF values of the six complexes are shown in Figure 7. Among them, Figure 7a shows the RMSF curves of the protein backbone Cα atoms in complexes of the long-chain substrate C16-SNAC with ‘TesA, ‘TesAE142D/Y145G and ‘TesAM141L/E142D/Y145G. It can be seen that loop107–113 of ‘TesA had large RMSF values relative to the two mutants, indicating that this region was more flexible. In other words, loop107–113 of ‘TesA was weakly bound by the substrate. The opposite was true in the mutant region (Met141-Tyr146), where the RMSF values of both mutants were significantly larger than those of ‘TesA, especially as the RMSF value of ‘TesAM141L/E142D/Y145G was already close to 2-fold that of ‘TesA. This was consistent with the substrate binding pattern observed in the sampled conformation. In addition, there was also significant variation in the RMSF value region. The RMSF values of ‘TesA_C16-SNAC, ‘TesAE142D/Y145G_C16-SNAC and ‘TesAM141L/E142D/Y145G_C16-SNAC increased in order in loop153-157. This indicated that the protein–substrate interactions in this region were weakened sequentially. Asp154 and His157 in the catalytic triad were located in the loop153–157 region. This may have led to a weakening of the enzyme activity due to the reduction in the interaction of the catalytic triad with the substrate.
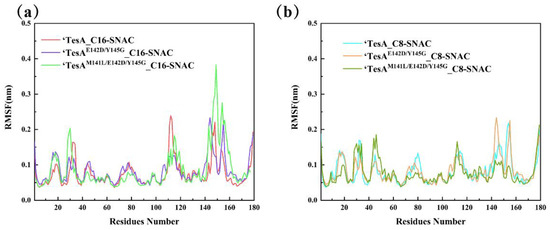
Figure 7.
RMSF curves of the Cα atoms of the six complexes during simulation. (a) RMSF curves of proteins in long-chain complexes, (b) RMSF curves of proteins in medium-chain complexes.
Figure 7b shows the RMSF curves in complexes of the medium-chain substrate C8-SNAC with the three proteins. It can be seen that the RMSF peaks of the three complexes were relatively small, but there were significant differences in loop43–46 and loop73–80 (the oxygen anion hole), loop141–146 (the mutant region) and loop153–157 (catalytic triad). The RMSF values in ‘TesAM141L/E142D/Y145G_C16-SNAC of the other three regions of the complex were lower than the others, except in loop43–46. This indicated that the oxygen anion hole, the catalytic triad and the mutant region all had strong effects on the structure of ‘TesAM141L/E142D/Y145G_C8-SNAC to make it relatively stable. Changes in protein flexibility in the above regions can be observed more visually in the visualizations of backbone flexibility (as shown in Figure S4). Principal component analysis (PCA) [36,37] can also conclude that these regions had large conformational changes affected by substrate binding during the simulation (as shown in Figure S5). We will focus on these regions in later discussion.
2.6. Secondary Structure Analysis
During the conformational observations, we found secondary structure changes in some regions. Some of the changed secondary structures contained key residues related to catalytic activity. In order to confirm whether the secondary structure changes we observed were prevalent throughout the simulation, we also performed protein secondary structure (DSSP) analysis to corroborate them. (The detailed results of the secondary structure changes of the six complexes during the MD simulations are shown in Figure S6).
In the complexes of long-chain substrates, there were three regions in which the secondary structures were significantly different in different complexes. The first was in the Asp9-Tyr15 region, where ‘TesA could basically maintain stability in the α-helix. The α-helix of both mutants easily opened and transformed into “Turn”. This region contained Ser10, a key residue in the catalytic triad, whose stable α-helix was disrupted. This may have prevented Ser10 from binding to the substrate carbonyl C atom to form a stable tetrahedral complex in ‘TesAM141L/E142D/Y145G. The second was in the Met141-Tyr146 region. ‘TesA was eventually translated into the α-helix, while “Turn” was maintained in both mutants. The mutant residue was located in this region, and it was also the main region where the substrate tail was bound to the protein. It could be that the mutation of the residue itself caused the change in the secondary structure, or the mutation of the residue caused a large change in the interaction between C16-SNAC and this region, and finally, the α-helix in the mutant was unwound. The third was in the Asp153-His157 region. All of them transformed between “Bend”, “Turn” and the β-sheet. However, the secondary structure transitions of ‘TesA and ‘TesAE142D/Y145G were lesser, while ‘TesAM141L/E142D/Y145G was greater. The instability of the secondary structure led to the instability of the hydrogen bond between Asp154 and His157 in the catalytic triad in this region, which further reduced its catalytic activity.
The regions of secondary structure change in the complexes of the three proteins with medium-chain substrates were essentially the same as in the long-chain complexes but with different changes. In the Asp9-Tyr15 region, ‘TesA underwent an unwinding of α-helix between 50 and 170 ns. ‘TesAE142D/Y145G and ‘TesAM141L/E142D/Y145G were mainly α-helix based. The reason for the lowest activity of ‘TesA in the medium-chain substrate may be related to the disruption in the secondary structures in this region. The secondary structure changes in the mutant region (Met141-Tyr146) were similar to those in the long-chain complexes, and only the α-helix was dominant in ‘TesA, but it was disrupted in the two mutants. Near the catalytic triad (Asp153-His157), in contrast to the long-chain complexes, the secondary structure of ‘TesA changed most frequently, while ‘TesAM141L/E142D/Y145G remained largely stable. The hydrogen bond between Asp154 and His157 in the catalytic triad was stable, which helped enhance the activity of the triple mutant.
2.7. Hydrogen Bonds in Different Complexes
From the previous observations of the sampled conformations, we found different hydrogen bonds present in the six complexes. In order to confirm the universality of these hydrogen bonds in the whole simulation process, we performed statistics of the hydrogen bond occupancy rate and the average number of hydrogen bonds in the simulation process (Table 1).

Table 1.
The average number of hydrogen bonds in each frame conformation and hydrogen bond occupancy rates between substrates and different residues in the six complexes during the MD simulation.
As can be seen from Table 1, in the long-chain complexes, the more frequently occurring hydrogen bonds were those formed between the head of the substrate and its nearby residues. The occurrences of hydrogen bonds of Ser10, Asn73 and His157 in ‘TesA_C16-SNAC were all high. In ‘TesAE142D/Y145G_C16-SNAC, His157 (52.2%) was higher than other residues. However, ‘TesAM141L/E142D/Y145G _C16-SNAC had a lower average number of hydrogen bonds (0.7612), and all the hydrogen bond occupancy rates were low, the highest of which was still His157 (only 21.39%). This indicated that ‘TesAM141L/E142D/Y145G had a weak hydrogen bond force with C16-SNAC. In the medium-chain complexes, the average number of hydrogen bonds was higher than that of the long-chain complexes, among which ‘TesAM141L/E142D/Y145G_C8-SNAC (1.3512) had the highest number. This may be related to the fact that both the head and tail of the substrate were close to the protein. ‘TesAE142D/Y145G_C8-SNAC had an average hydrogen bond number of 1.0448 and the highest hydrogen bond occupancy rate (85.57%) between His157 and the substrate. In ‘TesA _C8-SNAC, the hydrogen bond occupancy rate was very low, and the hydrogen bond interaction was weak in some main regions. The above hydrogen bonds are in general agreement with the results in Figure 6.
The hydrogen bonding analysis showed that in most of the complexes, hydrogen bonds with the substrates were formed mainly by the key residues related to catalysis, such as Ser10, Asn73 and His157. In particular, His157, except in ‘TesA_C8-SNAC, had one of the highest hydrogen bond occupancy rates of all the other five complexes. In ‘TesA_C8-SNAC, the hydrogen bonds formed by His157 and the substrate were hardly counted, which may be one of the reasons for the lowest activity of this complex.
2.8. Binding Free Energy Analysis
To further confirm the interactions revealed by the conformational analysis above, we calculated the molecular mechanics Poisson–Boltzmann surface area [38] (MM/PBSA) of the six complexes. The free energies of substrate binding to the whole protein in the six complexes are listed in Table 2.
Table 2.
Binding free energies and energy components calculated by MM/PBSA for the six complexes (kJ/mol).
As can be seen from Table 2, the total binding free energy (ΔGbind) order of all three long-chain and three short-chain complexes, when compared individually, was consistent with the order of activity obtained from the experiments. However, when the ΔGbind values of the six complexes were compared together, they did not correspond to the order of activity in the experiment. This indicates that there was a correlation between the interaction and the catalytic activity, but it was not the only factor. The proteins affected some reaction mechanisms through different interactions with the substrates and eventually caused the difference in activity, which we discuss in detail in the following sections. The Van der Waals interactions (ΔGvdw) of the six complexes did not correlate with the order of activity. The differences originated from the different locations of the different substrates in the different mutants, which led to some differences in the residues that generated the Van der Waals interactions as well. This is discussed in detail later in terms of the decomposition of the binding free energy. In terms of electrostatic interactions (ΔGelec), the ΔGelec values of medium-chain substrates with proteins were significantly greater than those of long-chain substrates. This was generally consistent with previous statistics on the average number of hydrogen bonds due to the fact that hydrogen bonds were major parts of the electrostatic contribution.
To further investigate the specific residues that played a key role in the protein–ligand binding process, we calculated the decomposition contribution of each residue to the free energy. (Residues with relatively large contribution values and their binding free energies are listed in detail in Table S1) We compared the intermolecular forces ΔEMM (ΔEMM = ΔGvdw + ΔGelec) of key residues in the long-chain substrate complexes and found that all four key catalytic regions in ‘TesA_C16-SNAC had residues with high binding free energy. In both mutants, the number of residues and the values of binding free energy with strong interactions were substantially decreased. The interactions of the two mutant residues in ‘TesAE142D/Y145G_C16-SNAC were significantly attenuated, which was consistent with the substrate tail away from the mutant region observed in the conformational analysis. The free energy values of the residue bound to the substrate in ‘TesAM141L/E142D/Y145G_C16-SNAC were further reduced compared to ‘TesAE142D/Y145G_C16-SNAC, and the interaction of its head region (oxygen anion hole and catalytic triad region) was still present, although weakened. In contrast, the interactions in its tail region, both in the mutant region and loop107–113, almost disappeared, which was consistent with the conformational observation that the substrate tail left the binding pocket and was partially exposed to the solvent.
Comparing the ΔEMM of the key residues in the medium-chain substrate complexes, it can be seen that ‘TesA_C8-SNAC had fewer residues with stronger interactions and weaker free energy values than the two mutants. The residues with stronger free energy contributions were mainly located in the loop73–80 (switch loop) and the catalytic triad. The interactions between the substrate and loop73–80 near the head in ‘TesAE142D/Y145G_C8-SNAC were decreased, and the interactions with the tail mutant region were enhanced, while both regions in ‘TesAM141L/E142D/Y145G_C8-SNAC had strong interactions with the substrate. In addition, the interactions in the catalytic triad were all enhanced in the two mutants.
Combined with the decomposition binding free energies in the six complexes, it was shown that the contributions of Ser10, Asn73 and His157 were significant in all complexes. Combined with the hydrogen bonding analysis, they formed more stable hydrogen bonds with the substrate and were thus mainly electrostatic contributions. In some complexes, the mutant region or loop107–113 had moderately strong interactions with the substrate, mainly dominated by Van der Waals contributions. The binding free energy was broadly consistent with the results obtained from conformational observations that there were strong interactions in regions of the protein in close proximity to the substrate.
2.9. Speculation on the Mechanism of the Differential Activity of Different Substrates
The above results were combined to analyze the possible reasons affecting the differential activity of different mutants toward different substrates.
2.9.1. High-Energy and Low-Energy Conformations of Substrates
By comparing the sampled conformations, we found that the conformations of long-chain substrates C16-SNAC in different complexes were significantly different (as shown in Figure 8). The substrates in ‘TesA_C16-SNAC and ‘TesAE142D/Y145G_C16-SNAC showed high-energy conformations, with the average distances of 3.35 Å and 3.64 Å between the S and the C4, and the average angles of 80.56° and 86.43°(∠SC2C5), respectively. There was a significant bend in this site. This conformation allowed for greater tension in the thioester bond, which made the enzymatic reaction easier.
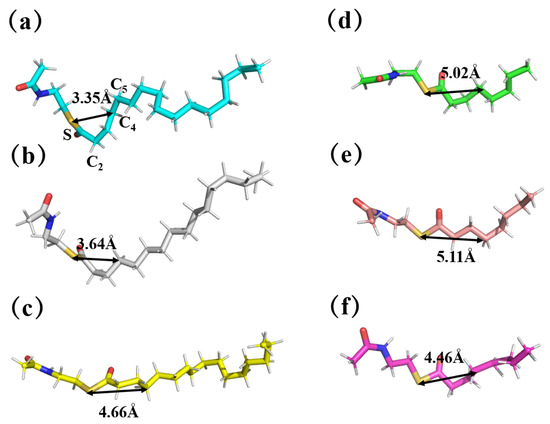
Figure 8.
Conformational comparison of substrates in different complexes. The first column shows C16-SNAC in (a) ‘TesA_C16-SNAC, (b) ‘TesAE142D/Y145G_C16-SNAC and (c) ‘TesAM141L/E142D/Y145G_C16-SNAC; the second column shows C8-SNAC in (d) ‘TesA_C8-SNAC, (e) ‘TesAE142D/Y145G_C8-SNAC and (f) ‘TesAM141L/E142D/Y145G_C8-SNAC.
The substrates in ‘TesAM141L/E142D/Y145G_C16-SNAC showed low-energy conformation with an increased average distance (4.66 Å) and angle (110.58°), and the overall substrate chain was more spread out. In the experiments, the wild-type and the double mutant with the high-energy substrate conformation had a higher reactivity than the triple mutant, probably for this reason.
For the reason that long-chain substrates formed high-energy and low-energy conformations in different long-chain enzymes, we assumed that this may be related to the different interactions experienced by the two ends of the substrate. From the previous hydrogen bond and binding free energy analysis, it was clear that in all long-chain complexes, the head ends were bound near the oxygen anion hole and the catalytic triad. Ser10, Asn73, Ile156 and His157, which had strong binding free energies with the substrate, were located in this vicinity, while at the tail ends, there were strong interactions between substrates and residues in both the wild-type and the double mutant complexes. Among them, loop107–113 and the mutant region (Met141-Tyr146) on both sides of the tail in ‘TesA_C16-SNAC interacted simultaneously. In ‘TesAE142D/Y145G_C16-SNAC, due to the mutations of Glu142 and Tyr145, the interactions between the two residues and the substrate were severely weakened. Additionally, the mutations could also lead to the partial destruction of the α-helix in the region. This also weakened the interaction of other residues in the mutant region with the substrate tail. However, loop107–113 still had a strong interaction with the tail of the substrate. However, in the triple mutant, because the Met141 residue was mutated, the α-helix of the mutant region was completely destroyed, and the interaction between the tail of the substrate and the mutant region was further weakened. In particular, there was a change in the secondary structure, which caused the opening of the active crack to become larger here. The external solvent entered the binding pocket more easily and caused the tail of the substrate to move outward and even partially leave the binding pocket to be exposed to the solvent, which made the interaction between loop107–113 and the head also more weakened. In both wild-type and the double mutant complexes, because the chain length of the substrate was longer than the binding pocket, when there were strong interactions at both the head and tail ends, the substrate chain could not stretch freely but was squeezed into a high-energy conformation. However, in the triple mutant, where the interactions between the two ends were weak, the squeezing force was not strong enough for the substrate chain to be able to stretch into a low-energy conformation.
Deng et al. also found a significant bend in long-chain substrates in the triple mutant by molecular docking. They thought that this was due to the conformational changes in loop107–115 as well as loop139–145, especially the opening of the α-helix in the latter, which exerted steric hindrance toward the ω-1 carbon of the substrates, resulting in the bending of the substrate. This was somewhat different from our speculation. First, Deng et al. suggested that the conformation of the substrate was more bent in the triple mutant. In contrast, our results showed that in the triple mutant, only in the initial phase (the initial conformation we obtained by docking was similar to the results of Deng et al.), the substrate tails were somewhat bent. As the simulation proceeded, the bending substrate gradually stretched and straightened (as shown in Figure 8), which was contrary to the results of Deng et al. Secondly, for the reason for conformational change in the substrate, we speculated that this was different from that obtained by Deng et al. They thought that the substrate was bent because a spatial site resistance perpendicular to the substrate chain was imposed on the tail, so that the tail would have stronger interactions. Additionally, we believed that the conformational change was due to a decrease in the interaction between the head and tail ends of the substrate, so that the substrate was subjected to lower tension parallel to the substrate chain, such that the tail interaction would be weaker. In addition, our binding free energy calculations are contrary to the conjecture of Deng et al. (A schematic representation of the interaction pattern can be found in Figure S7.)
Furthermore, in all the medium-chain C8-SNAC complexes with the enzyme, the substrates in ‘TesA_C8-SNAC, ‘TesAE142D/Y145G_C8-SNAC and ‘TesAM141L/E142D/Y145G_C8-SNAC all showed low-energy conformations with the average distances of 5.02 Å, 5.11 Å and 4.46 Å between the S and the C4, and the average angles of 164.32°, 175.01° and 118.86°(∠SC2C5), respectively. All of the medium-chain substrates could be stretched into a low-energy conformation because the chain of the substrate was shorter, and the length of the binding pocket was more plentiful relative to the chain length, and loop107–113 and the mutant region did not squeeze the substrate tails, thus forming a high-energy conformation. This could be the reason for the generally low activity of medium-chain substrates in the experiment.
2.9.2. Analysis of the Reasons for the Different Activities of Wild-Type E. coli Thioesterase and the Double Mutants toward Long-Chain Substrates
For ‘TesA_C16-SNAC and ‘TesAE142D/Y145G_C16-SNAC, which both formed high-energy conformations, the experiments showed that the catalytic activity of the enzymes for long-chain substrates also differed significantly. Combined with the catalytic mechanism of the enzyme, we speculate that there were three possible reasons for this.
- Effect of binding free energy: As we analyzed in previous chapters, the binding free energy of C16-SNAC with ‘TesA was stronger than that with ‘TesAE142D/Y145G (as listed in Table 2). Additionally, there were inevitably more residues present for the interaction in ‘TesA. The stronger binding free energy could help stabilize the substrate and the key catalytic residues in a position that was beneficial for the catalytic reaction. Therefore, this might have led to higher enzyme activity.
- Effect of catalytic triad: The catalytic triad had the greatest impact on the reaction activity [11]. Among them, Ser10, as the main nucleophilic attack (as shown in Figure S1), should have had a strong interaction with the thioester bond of the substrate. The analysis of the occurrence of hydrogen bonds and binding free energy above showed that Ser10 had a higher occurrence of hydrogen bonding (28.39%) and stronger binding free energy (−5.4113kJ/mol) in ‘TesA than in ‘TesAE142D/Y145G (11.19% and −1.1582 kJ/mol, respectively), which may have led to a stronger activity.
- Effect of the oxygen anion hole: The reaction mechanisms (as shown in Figure S1) showed that the strength of the binding ability between the carbonyl oxygen on the thioester bond of the substrate and the oxygen anion hole was a key factor affecting the catalytic activity [12]. From the discussion of binding free energy above, it can be seen that the interaction between Ser10, Leu11, Gly72 and Asn73 near the oxygen anion hole in ‘TesA_C16-SNAC was significantly stronger than in ‘TesAE142D/Y145G (as listed in Table S1a,b). This was confirmed by the distance between the two atoms forming a hydrogen bond (the N-atom in Asn73 and the carbonyl oxygen on the thioester bond). The average distance between these two atoms throughout the simulation was significantly shorter in ‘TesA_C16-SNAC (0.6164 nm) than in ‘TesAE142D/Y145G_C16-SNAC (0.7685 nm). The farther the distance between the thioester bond and Asn73, the weaker its activity may be.
2.9.3. Mechanistic Analysis of the Differences in Catalytic Activity of Different Mutants of the Enzyme for Medium-Chain Substrates
In all medium-chain complexes, the substrates were in low-energy conformations. The reason why the different mutants of the enzyme had different catalytic activities for the medium-chain substrate may be related to the distance between the catalytic triad and the thioester bond. As mentioned above, in the medium-chain complexes, the binding sites of the three medium-chain substrates to the enzymes showed large differences. The reason for this discrepancy was the shorter substrate chain, which did not match the binding pocket. In the wild-type and the double mutant, the head and tail ends could not form strong interactions with the enzyme at the same time. In particular, in the wild-type complex, the substrate tail was so far away from the mutant region that it could not form a stronger interaction, so its soft aliphatic tail was deflected and formed an interaction with the switch loop in the head region. Only in the triple mutant could the medium-chain substrate bind to the enzyme at both ends simultaneously due to a larger conformational change in the mutant region making the binding pocket shorter (as shown in Figure S8). The change in the binding position caused the key catalytic residues to be at different distances from the thioester bond in different enzymes. Throughout the simulation, the distances between Ser10 and the substrate thioester bonds were in the order of ‘TesA_C8-SNAC (1.3190 nm) > ‘TesAE142D/Y145G_C8-SNAC (0.8508 nm) > ‘TesAM141L/E142D/Y145G_C8-SNAC (0.7343 nm). The orders of the binding free energies of Ser10 with the substrate in the three medium-chain complexes were ‘TesA _C8-SNAC(−1.6902 kJ/mol) < ‘TesAE142D/Y145G_C8-SNAC (−7.056 kJ/mol) < ‘TesAM141L/E142D/Y145G_C8-SNAC (−7.8027 kJ/mol). The longer the distance of Ser10 from the substrate, the smaller the binding free energy and the weaker its activity may be, which was consistent with the activity order obtained in the experiments.
Similarly, the interaction between the N atom of the Asn73 peptide plane in the oxygen anion hole and the carbonyl oxygen atom in the thioester bond of the substrate may have also affected the activity. The average distances between these two atoms in the three complexes throughout the simulation were in the order of ‘TesA_C8-SNAC (1.2823 nm) > ‘TesAE142D/Y145G_C8-SNAC (0.8846 nm) > ‘TesAM141L/E142D/Y145G_C8-SNAC (0.6751 nm). The order of the binding free energy of Asn73 and the substrate was ‘TesA_C8-SNAC (−4.6137 kJ/mol) < ‘TesAE142D/Y145G_C8-SNAC (−6.5819kJ/mol) < ‘TesAM141L/E142D/Y145G_C8-SNAC (−10.0613kJ/mol).
3. Methods
3.1. Molecular Docking Calculations
We docked the proteins and acyl substrates by using the AutoDock Vina software [27,28,29,30]. The box center was adjusted to be near the active center and semi-flexibly docked to the substrate, respectively, according to the position of the key residues. Since the chain lengths of the two acyl substrates C8-SNAC and C16-SNAC were different, we set the box sizes to 42 Å × 30 Å × 38 Å and 42 Å × 42 Å × 38 Å, respectively, with the grid spacing value set to 1 Å and the maximum conformational output value set to 20 and then performed molecular docking. Finally, the molecular docking ability was scored and evaluated [39], and the most stable and suitable initial complex conformation for simulation was selected by combining the conformational rationality.
3.2. Molecular Dynamics Simulations
All MD simulations were performed using the GROMACS 2019.6 program (Emile Aplo et al., Stockholm, Sweden) [32,33,34,35], using the complexes obtained by docking as the initial conformation. We first assigned a CHARMM36 all-atom force field [40] to the protein and obtained its force field parameters, and the ligand parameters were obtained through the CHARMM general force field for organic molecules (CGenFF) server [41] (https://cgenff.umaryland.edu/initguess/ (accessed on 29 September 2021)). For the construction of the system topology, the proteins were modeled using the pdb2gmx tool and the TIP3P water model [42,43], and the ligand topology was obtained through CGenFF. The force field information of the ligands and proteins was then combined to construct a six-complex system. Then, the complexes were solventized. A cubic solvent box with a periodic boundary condition of 10 Å was set, so that the complex system was placed at the center of the aqueous solvent box; a Na+ ion was randomly added to the solvent to keep the complex system in an electrically neutral state. Prior to the MD simulation, we used the most rapid descent method to minimize the energy of the system, using 500 ps NVT equilibrium (canonical system synthesis) and 500 ps NPT equilibrium (isobaric isothermal) to maintain the system in a stable environment at 300 K, 1 bar. After the thermodynamic properties reached stability, we performed a 200 ns MD simulation in which all bonds were constrained using the LINear Constraint Solver (LINCS) algorithm, and long-range electrostatic interactions were calculated using the particle mesh Ewald (PME) method with a truncation radius of 10 Å. The finished simulation used the temperature. The temperature and pressure coupling method used in the finished simulation was consistent with the equilibrium phase; the time step was set to 2 fs, and the coordinates and energy information were saved in the simulation trajectory every 10 ps. Finally, 20,000 frames of trajectory coordinates were obtained for the following data analysis.
3.3. Binding Free Energy Calculations
The binding free energy was calculated using the molecular mechanics Poisson–Boltzmann surface area (MM/PBSA) method [44,45,46,47,48,49]. We estimated the decomposition contribution of each residue to the binding energy. In this method, the binding free energy is defined as follows:
where △Gcomplex is the total free energy of the protein–ligand complex, and △Gprotein and △Gligand are the total binding free energy of the isolated protein and ligand in the solvent, respectively. The free energy of each entity is provided by △G = △<EMM> − T△S + <△Gsol>, where <△EMM> and <△Gsol> denote the calculated vacuum-averaged molecular mechanics energy and solvation free energy, respectively.
△Gbind = △Gcomplex − [△Gprotein + △Gligand ],
△EMM = △Ebonded + △Enonbonded
△Ebonded = △Ebond + △Eangle + △Etorsion
△Gsol = △Gsol-ele + △Gsol-np
△Ebonded = △Ebond + △Eangle + △Etorsion
△Gsol = △Gsol-ele + △Gsol-np
The binding free energy (△Gbind) includes the contribution of bond lengths, bond angles and distortions to the energy. Non-bonding interactions (△Enonbonded) include electrostatic (△Eelec) interactions and Van der Waals (△EvdW) interactions.
4. Conclusions
In summary, we performed 200 ns MD simulations and MM/PBSA binding free energy calculations for six complexes formed by the wild-type ‘TesA and its mutants with substrates of different chain lengths and analyzed them in detail.
By conformational comparison, RMSF, PCA, secondary structure DSSP, hydrogen bonding and binding free energy analysis, it can be demonstrated that the increase in mutant residues caused the secondary structure of the protein mutation region to partially completely unwind from the α-helix into a flexible loop and to expand the mutation region. Affected by changes in the mutation region, the substrate tails gradually moved away from the mutation region in the long-chain complexes. In the double mutant complex, the substrate tail was close to loop107–113. In the triple mutant complex, the substrate tail even partially left the active pocket. In the medium-chain complexes, the substrate was close to the head switch loop and the tail mutation region in the wild-type and the double mutant because the substrate chain was shorter than the binding pocket. In the triple mutant, the complete unwinding of the helix in the mutant region resulted in an expansion of the range, such that the substrate chain was just the right length for the active pocket, and both ends of the substrate head and tail were in close proximity to the protein. When the substrate was used as the observation target, the substrates in ‘TesA_C16-SNAC and ‘TesAE142D/Y145G_C16-SNAC were in a more distorted high-energy conformation, and the remaining four were in a low-energy conformation. In the different complexes, the residues bound to the substrate were slightly different, but they were mainly concentrated in the oxygen anion hole (Asp9-Tyr15, Gly44-Thr46, Asn73-Gln80), the catalytic triad (Ser10, Asp154, His157), loop107–113 and the mutant region (Met141-Tyr146).
Based on the above results, we summarized the reasons for the differences in selectivity of different mutants of E. coli thioesterase for different-chain-length substrates. For long-chain substrates, their length extended beyond the binding pocket. When its head and tail had strong interactions with both the oxygen anion hole and mutant regions/loop107–113 (such as the wild-type and the double mutant), the chain was easily twisted into a more reaction-friendly high-energy conformation under the high tension. In particular, the wild-type complexes had more residues with stronger interactions, allowing their substrates to be fixed in the right position for hydrolysis to proceed. For the medium-chain substrates, the lack of chain length made it difficult for their heads and tails to bind to both the oxygen anion hole and mutant region/loop107–113. Thus, the substrate binding sites were more variable. As a result, the triple mutant with better binding sites had the strongest activity. Conversely, the activity of the wild-type complex was the weakest.
Our work will be useful in the future to improve the selectivity of thioesterase for medium-chain substrates and provide ideas for other researchers’ computational studies. More mutation sites can be identified, allowing for a larger range of mutant regions. On the one hand, this is beneficial to allow more interactions between the enzyme and the substrate tail, making the binding position of the substrate more stable. On the other hand, a shorter binding pocket might enable the medium chain substrate to be distorted into a high-energy conformation as well, which is more efficient for hydrolysis.
Supplementary Materials
The following supporting information can be downloaded at: https://www.mdpi.com/article/10.3390/catal12091026/s1, Figure S1: Catalytic mechanism of E. coli thioesterase; Figure S2: Initial docking conformation diagrams of the six complexes; Figure S3: (a) Solvent Accessible Surface Area (SASA) values for the six complexes during the 200 ns MD simulation. (b) Radius of Gyration (Rg) of the six complexes as a function of simulation time; Figure S4: Visualizations of the backbone flexibility for the six complexes; Figure S5: Cross-correlation matrix maps for the six complexes; Figure S6: Comparison the differences of the secondary structures of the six complexes; Figure S7: Schematic representation of the interaction pattern of long-chain substrate complexes; Figure S8: Schematic representation of the interaction pattern of medium -chain substrate complexes; Table S1: The decomposition energies of the important residues.
Author Contributions
Conceptualization, X.Z.; methodology, Z.L.; software, J.E. and Z.Y.; validation, J.D.; formal analysis, X.Z. and Z.Y.; investigation, X.Z. and S.G.; resources, S.W.; data curation, X.Z.; writing—original draft preparation, X.Z.; writing—review and editing, H.Z.; project administration, S.W. All authors have read and agreed to the published version of the manuscript.
Funding
This research was funded by the Jilin Province Science and Technology Development Plan, grant number 20190303056SF, 20220508114RC; the Jilin Province Youth Development Research Program, grant number 2022jqy-zs3; the Jilin Province Higher Education Research Project, grant number JGJX2022D31; the Jilin Province Science and Technology Association, Academic Projects, grant number KCZG202207; Jilin Province Social Science Foundation, grant number 2022Q3.
Data Availability Statement
Not applicable.
Conflicts of Interest
The authors declare no conflict of interest.
References
- Grootscholten, T.I.M.; Steinbusch, K.J.J.; Hamelers, H.V.M.; Buisman, C.J.N. Improving medium chain fatty acid productivity using chain elongation by reducing the hydraulic retention time in an upflow anaerobic filter. Bioresour. Technol. 2013, 136, 735–738. [Google Scholar] [CrossRef] [PubMed]
- Sarria, S.; Kruyer, N.S.; Peralta-Yahya, P. Microbial synthesis of medium-chain chemicals from renewables. Nat. Biotechnol. 2017, 35, 1158–1166. [Google Scholar] [CrossRef]
- Deng, X.; Chen, L.; Hei, M.; Liu, T.; Feng, Y.; Yang, G.-Y. Structure-guided reshaping of the acyl binding pocket of ’TesA thioesterase enhances octanoic acid production in E. coli. Metab. Eng. 2020, 61, 24–32. [Google Scholar] [CrossRef] [PubMed]
- Sheppard, M.J.; Kunjapur, A.M.; Prather, K.L.J. Modular and selective biosynthesis of gasoline-range alkanes. Metab. Eng. 2016, 33, 28–40. [Google Scholar] [CrossRef] [PubMed]
- Kourist, R. A New Class of Enzymes Discovered: A Non-Heme Oxidase Produces Medium-Chain 1-Alkenes. Angew. Chem. Int. Ed. 2015, 54, 4156–4158. [Google Scholar] [CrossRef]
- Wu, J.; Wang, Z.; Duan, X.; Zhou, P.; Liu, P.; Pang, Z.; Wang, Y.; Wang, X.; Li, W.; Dong, M. Construction of artificial micro-aerobic metabolism for energy- and carbon-efficient synthesis of medium chain fatty acids in Escherichia coli. Metab. Eng. 2019, 53, 1–13. [Google Scholar] [CrossRef]
- Edwards, T. Liquid Fuels and Propellants for Aerospace Propulsion: 1903–2003. J. Propuls. Power 2003, 19, 1089–1107. [Google Scholar] [CrossRef]
- Choi, Y.J.; Lee, S.Y. Microbial production of short-chain alkanes. Nature 2013, 502, 571–574. [Google Scholar] [CrossRef] [PubMed]
- Upton, C.; Buckley, J.T. A new family of lipolytic enzymes? Trends Biochem. Sci. 1995, 20, 178–179. [Google Scholar] [CrossRef]
- Mølgaard, A.; Kauppinen, S.; Larsen, S. Rhamnogalacturonan acetylesterase elucidates the structure and function of a new family of hydrolases. Structure 2000, 8, 373–383. [Google Scholar] [CrossRef] [Green Version]
- Akoh, C.C.; Lee, G.C.; Liaw, Y.C.; Huang, T.H.; Shaw, J.F. GDSL family of serine esterases/lipases. Prog. Lipid Res. 2004, 43, 534–552. [Google Scholar] [CrossRef]
- Lo, Y.C.; Lin, S.C.; Shaw, J.F.; Liaw, Y.C. Crystal structure of Escherichia coli thioesterase I/protease I/lysophospholipase L-1: Consensus sequence blocks constitute the catalytic center of SGNH-hydrolases through a conserved hydrogen bond network. J. Mol. Biol. 2003, 330, 539–551. [Google Scholar] [CrossRef]
- Jaeger, K.E.; Dijkstra, B.W.; Reetz, M.T. Bacterial biocatalysts: Molecular biology, three-dimensional structures, and biotechnological applications of lipases. Annu. Rev. Microbiol. 1999, 53, 315–351. [Google Scholar] [CrossRef] [PubMed]
- Montella, I.R.; Schama, R.; Valle, D. The classification of esterases: An important gene family involved in insecticide resistance—A Review. Mem. Inst. Oswaldo Cruz 2012, 107, 437–449. [Google Scholar] [CrossRef]
- Ribeiro, B.D.; de Castro, A.M.; Coelho, M.A.Z.; Freire, D.M.G. Production and use of lipases in bioenergy: A review from the feedstocks to biodiesel production. Enzym. Res. 2011, 2011, 615803. [Google Scholar] [CrossRef]
- Kovacic, F.; Granzin, J.; Wilhelm, S.; Kojic-Prodic, B.; Batra-Safferling, R.; Jaeger, K.E. Structural and Functional Characterisation of TesA—A Novel Lysophospholipase A from Pseudomonas aeruginosa. PLoS ONE 2013, 8, e69125. [Google Scholar] [CrossRef]
- Gokhale, R.S.; Hunziker, D.; Cane, D.E.; Khosla, C. Mechanism and specificity of the terminal thioesterase domain from the erythromycin polyketide synthase. Chem. Biol. 1999, 6, 117–125. [Google Scholar] [CrossRef]
- Harvey, B.M.; Hong, H.; Jones, M.A.; Hughes-Thomas, Z.A.; Goss, R.M.; Heathcote, M.L.; Bolanos-Garcia, V.M.; Kroutil, W.; Staunton, J.; Leadlay, P.F.; et al. Evidence that a novel thioesterase is responsible for polyketide chain release during biosynthesis of the polyether ionophore monensin. ChemBioChem 2006, 7, 1435–1442. [Google Scholar] [CrossRef]
- Heathcole, M.L.; Staunton, J.; Leadlay, P.F. Role of type II thioesterases: Evidence for removal of short acyl chains produced by aberrant decarboxylation of chain extender units. Chem. Biol. 2001, 8, 207–220. [Google Scholar] [CrossRef]
- Liu, T.G.; You, D.L.; Valenzano, C.; Sun, Y.H.; Li, J.L.; Yu, Q.; Zhou, X.F.; Cane, D.E.; Deng, Z.X. Identification of NanE as the thioesterase for polyether chain release in nanchangmycin biosynthesis. Chem. Biol. 2006, 13, 945–955. [Google Scholar] [CrossRef] [Green Version]
- Yeh, E.; Kohli, R.M.; Bruner, S.D.; Walsh, C.T. Type II thioesterase restores activity of a NRPS module stalled with an aminoacyl-S-enzyme that cannot be elongated. ChemBioChem 2004, 5, 1290–1293. [Google Scholar] [CrossRef] [PubMed]
- Zhou, Y.J.; Meng, Q.Q.; You, D.L.; Li, J.L.; Chen, S.; Ding, D.Z.; Zhou, X.F.; Zhou, H.C.; Bai, L.Q.; Deng, Z.X. Selective Removal of Aberrant Extender Units by a Type II Thioesterase for Efficient FR-008/Candicidin Biosynthesis in Streptomyces sp Strain FR-008. Appl. Environ. Microbiol. 2008, 74, 7235–7242. [Google Scholar] [CrossRef] [PubMed]
- Berman, H.A.; Yguerabide, J.; Taylor, P. Flexibility of the Molecular Forms of Acetylcholinesterase Measured with Steady-State and Time-Correlated Fluorescence Polarization Spectroscopy. Biochemistry 1985, 24, 7140–7147. [Google Scholar] [CrossRef]
- Waterhouse, A.; Bertoni, M.; Bienert, S.; Studer, G.; Tauriello, G.; Gumienny, R.; Heer, F.T.; De Beer, T.A.P.; Rempfer, C.; Bordoli, L.; et al. SWISS-MODEL: Homology modelling of protein structures and complexes. Nucleic Acids Res. 2018, 46, W296–W303. [Google Scholar] [CrossRef]
- Trott, O.; Olson, A.J. Software News and Update AutoDock Vina: Improving the Speed and Accuracy of Docking with a New Scoring Function, Efficient Optimization, and Multithreading. J. Comput. Chem. 2010, 31, 455–461. [Google Scholar]
- Quiroga, R.; Villarreal, M.A. Vinardo: A Scoring Function Based on Autodock Vina Improves Scoring, Docking, and Virtual Screening. PLoS ONE 2016, 11, 18. [Google Scholar] [CrossRef]
- Wang, Z.; Sun, H.Y.; Yao, X.J.; Li, D.; Xu, L.; Li, Y.Y.; Tian, S.; Hou, T.J. Comprehensive evaluation of ten docking programs on a diverse set of protein-ligand complexes: The prediction accuracy of sampling power and scoring power. Phys. Chem. Chem. Phys. 2016, 18, 12964–12975. [Google Scholar] [CrossRef]
- Pagadala, N.S.; Syed, K.; Tuszynski, J. Software for molecular docking: A review. Biophys. Rev. 2017, 9, 91–102. [Google Scholar] [CrossRef]
- Li, Z.; Li, L.; Huo, Y.; Chen, Z.; Zhao, Y.; Huang, J.; Jian, S.; Rong, Z.; Wu, D.; Gan, J.; et al. Structure-guided protein engineering increases enzymatic activities of the SGNH family esterases. Biotechnol. Biofuels 2020, 13, 107. [Google Scholar] [CrossRef]
- Pall, S.; Abraham, M.J.; Kutzner, C.; Hess, B.; Lindahl, E. Tackling exascale software challenges. In Molecular Dynamics Simulations with GROMACS, Proceedings of the 2nd International Conference on Exascale Applications and Software (EASC), Stockholm, Sweden, 2–3 April 2014; Springer: Stockholm, Sweden, 2014; pp. 3–27. [Google Scholar]
- Abraham, M.J.; Murtola, T.; Schulz, R.; Páll, S.; Smith, J.C.; Hess, B.; Lindahl, E. GROMACS: High performance molecular simulations through multi-level parallelism from laptops to supercomputers. SoftwareX 2015, 1, 19–25. [Google Scholar] [CrossRef]
- Hess, B.; Kutzner, C.; van der Spoel, D.; Lindahl, E. GROMACS 4: Algorithms for highly efficient, load-balanced, and scalable molecular simulation. Abstr. Pap. Am. Chem. Soc. 2009, 4, 435–447. [Google Scholar] [CrossRef] [PubMed] [Green Version]
- Lindahl, E.; Abraham, M.J.; Hess, B.; van der Spoel, D. GROMACS 2019.6 Source Code. Available online: https://zenodo.org/record/3685922#.YdzzHfnYsdU (accessed on 29 September 2021).
- Papaleo, E.; Mereghetti, P.; Fantucci, P.; Grandori, R.; De Gioia, L. Free-energy landscape, principal component analysis, and structural clustering to identify representative conformations from molecular dynamics simulations: The myoglobin case. J. Mol. Graph. 2009, 27, 889–899. [Google Scholar] [CrossRef] [PubMed]
- Han, F.; Liu, Y.; E, J.W.; Guan, S.S.; Han, W.W.; Shan, Y.M.; Wang, S.; Zhang, H. Effects of Tyr555 and Trp678 on the processivity of cellobiohydrolase A from Ruminiclostridium thermocellum: A simulation study. Biopolymers 2018, 109, 14. [Google Scholar] [CrossRef] [PubMed]
- Laatikainen, R.; Saarela, J.; Tuppurainen, K.; Hassinen, T. Internal motions of native lysozyme are more organized than those of mutants: A principal component analysis of molecular dynamics data. Biophys. Chem. 1998, 73, 1–5. [Google Scholar] [CrossRef]
- Jin, H.Y.; Zhou, Z.H.; Wang, D.M.; Guan, S.S.; Han, W.W. Molecular Dynamics Simulations of Acylpeptide Hydrolase Bound to Chlorpyrifosmethyl Oxon and Dichlorvos. Int. J. Mol. Sci. 2015, 16, 6217–6234. [Google Scholar] [CrossRef]
- Xu, L.; Sun, H.Y.; Li, Y.Y.; Wang, J.M.; Hou, T.J. Assessing the Performance of MM/PBSA and MM/GBSA Methods. 3. The Impact of Force Fields and Ligand Charge Models. J. Phys. Chem. B 2013, 117, 8408–8421. [Google Scholar] [CrossRef]
- Morris, G.M.; Huey, R.; Lindstrom, W.; Sanner, M.F.; Belew, R.K.; Goodsell, D.S.; Olson, A.J. AutoDock4 and AutoDockTools4: Automated Docking with Selective Receptor Flexibility. J. Comput. Chem. 2009, 30, 2785–2791. [Google Scholar] [CrossRef]
- Huang, J.; MacKerell, A.D., Jr. CHARMM36 all-atom additive protein force field: Validation based on comparison to NMR data. J. Comput. Chem. 2013, 34, 2135–2145. [Google Scholar] [CrossRef]
- Vanommeslaeghe, K.; MacKerell, A.D., Jr. Automation of the CHARMM General Force Field (CGenFF) I: Bond Perception and Atom Typing. J. Chem Inf. Model. 2012, 52, 3144–3154. [Google Scholar] [CrossRef]
- Ong, E.E.S.; Liow, J.L. The temperature-dependent structure, hydrogen bonding and other related dynamic properties of the standard TIP3P and CHARMM-modified TIP3P water models. Fluid Phase Equilibria 2019, 481, 55–65. [Google Scholar] [CrossRef]
- Mark, P.; Nilsson, L. Structure and dynamics of the TIP3P, SPC, and SPC/E water models at 298 K. J. Phys. Chem. A 2001, 105, 9954–9960. [Google Scholar] [CrossRef]
- Swanson, J.M.J.; Henchman, R.H.; McCammon, J.A. Revisiting free energy calculations: A theoretical connection to MM/PBSA and direct calculation of the association free energy. Biophys. J. 2004, 86, 67–74. [Google Scholar] [CrossRef]
- Rastelli, G.; Del Rio, A.; Degliesposti, G.; Sgobba, M. Fast and Accurate Predictions of Binding Free Energies Using MM-PBSA and MM-GBSA. J. Comput. Chem. 2010, 31, 797–810. [Google Scholar] [CrossRef] [PubMed]
- Genheden, S.; Ryde, U. How to Obtain Statistically Converged MM/GBSA Results. J. Comput. Chem. 2010, 31, 837–846. [Google Scholar] [CrossRef]
- Guan, S.S.; Han, W.W.; Zhang, H.; Wang, S.; Shan, Y.M. Insight into the interactive residues between two domains of human somatic Angiotensin-converting enzyme and Angiotensin II by MM-PBSA calculation and steered molecular dynamics simulation. J. Biomol. Struct. Dyn. 2016, 34, 15–28. [Google Scholar] [CrossRef] [PubMed]
- Mishra, S.K.; Koca, J. Assessing the Performance of MM/PBSA, MM/GBSA, and QM-MM/GBSA Approaches on Protein/Carbohydrate Complexes: Effect of Implicit Solvent Models, QM Methods, and Entropic Contributions. J. Phys. Chem. B 2018, 122, 8113–8121. [Google Scholar] [CrossRef] [PubMed]
- Kumari, R.; Kumar, R.; Lynn, A. Open Source Drug Discovery, C. g_mmpbsa-A GROMACS Tool for High-Throughput MM-PBSA Calculations. J. Chem Inf. Model. 2014, 54, 1951–1962. [Google Scholar] [CrossRef]
Publisher’s Note: MDPI stays neutral with regard to jurisdictional claims in published maps and institutional affiliations. |
© 2022 by the authors. Licensee MDPI, Basel, Switzerland. This article is an open access article distributed under the terms and conditions of the Creative Commons Attribution (CC BY) license (https://creativecommons.org/licenses/by/4.0/).