Article

Cerium-Copper Oxides Synthesized in a Multi-Inlet Vortex Reactor as Effective Nanocatalysts for CO and Ethene Oxidation Reactions

Department of Applied Science and Technology, Politecnico di Torino, Corso Duca degli Abruzzi 24, 10129 Turin, Italy
*
Author to whom correspondence should be addressed.
Catalysts 2022, 12(4), 364; https://doi.org/10.3390/catal12040364
Submission received: 21 February 2022 / Revised: 14 March 2022 / Accepted: 21 March 2022 / Published: 23 March 2022
(This article belongs to the Section Nanostructured Catalysts)

Abstract

:
In this study, a set of CuCeOx catalysts was prepared via the coprecipitation method using a Multi-Inlet Vortex Reactor: the Cu wt.% content is 5, 10, 20, 30 and 60. Moreover, pure CeO2 and CuO were synthesized for comparison purposes. The physico-chemical properties of this set of samples were investigated by complementary techniques, e.g., XRD, N2 physisorption at −196 °C, Scanning Electron Microscopy, XPS, FT-IR, Raman spectroscopy and H2-TPR. Then, the CuCeOx catalysts were tested for the CO and ethene oxidation reactions. As a whole, all the prepared samples presented good catalytic performances towards the CO oxidation reaction (1000 ppm CO, 10 vol.% O2/N2): the most promising catalyst was the 20%CuCeOx (complete CO conversion at 125 °C), which exhibited a long-term thermal stability. Similarly, the oxidative activity of the catalysts were evaluated using a gaseous mixture containing 500 ppm C2H4, 10 vol.% O2/N2. Accordingly, for the ethene oxidation reaction, the 20%CuCeOx catalyst evidenced the best catalytic properties. The elevated catalytic activity towards CO and ethene oxidation was mainly ascribed to synergistic interactions between CeO2 and CuO phases, as well as to the high amount of surface-chemisorbed oxygen species and structural defects.

1. Introduction

Over the last few years, the emission limits in the automotive field have become stricter. Several pollutants are produced in diesel and gasoline engines, such as carbon monoxide (CO) volatile organic compounds (VOCs), nitrogen oxides (NO, N2O and NO2, labelled as NOx), unburned carbon-based compound (UHC) and particulate matter (PM) [1,2,3,4].
Carbon monoxide (CO) originates from the incomplete combustion of fuel inside the engine reaction chamber. The engine working conditions are directly connected with the CO production: a higher quantity of CO is generated when the air-to-fuel ratio is under-stoichiometric (λ ratio < 1, rich mixture) [4,5]. However, it is possible to form CO in lean conditions too (λ ratio > 1), due to kinetic effects [6]. The CO is a harmful substance for humans because it can create confusion and asphyxia over a certain concentration [7,8,9].
The volatile organic compounds (VOCs) are a set of various substances present in the atmosphere that are originated due to natural or human-related processes (i.e., biogenic or anthropogenic, respectively) [10]. These compounds may represent an important risk for humans’ health [11]. Moreover, they can participate in atmospheric photochemical processes that lead to the formation of other harmful substances (e.g., peroxyacyl nitrates or ozone) [11,12]. Accordingly, the emission of these substances, as well as the emission of CO, is regulated [13]. In previous research works [14], ethene has been often used as VOC probe molecule [15,16,17,18,19,20]. In this sense, ethene has shown higher resistance to oxidation respect to other VOCs (e.g., propylene) [16,18], whereas it can be oxidized at temperatures similar to those required by some aromatic compounds, e.g., toluene [16,20].
The catalytic systems used for the abatement of automotive pollutants typically contain noble metals. Among them, Pt is probably the most used metal, since it is very active towards several oxidation reactions [21,22,23,24,25,26,27]. However, there are limitations in the utilization of noble metals (i.e., their high cost and the poisoning phenomenon) [28]. In this work, Cu was chosen in order to enhance the ceria reactivity and to be proposed as a valid alternative to noble metal-based catalysts.
According to the literature, CeO2-based catalysts are interesting materials for both the CO and ethene oxidations [17,18,29,30,31,32,33,34,35,36]. Ceria exhibits good redox properties due to the presence of the Ce3+–Ce4+ couple and it is able to store a high amount of oxygen. Moreover, the addition of foreign metals inside the CeO2 framework allows to further improve its promising performances [37,38,39,40,41,42,43,44,45].
Among the foreign metals, Cu is of particular interest. In fact, copper can be found as Cu+ and Cu2+, which could create a synergistic effect in terms of coupled Ce and Cu redox pairs (i.e., Ce3+–Ce4+ and Cu2+–Cu+) during the oxidation reactions. Specifically, the presence of CuO enhances the redox mechanism at the catalysts surface, because CuO and CeO2 can be reduced and oxidized at the same time [46,47,48]. Moreover, copper provides new active sites for the adsorption of reduced molecules. Hence, CuO–CeO2 systems are highly effective for both the CO and ethene oxidation reactions [14,17,18,49,50,51].
In this work, a set of CuCeOx catalysts was studied for the catalytic oxidation of CO and ethene. The latter was used as probe molecule for the oxidation of VOCs. The samples were also characterized by complementary techniques, such as X-Ray Diffraction (XRD), N2 physisorption at −196 °C, Field Emission Scanning Electron Microscopy (FESEM), X-ray Photoelectron Spectroscopy (XPS), Fourier Transform Infra-Red spectroscopy (FT-IR), Raman spectroscopy and H2 Temperature-Programmed Reduction (H2-TPR) in order to unveil which physico-chemical properties determine the catalytic activity.

2. Materials and Methods

2.1. Synthesis of CuCeOx Catalysts

A Multi-Inlet Vortex Reactor (MIVR) was used to synthesize the CuCeOx catalysts. Five samples were prepared with different Cu wt.% content, namely 5, 10, 20, 30 and 60, and herein labeled as 5%CuCeOx, 10%CuCeOx, 20%CuCeOx, 30%CuCeOx and 60%CuCeOx, respectively. Moreover, pure CeO2 and CuO were prepared for comparison purposes. The synthesis procedure was adapted from reference [52].
Two 60 mL syringes were filled with a 0.1 M NaOH (Merk, Steinheim, Germany). Afterwards, a metal precursor solution (0.1 M) at the desired weight ratio was prepared with Ce(NO3)3•6H2O and Cu(NO3)2•3H2O (Merck, Steinheim, Germany). The metal precursor solution was put inside other two syringes (60 mL). Then, the four syringes were connected to the MIVR inlets (Øinlet = 1 mm), as shown in Scheme 1A and 1B. The syringes are driven by a KD Scientific KDS220 infusion syringe pump (Merck, Steinheim, Germany) with the total flow rate fixed to 20 mL min−1 in order to have a turbulent flow in the MIVR reaction chamber (Øreaction chamber = 4 mm), according to previous fluid dynamic studies (Re = 8320) [52,53]. During the injection, the metal hydroxides nanoparticles (CuCeOH NPs) were formed in the reaction chamber, meanwhile the suspension was moving upward in a spiral way towards the outlet on the top of the reactor. Then, the suspension was collected into a beaker (Scheme 1C).
Afterwards, the thus-obtained suspension was stirred for 1 h at room temperature. Then, it was centrifuged (5000 rpm, 1 h) and the produced powder was washed three times with ultra-pure water (MilliQ, Direct Water Purification System, Merk, Steinheim, Germany). Finally, the powder was dried overnight at 60 °C and calcined at 650 °C for 4 h (heating rate of 10 °C min−1).

2.2. Characterization Techniques

The X-ray diffraction (XRD) patterns of the powders were registered by means of an X’Pert Philips PW3040 diffractometer (Malvern Panalytical Ltd., Malvern, UK) and using Cu Kα radiation (2θ = 10–80°; step = 0.013° 2θ; time per step = 0.2 s). The data obtained was indexed using the Powder Data File database (PDF-2 1999, International Centre of Diffraction Data).
The measurement of the textural properties of the catalysts (i.e., specific surface area and total pore volume) was carried out by performing N2 physisorption at −196 °C in a Micromeritics Tristar II 3020 (v1.03, Micromeritics Instrument Corp., Norcross, GA, USA). Before the analysis, the samples were outgassed at 200 °C for 2 h. The values of specific surface area (SSA) were calculated through the Brunauer–Emmett–Teller (BET) method. On the other hand, the pore volume (Vp) was assessed by analyzing the desorption phase using the Barrett–Joyner–Halenda (BJH) method.
The morphology of the catalysts was investigated with a field emission scanning electron microscope (FESEM Zeiss MERLIN, Gemini-II column, Oberkochen, Germany), in which Energy Dispersive X-Ray (EDX) analysis was performed as well.
The elemental composition of the samples was also investigated using an Inductively Coupled Plasma Mass Spectrometer (iCAP Q ICP-MS, ThermoFisher Scientific, Waltham, MA, USA). For this analysis, 100 mg of each sample were dissolved in an aqueous solution of hydrochloric acid (1 M), nitric acid (1 M) and ascorbic acid (0.5 M), which was then stirred for 8 h to completely solubilize the powder.
Raman spectroscopy was carried out with a Renishaw InVia micro-Raman spectrometer (Renishaw plc, Wotton-under-Edge, UK). The spectra were collected at room temperature using a 514.5 nm excitation wavelength, a 10 mW laser power, a 5× objective and a 225 s total acquisition time. For each sample, three spectra were collected in different points and averaged. The ratio between the area of the defect-related band (D band) and that of the ceria F2g peak (D/F2g ratio) was calculated as an estimation of defect abundance. The areas were obtained by deconvolution of the main bands using Lorentzian fitting curves.
FT-IR (Fourier transform infrared) spectroscopy was performed using a Bruker Invenio S spectrophotometer (Bruker Corporation, Billerica, MA, USA) equipped with a cooled MCT detector. Self-supporting wafers were prepared by pressing the catalyst powder and were analyzed in transmission mode in a quartz cell equipped with KBr windows. Prior to analysis, the wafers were outgassed at 50 or 150 °C for 1 h to remove water, using a standard vacuum frame. The spectra were collected at a 2 cm−1 resolution and were normalized to the mass per unit area of each wafer.
The core-level spectra of the elements of interest were studied through the X-ray photoelectron spectroscopy (XPS) technique. The analyses were performed in a PHI Versa probe apparatus (Physical Electronics Inc. PHI, Chanhassen, MN, USA) using: band-pass energy: 187.85 eV; take-off angle: 45°; X-ray spot size diameter: 100 μm.
The reducibility of the catalysts was investigated performing temperature-programmed reduction analyses under a flow of H2 (H2-TPR). The analyses were carried out in a ThermoQuest TPD/R/O 1100 (ThermoFisher Scientific, Milan, Italy), comprising a thermal conductivity detector (TCD). Before the analysis, an oxidative pretreatment was carried out under a flow of O2 (20 mL min−1) at 550 °C for 1 h. Subsequently, the catalysts were put under a reducing gas mixture containing 5 vol.% of H2/Ar (flowrate: 20 mL min−1). During a typical analysis, the temperature was increased from 50 °C until 900 °C (heating rate 10 °C min−1). At the end of the analysis, the temperature was held at 900 °C for 10 min. For the H2-TPR analysis, the onset temperature (Tonset) was considered as a catalytic parameter. The Tonset is defined as the intersection of the tangent passing through the inflection point of the first reduction peak and the baseline.

2.3. Catalytic Activity Tests

The catalytic activity of the prepared powder catalysts was performed in a temperature-programmed oxidation (TPO) setup comprising a PID-controlled furnace. A quartz U-tube reactor (ID = 0.4 cm) hosted a fixed-bed containing the catalyst. The temperature was quantified using a K-type thermocouple set in the upper limit of the fixed-bed. The gas outlet from the reactor was analyzed by a non-dispersive infrared analyzer ABB Uras 14 (ABB S.p.A – PAMA, Milan, Italy).

2.3.1. CO Oxidation Reaction

The catalytic bed for the CO oxidation reaction was prepared by putting 100 mg of catalyst inside a quartz-U reactor. Then, the catalyst was pretreated with 50 mL min−1 of N2 for 30 min at 100 °C, in order to desorb impurities on the catalyst surface (i.e., H2O). Then, the temperature was cooled down until 25 °C. After that, a gas mixture containing about 1000 ppm CO and 10 vol.% O2 balanced with N2 was sent to the reactor (total flow 50 mL min−1). Then, the temperature was increased by 25 °C (heating rate 5 °C min−1). The temperature was kept constant for 30 min in order to have a complete stabilization at each increment of the temperature and to avoid adsorption-desorption phenomena. The test finished when the CO conversion reached the 100%.

2.3.2. Ethene Oxidation Reaction

For the ethene catalytic oxidation tests, 100 mg of catalyst were introduced into the quartz-U reactor. Prior to the catalytic testing, a degassing pretreatment under a flow of N2 (50 mL min−1) at 150 °C was performed for 1 h. Afterwards, the temperature was set to 100 °C and the catalytic test started. During this test, a gaseous mix containing C2H4 (500 ppm), O2 (10 vol.%) and N2 (balance) was flowed (50 mL min−1) in the reactor. In addition, the temperature was raised from 100 °C to 425 °C. Isothermal steps were performed every 25 °C until the conversion of the ethene (in terms of outlet CO and CO2 concentrations) was stable.

3. Results

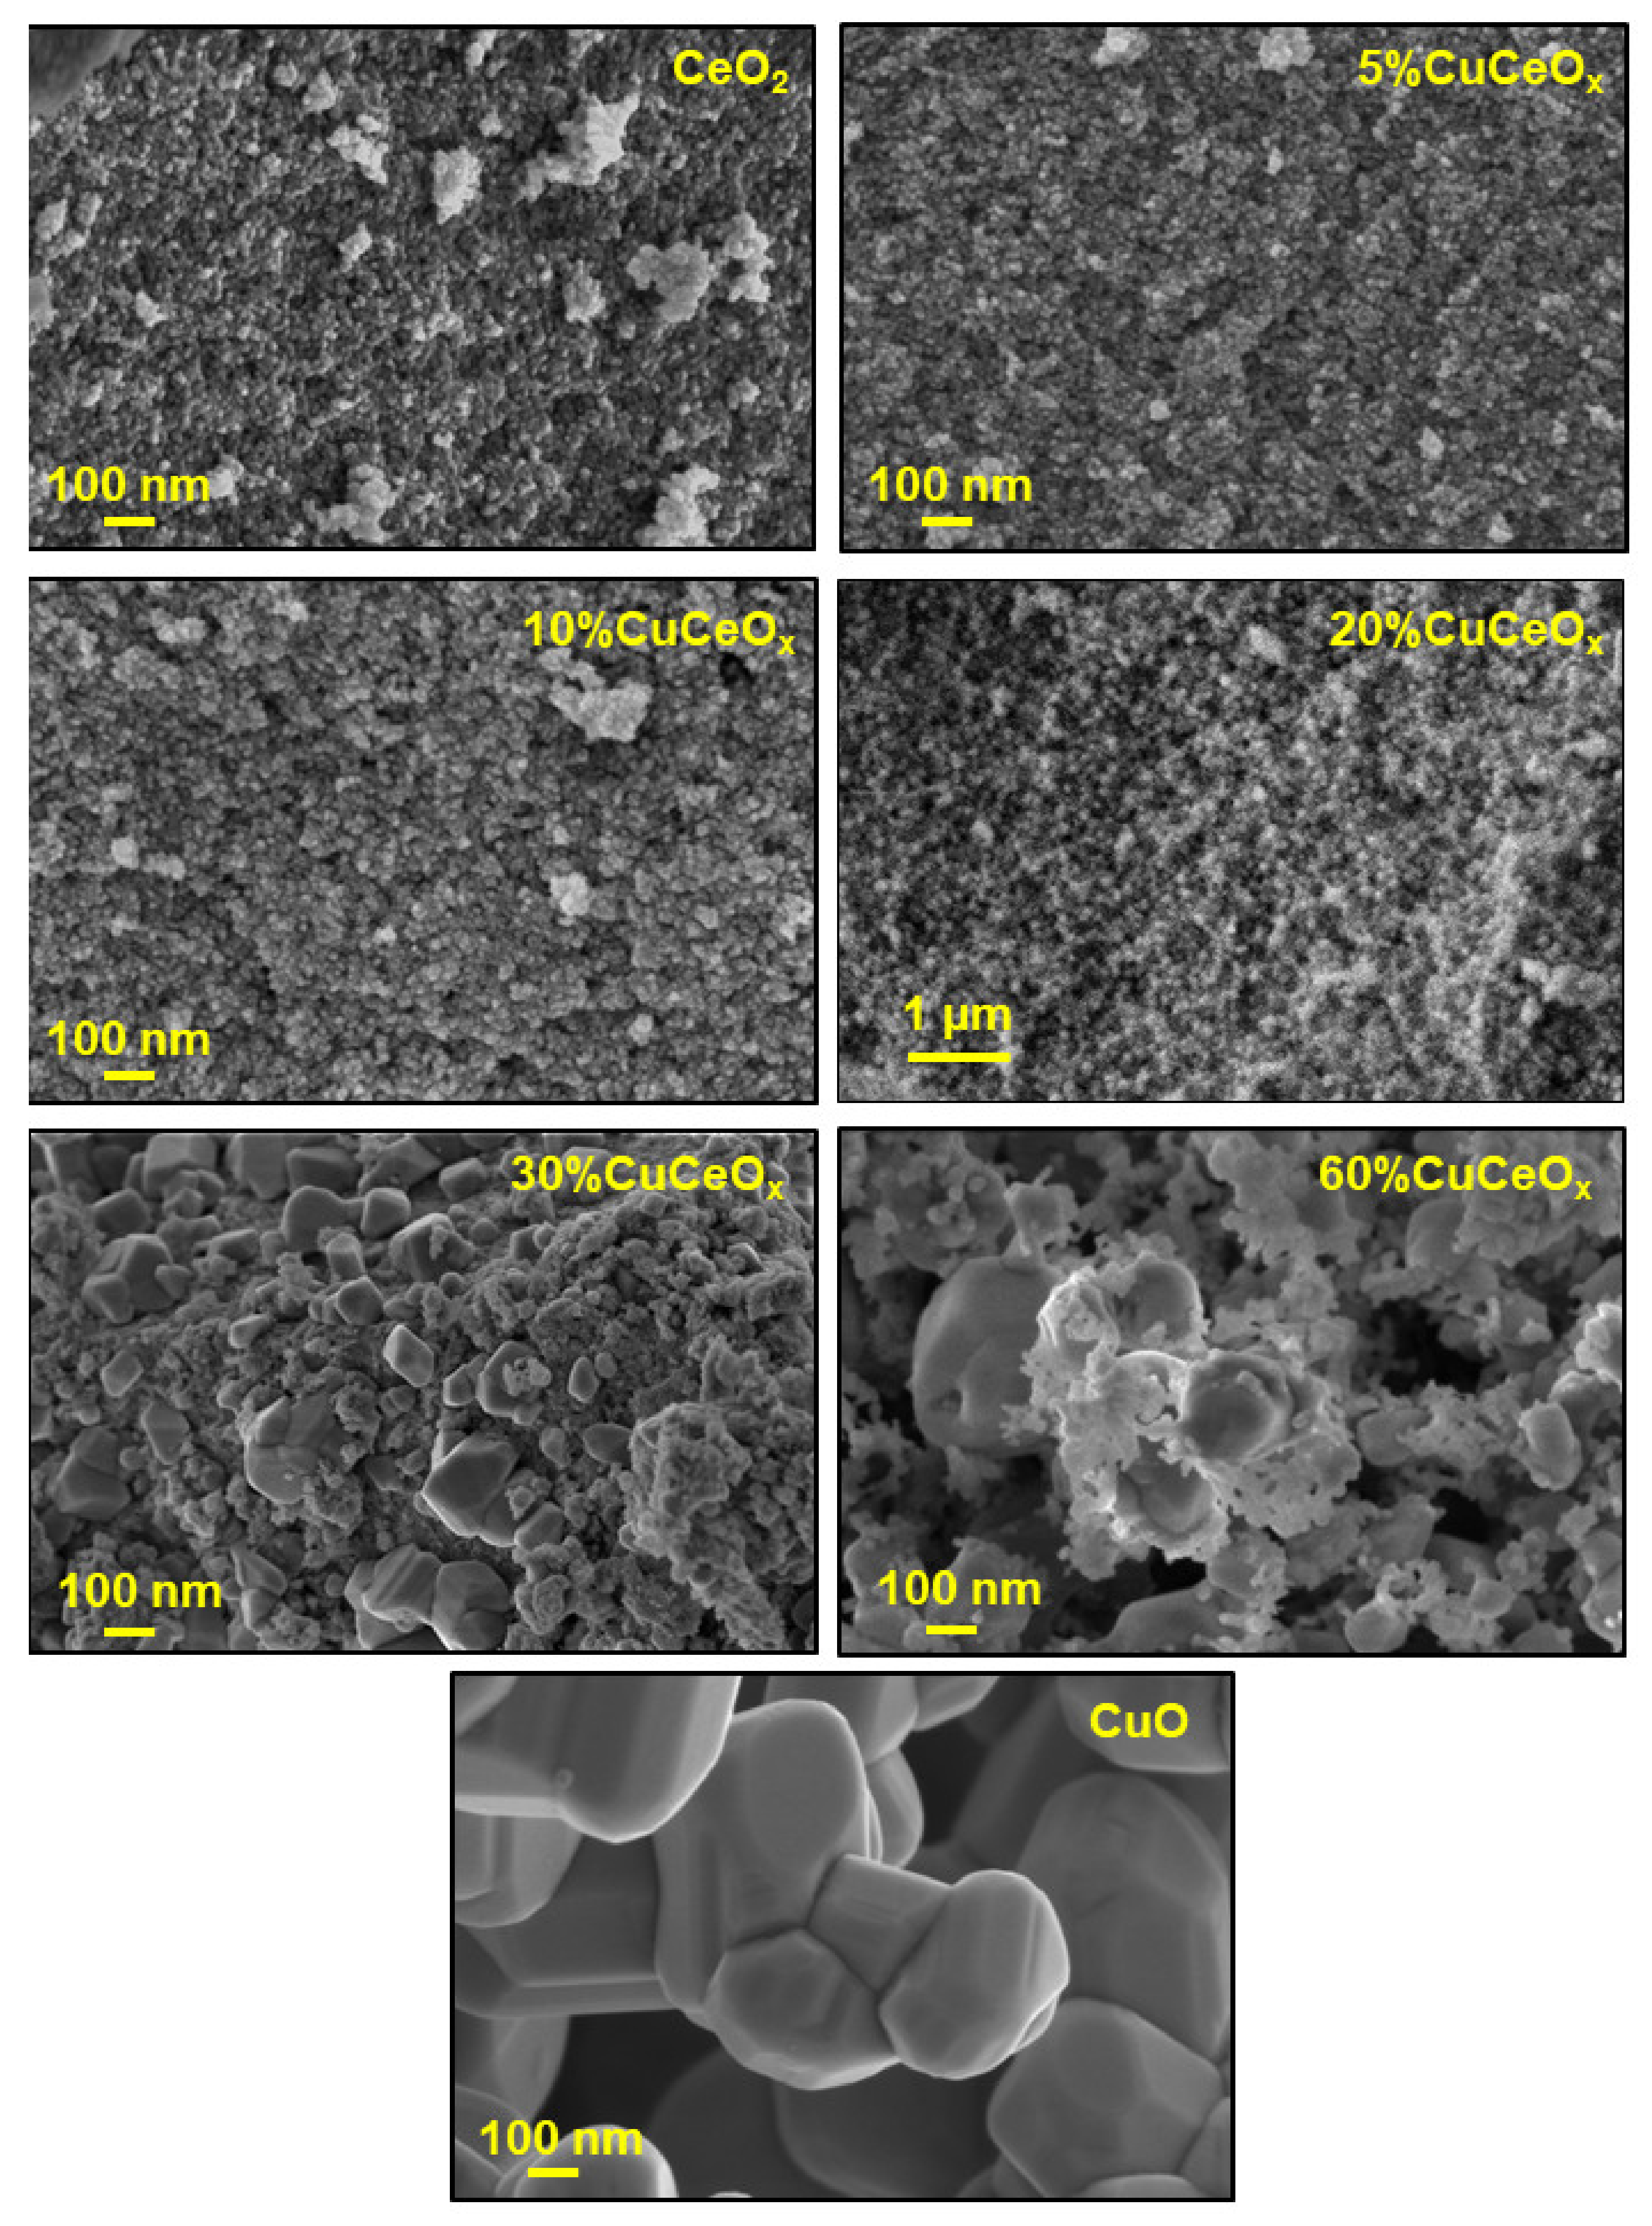
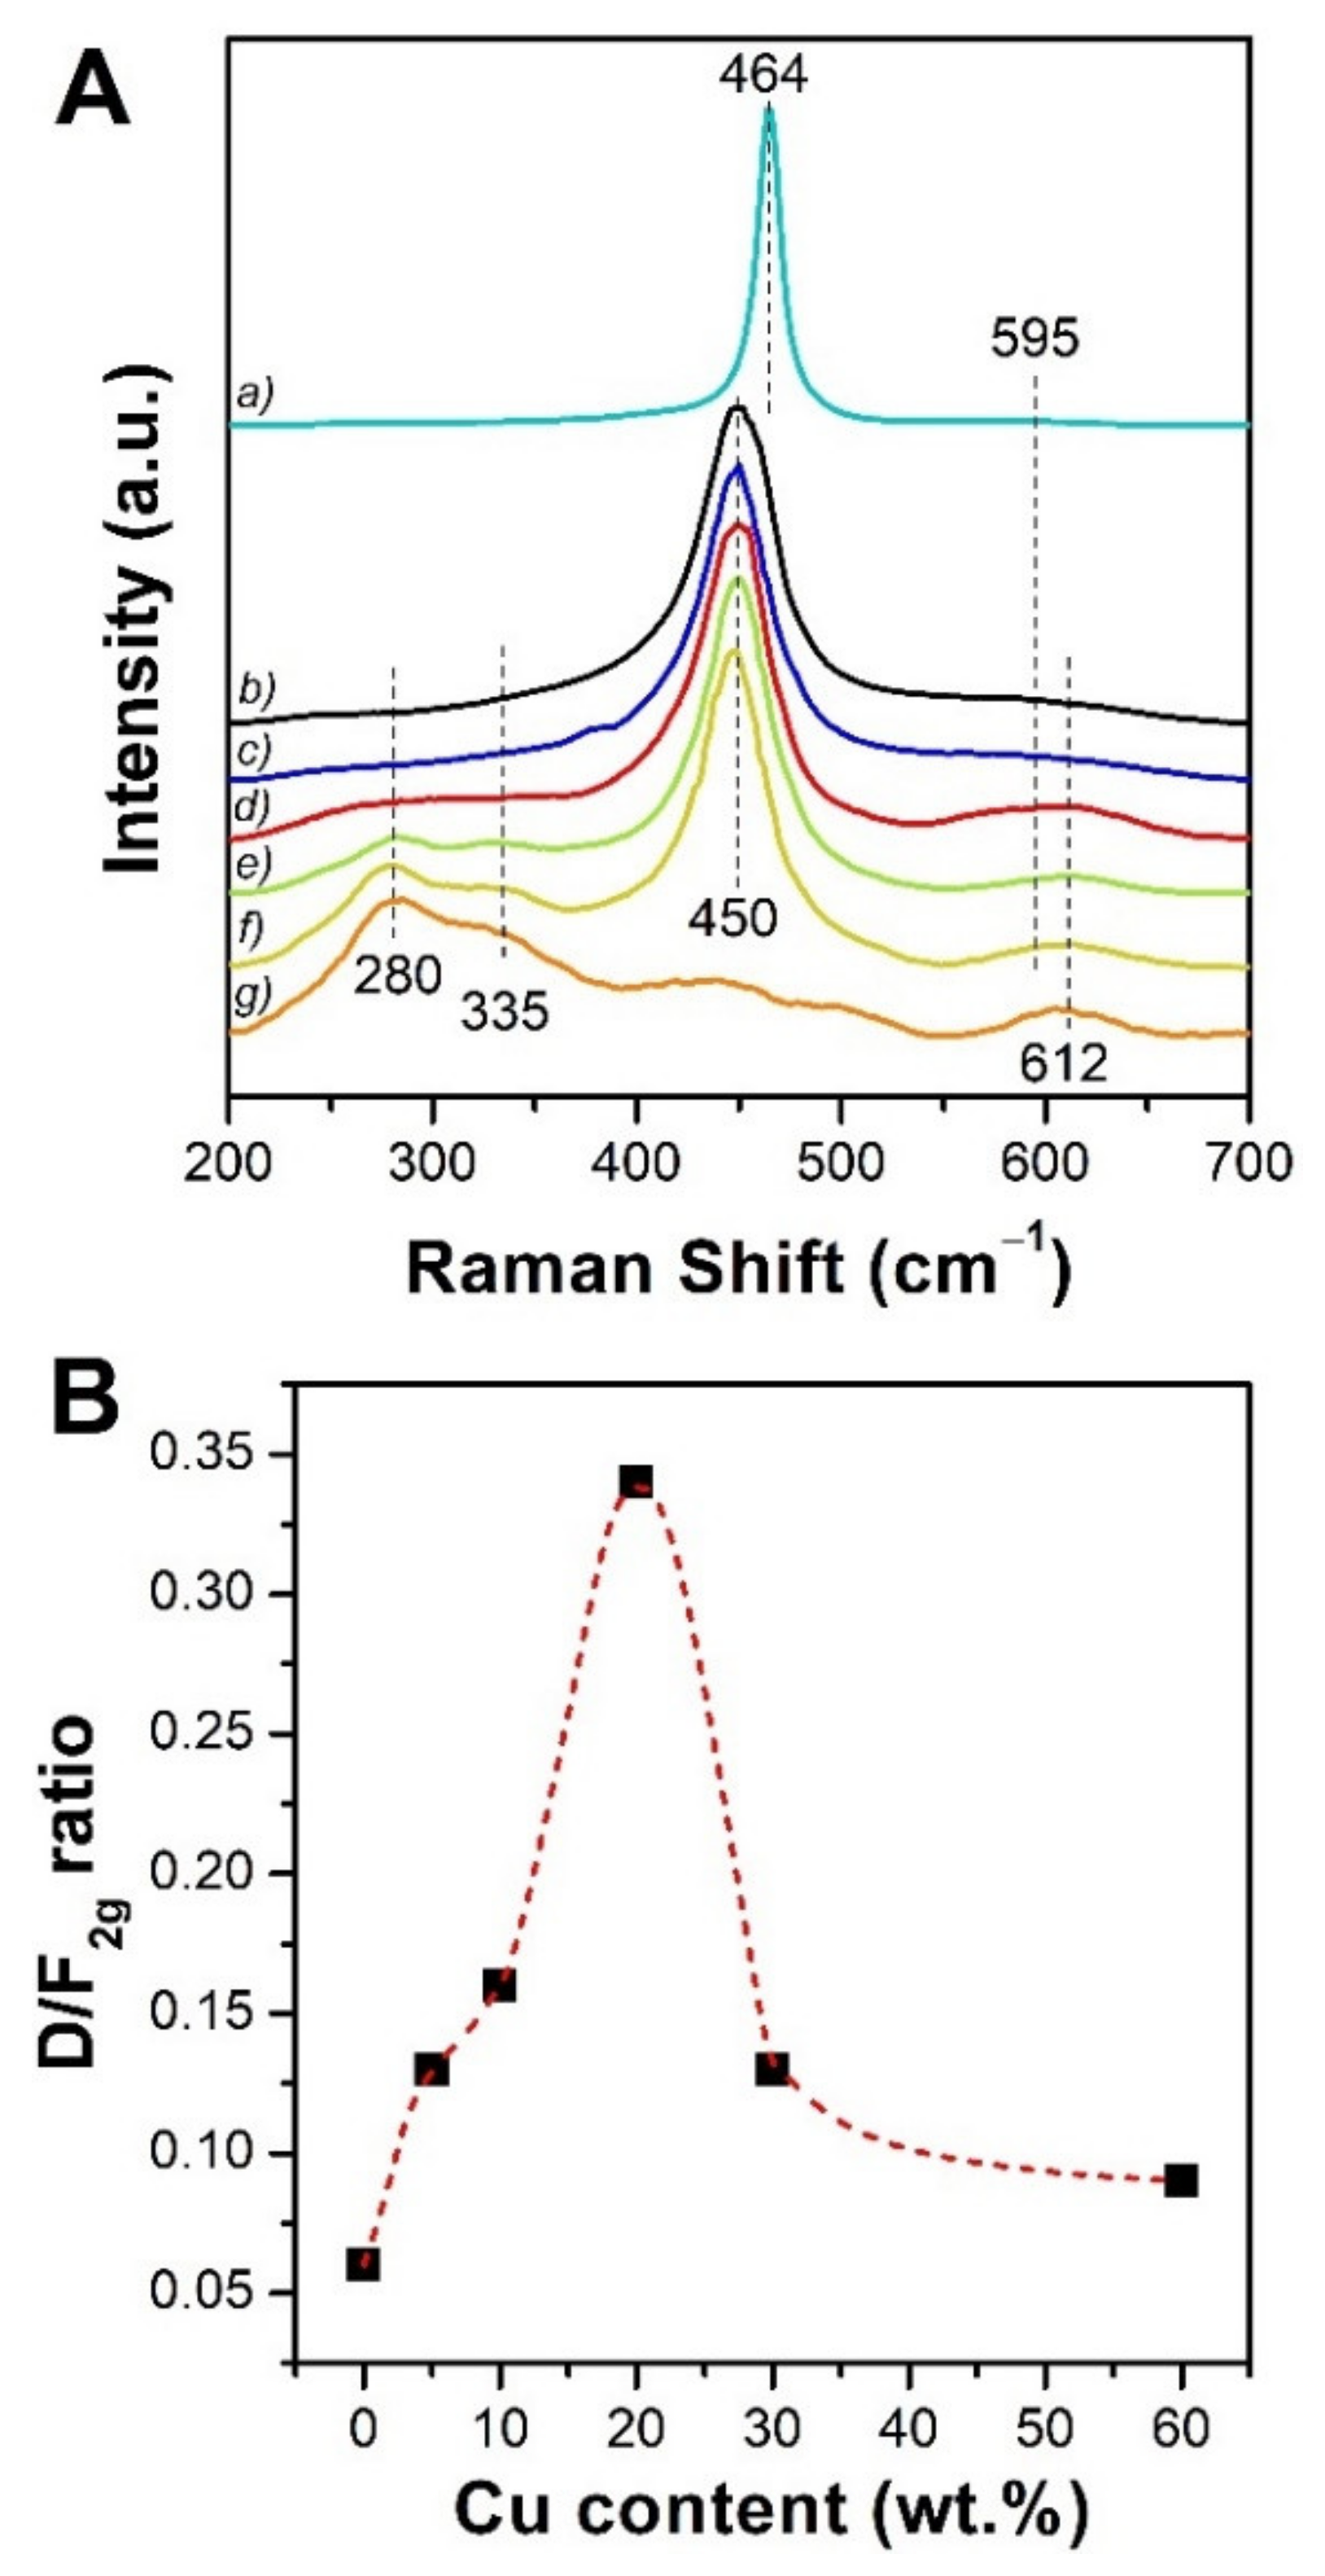
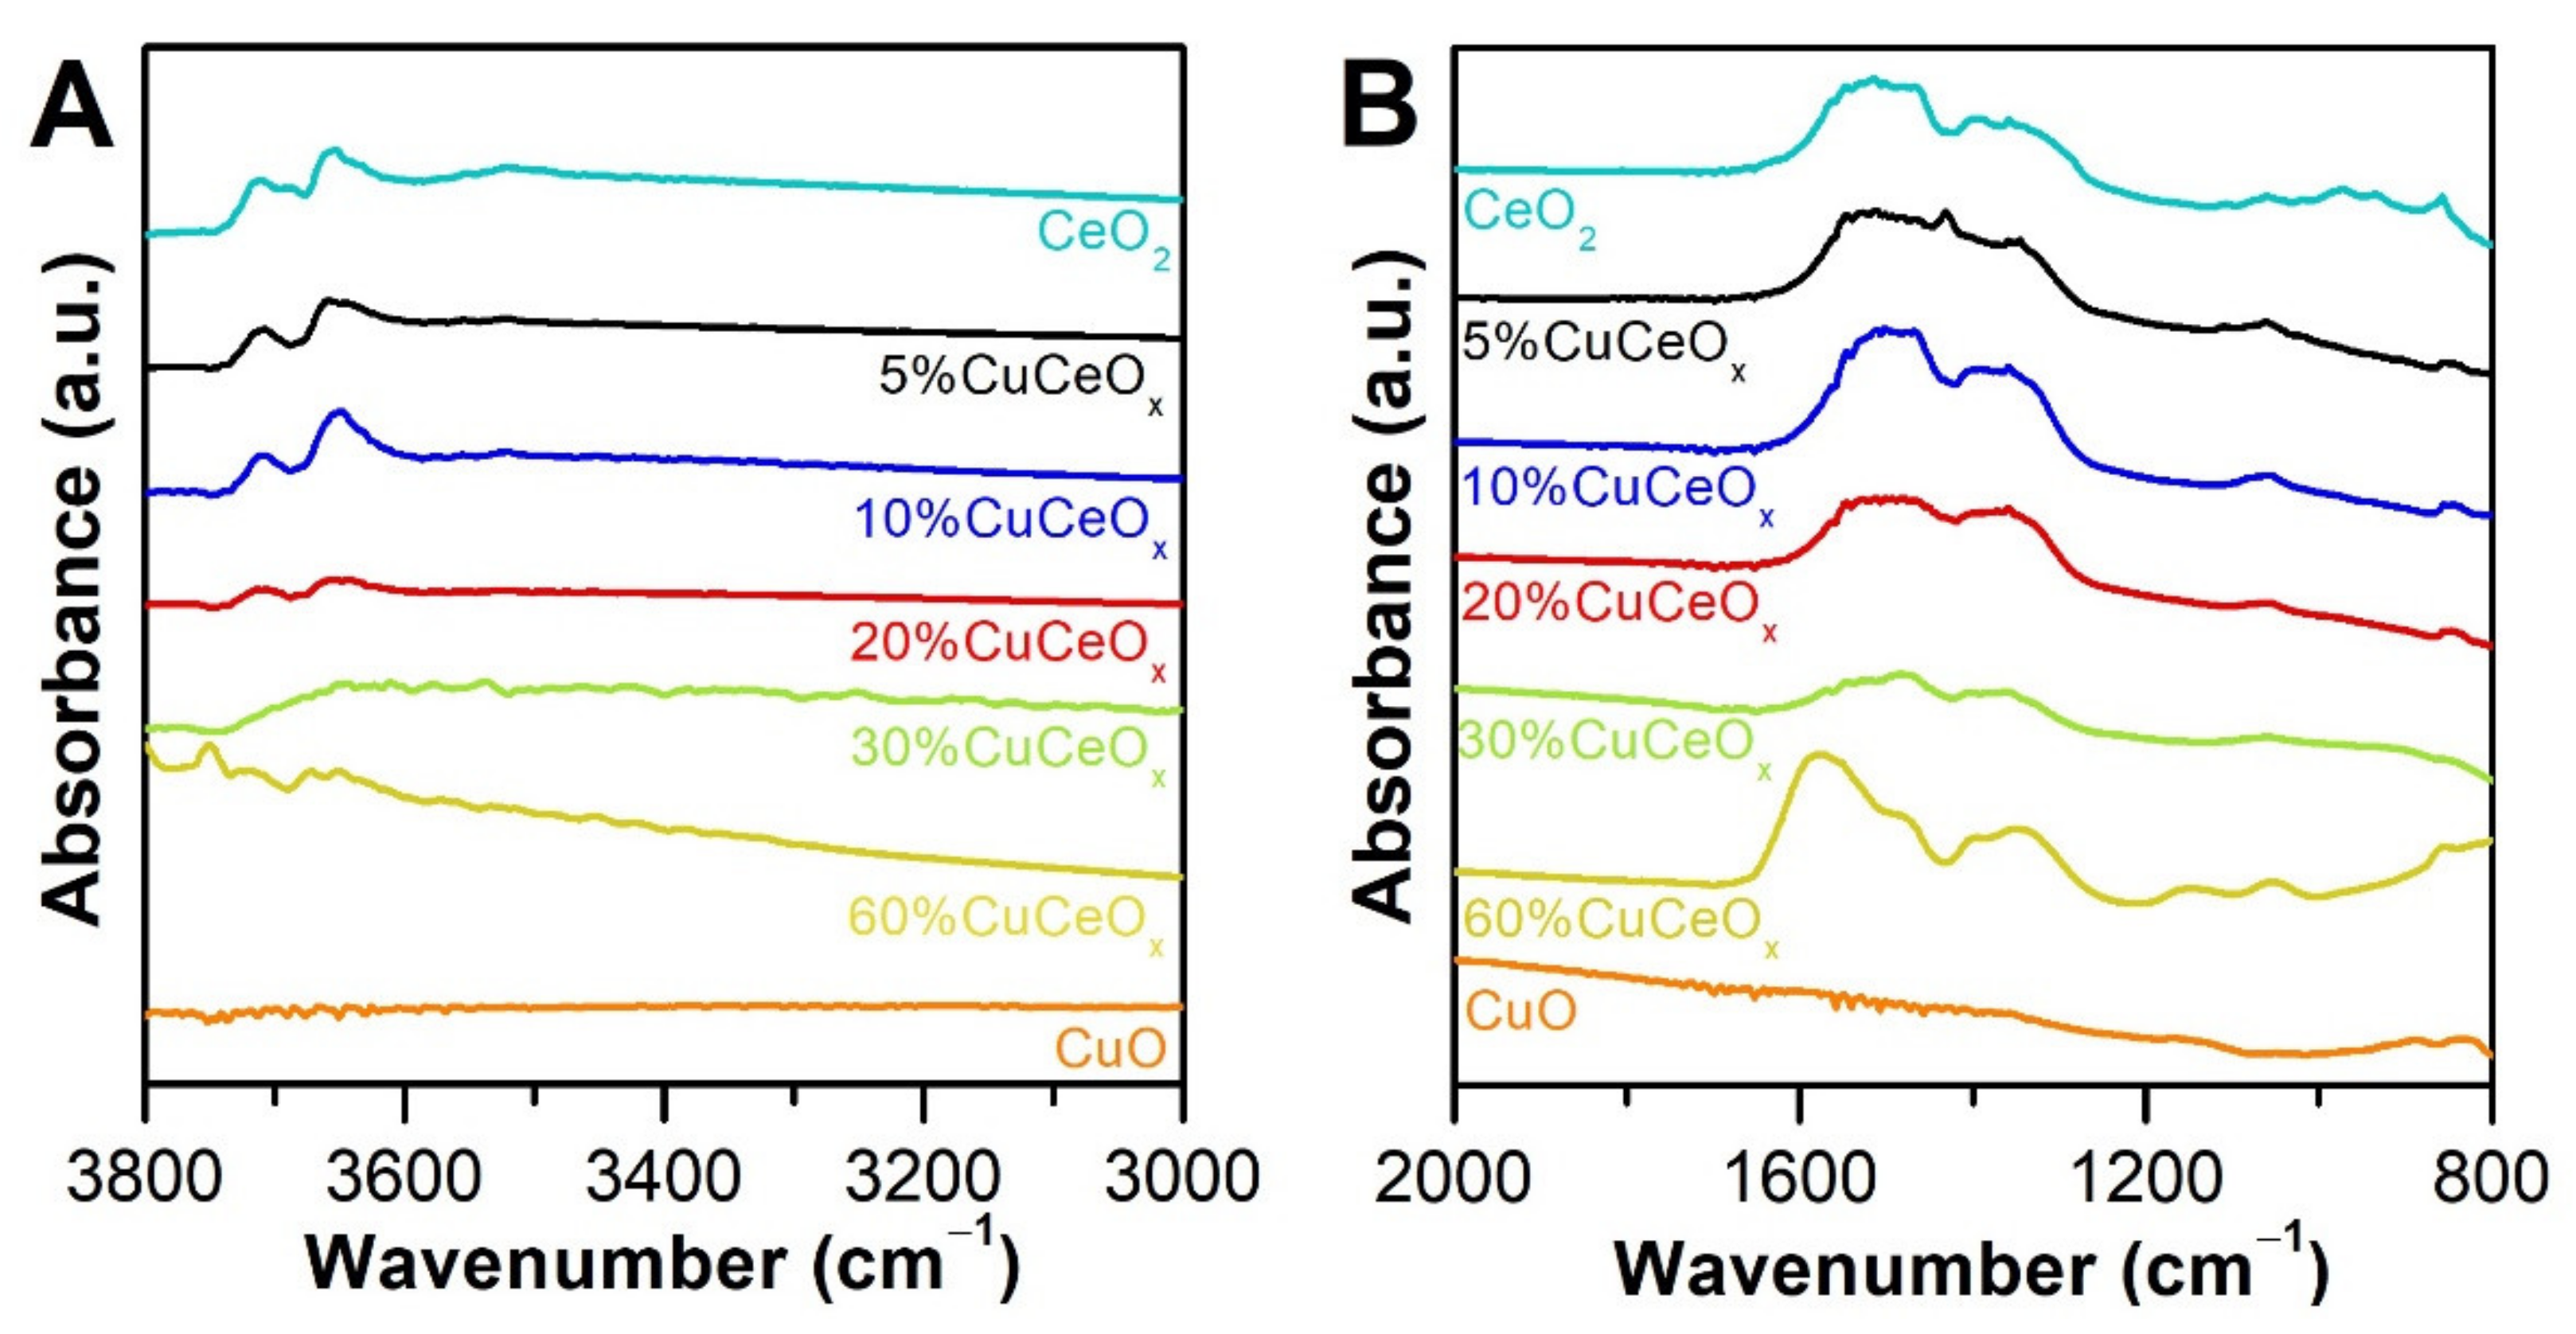
3.1. Structural and Textural Properties

The crystalline structure of the prepared samples was investigated by means of XRD analysis in the 10° < 2θ < 80° range. The diffractograms of the catalysts are reported in Figure 1. As a whole, all the samples (except for CuO) exhibit the typical CeO2 cubic fluorite structure, characterized by the (1 1 1), (2 0 0), (2 2 0), (3 1 1), (2 2 2), (4 0 0), (3 3 1) and (4 2 0)-type planes [31,33,37,54,55]. The patterns of these samples were compared to reference code 96-900-9009 (CeO2). The CuO (reference code 96-101-1195) has the main diffraction peaks at 35.6° ((0 2 2)-type plane) and 38.8° ((1 1 1)-type plane), which are ascribed to the typical monoclinic crystalline phase of CuO [56].
Notably, the samples 30%CuCeOx and 60%CuCeOx exhibit both CuO and CeO2 patterns. This outcome evidences the presence of two different phases (segregates). Furthermore, the presence of weak reflection peaks of the CuO was detected for 10%CuCeOx and 20%CuCeOx too (Figure S1).
The crystallites dimensions (Dc) were evaluated by Scherrer’s equation and reported in Table 1. As a whole, all the samples have CeO2 crystallites with similar dimensions, in the range between 10 and 16 nm. Instead, the crystal size of the CuO phase gradually increases with the Cu content, from 7 nm (10%CuCeOx) to 73 nm (pure CuO).
The SSA and the total pore volume were investigated through the N2 physisorption analysis at −196 °C. The results are resumed in Table 1. The 10%CuCeOx presents the highest SSA (55 m2 g−1, Vp = 0.10 cm3 g−1), while the 5%CuCeOx and 20%CuCeOx have promising textural properties as well (SSA = 50 m2 g−1, Vp = 0.08–0.09 cm3 g−1).
The morphology of the CuCeOx catalysts was investigated by means of FESEM analysis and the micrographs are reported in Figure 2. The CeO2, 5%CuCeOx, 10%CuCeOx and 20%CuCeOx images suggest a good homogeneity of the particle size. Conversely, at higher Cu content, namely, 30 and 60 wt.%, big CuO particles were observed along with small CeO2 nanoparticles. The CuO phase in 30%CuCeOx and 60%CuCeOx presents the typical octahedral or truncated-octahedral shape, confirmed by other research works [56,57].
The elemental composition of the different catalysts was evaluated through EDX and ICP analyses (Table 2 and Table S1): for all the samples, both the techniques confirmed a copper content similar to the nominal one.
Figure 3A displays the Raman spectra of the different catalysts. Raman spectroscopy can indeed provide insight into the modifications induced in the catalyst structure and defectiveness by the increasing content of Cu. Pure ceria features an intense F2g peak at 464 cm−1 related to the symmetric stretching of Ce-O bonds in the fluorite lattice [58]. A much less intense band at about 595 cm−1 (D band) is instead associated with the presence of defects and it is usually assigned to intrinsic Frenkel sites, in which a vacancy is generated by the displacement of an oxygen atom into an interstitial position [58,59].
The ceria-copper mixed oxides are characterized by analogous Raman spectra, although some differences are evident. The F2g peak of doped ceria is broader and red-shifted to 448–451 cm−1, evidencing structural distortion [60,61]. Moreover, the intensity of the defect band gradually increases upon copper addition and new defect-related components appear. In detail, a peak centered at 620–630 cm−1 can be ascribed to substitutional sites containing a copper atom in 8-fold coordination [62,63], while a shoulder band around 550 cm−1 arises as a consequence of oxygen vacancies generation [64,65,66]. These outcomes point out that copper is partially incorporated in ceria structure, causing lattice distortion and the formation of new extrinsic defects. At high Cu loading, the typical peaks of CuO starts to be visible in the Raman spectra of the mixed catalysts, as a consequence of the segregation of this oxide. These components, centered at about 280, 335 and 612 cm−1, have been ascribed to one Ag and two Bg modes, respectively [67].
Spectral deconvolution allowed to estimate the abundance of defects in the cerium oxide structure, by calculating the ratio between the area of the defect (D) band and the area of the F2g peak of ceria (D/F2g) [63,68]. For highly doped ceria, a peak was set at 612 cm−1 in order to take into account the presence of segregated CuO, and its contribution was not considered in the calculation of the D band area. The D/F2g values are reported in Table 1 and their trend is depicted in Figure 3B. The amount of defects initially grows with increasing Cu doping and it is maximum for the 20%CuCeOx sample. However, further addition of copper results in the segregation of CuO particles rather than in the formation of structural defects in the ceria framework, in line with previous studies [17].
FT-IR spectroscopy was employed for studying the chemical species at the surface of the different catalysts. FT-IR spectra collected after outgassing the samples at 150 °C are reported in Figure 4. The thermal treatment allows to remove physisorbed water and to more clearly detect the vibrational modes of the surface species (for comparison purposes, spectra of samples outgassed at 50 °C are displayed in Figure S2).
The bands in the 3800–3000 cm−1 region are related to the stretching of the hydroxyl groups. Different OH species are present at the surface of the ceria-rich materials: the band at 3710 cm−1 can be ascribed to isolated OH groups while the intense peak at 3655–3650 cm−1 was assigned to bridging OH [69,70]. The asymmetry of the latter component has been previously attributed to the presence of bridging OH in the proximity of an oxygen vacancy, giving rise to a shoulder at 3640–3630 cm−1 [69]. The less intense band at about 3520 cm−1 may instead be related to triply coordinated OH [69,70]. The presence of a variegated population of OH groups is an index of ceria hydrophilicity. According to previous studies, a hydrophilic support can promote the catalytic activity of metallic active sites [71]. All the hydroxyl species become less abundant at high copper loading and are no more detectable in pure copper oxide, suggesting that Cu doping can reduce ceria hydrophilicity.
The 1700–800 cm−1 region is featured by several broad bands which signal the presence of a heterogeneous population of carbonate and formate species, including monodentate, bidentate, bridged and polydentate carbonates [58,70,72,73]. The carbonate fingerprint is quite similar for pure ceria and for the mixed oxides containing up to 30% of copper. Conversely, new components can be noticed in the FT-IR spectrum of the 60%CuCeOx sample, probably linked to carbonate species at the surface of CuO particles. An almost flat profile was obtained for pure copper oxide, likely due to the much lower specific surface area of this material (see BET analysis in Table 1).

3.2. Chemical Properties

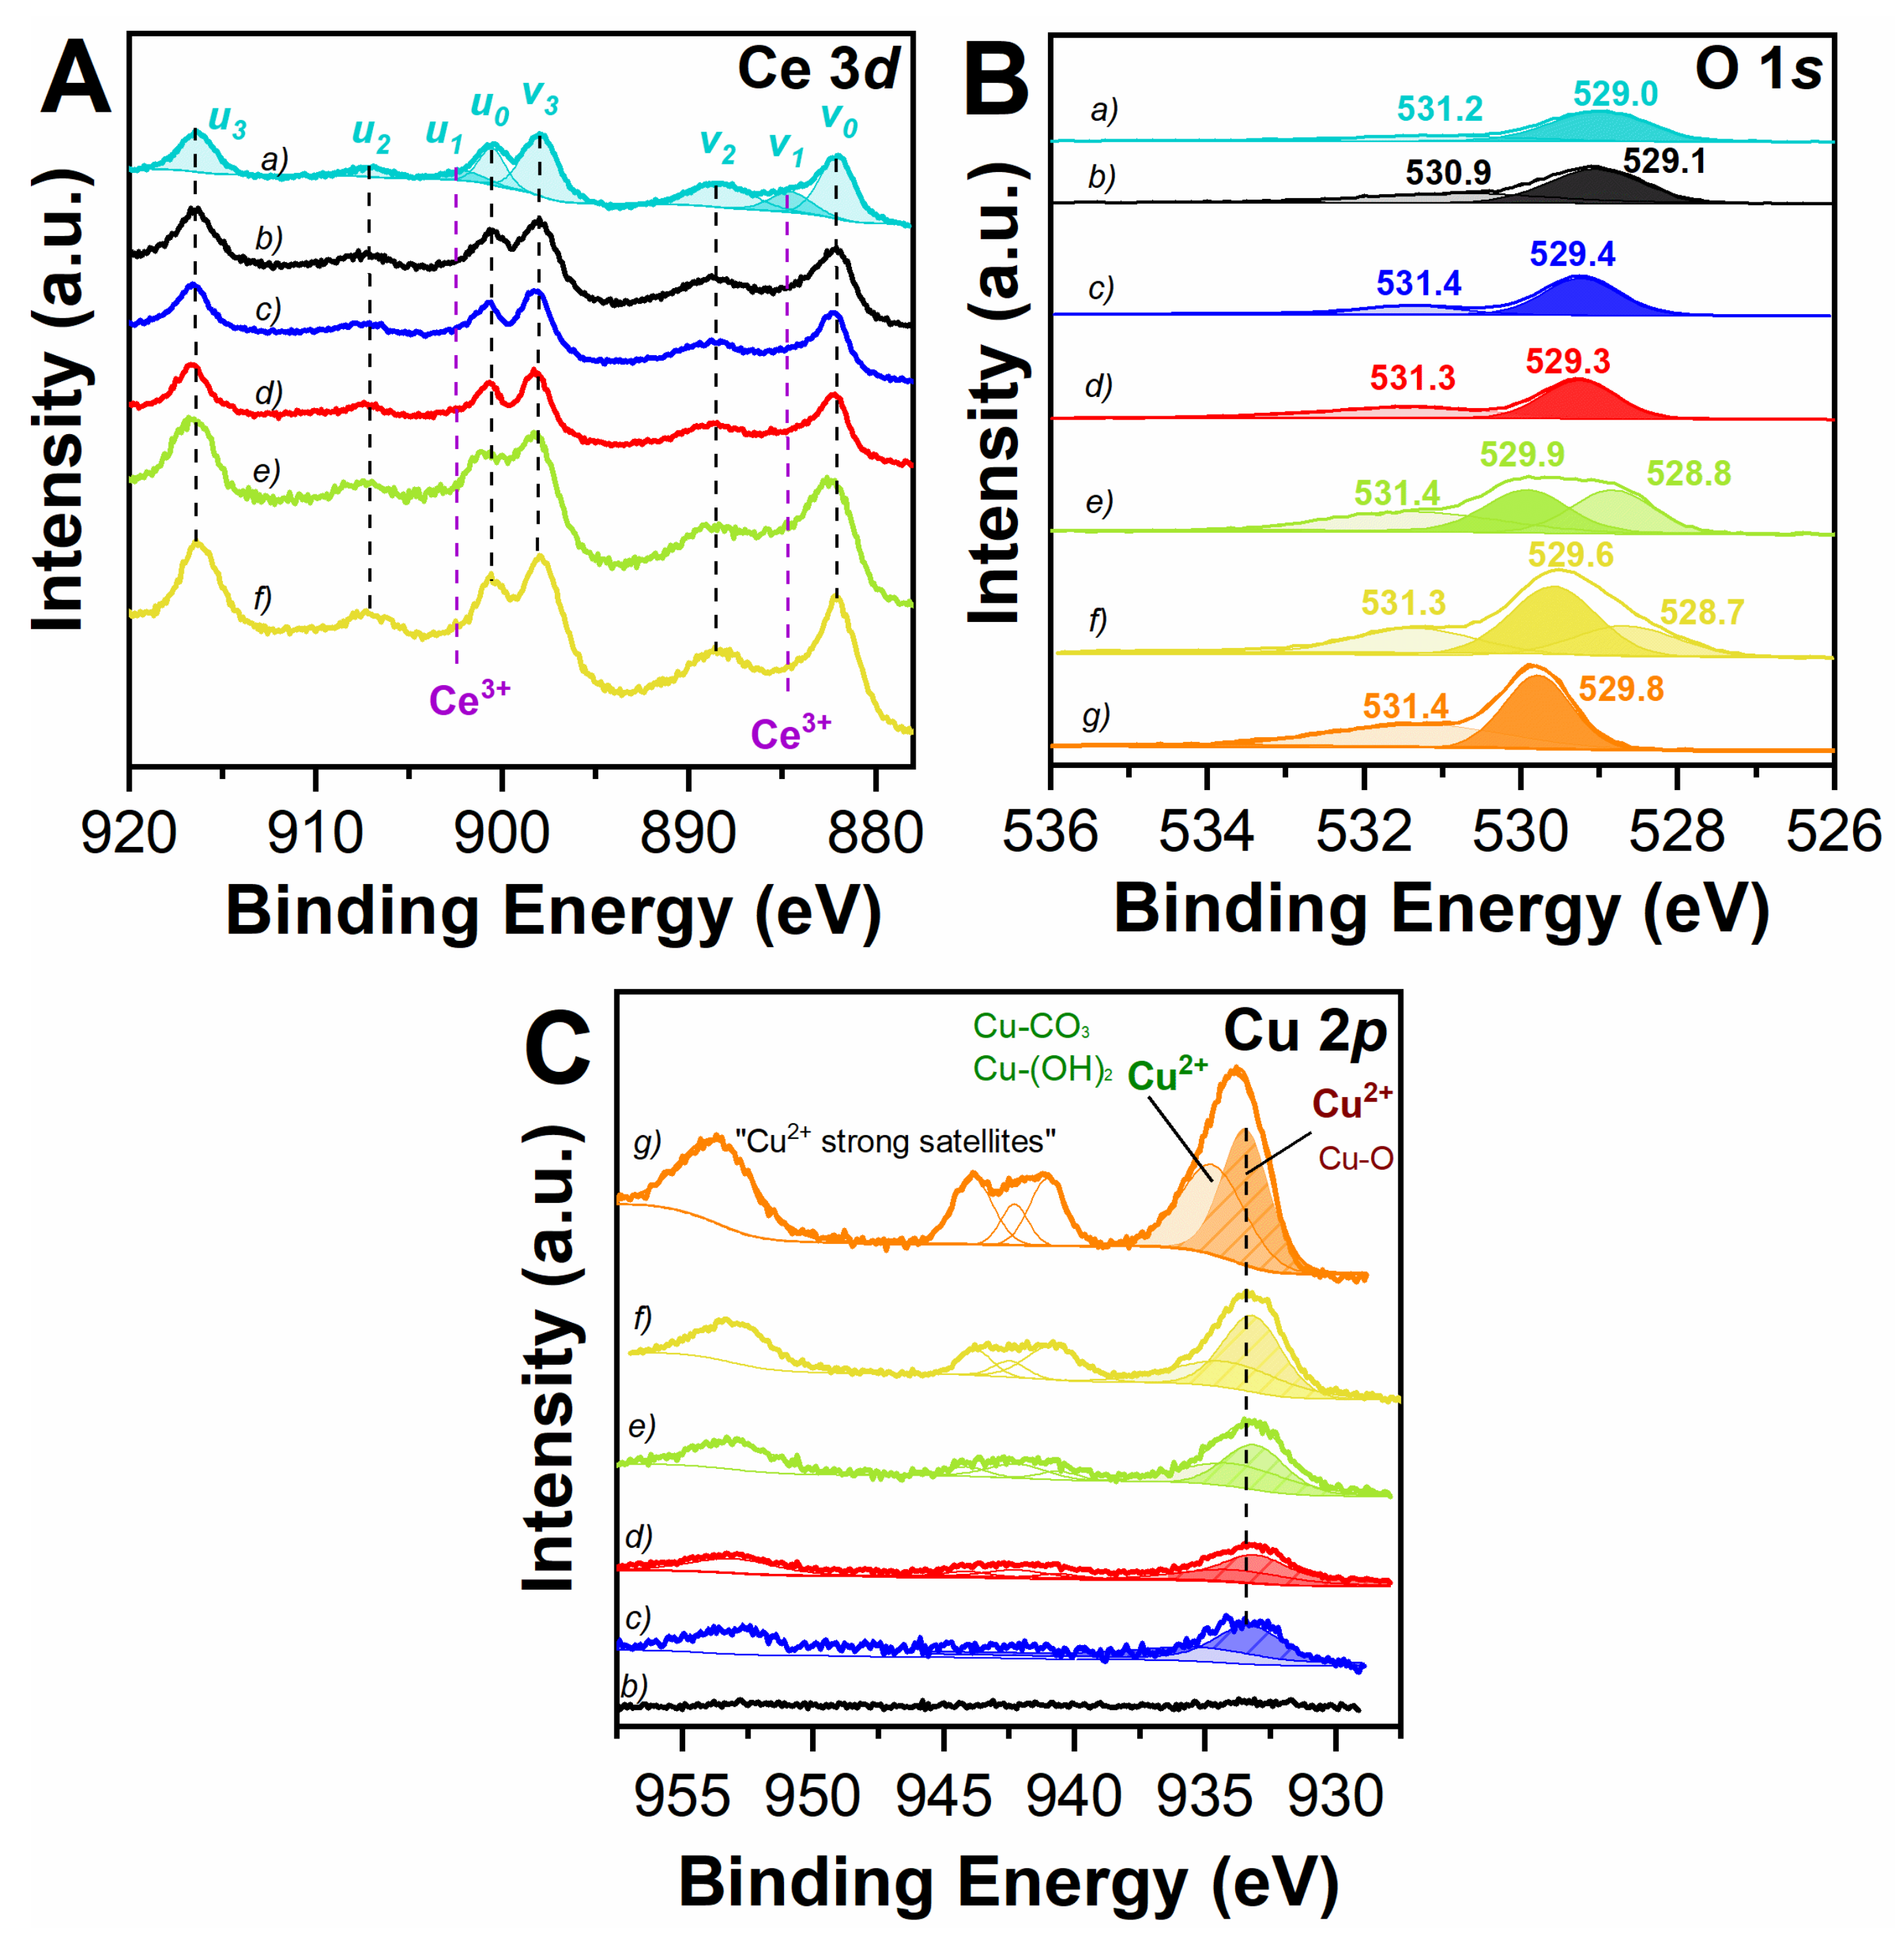
3.2.1. Surface Oxidation States

The oxidation state of the elements of interest and the surface species of the catalysts were investigated through XPS measurements. The Ce 3d, O 1s and Cu 2p spectra are reported in Figure 5, while the Cu LMM Auger spectra are shown in Figure S3.
The Ce 3d core levels are reported in Figure 5A, which shows the different u and v peaks corresponding to 3d3/2 and 3d5/2 spin orbital, respectively. The Ce3+ amount was estimated by the deconvolution of the u1 and v1 peaks, while the amount of Ce4+ was evaluated by the deconvolution of u0, v0, u2, v2, u3 and v3 peaks [17,18,31]. The relative amounts of Ce3+ and Ce4+ are reported in Table 3. The 10%CuCeOx and 20%CuCeOx samples exhibit the highest Ce3+ amount, namely 25 and 26 at.%, respectively.
The O 1s core levels are displayed in Figure 5B. Each O 1s spectrum is characterized by two peaks: the one at higher binding energy (BE) which is related to chemisorbed oxygen, Oα (O22−, carbonates, O or OH), while the one at lower binding energy is due to lattice oxygen, Oβ (O2− of the Ce-O bonds) [17,31,54,74,75]. The relative abundance of the Oα and Oβ species is reported in Table 4. Interestingly, when the Cu content increases, two different Oβ species can be noticed, due to the simultaneous presence of two different oxides, CeO2 and CuO. This is clearly evident for the 30%CuCeOx and 60%CuCeOx samples (Figure 5B, curves e and f): the two Oβ peaks can be ascribed to Cu-O (529.6–529.9 eV) and Ce-O (528.7–528.8 eV). Moreover, when the Cu content increases, the Oβ peak generally becomes more intense [74,75,76,77,78]. Furthermore, the Oα-to-Oβ ratio was calculated and reported in Table 4. Interestingly, the 20%CuCeOx sample exhibits the highest ratio, namely, 0.67, possibly due to the higher content of structural defects (vide Raman) [79]. The presence of abundant Oα may enhance the reactivity during the oxidation reactions since these oxygen species, namely, O22−, carbonates, O or OH, are more reactive compared to bulk oxygen [17,54,74,75].
The Cu 2p spectra are reported in Figure 5C. The most intense peak can be deconvoluted into two different Cu2+ species: the peak at lower binding energy is related to Cu-O bonds in the lattice, while Cu-CO3 or Cu-(OH)2 species bonded at the surface give a contribution at higher binding energy. The Cu LMM Auger spectra are reported in Figure S3. The Auger peaks are centered in the range 917.0–917.7 eV, thus confirming the presence of Cu2+ species in the CuO phase and the absence of Cu metallic phase which could be ascribed to the presence of possible alloy [74,77,78].

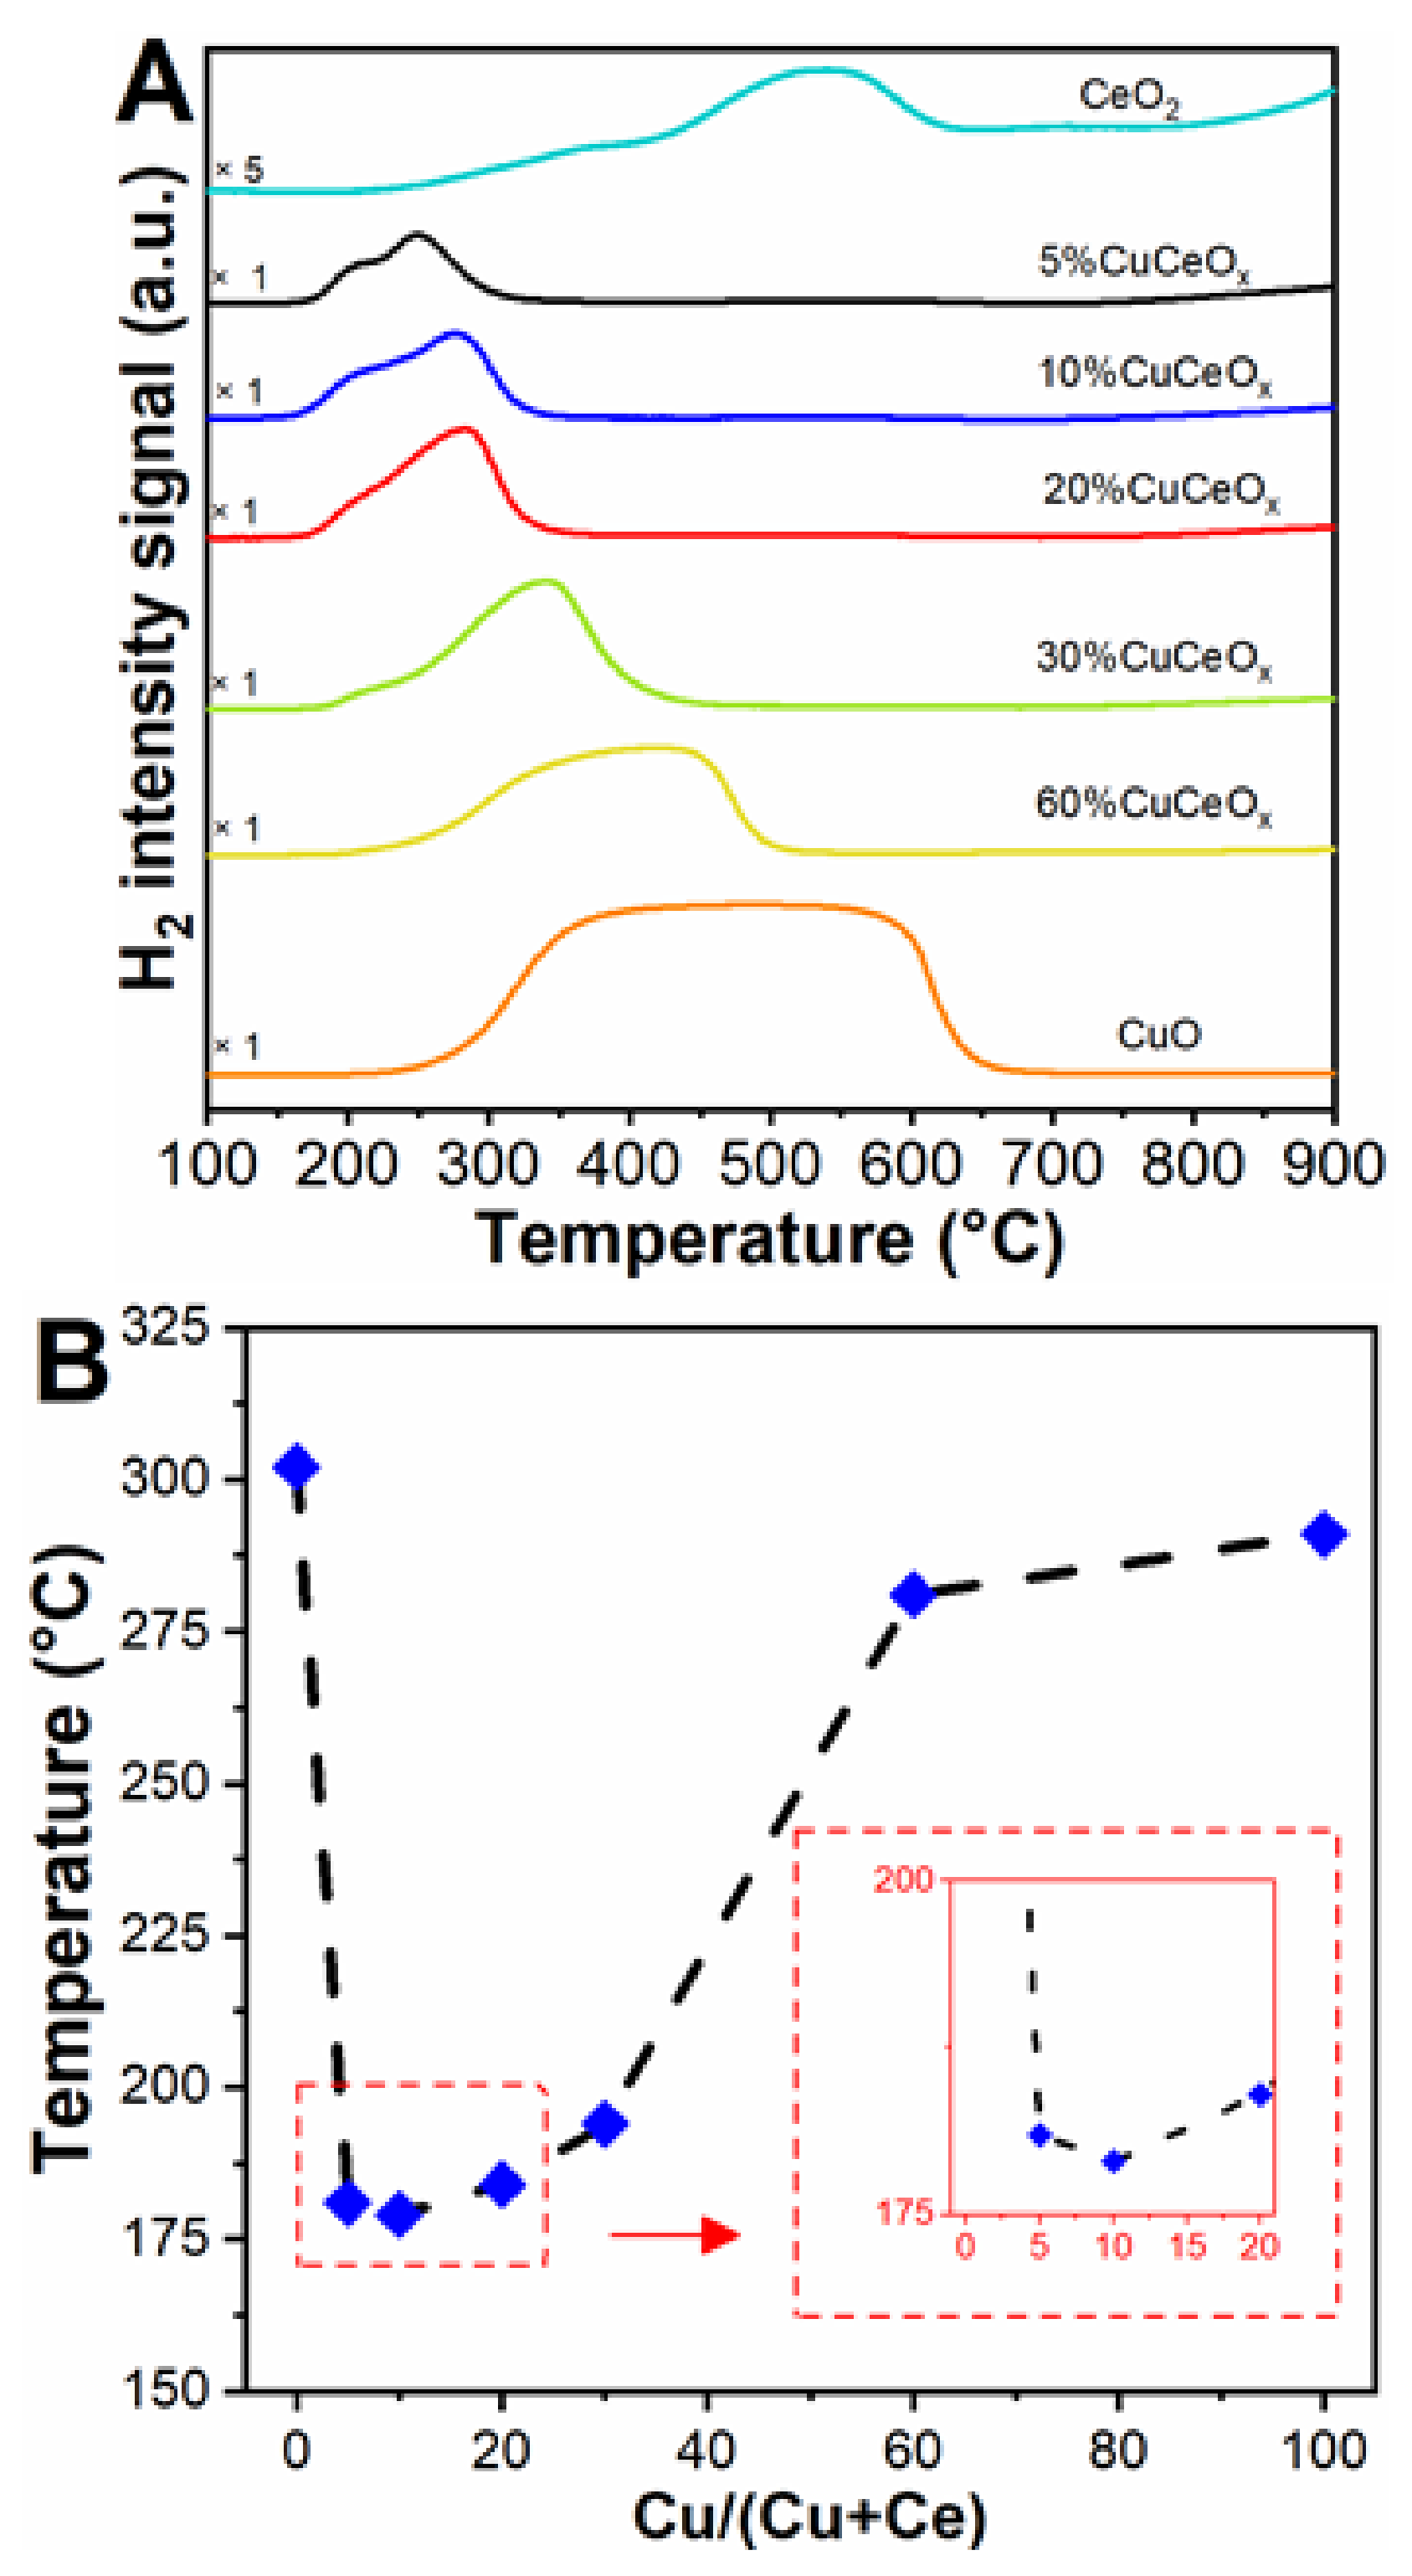
3.2.2. Reducibility Tests

The H2-TPR measurement was performed in order to investigate the reducibility of the CuCeOx catalysts and the obtained profiles are reported in Figure 6A. Pure ceria is characterized by a side peak in the 300–400 °C range which can be attributed to the reduction of chemisorbed oxygen species (i.e., carbonates) that are feebly attached to the catalyst surface [80,81,82]. Furthermore, a main reduction peak is centered at 540 °C and it is due to the reduction of surface Ce4+ species [17,18,54,83]. Finally, the signal occurring at higher temperatures (T > 600 °C) can be attributed to the reduction of Ce4+ in the bulk [17,18,54,80,81,82,83].
The samples containing a Cu loading between 5 and 60 wt.% exhibit two convoluted reduction peaks in the 150–500 °C range, as shown in Figure 6A. As a whole, the reduction of these CuCeOx catalysts occurs at lower temperatures comparing with pure CeO2. Thus, the reducibility of these samples was enhanced by the presence of CuO alongside CeO2 phase. According to the literature, the first low temperature peak was attributed to the reduction of Ce-O-Cu species, while the second one was assigned to the reduction of small CuO clusters interacting with CeO2 [17,18,34,74,80,83,84]. Moreover, when the copper loading increases, the second peak shifts towards higher temperatures and this phenomenon may be related to the larger CuO particles. Figure 6B displays the trend of the position of the Tonset reduction peaks as a function of the Cu content. The following trend for the surface reducibility can be outlined: 10%CuCeOx < 5%CuCeOx < 20%CuCeOx < 30%CuCeOx < 60%CuCeOx < CuO < CeO2.
Table 5 reports the hydrogen uptakes measured during the H2-TPR analysis. As a whole, the higher the Cu content, the higher the H2 consumption. Moreover, the H2-to-Cu consumption ratio was estimated and reported in Table 5. This value corresponds to the ratio between the H2 consumed during the TPR analysis and the stoichiometric amount of H2 required to reduce the Cu2+ species contained in the samples. Notably, the CuCeOx catalysts present higher H2-to-Cu consumption with respect to pure CuO, indicating that the Cu2+ reduction is accompanied by the reduction of Ce4+ to Ce3+ [17].

3.3. Catalytic Activity

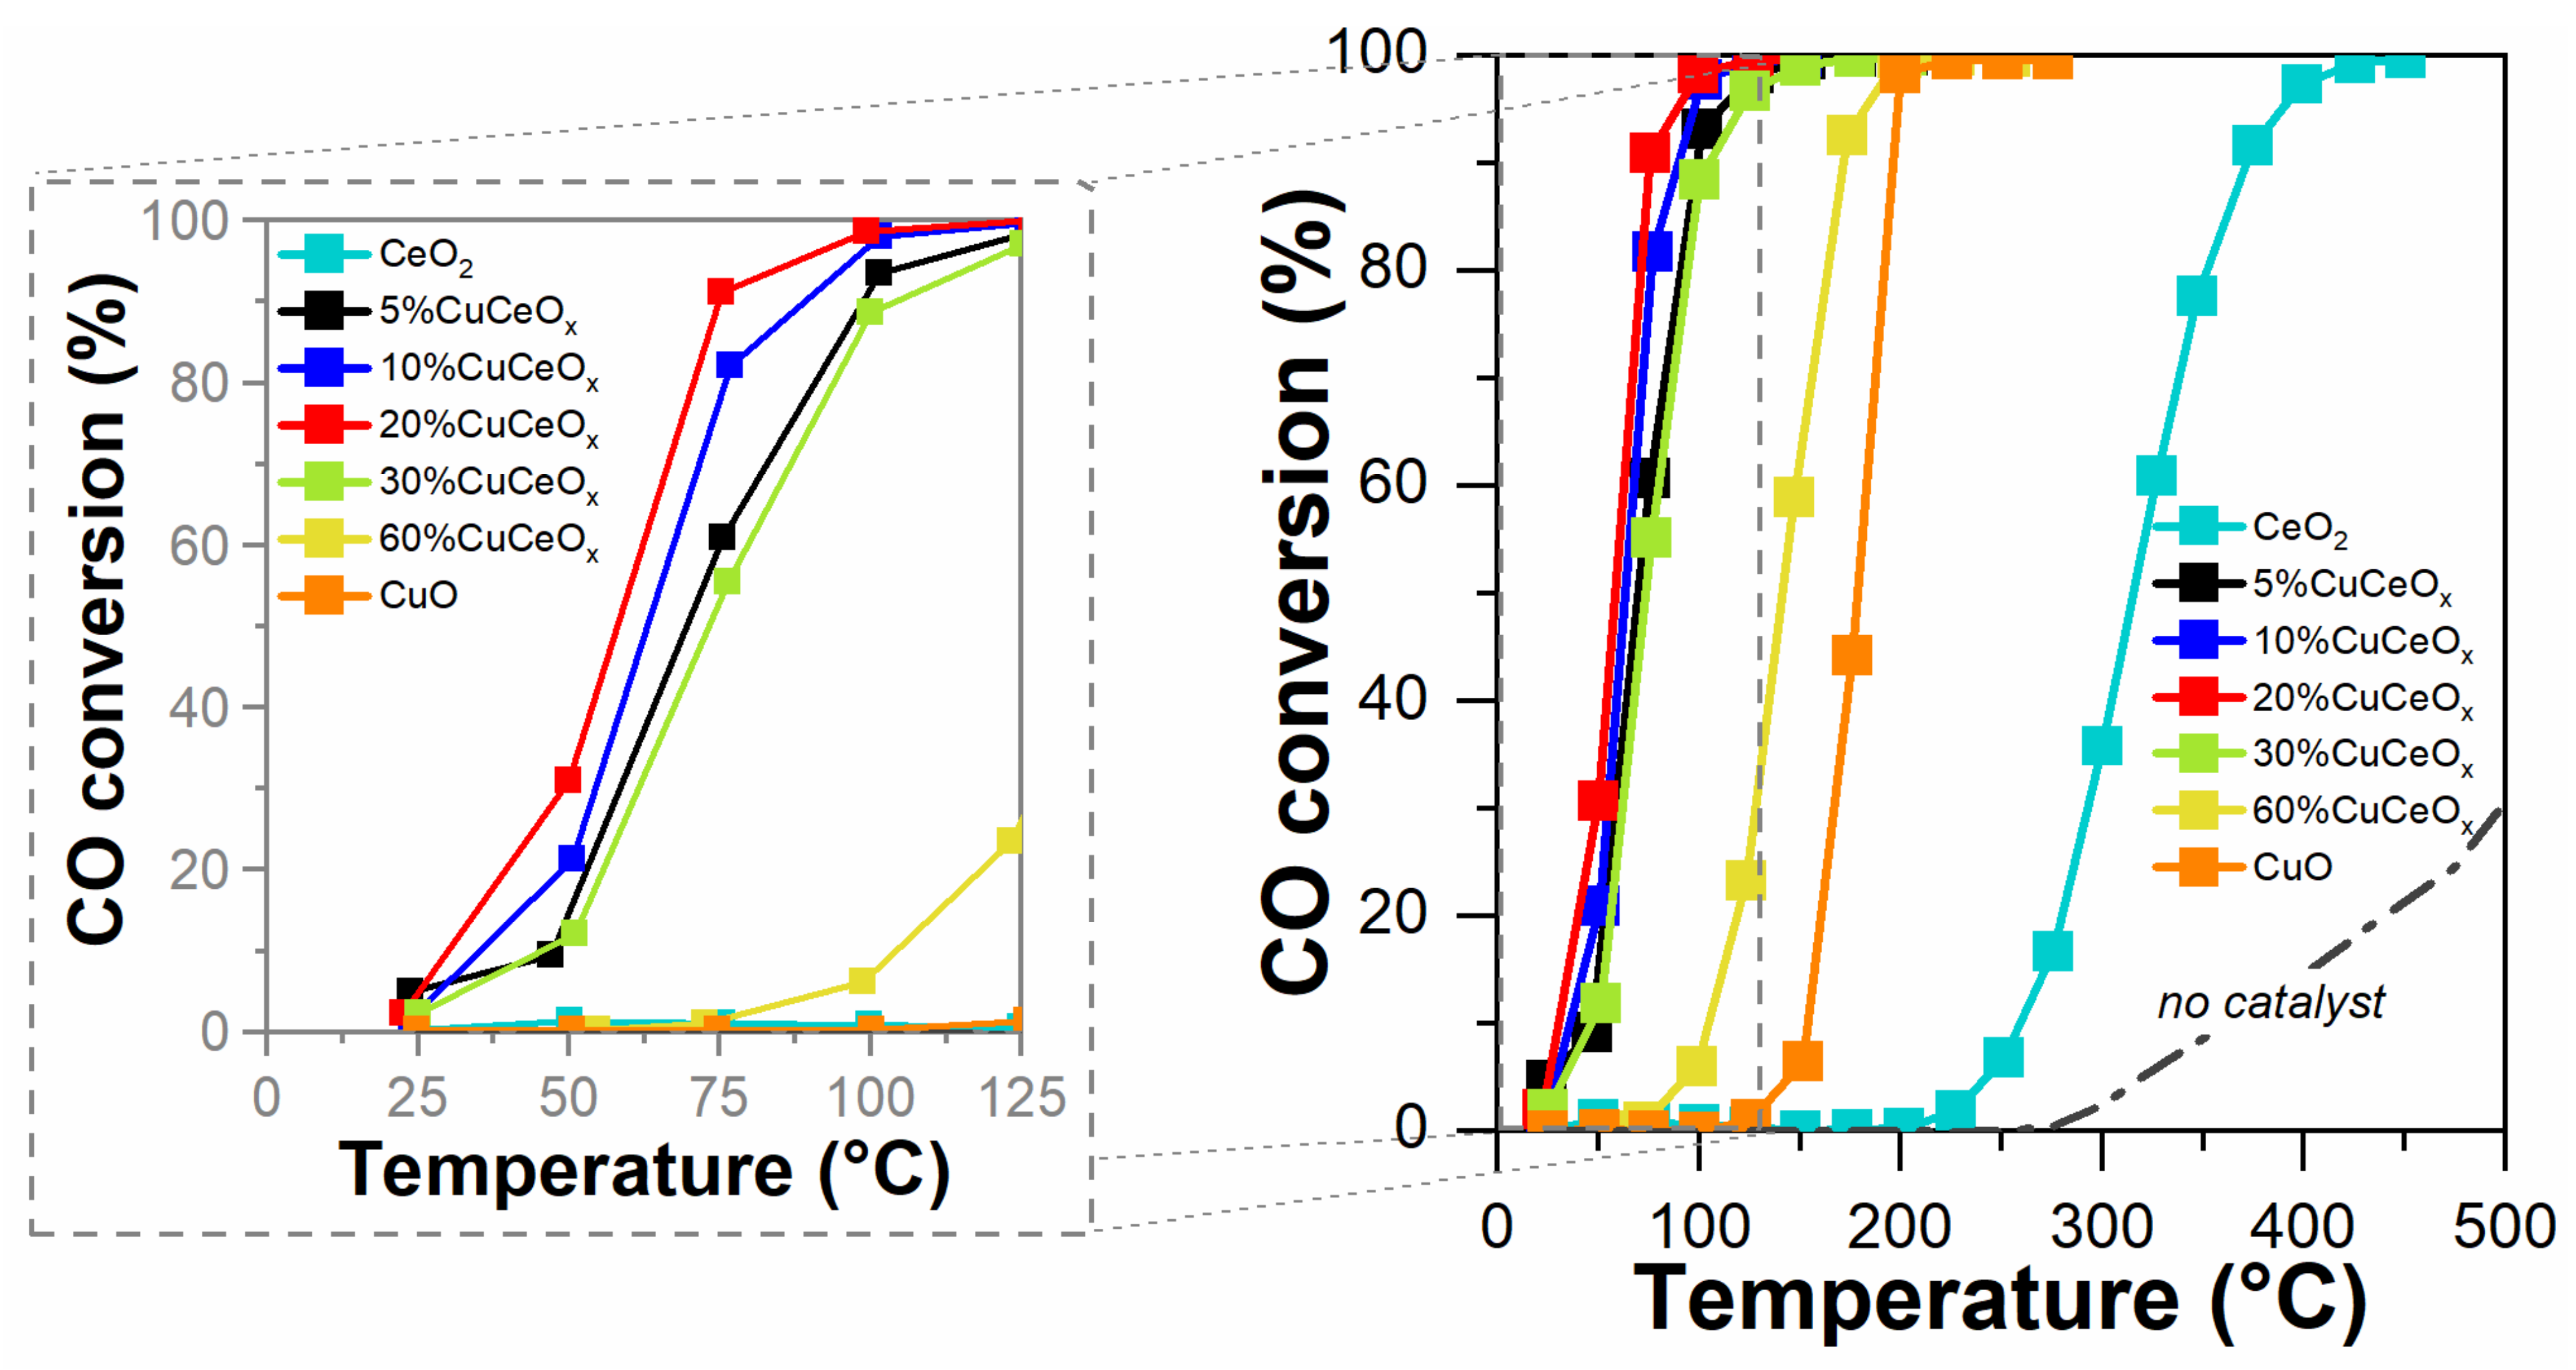
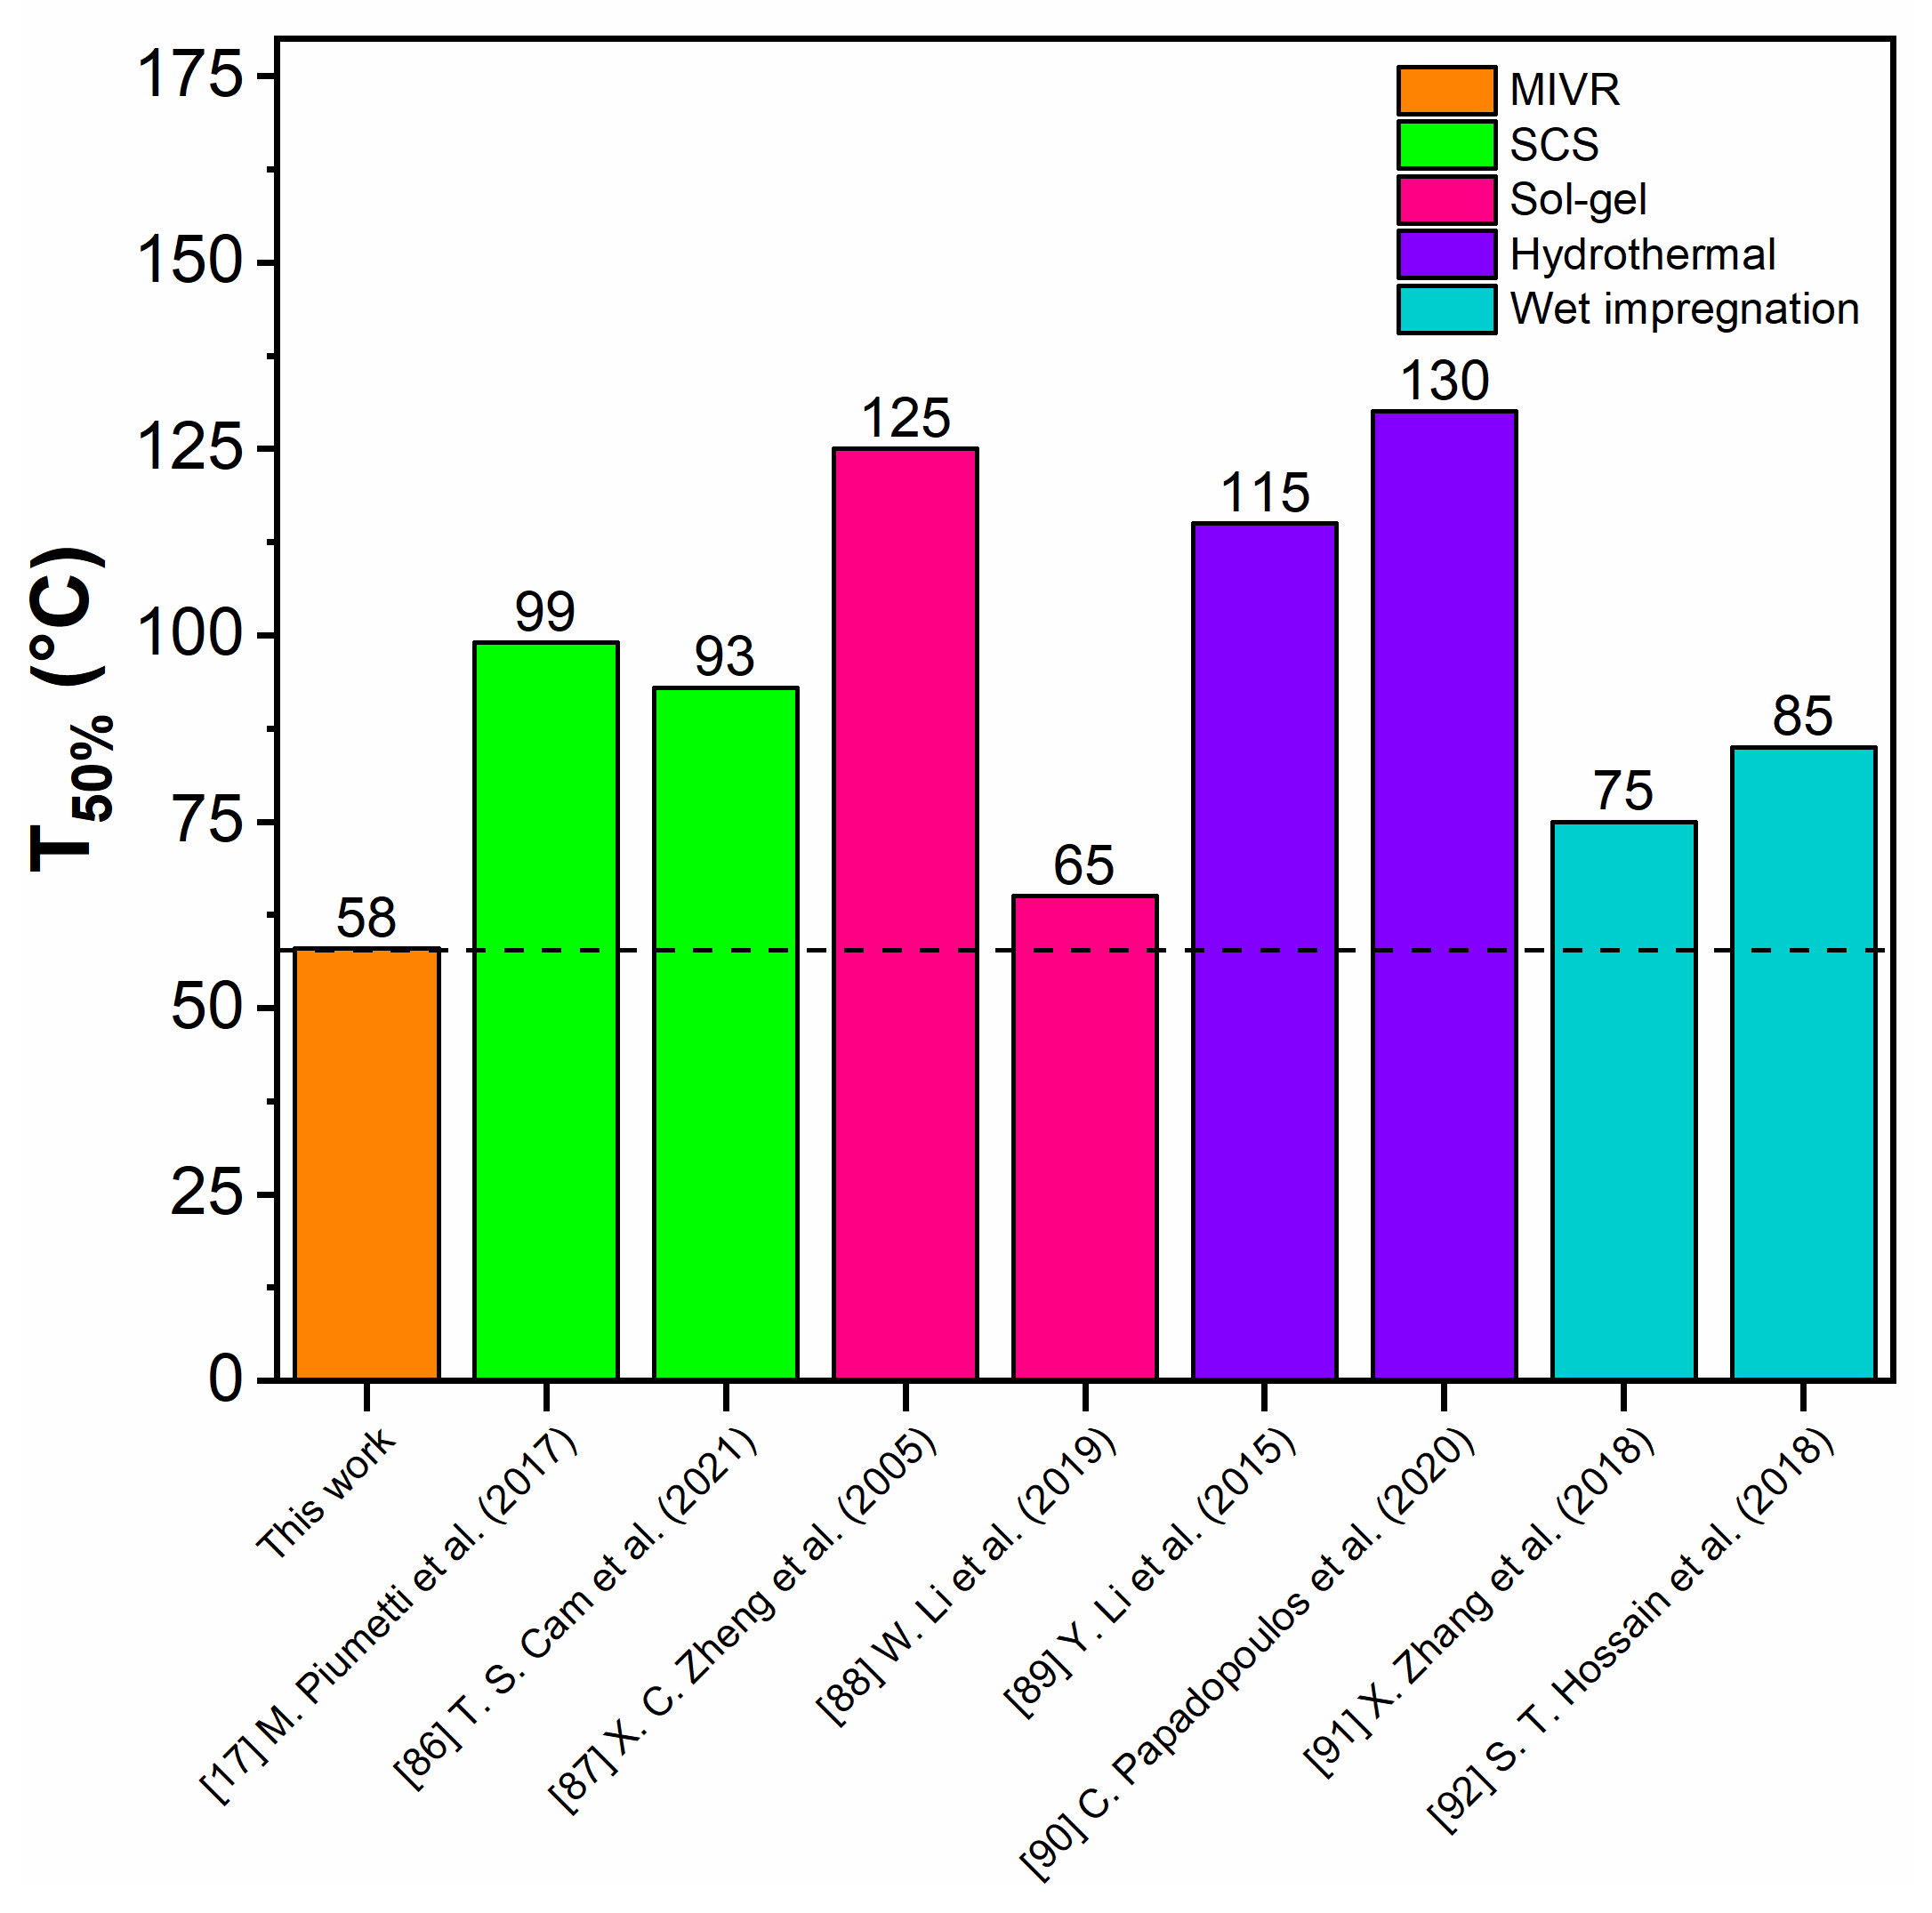
3.3.1. CO Oxidation Reaction

The results of the CO oxidation tests are shown in Figure 7. The CO conversion (%) is reported as a function of the temperature and the catalytic tests were compared with the non-catalytic one (labeled as “no-catalyst”). The red graph displays a magnification in the range between 0 and 125 °C for a better comprehension. Moreover, Table 6 reports the temperatures at which the catalysts convert the 10, 50 or 90% of CO (T10%, T50% and T90%, respectively) and the CO oxidation rates (µmol h−1 g−1) evaluated at 50 °C.
As a whole, all the samples exhibit good catalytic performances comparing to the thermal CO oxidation (no catalyst). Interestingly, the most performing sample is 20%CuCeOx: in fact, the CO complete oxidation occurs at 125 °C in the presence of this catalyst. On the other hand, pure CeO2 presents the worst performance. In detail, as can be seen in Figure 7, the catalytic activity follows this increasing reaction order: CeO2 < CuO < 60%CuCeOx < 30%CuCeOx < 5%CuCeOx < 10%CuCeOx < 20%CuCeOx.
In order to explain the good catalytic performance of the 20%CuCeOx sample, Figure 8 reports the values of Oα abundancy (at.%), Ce3+ abundancy (at.%), D/F2g ratio and the CO oxidation rate (µmol h−1 g−1) as a function of the Cu content (wt.%). As a whole, a good correspondence was found among the trends of all these parameters. In particular, the Pearson correlation coefficients (reported in Table S2) point out that the catalytic activity for CO oxidation is primarily linked to the presence of reactive Oα species, followed by the quantity of structural defects and lastly by the abundance of Ce3+ ions.
Actually, defect sites and Ce3+ species are directly involved in the Mars–van Krevelen-type reaction mechanism. This mechanism implies the oxidation of CO by means of structural oxygen, leaving a defective site (i.e., an oxygen vacancy) that is then replenished (oxidized) by gas phase O2 [65,85]. Moreover, the Oα species, consisting of chemisorbed oxygen on the catalyst surface, are also highly reactive during the oxidation processes. Hence, the higher the amount of defects, Ce3+ and Oα species, the higher the oxidative performance of the catalyst.
Consequently, the 20%CuCeOx mixed oxide, which exhibits the largest quantity of defect sites, Oα and Ce3+ species, has the highest CO oxidation rate. The 5%CuCeOx and 10%CuCeOx samples exhibit similar reducibility properties to 20%CuCeOx (see Figure 6), but their lower abundancy of Oα, Ce3+ and structural defects is likely responsible for their slightly lower catalytic activity.
The CO oxidation performances of the 20%CuCeOx sample were compared with those of the most performing catalysts studied in references [17,86,87,88,89,90,91,92]. The latter research works deal with copper-cerium based catalysts synthesized by means of different co-precipitation techniques, such as Solution Combustion Synthesis (SCS) [17,86], Sol-gel [87,88], hydrothermal [89,90] and wet impregnation method [91,92]. The comparison, in terms of T50% for CO oxidation, is shown in Figure 9.
The 20%CuCeOx sample exhibits the lowest T50% (58 °C) comparing with the other Cu–Ce mixed catalysts. Then, a last comparison was performed with Pt/CeO2 catalysts studied in references [93,94,95] and it is possible to conclude the CuCeOx samples show good low-temperature CO oxidation activity compared with ceria-supported noble-metal. Thus, the MIVR method represents a promising synthesis procedure, since it enables to obtain CuCeOx nanocatalysts with very interesting physico-chemical and catalytic properties.
In order to investigate the effect of the co-presence of CeOx and CuxO phases, the CO oxidation rates listed in Table 6 are plotted in Figure 10 as a function of the Cu weight content. A growing trend could be observed for Cu doping ranging from 5 to 20 wt.%, while a decreasing one was noticed upon further Cu addition. As previously described, the sample containing the 20 wt.% of Cu exhibits the highest reaction rate (375 µmol h−1 g−1).
Moreover, Figure 10 shows a black dashed line representing the theoretical reaction rate of a mixture of completely non-interacting CeO2 and CuO phases. This hypothetical rate is defined by the following linear function (Equation (1)):
r i = r CeO 2 x CeO 2 + r CuO x CuO
where ri represents the theoretical reaction rate, rCeO2 and rCuO the reaction rates of cerium and copper oxide, respectively, while xCeO2 and xCuO are the mass fractions of cerium and copper oxide. In Figure 10, the red dashed line represents the actual trend of the reaction rates. Interestingly, for all the mixed samples, the real CO oxidation rates are above the theoretical ones (the black dashed line). Thus, a synergistic effect between the two active phases is occurring [96].
Similarly, the T10% was reported in Figure S4 as a function of the Cu wt.% content. The theoretical Ti value is represented by the following equation (Equation (2)):
T i = T CeO 2 x CeO 2 + T CuO x CuO
where Ti represents the theoretical T10%, TCeO2 and TCuO the T10% of cerium and copper oxide, respectively, while xCeO2 and xCuO are the mass fractions of cerium and copper oxide. It appears that the two oxide phases exhibit a positive collaboration in agreement with the results reported in terms of reaction rates (Figure 10).
In order to assess the stability of the most performing catalyst (20%CuCeOx), two consecutive CO oxidation tests were carried out, and the results are reported in Figure 11A. The 20%CuCeOx sample exhibits good catalytic stability since reproducible results were achieved after the two consecutive runs.
Moreover, another stability test was performed on this sample and reported in Figure 11B. During this test, the T50% and T95% were chosen and alternated for two consecutive cycles as follows:
  • First cycle: the starting temperature was fixed to 89 °C, at which the catalyst exhibits a CO conversion of about 95% and this temperature was kept constant for 2 h. Then, the catalytic system was cooled down until 58 °C (T50%) and it was kept constant for other 2 h. After that, the temperature was increased until 89 °C. Hence, the first cycle is characterized by a Time-on-Stream (TOS) of about 5 h.
  • Second cycle: the same as the first one.
As a whole, the 20%CuCeOx catalyst is able to reach, during the second cycle, the same conversion achieved during the first one. It is therefore possible to that the 20%CuCeOx catalyst exhibits not only a notable activity but also good stability properties since, after two cycles, its performance is fully preserved.

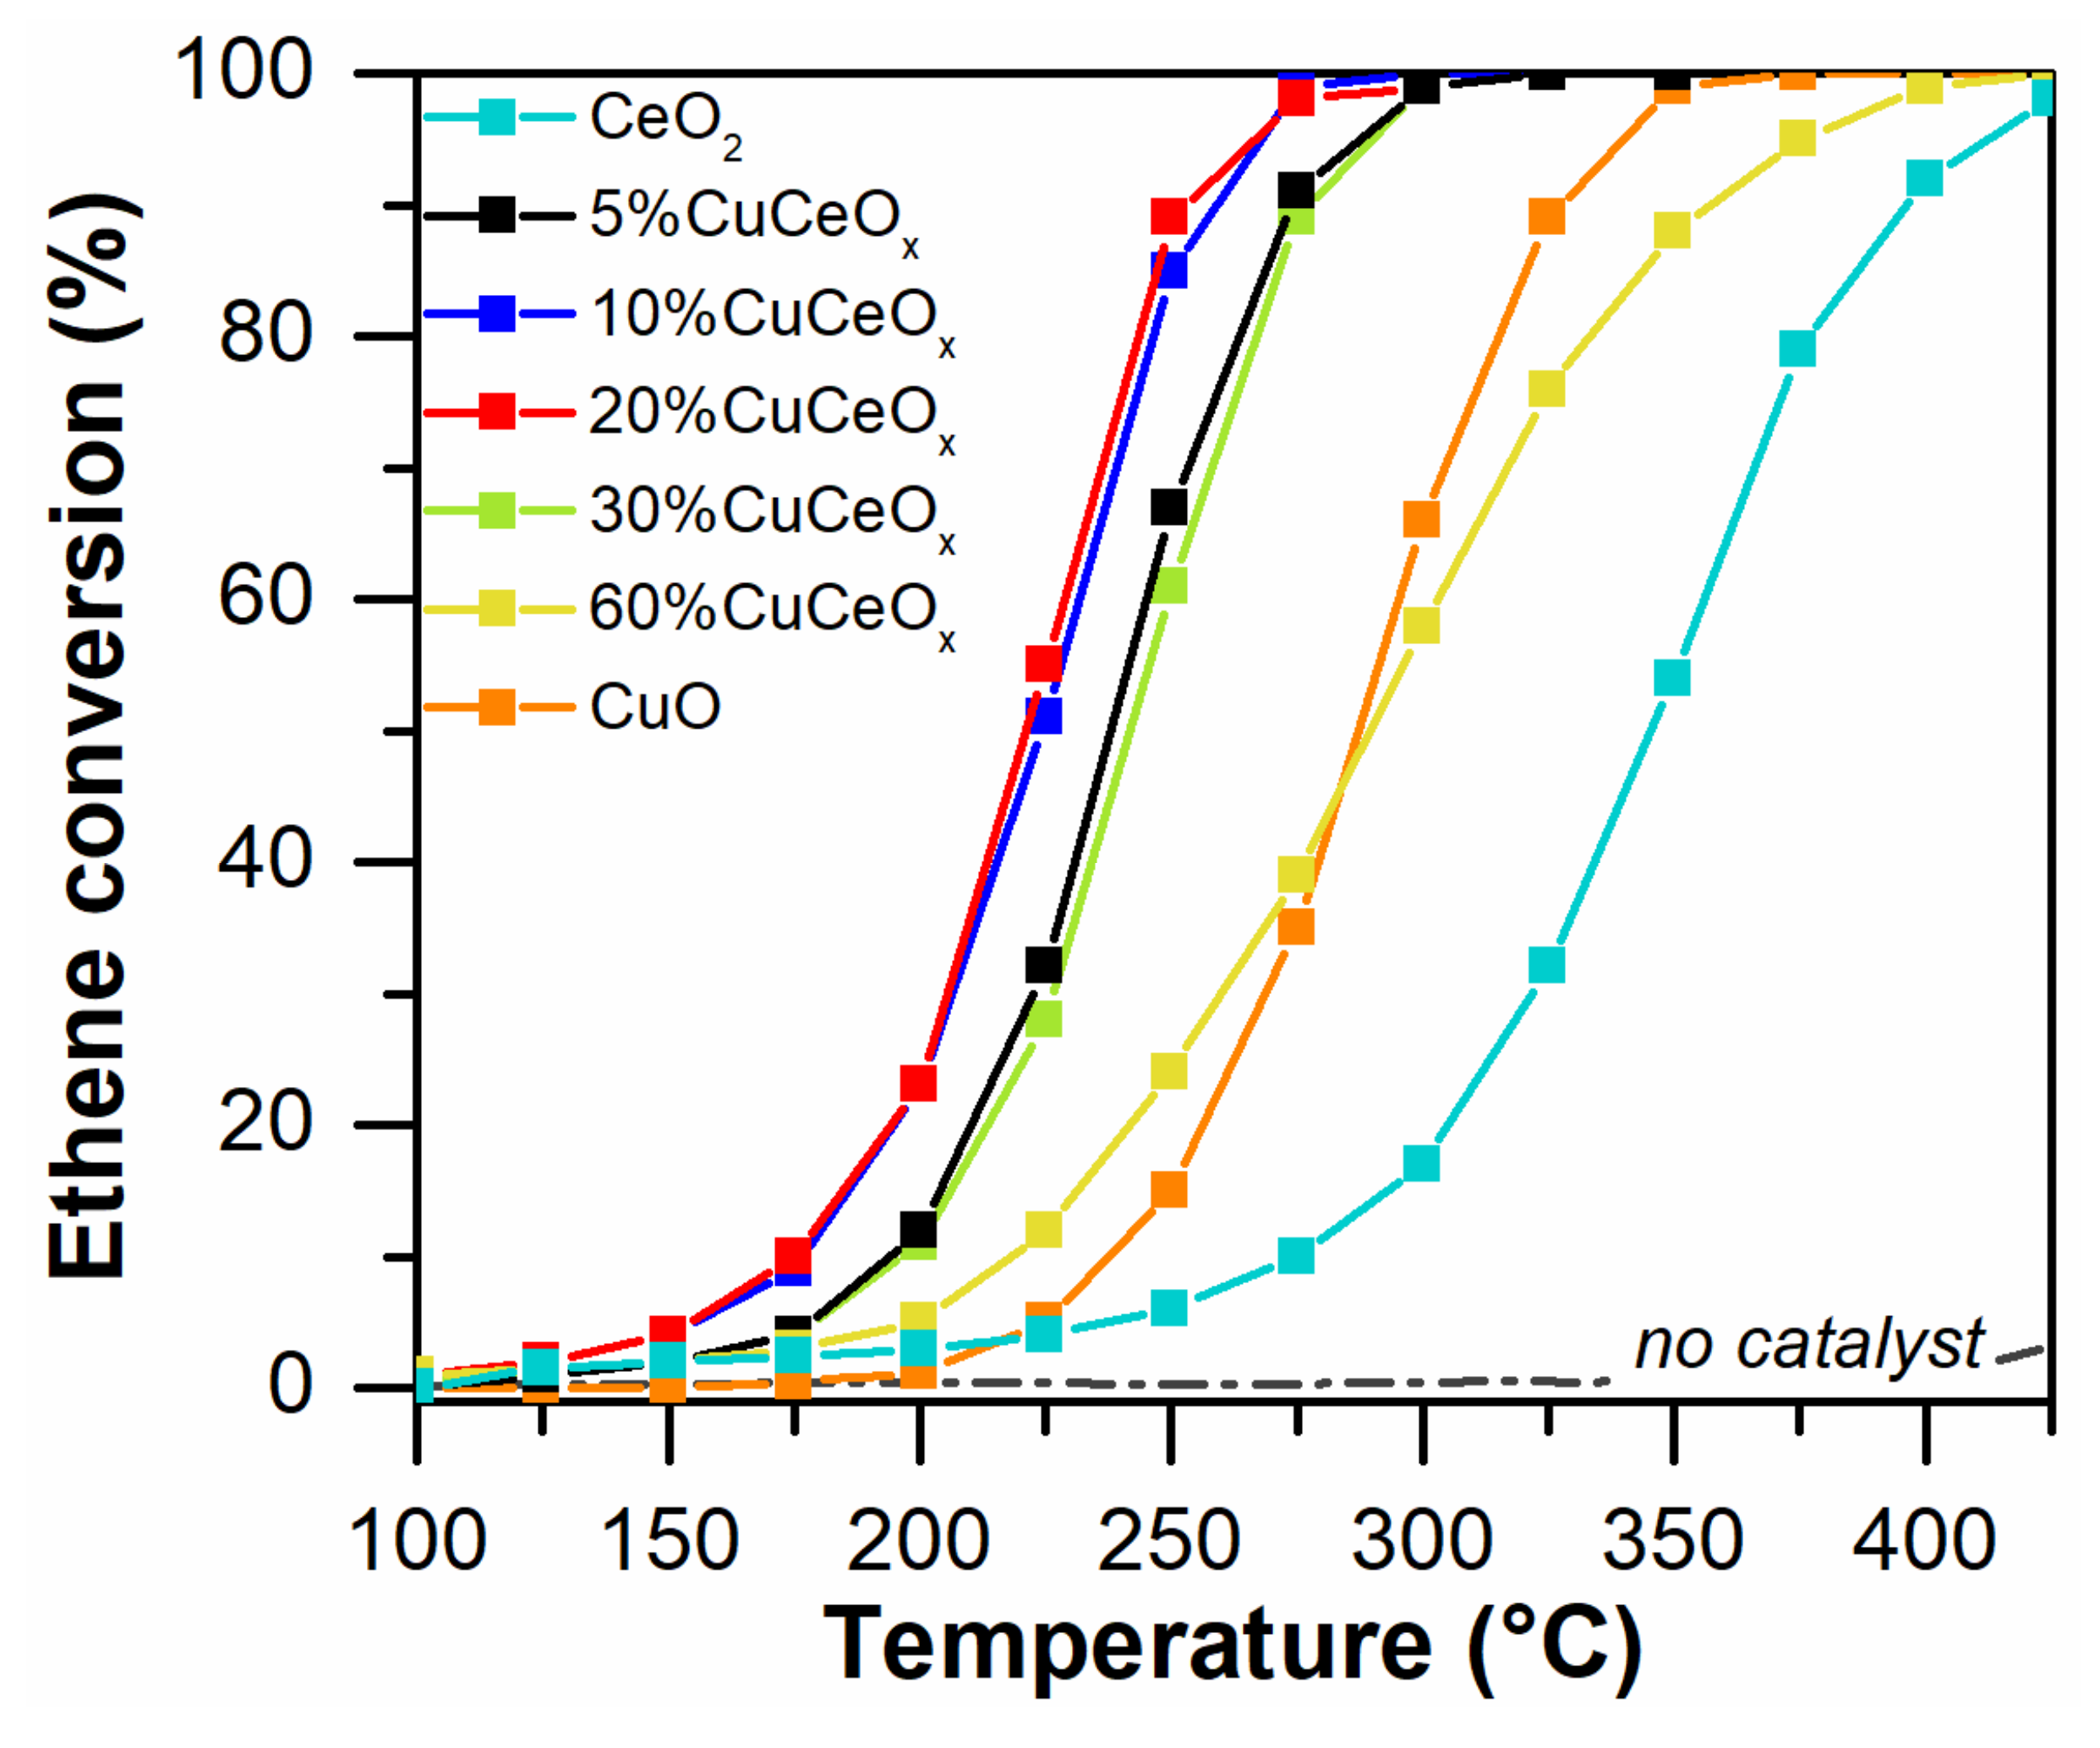
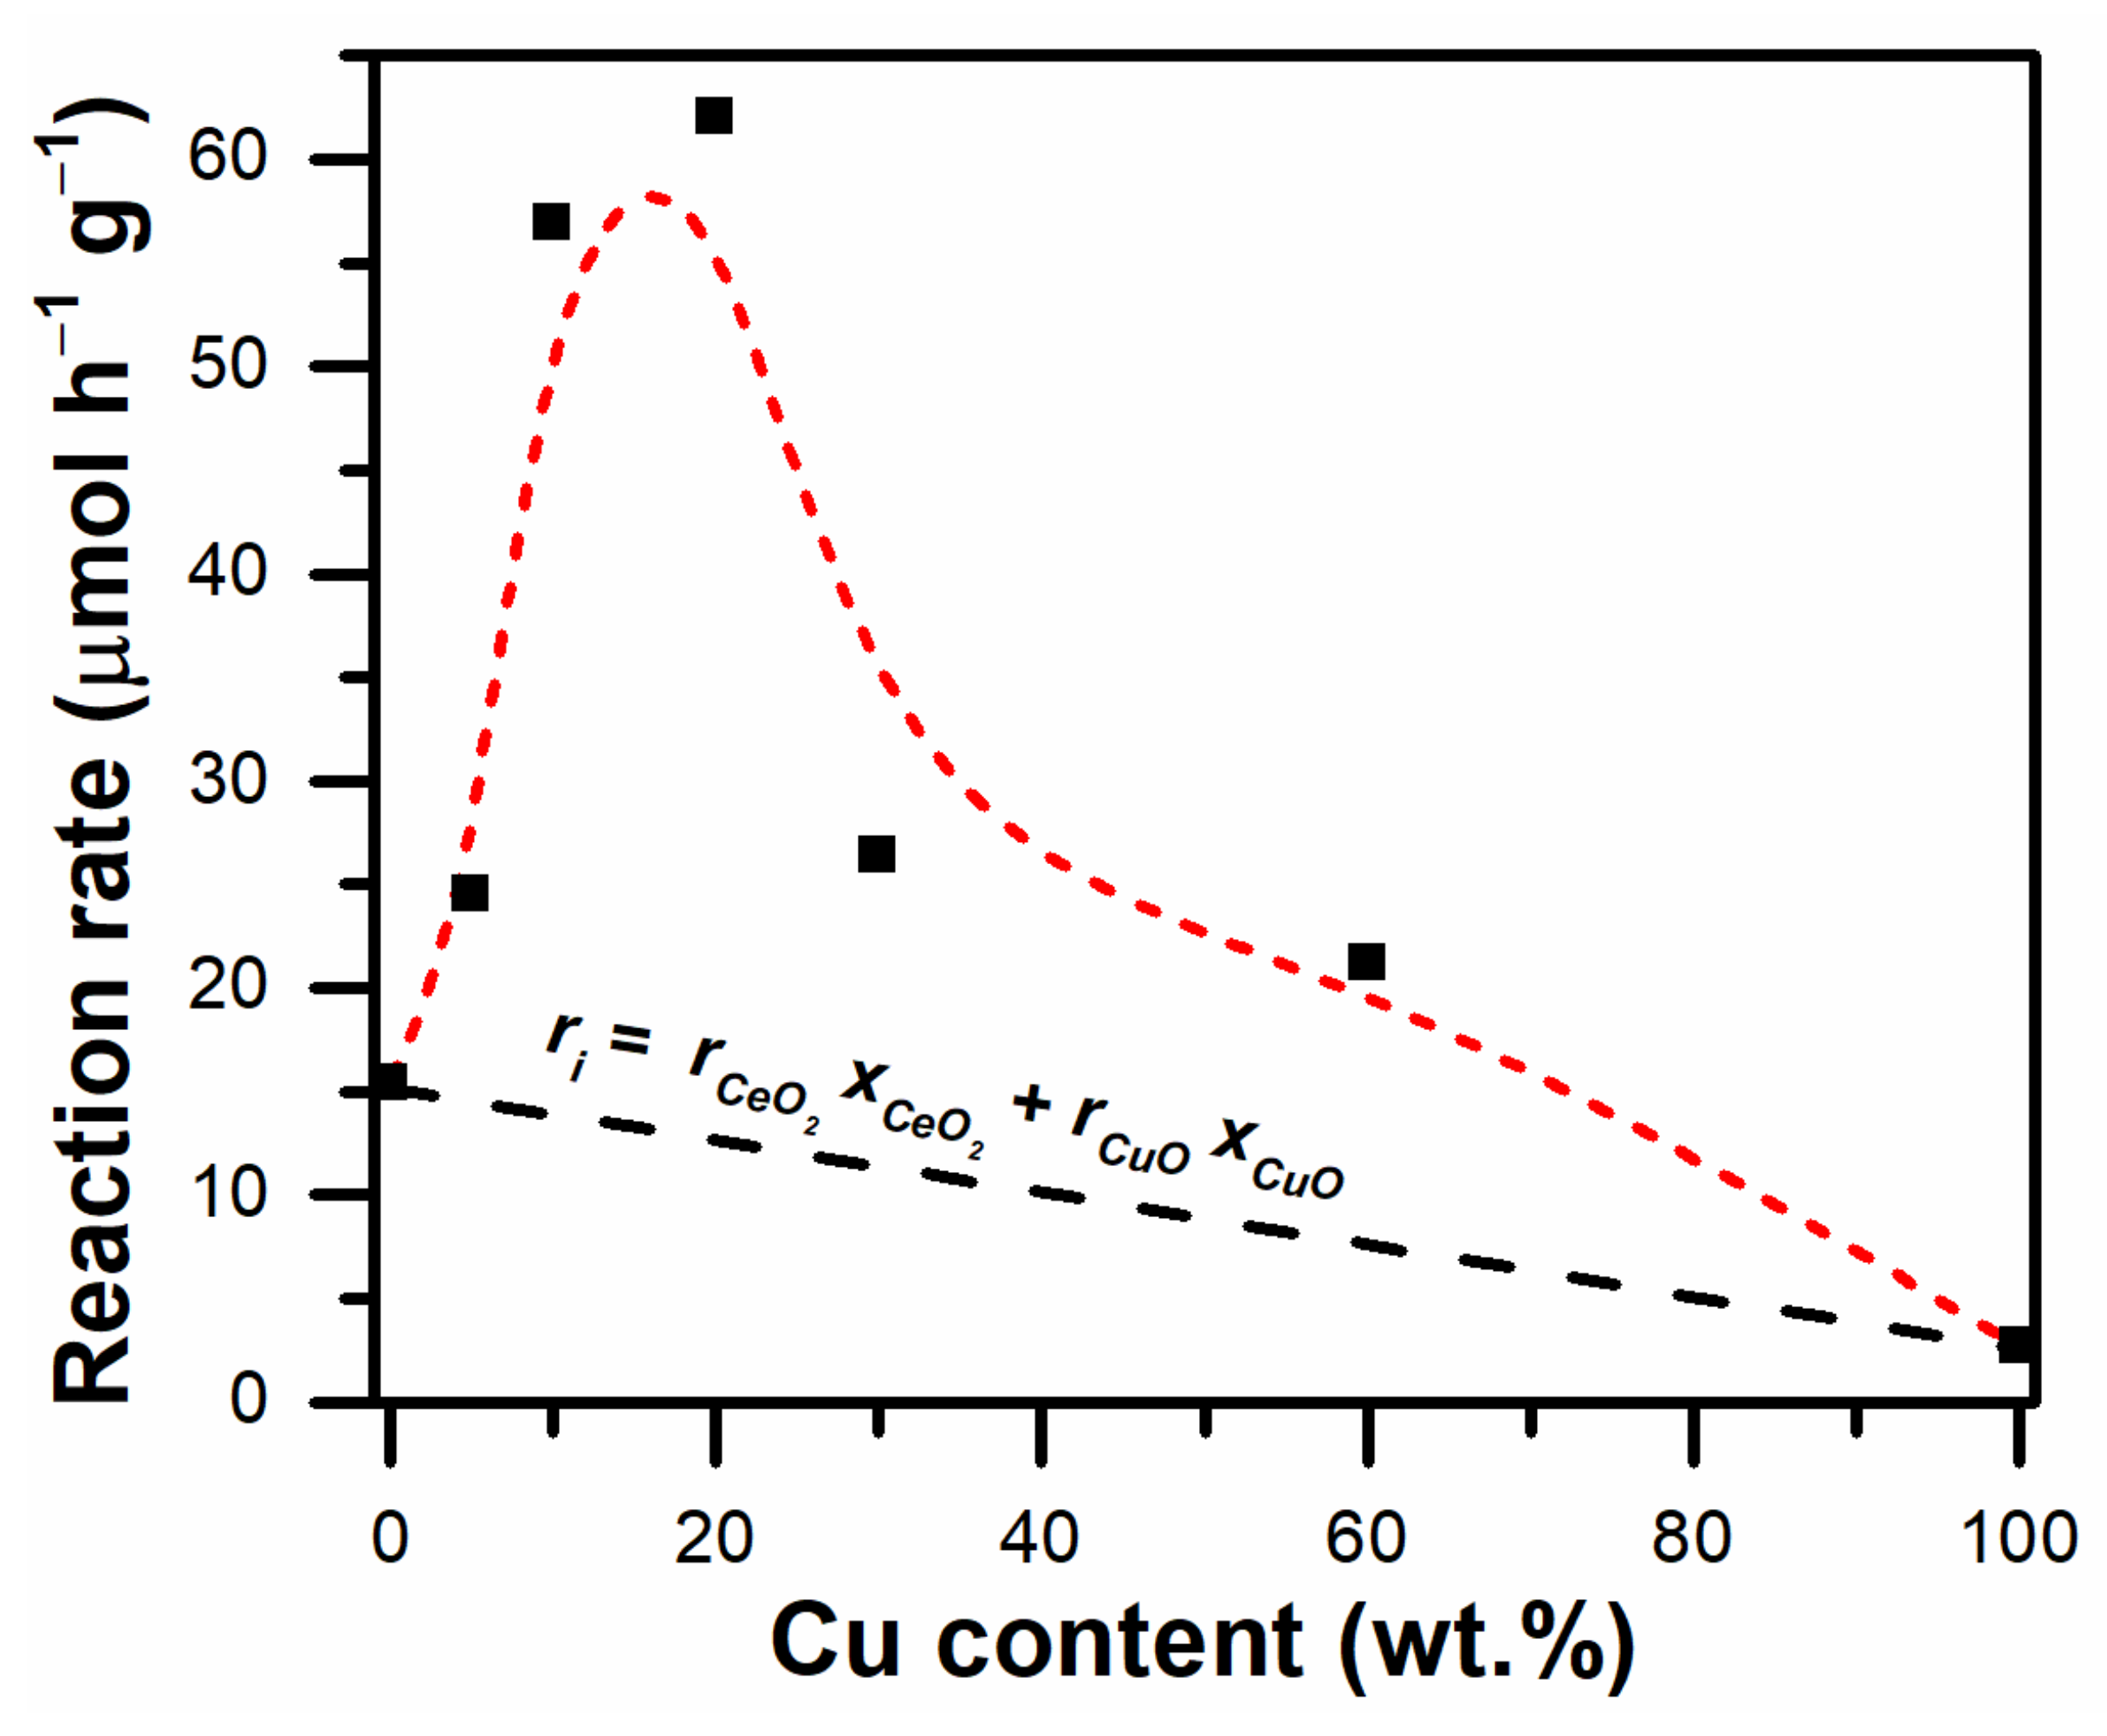
3.3.2. Ethene Oxidation Reaction

The catalytic performances of the synthesized materials measured during the catalytic oxidation of ethene are displayed in Figure 12. The presence of the prepared catalysts allowed the conversion of ethene at lower temperatures, compared to those of the blank test (i.e., the test where no catalyst was present).
Consistently, the catalytic improvement is confirmed by the rates of the ethene oxidation reaction calculated at 175 °C, as included in Table 7. As a whole, considering the catalytic performances reported in Figure 12, a catalytic activity trend for the CuCeOx samples can be outlined, as follows: 20%CuCeOx > 10%CuCeOx > 5%CuCeOx > 30%CuCeOx > 60%CuCeOx.
The catalyst containing the lowest loading of Cu (i.e., 5%CuCeOx) evidenced an overall improved catalytic performance compared to the parent CeO2, thus highlighting the beneficial effect of incorporating Cu species in the ceria structure (as observed in XRD and Raman analyses). Interestingly, an enhancement of the reaction rate was observed for the prepared set of mixed oxide catalysts (see Figure 13).
As observed in Figure 13, the ethene oxidation rates were in all cases above the theoretical (linear) trend drawn between CeO2 and CuO (see black dashed line). The mentioned baseline represents an ideal estimation of the reaction rate as if it depended only on the relative amounts of non-interacting CeO2 and CuO in a mixed sample, as reported in Equation (1) of Section 3.3.1.
Consistently, the increased reaction rates verified for the whole set of mixed oxides (compared to the ideal behavior) evidence that beneficial interactions are taking place between the active components present in the catalysts. Moreover, this result is supported by the trend observed in Figure S5 for the temperatures needed for converting 10% of the ethene present in the gaseous stream (i.e., the T10% parameter). In fact, this improvement coincides with the contemporary presence of small CuO crystallites along with CeO2 in the catalysts (as demonstrated by means of XRD, vide supra). In this sense, the overall catalytic performance varies (in terms of ethene reaction rate and T10%) as a function of the size of CuO crystallites (as reported in Figure S6) and evidenced the following: the smaller the size of CuO crystallites in contact with CeO2, the better the catalytic performance in ethene oxidation.
Moreover, there is a positive correlation between the catalytic activity and some physico-chemical properties, namely, the amount of defect sites (vide Raman spectroscopy) and the Oα/Oβ ratio (vide XPS). The catalytic behavior (in terms of TX%), as a function of the aforementioned properties is reported in Figure S7. Accordingly, the trends evidence that the higher the amount of Oα species and lattice defects, the better the catalytic performance. As well, XPS revealed that the most active catalysts (i.e., the 20%CuCeOx followed by the 10%CuCeOx) contained elevated amounts of Ce3+ species (see Table 3).
This complex scenario evidences that synergistic interactions are most likely taking place between CuO and CeO2 and leading to a marked improvement of the catalytic oxidation of ethene (Figure 13). As reported in the literature, smaller particles may contain a higher number of crystal edges and corners, and thus an increased number of structural defects and reactive sites that may improve the catalytic performance [97]. On the other hand, electrophilic Oα species are highly active in the oxidation of hydrocarbons [16,98,99]. Consistently, the elevated amounts of active Oα species (that can participate in spillover phenomena between CeO2–CuO phases) could contribute to the catalytic activity of the ceria-based catalysts prepared in this work. Moreover, the results highlight the positive effect of defective sites for the ethene catalytic oxidation reaction.
Similarly to CO oxidation, the catalytic oxidation of VOCs over ceria-based materials could also be modeled as a redox process occurring at the catalytic surface known as Mars–van Krevelen reaction mechanism [100,101]. However, the literature highlights the complexity of VOCs oxidation mechanism over oxide catalysts, as a function of the nature of the reactant molecules and of the catalytic materials [100,101,102,103].

4. Conclusions

In this study, CuCeOx catalysts prepared by the Multi-Inlet Vortex Reactor (MIVR), were carefully characterized and tested towards the CO and ethene oxidation reactions. The results pointed out that the MIVR procedure can be effective to synthesize mixed oxides with promising physico-chemical properties and catalytic oxidation activity.
The CuCeOx mixed catalysts present much better CO oxidation performances with respect to pure CeO2 due to the co-presence of CeO2 and CuO phases that cooperate during the catalytic cycle. Interestingly, this set of samples is featured by outstanding catalytic activities comparing with the literature results of other copper-cerium based catalyst prepared by different co-precipitation methods and with Pt/CeO2-type catalysts. The most promising catalyst is the 20%CuCeOx sample, thanks to its optimized physico-chemical properties: good textural-structural properties (SSA, Vp and Dc), high amount of structural defects (such as oxygen vacancies and Frenkel sites), and great availability of Ce3+ and Oα species. This catalyst also exhibited a considerable thermal stability.
The catalytic activity for the oxidation of ethene was observed to vary according to the amount of copper present in the catalyst. Overall, the best catalytic performance for ethene oxidation was observed for the 20%CuCeOx catalyst. The catalytic activity was ascribed to the contemporary presence of CeO2 and CuO phases and to their possible synergistic interactions. Moreover, the catalytic performance in ethene abatement increased when the size of the CuO particles decreased, i.e., the smaller the size of CuO particles, the higher the catalytic activity. Finally, it was observed that the occurrence of elevated relative amounts of (i) chemisorbed Oα species and (ii) defect sites positively contribute to the catalytic performances in ethene oxidation.

Supplementary Materials

The following supporting information can be downloaded at: https://www.mdpi.com/article/10.3390/catal12040364/s1, Figure S1: XRD magnification in the range 35–40° for the 5, 10 and 20 wt.% Cu samples. The typical peaks of CuO are marked with asterisks; Figure S2: Normalized FT-IR spectra of the different catalysts outgassed at 50 °C in the (A) 3800–3000 cm−1 and 2000–800 cm−1 (B) range; Figure S3: Cu LMM Auger spectra of a) CuO, b) 60%CuCeOx, c) 30%CuCeOx, d) 20%CuCeOx, e) 10%CuCeOx, f) 5%CuCeOx; Figure S4: T10% accomplished over the powder catalysts as a function of the Cu wt.% during the catalytic oxidation of CO; Figure S5: T10% accomplished over the powder catalysts as a function of the Cu wt.% during the catalytic oxidation of ethene; Figure S6: Catalytic activity trend observed during the ethene abatement tests with the ceria-based catalysts, in terms of (A) ethene-specific reaction rate and (B) temperature for achieving 10% conversion of ethene; Figure S7: Catalytic activity performance trend (in terms of TX%) for the ethene oxidation reaction over the ceria-based catalysts, as a function of (A) the Oα/Oβ ratio and (B) the amount of defect sites (D/F2g ratio). Table S1. EDX of the CuCeOx catalysts: the elemental content is expressed in percentage (wt.%) of each element in the catalysts; Table S2. Pearson correlation coefficients between some structural or chemical properties of the mixed oxides and their catlytic activity fo CO oxidation, in terms of specific reaction rates (reported in Table 6).

Author Contributions

M.D. and M.J.M.-F. performed the sample synthesis, characterizations, catalytic activity tests and the analysis of the catalytic data; E.S. and C.N. performed the FT-IR and Raman spectroscopy measurements; M.P. and S.B. conceived and designed the experiments; N.R., D.F. and F.G. supervised the work. All authors have read and agreed to the published version of the manuscript.

Funding

This research activity has received funding from the European Union’s Horizon 2020 research and innovation programme under grant agreement No. 768692.

Data Availability Statement

Not applicable.

Conflicts of Interest

The authors declare no conflict of interest.

References

  1. Trovarelli, A.; Fornasiero, P. Catalysis by Ceria and Related Materials; Catalytic Science Series; Imperial College Press: London, UK, 2013; Volume 12, ISBN 978-1-84816-963-0. [Google Scholar]
  2. Ertl, G.; Knözinger, H.; Weitkamp, J. Handbook of Heterogeneous Catalysis; John Wiley & Sons: Hoboken, NJ, USA, 2008; Volume 1–5, ISBN 9783527619474. [Google Scholar]
  3. Heck, R.M.; Farrauto, R.J.; Gulati, S.T. Catalytic Air Pollution Control: Commercial Technology, 3rd ed.; John Wiley & Sons: Hoboken, NJ, USA, 2009; ISBN 978-0-470-27503-0. [Google Scholar]
  4. Reşitoǧlu, I.A.; Altinişik, K.; Keskin, A. The pollutant emissions from diesel-engine vehicles and exhaust aftertreatment systems. Clean Technol. Environ. Policy 2015, 17, 15–27. [Google Scholar] [CrossRef] [Green Version]
  5. Wu, C.W.; Chen, R.H.; Pu, J.Y.; Lin, T.H. The influence of air-fuel ratio on engine performance and pollutant emission of an SI engine using ethanol-gasoline-blended fuels. In Atmospheric Environment; Elsevier Ltd.: Amsterdam, The Netherlands, 2004; Volume 38, pp. 7093–7100. [Google Scholar]
  6. Faiz, A.; Weaver, C.S.; Walsh, M.P. Air Pollution from Motor Vehicles; The World Bank: Washington, DC, USA, 1996. [Google Scholar]
  7. Walsh, M.P. Mobile source related air pollution: Effects on health and the environment. In Encyclopedia of Environmental Health; Elsevier: Amsterdam, The Netherlands, 2019; pp. 436–442. ISBN 9780444639523. [Google Scholar]
  8. Kampa, M.; Castanas, E. Human health effects of air pollution. Environ. Pollut. 2008, 151, 362–367. [Google Scholar] [CrossRef] [PubMed]
  9. Strauss, S.; Wasil, J.R.; Earnest, G.S. Carbon Monoxide Emissions from Marine Outboard Engines. SAE Trans. 2004, 113, 2127–2137. [Google Scholar]
  10. Koppmann, R. Volatile Organic Compounds in the Atmosphere; Blackwell: Hoboken, NJ, USA, 2007; ISBN 9780470988657. [Google Scholar]
  11. Burn, J.; Henk, J.; Bloemen, T. Chemistry and Analysis of Volatile Organic Compounds in the Environment; Blackie Academic & Professional: London, UK, 1993; ISBN 9789401049535. [Google Scholar]
  12. Finlayson-Pitts, B.J.; Pitts, J.N. Tropospheric air pollution: Ozone, airborne toxics, polycyclic aromatic hydrocarbons, and particles. Science 1997, 276, 1045–1051. [Google Scholar] [CrossRef] [Green Version]
  13. European Parliament; Council of the European Union. Directive 2008/50/EC of the European Parliament and of the Council of 21 May 2008 on Ambient Air Quality and Cleaner Air for Europe; European Parliament: Strasbourg, France, 2008. [Google Scholar]
  14. Marin Figueredo, M.J.; Piumetti, M.; Bensaid, S.; Fino, D.; Nunzio, R. Catalytic Oxidation of Volatile Organic Compounds over Porous Manganese Oxides Prepared via Sol-Gel Method. In Nanostructured Catalysts for Environmental Applications; Springer: Cham, Switzerland, 2021; pp. 59–78. [Google Scholar]
  15. Njagi, E.C.; Genuino, H.C.; King’Ondu, C.K.; Dharmarathna, S.; Suib, S.L. Catalytic oxidation of ethylene at low temperatures using porous copper manganese oxides. Appl. Catal. A Gen. 2012, 421–422, 154–160. [Google Scholar] [CrossRef]
  16. Piumetti, M.; Fino, D.; Russo, N. Mesoporous manganese oxides prepared by solution combustion synthesis as catalysts for the total oxidation of VOCs. Appl. Catal. B Environ. 2015, 163, 277–287. [Google Scholar] [CrossRef]
  17. Piumetti, M.; Bensaid, S.; Andana, T.; Russo, N.; Pirone, R.; Fino, D. Cerium-copper oxides prepared by solution combustion synthesis for total oxidation reactions: From powder catalysts to structured reactors. Appl. Catal. B Environ. 2017, 205, 455–468. [Google Scholar] [CrossRef]
  18. Marin Figueredo, M.J.; Andana, T.; Bensaid, S.; Dosa, M.; Fino, D.; Russo, N.; Piumetti, M. Cerium–Copper–Manganese Oxides Synthesized via Solution Combustion Synthesis (SCS) for Total Oxidation of VOCs. Catal. Lett. 2020, 150, 1821–1840. [Google Scholar] [CrossRef]
  19. Marin Figueredo, M.J.; Cocuzza, C.; Bensaid, S.; Fino, D.; Piumetti, M.; Russo, N. Catalytic Abatement of Volatile Organic Compounds and Soot over Manganese Oxide Catalysts. Materials 2021, 14, 4534. [Google Scholar] [CrossRef]
  20. Wu, X.; Han, R.; Liu, Q.; Su, Y.; Lu, S.; Yang, L.; Song, C.; Ji, N.; Ma, D.; Lu, X. A review of confined-structure catalysts in the catalytic oxidation of VOCs: Synthesis, characterization, and applications. Catal. Sci. Technol. 2021, 11, 5374–5387. [Google Scholar] [CrossRef]
  21. Andana, T.; Piumetti, M.; Bensaid, S.; Veyre, L.; Thieuleux, C.; Russo, N.; Fino, D.; Quadrelli, E.A.; Pirone, R. CuO nanoparticles supported by ceria for NOx-assisted soot oxidation: Insight into catalytic activity and sintering. Appl. Catal. B Environ. 2017, 216, 41–58. [Google Scholar] [CrossRef]
  22. Choi, B.; Lee, K.S. LNT/CDPF catalysts for simultaneous removal of NOx and PM from diesel vehicle exhaust. Chem. Eng. J. 2014, 240, 476–486. [Google Scholar] [CrossRef]
  23. Jeong, J.W.; Choi, B.; Lim, M.T. Catalytic oxidation for carbon-black simulating diesel particulate matter over promoted Pt/Al2O3 catalysts. J. Ind. Eng. Chem. 2008, 14, 830–835. [Google Scholar] [CrossRef]
  24. Liu, S.; Wu, X.; Luo, H.; Weng, D.; Ran, R. Pt/Zeolite Catalysts for Soot Oxidation: Influence of Hydrothermal Aging. J. Phys. Chem. C 2015, 119, 17218–17227. [Google Scholar] [CrossRef]
  25. Liu, X.; Jia, S.; Yang, M.; Tang, Y.; Wen, Y.; Chu, S.; Wang, J.; Shan, B.; Chen, R. Activation of subnanometric Pt on Cu-modified CeO2 via redox-coupled atomic layer deposition for CO oxidation. Nat. Commun. 2020, 11, 4240. [Google Scholar] [CrossRef]
  26. Mergler, Y.J.; Van Aalst, A.; Van Delft, J.; Nieuwenhuys, B.E. CO oxidation over promoted Pt catalysts. Appl. Catal. B Environ. 1996, 10, 245–261. [Google Scholar] [CrossRef]
  27. Koop, J.; Deutschmann, O. Detailed surface reaction mechanism for Pt-catalyzed abatement of automotive exhaust gases. Appl. Catal. B Environ. 2009, 91, 47–58. [Google Scholar] [CrossRef]
  28. Yang, Z.; Zhang, N.; Cao, Y.; Gong, M.; Zhao, M.; Chen, Y. Effect of yttria in Pt/TiO2 on sulfur resistance diesel oxidation catalysts: Enhancement of low-temperature activity and stability. Catal. Sci. Technol. 2014, 4, 3032–3043. [Google Scholar] [CrossRef]
  29. Fino, D.; Bensaid, S.; Piumetti, M.; Russo, N. A review on the catalytic combustion of soot in Diesel particulate filters for automotive applications: From powder catalysts to structured reactors. Appl. Catal. A Gen. 2016, 509, 75–96. [Google Scholar] [CrossRef]
  30. Andana, T.; Piumetti, M.; Bensaid, S.; Russo, N.; Fino, D.; Pirone, R. CO and Soot Oxidation over Ce-Zr-Pr Oxide Catalysts. Nanoscale Res. Lett. 2016, 11, 278. [Google Scholar] [CrossRef] [Green Version]
  31. Dosa, M.; Piumetti, M.; Bensaid, S.; Andana, T.; Novara, C.; Giorgis, F.; Fino, D.; Russo, N. Novel Mn–Cu-Containing CeO2 Nanopolyhedra for the Oxidation of CO and Diesel Soot: Effect of Dopants on the Nanostructure and Catalytic Activity. Catal. Lett. 2018, 148, 298–311. [Google Scholar] [CrossRef]
  32. Dosa, M.; Piumetti, M.; Bensaid, S.; Russo, N.; Fino, D. Novel Mn–Cu-Containing CeO2 Nanopolyhedra for the Oxidation of CO and Diesel Soot (Part II): Effect of Oxygen Concentration on the Catalytic Activity. Catal. Lett. 2019, 149, 107–118. [Google Scholar] [CrossRef]
  33. Piumetti, M.; Bensaid, S.; Andana, T.; Dosa, M.; Novara, C.; Giorgis, F.; Russo, N.; Fino, D. Nanostructured Ceria-Based Materials: Effect of the Hydrothermal Synthesis Conditions on the Structural Properties and Catalytic Activity. Catalysts 2017, 7, 174. [Google Scholar] [CrossRef] [Green Version]
  34. Delimaris, D.; Ioannides, T. VOC oxidation over CuO-CeO2 catalysts prepared by a combustion method. Appl. Catal. B Environ. 2009, 89, 295–302. [Google Scholar] [CrossRef]
  35. Li, C.; Xin, Q.; Guo, X.-X. Surface oxygen species and their reactivities in the mild oxidation of ethylene on cerium oxide studied by FT-IR spectroscopy. Catal. Lett. 1992, 12, 297–305. [Google Scholar] [CrossRef]
  36. Dole, H.A.E.; Baranova, E.A. Ethylene Oxidation in an Oxygen-Deficient Environment: Why Ceria is an Active Support? ChemCatChem 2016, 8, 1977–1986. [Google Scholar] [CrossRef]
  37. Andana, T.; Piumetti, M.; Bensaid, S.; Russo, N.; Fino, D.; Pirone, R. Nanostructured ceria-praseodymia catalysts for diesel soot combustion. Appl. Catal. B Environ. 2016, 197, 125–137. [Google Scholar] [CrossRef]
  38. Piumetti, M.; Bensaid, S.; Russo, N.; Fino, D. Investigations into nanostructured ceria-zirconia catalysts for soot combustion. Appl. Catal. B Environ. 2016, 180, 271–282. [Google Scholar] [CrossRef]
  39. Atribak, I.; López-Suárez, F.E.; Bueno-López, A.; García-García, A. New insights into the performance of ceria-zirconia mixed oxides as soot combustion catalysts. Identification of the role of “active oxygen” production. In Catalysis Today; Elsevier: Amsterdam, The Netherlands, 2011; Volume 176, pp. 404–408. [Google Scholar]
  40. Konsolakis, M. The role of Copper–Ceria interactions in catalysis science: Recent theoretical and experimental advances. Appl. Catal. B Environ. 2016, 198, 49–66. [Google Scholar] [CrossRef]
  41. Rao, K.N.; Venkataswamy, P.; Reddy, B.M. Structural characterization and catalytic evaluation of supported copper-ceria catalysts for soot oxidation. Ind. Eng. Chem. Res. 2011, 50, 11960–11969. [Google Scholar] [CrossRef]
  42. Krishna, K.; Bueno-López, A.; Makkee, M.; Moulijn, J.A. Potential rare earth modified CeO2 catalysts for soot oxidation. I. Characterisation and catalytic activity with O2. Appl. Catal. B Environ. 2007, 75, 189–200. [Google Scholar] [CrossRef] [Green Version]
  43. Sartoretti, E.; Martini, F.; Piumetti, M.; Bensaid, S.; Russo, N.; Fino, D. Nanostructured equimolar ceria-praseodymia for total oxidations in low-O2 conditions. Catalysts 2020, 10, 165. [Google Scholar] [CrossRef] [Green Version]
  44. Sartoretti, E.; Novara, C.; Chiodoni, A.; Giorgis, F.; Piumetti, M.; Bensaid, S.; Russo, N.; Fino, D. Nanostructured ceria-based catalysts doped with La and Nd: How acid-base sites and redox properties determine the oxidation mechanisms. Catal. Today 2021, 390–391, 117–134. [Google Scholar] [CrossRef]
  45. Dziembaj, R.; Molenda, M.; Chmielarz, L.; Zaitz, M.M.; Piwowarska, Z.; Rafalska-ŁAsocha, A. Optimization of Cu doped ceria nanoparticles as catalysts for low-temperature methanol and ethylene total oxidation. Catal. Today 2011, 169, 112–117. [Google Scholar] [CrossRef]
  46. Shan, W.; Shen, W.; Li, C. Structural Characteristics and Redox Behaviors of Ce1-xCuxOy Solid Solutions. Chem. Mater. 2003, 15, 4761–4767. [Google Scholar] [CrossRef]
  47. Jia, A.P.; Jiang, S.Y.; Lu, J.Q.; Luo, M.F. Study of catalytic activity at the CuO-CeO2 interface for CO oxidation. J. Phys. Chem. C 2010, 114, 21605–21610. [Google Scholar] [CrossRef]
  48. Davó-Quiñonero, A.; Navlani-García, M.; Lozano-Castelló, D.; Bueno-López, A.; Anderson, J.A. Role of Hydroxyl Groups in the Preferential Oxidation of CO over Copper Oxide-Cerium Oxide Catalysts. ACS Catal. 2016, 6, 1723–1731. [Google Scholar] [CrossRef] [Green Version]
  49. Liu, W.; Flytzani-Stephanopoulos, M. Total Oxidation of Carbon Monoxide and Methane over Transition Metal Fluorite Oxide Composite Catalysts I. Catalyst Composition and Activity. J. Catal. 1995, 153, 304–316. [Google Scholar] [CrossRef]
  50. Zheng, X.; Zhang, X.; Wang, X.; Wang, S.; Wu, S. Preparation and characterization of CuO/CeO2 catalysts and their applications in low-temperature CO oxidation. Appl. Catal. A Gen. 2005, 295, 142–149. [Google Scholar] [CrossRef]
  51. Tang, X.; Zhang, B.; Li, Y.; Xu, Y.; Xin, Q.; Shen, W. CuO/CeO2 catalysts: Redox features and catalytic behaviors. Appl. Catal. A Gen. 2005, 288, 116–125. [Google Scholar] [CrossRef]
  52. Bensaid, S.; Piumetti, M.; Novara, C.; Giorgis, F.; Chiodoni, A.; Russo, N.; Fino, D. Catalytic Oxidation of CO and Soot over Ce-Zr-Pr Mixed Oxides Synthesized in a Multi-Inlet Vortex Reactor: Effect of Structural Defects on the Catalytic Activity. Nanoscale Res. Lett. 2016, 11, 1–14. [Google Scholar] [CrossRef] [PubMed] [Green Version]
  53. Bensaid, S.; Deorsola, F.A.; Marchisio, D.L.; Russo, N.; Fino, D. Flow field simulation and mixing efficiency assessment of the multi-inlet vortex mixer for molybdenum sulfide nanoparticle precipitation. Chem. Eng. J. 2014, 238, 66–77. [Google Scholar] [CrossRef]
  54. Piumetti, M.; Bensaid, S.; Russo, N.; Fino, D. Nanostructured ceria-based catalysts for soot combustion: Investigations on the surface sensitivity. Appl. Catal. B Environ. 2015, 165, 742–751. [Google Scholar] [CrossRef]
  55. Piumetti, M.; Andana, T.; Bensaid, S.; Russo, N.; Fino, D.; Pirone, R. Study on the CO Oxidation over Ceria-Based Nanocatalysts. Nanoscale Res. Lett. 2016, 11, 165. [Google Scholar] [CrossRef] [Green Version]
  56. Etefagh, R.; Azhir, E.; Shahtahmasebi, N. Synthesis of CuO nanoparticles and fabrication of nanostructural layer biosensors for detecting Aspergillus niger fungi. Sci. Iran. 2013, 20, 1055–1058. [Google Scholar] [CrossRef]
  57. Zhang, S.; Liu, H.; Sun, C.; Liu, P.; Li, L.; Yang, Z.; Feng, X.; Huo, F.; Lu, X. CuO/Cu2O porous composites: Shape and composition controllable fabrication inherited from metal organic frameworks and further application in CO oxidation. J. Mater. Chem. A 2015, 3, 5294–5298. [Google Scholar] [CrossRef]
  58. Agarwal, S.; Zhu, X.; Hensen, E.J.M.; Lefferts, L.; Mojet, B.L. Defect chemistry of ceria nanorods. J. Phys. Chem. C 2014, 118, 4131–4142. [Google Scholar] [CrossRef]
  59. Wu, Z.; Li, M.; Howe, J.; Meyer, H.M.; Overbury, S.H. Probing defect sites on CeO2 nanocrystals with well-defined surface planes by raman spectroscopy and O2 adsorption. Langmuir 2010, 26, 16595–16606. [Google Scholar] [CrossRef]
  60. Ballauri, S.; Sartoretti, E.; Novara, C.; Giorgis, F.; Piumetti, M.; Fino, D.; Russo, N.; Bensaid, S. Wide range temperature stability of palladium on ceria-praseodymia catalysts for complete methane oxidation. Catal. Today 2021, 390–391, 185–197. [Google Scholar] [CrossRef]
  61. Guillén-Hurtado, N.; Giménez-Mañogil, J.; Martínez-Munuera, J.C.; Bueno-López, A.; García-García, A. Study of Ce/Pr ratio in ceria-praseodymia catalysts for soot combustion under different atmospheres. Appl. Catal. A Gen. 2020, 590, 117339. [Google Scholar] [CrossRef] [Green Version]
  62. Andriopoulou, C.; Trimpalis, A.; Petallidou, K.C.; Sgoura, A.; Efstathiou, A.M.; Boghosian, S. Structural and Redox Properties of Ce1−xZrxO2−δ and Ce0.8Zr0.15RE0.05O2−δ (RE: La, Nd, Pr, Y) Solids Studied by High Temperature in Situ Raman Spectroscopy. J. Phys. Chem. C 2017, 121, 7931–7943. [Google Scholar] [CrossRef]
  63. Sartoretti, E.; Novara, C.; Giorgis, F.; Piumetti, M.; Bensaid, S.; Russo, N.; Fino, D. In situ Raman analyses of the soot oxidation reaction over nanostructured ceria-based catalysts. Sci. Rep. 2019, 9, 3875. [Google Scholar] [CrossRef] [Green Version]
  64. Acharya, S.A.; Gaikwad, V.M.; D’Souza, S.W.; Barman, S.R. Gd/Sm dopant-modified oxidation state and defect generation in nano-ceria. Solid State Ionics 2014, 260, 21–29. [Google Scholar] [CrossRef]
  65. Sartoretti, E.; Novara, C.; Fontana, M.; Giorgis, F.; Piumetti, M.; Bensaid, S.; Russo, N.; Fino, D. New insights on the defect sites evolution during CO oxidation over doped ceria nanocatalysts probed by in situ Raman spectroscopy. Appl. Catal. A Gen. 2020, 596, 117517. [Google Scholar] [CrossRef]
  66. Vinodkumar, T.; Rao, B.G.; Reddy, B.M. Influence of isovalent and aliovalent dopants on the reactivity of cerium oxide for catalytic applications. Catal. Today 2015, 253, 57–64. [Google Scholar] [CrossRef]
  67. Reddy, K.R. Green synthesis, morphological and optical studies of CuO nanoparticles. J. Mol. Struct. 2017, 1150, 553–557. [Google Scholar] [CrossRef]
  68. Agarwal, S.; Zhu, X.; Hensen, E.J.M.; Mojet, B.L.; Lefferts, L. Surface-Dependence of Defect Chemistry of Nanostructured Ceria. J. Phys. Chem. C 2015, 119, 12423–12433. [Google Scholar] [CrossRef]
  69. Badri, A.; Binet, C.; Lavalley, J.C. An FTIR study of surface ceria hydroxy groups during a redox process with H2. J. Chem. Soc. Faraday Trans. 1996, 92, 4669–4673. [Google Scholar] [CrossRef]
  70. Jacobs, G.; Keogh, R.A.; Davis, B.H. Steam reforming of ethanol over Pt/ceria with co-fed hydrogen. J. Catal. 2007, 245, 326–337. [Google Scholar] [CrossRef]
  71. Kettemann, F.; Witte, S.; Birnbaum, A.; Paul, B.; Clavel, G.; Pinna, N.; Rademann, K.; Kraehnert, R.; Polte, J. Unifying Concepts in Room-Temperature CO Oxidation with Gold Catalysts. ACS Catal. 2017, 7, 8247–8254. [Google Scholar] [CrossRef]
  72. Li, H.; Jiao, X.; Li, L.; Zhao, N.; Xiao, F.; Wei, W.; Sun, Y.; Zhang, B. Synthesis of glycerol carbonate by direct carbonylation of glycerol with CO2 over solid catalysts derived from Zn/Al/La and Zn/Al/La/M (M = Li, Mg and Zr) hydrotalcites. Catal. Sci. Technol. 2015, 5, 989–1005. [Google Scholar] [CrossRef]
  73. Yang, S.C.; Pang, S.H.; Sulmonetti, T.P.; Su, W.N.; Lee, J.F.; Hwang, B.J.; Jones, C.W. Synergy between Ceria Oxygen Vacancies and Cu Nanoparticles Facilitates the Catalytic Conversion of CO2 to CO under Mild Conditions. ACS Catal. 2018, 8, 12056–12066. [Google Scholar] [CrossRef]
  74. Avgouropoulos, G.; Ioannides, T. Selective CO oxidation over CuO-CeO2 catalysts prepared via the urea-nitrate combustion method. Appl. Catal. A Gen. 2003, 244, 155–167. [Google Scholar] [CrossRef]
  75. Mrabet, D.; Abassi, A.; Cherizol, R.; Do, T.O. One-pot solvothermal synthesis of mixed Cu-Ce-Ox nanocatalysts and their catalytic activity for low temperature CO oxidation. Appl. Catal. A Gen. 2012, 447–448, 60–66. [Google Scholar] [CrossRef]
  76. Tabakova, T.; Boccuzzi, F.; Manzoli, M.; Sobczak, J.W.; Idakiev, V.; Andreeva, D. A comparative study of nanosized IB/ceria catalysts for low-temperature water-gas shift reaction. Appl. Catal. A Gen. 2006, 298, 127–143. [Google Scholar] [CrossRef]
  77. Jernigan, G.G.; Somorjai, G.A. Carbon Monoxide Oxidation over Three Different Oxidation States of Copper: Metallic Copper, Copper (I) Oxide, and Copper (II) Oxide—A Surface Science and Kinetic Study. J. Catal. 1994, 147, 567–577. [Google Scholar] [CrossRef]
  78. Zhang, S.M.; Huang, W.P.; Qiu, X.H.; Li, B.Q.; Zheng, X.C.; Wu, S.H. Comparative study on catalytic properties for low-temperature CO oxidation of Cu/CeO2 and CuO/CeO2 prepared via solvated metal atom impregnation and conventional impregnation. Catal. Lett. 2002, 80, 41–46. [Google Scholar] [CrossRef]
  79. Lai, S.Y.; Qiu, Y.; Wang, S. Effects of the structure of ceria on the activity of gold/ceria catalysts for the oxidation of carbon monoxide and benzene. J. Catal. 2006, 237, 303–313. [Google Scholar] [CrossRef]
  80. Guo, X.; Zhou, R. A new insight into the morphology effect of ceria on CuO/CeO2 catalysts for CO selective oxidation in hydrogen-rich gas. Catal. Sci. Technol. 2016, 6, 3862–3871. [Google Scholar] [CrossRef]
  81. Tang, X.; Li, Y.; Huang, X.; Xu, Y.; Zhu, H.; Wang, J.; Shen, W. MnOx-CeO2 mixed oxide catalysts for complete oxidation of formaldehyde: Effect of preparation method and calcination temperature. Appl. Catal. B Environ. 2006, 62, 265–273. [Google Scholar] [CrossRef]
  82. Trovarelli, A. Catalytic Properties of Ceria and CeO2-Containing Materials. Catal. Rev. 1996, 38, 439–520. [Google Scholar] [CrossRef]
  83. Caputo, T.; Lisi, L.; Pirone, R.; Russo, G. On the role of redox properties of CuO/CeO2 catalysts in the preferential oxidation of CO in H2-rich gases. Appl. Catal. A Gen. 2008, 348, 42–53. [Google Scholar] [CrossRef]
  84. Heynderickx, P.M.; Thybaut, J.W.; Poelman, H.; Poelman, D.; Marin, G.B. The total oxidation of propane over supported Cu and Ce oxides: A comparison of single and binary metal oxides. J. Catal. 2010, 272, 109–120. [Google Scholar] [CrossRef]
  85. Mars, P.; van Krevelen, D.W. Oxidations carried out by means of vanadium oxide catalysts. Chem. Eng. Sci. 1954, 3, 41–59. [Google Scholar] [CrossRef]
  86. Cam, T.S.; Omarov, S.O.; Chebanenko, M.I.; Sklyarova, A.S.; Nevedomskiy, V.N.; Popkov, V.I. One step closer to the low-temperature CO oxidation over non-noble CuO/CeO2 nanocatalyst: The effect of CuO loading. J. Environ. Chem. Eng. 2021, 9, 105373. [Google Scholar] [CrossRef]
  87. Zheng, X.C.; Wu, S.H.; Wang, S.P.; Wang, S.R.; Zhang, S.M.; Huang, W.P. The preparation and catalytic behavior of copper-cerium oxide catalysts for low-temperature carbon monoxide oxidation. Appl. Catal. A Gen. 2005, 283, 217–223. [Google Scholar] [CrossRef]
  88. Li, W.; Shen, X.; Zeng, R.; Chen, J.; Xiao, W.; Ding, S.; Chen, C.; Zhang, R.; Zhang, N. Constructing copper-ceria nanosheets with high concentration of interfacial active sites for enhanced performance in CO oxidation. Appl. Surf. Sci. 2019, 492, 818–825. [Google Scholar] [CrossRef]
  89. Li, Y.; Cai, Y.; Xing, X.; Chen, N.; Deng, D.; Wang, Y. Catalytic activity for CO oxidation of Cu-CeO2 composite nanoparticles synthesized by a hydrothermal method. Anal. Methods 2015, 7, 3238–3245. [Google Scholar] [CrossRef]
  90. Papadopoulos, C.; Kappis, K.; Papavasiliou, J.; Vakros, J.; Kuśmierz, M.; Gac, W.; Georgiou, Y.; Deligiannakis, Y.; Avgouropoulos, G. Copper-promoted ceria catalysts for CO oxidation reaction. Catal. Today 2020, 355, 647–653. [Google Scholar] [CrossRef]
  91. Zhang, X.; Zhang, X.; Song, L.; Hou, F.; Yang, Y.; Wang, Y.; Liu, N. Enhanced catalytic performance for CO oxidation and preferential CO oxidation over CuO/CeO2 catalysts synthesized from metal organic framework: Effects of preparation methods. Int. J. Hydrogen Energy 2018, 43, 18279–18288. [Google Scholar] [CrossRef]
  92. Hossain, S.T.; Azeeva, E.; Zhang, K.; Zell, E.T.; Bernard, D.T.; Balaz, S.; Wang, R. A comparative study of CO oxidation over Cu-O-Ce solid solutions and CuO/CeO2 nanorods catalysts. Appl. Surf. Sci. 2018, 455, 132–143. [Google Scholar] [CrossRef]
  93. Nie, L.; Mei, D.; Xiong, H.; Peng, B.; Ren, Z.; Hernandez, X.I.P.; DeLaRiva, A.; Wang, M.; Engelhard, M.H.; Kovarik, L.; et al. Activation of surface lattice oxygen in single-atom Pt/CeO2 for low-temperature CO oxidation. Science 2017, 358, 1419–1423. [Google Scholar] [CrossRef] [Green Version]
  94. Bera, P.; Gayen, A.; Hegde, M.S.; Lalla, N.P.; Spadaro, L.; Frusteri, F.; Arena, F. Promoting effect of CeO2 in combustion synthesized Pt/CeO2 catalyst for CO oxidation. J. Phys. Chem. B 2003, 107, 6122–6130. [Google Scholar] [CrossRef]
  95. Liu, H.H.; Wang, Y.; Jia, A.P.; Wang, S.Y.; Luo, M.F.; Lu, J.Q. Oxygen vacancy promoted CO oxidation over Pt/CeO2 catalysts: A reaction at Pt-CeO2 interface. Appl. Surf. Sci. 2014, 314, 725–734. [Google Scholar] [CrossRef]
  96. Piumetti, M. Molecular Dynamics and Complexity in Catalysis and Biocatalysis; Springer International Publishing: Cham, Switzerland, 2022. [Google Scholar]
  97. Piumetti, M.; Russo, N. Notes on Catalysis for Environment and Energy; CLUT—Politecnico di Torino: Turin, Italy, 2017; ISBN 9788879924085. [Google Scholar]
  98. Liu, Y.; Dai, H.; Deng, J.; Xie, S.; Yang, H.; Tan, W.; Han, W.; Jiang, Y.; Guo, G. Mesoporous Co3O4-supported gold nanocatalysts: Highly active for the oxidation of carbon monoxide, benzene, toluene, and o-xylene. J. Catal. 2014, 309, 408–418. [Google Scholar] [CrossRef]
  99. Zawadzki, M.; Trawczyński, J. Synthesis, characterization and catalytic performance of LSCF perovskite for VOC combustion. Catal. Today 2011, 176, 449–452. [Google Scholar] [CrossRef]
  100. Kamal, M.S.; Razzak, S.A.; Hossain, M.M. Catalytic oxidation of volatile organic compounds (VOCs)—A review. Atmos. Environ. 2016, 140, 117–134. [Google Scholar] [CrossRef]
  101. Yang, C.; Miao, G.; Pi, Y.; Xia, Q.; Wu, J.; Li, Z.; Xiao, J. Abatement of various types of VOCs by adsorption/catalytic oxidation: A review. Chem. Eng. J. 2019, 370, 1128–1153. [Google Scholar] [CrossRef]
  102. Morales, M.R.; Yeste, M.P.; Vidal, H.; Gatica, J.M.; Cadus, L.E. Insights on the combustion mechanism of ethanol and n-hexane in honeycomb monolithic type catalysts: Influence of the amount and nature of Mn-Cu mixed oxide. Fuel 2017, 208, 637–646. [Google Scholar] [CrossRef]
  103. Wang, Q.; Yeung, K.L.; Bañares, M.A. Ceria and its related materials for VOC catalytic combustion: A review. Catal. Today 2020, 356, 141–154. [Google Scholar] [CrossRef]
Scheme 1. Scheme of the Multi-Inlet Vortex Reactor (MIVR): (A) Top view, (B) and (C) Front view.
Catalysts 12 00364 sch001
Figure 1. X-ray diffractograms in the range 10° < 2θ < 80° over the samples. The typical peaks of CuO are marked with asterisks.
Catalysts 12 00364 g001
Figure 2. FESEM images of the CuCeOx catalysts.
Catalysts 12 00364 g002
Figure 3. (A) Raman spectra of (a) CeO2, (b) 5%CuCeOx, (c) 10%CuCeOx, (d) 20%CuCeOx, (e) 30%CuCeOx, (f) 60%CuCeOx and (g) CuO collected at ambient conditions, normalized to the intensity of ceria F2g peak. (B) Variation of the D/F2g ratio as a function of the Cu content.
Catalysts 12 00364 g003
Figure 4. Normalized FT-IR spectra of the different catalysts outgassed at 150 °C in the (A) 3800–3000 cm−1 and (B) 2000–800 cm−1 range.
Catalysts 12 00364 g004
Figure 5. XP spectra of (a) CeO2, (b) 5%CuCeOx, (c) 10%CuCeOx, (d) 20%CuCeOx, (e) 30%CuCeOx, (f) 60%CuCeOx and (g) CuO in the (A) Ce 3d, (B) O 1s and (C) Cu 2p regions.
Catalysts 12 00364 g005
Figure 6. (A) H2-TPR profiles of the CuCeOx catalysts. (B) Trend in the position of the low-temperature reduction peaks as a function of the Cu content in the different samples.
Catalysts 12 00364 g006
Figure 7. CO conversion as a function of the temperature in the range 0–500 °C (black graph) and a magnification in the range 0–125 °C (grey graph).
Catalysts 12 00364 g007
Figure 8. Trends of various parameters of the different CuCeOx catalysts reported as a function of the Cu wt.% content.
Catalysts 12 00364 g008
Figure 9. Comparison of the T50% accomplished during the CO oxidation among the most performing copper-cerium based catalysts synthesized by different techniques reported in the literature and the 20%CuCeOx sample studied in this work.
Catalysts 12 00364 g009
Figure 10. Specific reaction rates of CO oxidation accomplished over the powder catalysts at 50 °C as a function of the Cu wt.%.
Catalysts 12 00364 g010
Figure 11. (A) Thermal stability study of the 20%CuCeOx for two consecutive CO oxidation tests and (B) CO conversion (%) over the time during the long-term stability test for the 20%CuCeOx sample.
Catalysts 12 00364 g011
Figure 12. Catalytic conversion (%) of ethene over the synthesized catalysts as a function of the temperature.
Catalysts 12 00364 g012
Figure 13. Ethene catalytic oxidation reaction rate behavior as a function of the Cu loading in the prepared catalysts.
Catalysts 12 00364 g013
Table 1. Textural properties of the CuCeOx catalysts derived by means of X-ray diffraction, N2 physisorption and Raman spectroscopy.
CatalystDc a (nm)SSA b (m2 g−1)Vp c
(cm3 g−1)
D/F2g d
CeO2CuO
CeO2 15-450.070.06
5%CuCeOx13-500.080.13
10%CuCeOx117550.100.16
20%CuCeOx109500.090.34
30%CuCeOx1426220.030.13
60%CuCeOx1639110.060.09
CuO-7320.01-
a Crystallite size estimated by the Scherrer’s equation; b Specific surface area calculated by the Brunauer–Emmett–Teller (BET) method; c Total pore volume evaluated by the Barrett–Joyner–Halenda (BJH) method; d Ratio between the area of the defect band and that of the F2g peak in the Raman spectra.
Table 2. EDX and ICP analysis of the CuCeOx catalysts: the elemental content is expressed in percentage of Ce and Cu with respect to the total amount of cations (Ce + Cu).
CatalystElemental Composition (wt.%)
EDX *ICP
CeCuTot.CeCuTot.
5%CuCeOx973100973100
10%CuCeOx9281009010100
20%CuCeOx82181007921100
30%CuCeOx67331006733100
60%CuCeOx32681003763100
* The values are estimated over three different areas.
Table 3. Relative amount of Ce species as derived from XP spectra of Ce 3d core level.
CatalystCe3+ (at.%)Ce4+ (at.%)
CeO21288
5%CuCeOx2278
10%CuCeOx2575
20%CuCeOx2674
30%CuCeOx1981
60%CuCeOx2179
Table 4. Relative amounts of the surface-adsorbed oxygen (Oα) and lattice oxygen (Oβ) species and their respective ratios, as derived from the deconvolution of the O 1s core level.
CatalystOαOβ (Cu-O)Oβ (Ce-O)Oα/Oβ
BE (eV)%-AtomBE (eV)%-AtomBE (eV)%-Atom
CeO2531.226--529.0740.35
5%CuCeOx530.932--529.1680.47
10%CuCeOx531.433--529.4670.49
20%CuCeOx531.340--529.3600.67
30%CuCeOx531.431529.936528.8330.45
60%CuCeOx531.329529.645528.7260.41
CuO531.443529.857--0.75
Table 5. Hydrogen consumption (mmol g−1) evaluated by H2-TPR.
H2-Uptake TotalH2/CuH2-Uptake
<200 °C
H2-Uptake
200–400 °C
H2-Uptake
400–500 °C
H2-Uptake
>500 °C
CeO21.41-0.010.110.161.13
5%CuCeOx1.333.460.160.520.050.60
10%CuCeOx1.911.500.151.210.060.49
20%CuCeOx3.591.340.092.520.300.68
30%CuCeOx5.351.270.054.070.430.79
60%CuCeOx8.831.110.025.861.990.96
CuO12.571.000.004.375.922.28
Table 6. Catalytic performances of the prepared samples in the catalytic oxidation of CO.
CatalystCO Oxidation Rate a (µmol h−1 g−1)Tparameter (°C)
T10%T50%T90%
CeO22.6 × 10−2258314372
5%CuCeOx171466998
10%CuCeOx257356290
20%CuCeOx375305875
30%CuCeOx1384673105
60%CuCeOx2.7 × 10−4104139171
CuO3.7 × 10−4151179197
a Calculated at 50 °C.
Table 7. Catalytic performances of the prepared samples in the catalytic oxidation of C2H4.
CatalystEthene Oxidation Rate a (µmol h1 g1)Tparameter (°C)
T10%T50%T90%
CeO215275345396
5%CuCeOx25194238273
10%CuCeOx56177223259
20%CuCeOx62175221252
30%CuCeOx26197242277
60%CuCeOx21217290357
CuO3237287328
a Calculated at 175 °C.
Publisher’s Note: MDPI stays neutral with regard to jurisdictional claims in published maps and institutional affiliations.

