1. Introduction
The pursuit of alternative energy sources for a more sustainable future has placed increased importance on the prospect of fuel cells, water splitting, and metal–air batteries [
1,
2]. OER and ORR are both critical to these technologies. To simplify the implementation of these technologies, a single efficient bifunctional catalyst capable of doing both OER and ORR is sought. Typical states of the art OER and ORR catalyst are noble metal catalyst that show limited bifunctional capability [
1,
2,
3]. For instance, IrO
2 or RuO
2 are commonly used for OER, and Pt or Pd are commonly used for ORR [
1,
2]. Compounding on top of the insufficient bifunctional capability of these state-of-the-art catalysts is that the sacristy of the constituent noble metals would likely impede their widespread adoption.
An alternative to these traditional catalysts, perovskite oxides, such as La
1−xSr
xMnO
3 (LSM), are not only stable and tunable but also show promising bifunctional OER/ORR catalytic activities. To design the most optimum perovskite catalyst, it is important to understand how to tune the effects both on the catalyst stability and reactivity. We study different tunings of LSM as to understand the impact on the catalysts bifunctional activity and stability. One method of tuning this LSM perovskite oxide, that is explored here, is to vary stoichiometry by introducing vacancies. Experimental study has been conducted previously on LSM and different amounts of A-site excess tunings of LSM [
2]. To leverage the experimental data, we induce vacancies into our computational model of LSM to mirror the experimental stoichiometry. This approach allows us to make general comparisons to experimental data while also providing additional insights not found by the experiment.
Replicating the experimental stoichiometries exactly would not be computationally realizable due to the large cells needed to do so. For LSM without any A-site tuning, a reasonable sized cell can match the stoichiometry exactly, but the same is not the case for the A-site tuned structures. Reproducing the exact stoichiometries for the experimental A-site excess structures, (La
0.8Sr
0.2)
1.05MnO
3 and (La
0.8Sr
0.2)
1.10MnO
3, would require around 500 and 200 atoms, respectively. The experimental stoichiometries are approximated so that considerably less atoms are used in the computational cells. A straightforward approximation to the experimental stoichiometry would be to use the cell constructed to exactly reproduce La
0.8Sr
0.2MnO
3 (experimental LSM) and then remove a Mn for the A-site excess. However, this would be too much A-site excess, so instead, a larger cell consisting of 60 atoms was used to approximate the experimental LSM. Using the 60-atom cell, a Mn atom was removed to approximate the experimental A-site excess. It is important to note that having too high A-site excess results in decreased catalyst stability and activity [
2].
We also study Mn and O paired vacancies. We study the paired vacancies as experimental XPS, suggesting that an oxygen vacancy accompanies the manganese vacancy [
2]. XPS showed that at least for (La
0.8Sr
0.2)
1.05MnO
3 vs. La
0.8Sr
0.2MnO
3, there was an increase in O
2− absorbed on lattice O vacancy surface spots. The increase was from 8.3% to 32.1%. To clarify, of the measured adsorbed species, the oxygen vacancy was 8.3% and increased to 32.1%. We have not tried to reproduce the adsorbed O
2− on the vacant oxygen site that we introduce. This is because localizing the observed 2
− charge onto an adsorbed O
2 molecule would not be straightforward to accomplish. Therefore, we compromise to study the effect of the oxygen vacancy but without the adsorbed O
2−.
2. Computational Methods
Spin polarized density functional theory (DFT) calculations for this work were performed with the Vienna Ab initio Simulation Package (VASP) [
4,
5,
6,
7]. Within the VASP package, Perdew–Burke–Ernzerhof (PBE) exchange-correlation functional pseudopotentials were used [
8] with the projector augmented wave method (PAW) [
9,
10]. A plane wave basis set with 550 eV energy cutoff was used to calculate the total energy calculations for all the systems. The electronic energy of 10
−6 eV for the electronic relaxations and the residual forces of 0.02 eV/Å on ions for the ionic relaxations were used for all the calculations. We also used Gaussian smearing with a width of 0.02 eV around the Fermi level to expedite the convergence. Initially, a five-layer LSM (001) slab structure was created from lanthanum manganite, a general form of ABO
3 type perovskite-based crystal structure, with the general formula of La
1−xSr
xMnO
3, where x describes the doping level. In the crystal, the A sites are occupied by both La and Sr atoms, and the B sites are occupied by the smaller Mn atoms. In this study, we used a supercell consisting of 60 atoms to approximate the experimental LSM with an x value of 0.25 for all the calculations. That is the experimental La
0.8Sr
0.2MnO
3, which is approximated as La
0.75Sr
0.25MnO
3. Using the 60-atom cell, a Mn atom was removed to approximate the experimental A-site excess structure of (La
0.8Sr
0.2)
1.10MnO
3. All La
0.75Sr
0.25MnO
3 (001) with different stoichiometry surfaces (as shown in
Figure S1 and Table S1 in the Supplementary Information) are periodic in the x and y directions, and the z dimension was chosen to be large enough so that the interactions with periodic images were negligible. A slab model was used for the optimized surfaces with a 25 Å vacuum layer separating the periodic surfaces. A single gamma centered k-point mesh was chosen to reduce the computational cost. It is to be noted that there are errors in the prediction of M–OH, M–O, M–OOH, and M–O
2 bonding strengths during OER/ORR reactions in alkali medium due to the strong correlation effects in 3D transition metal oxides; thus, a Hubbard U correction was applied to Mn with a specific value of 3.96 eV.
In order to evaluate the free energy profile of each elementary reaction step, we first obtained an electronic energy part of surface bound species using the DFT+U method, and then, we incorporated the finite temperature part including zero-point energy contribution based on the frequency calculations within the harmonic approximation, which is similar to our previous works [
11] implemented in the TAMKin program [
12]. Free energies for H
2, H
2O, and O
2 were collected from the previous works [
13,
14,
15]. Finally, the potential dependent free energies of electron transfer steps were modeled using the computational hydrogen electrode (CHE) model. The OER reaction mechanism on the perovskite surface in alkali medium is known to be a 4-electron exchange mechanism [
2,
16]. The coupling between an electron transfer to the electrode and the formation of an OH
− anion was discussed in detail in our previous paper [
2].
To plot a phase stability diagram for the growth of the ABO3 structure at equilibrium from atomic reservoirs, see Equation (1).
The condition for a competing oxide such as AO2 not to form from the atomic reservoir is given by Equation (2).
The chemical potentials of the atomic reservoir can be written with a change of variable, giving a simpler form by Equations (3)–(5).
A similar change of variable is applied to the equilibrium condition given in Equation (1) as well as to the constraining intermediate inequalities such as Equation (2) (resulting in Equations (6) and (7)).
In the case of the LSM structures, since these perovskites have an extra species, through strontium doping, then the equivalent of Equation (6) for LSM has four variables (one extra variable for the chemical potential of Sr). With the inclusion of strontium, the LSM equivalent of Equation (6) is Equation (8).
If the competing oxides inequalities (similar to Equation (7)) are each considered as an equality, then degree of freedom analysis on this equation along with Equation (8) shows that there are two degrees of freedom for the LSM phase diagrams. With a degree of freedom of two, then there must be two independent variables specified. One independent variable is specified as values along the abscissa; the other is specified on the phase diagram as color. Something important to consider is the atomistic thermodynamics discussed here is indirect in that only proposed competing structures to the LSM perovskite are directly screened and used to constrain the chemical range of chemical potentials. Therefore, this work only considered relevant competing oxides, as found in the literature. Similar phase diagrams were also constructed for different stoichiometry structures.
The various neutral vacancy energies were calculated for oxygen-rich and oxygen-poor conditions using the constructed phase diagrams and using Equation (9).
On the right-hand side of the equality in Equation (9), the first term is the ground-state energy for a given LSM structure with a vacancy. The second term is pristine LSM without any vacancies, and the third and fourth terms account for the energy transfer associated with transferring a Mn atom and an O atom, respectively, to the environment.
3. Results and Discussions
The characterization of OER and ORR activity between different catalysts presents some challenges. Some challenges arise due to extraneous factors such as differing active surface areas with different catalysts or differently prepared catalysts. In addition, there is some arbitrariness in how OER and ORR catalysts’ activity are described [
1,
17]. Despite these challenges, an OER/ORR catalyst activity can be characterized by its current–voltage relationship. Furthermore, a measure of an OER/ORR’s catalyst efficiency can be obtained by considering how the catalyst’s I-V (current–voltage) characteristics stray from an idealized I-V relationship with an OER/ORR voltage equal to the equilibrium predicted voltage. How the observed I-V relationship strays from the idealized I-V relationship is lumped into a quantity called overpotential. Computationally determined overpotentials are how this body of work characterizes catalyst activity, thereby giving evermore importance to the overpotential quantity. Therefore, we calculated computational overpotentials using an early descriptor for various systems of LSM for OER/ORR activities. To calculate the overpotentials in an alkali medium for a given perovskite, the free energy change for each intermediate step in the OER/ORR cycle has been calculated, as described in detail in our previous publications [
2,
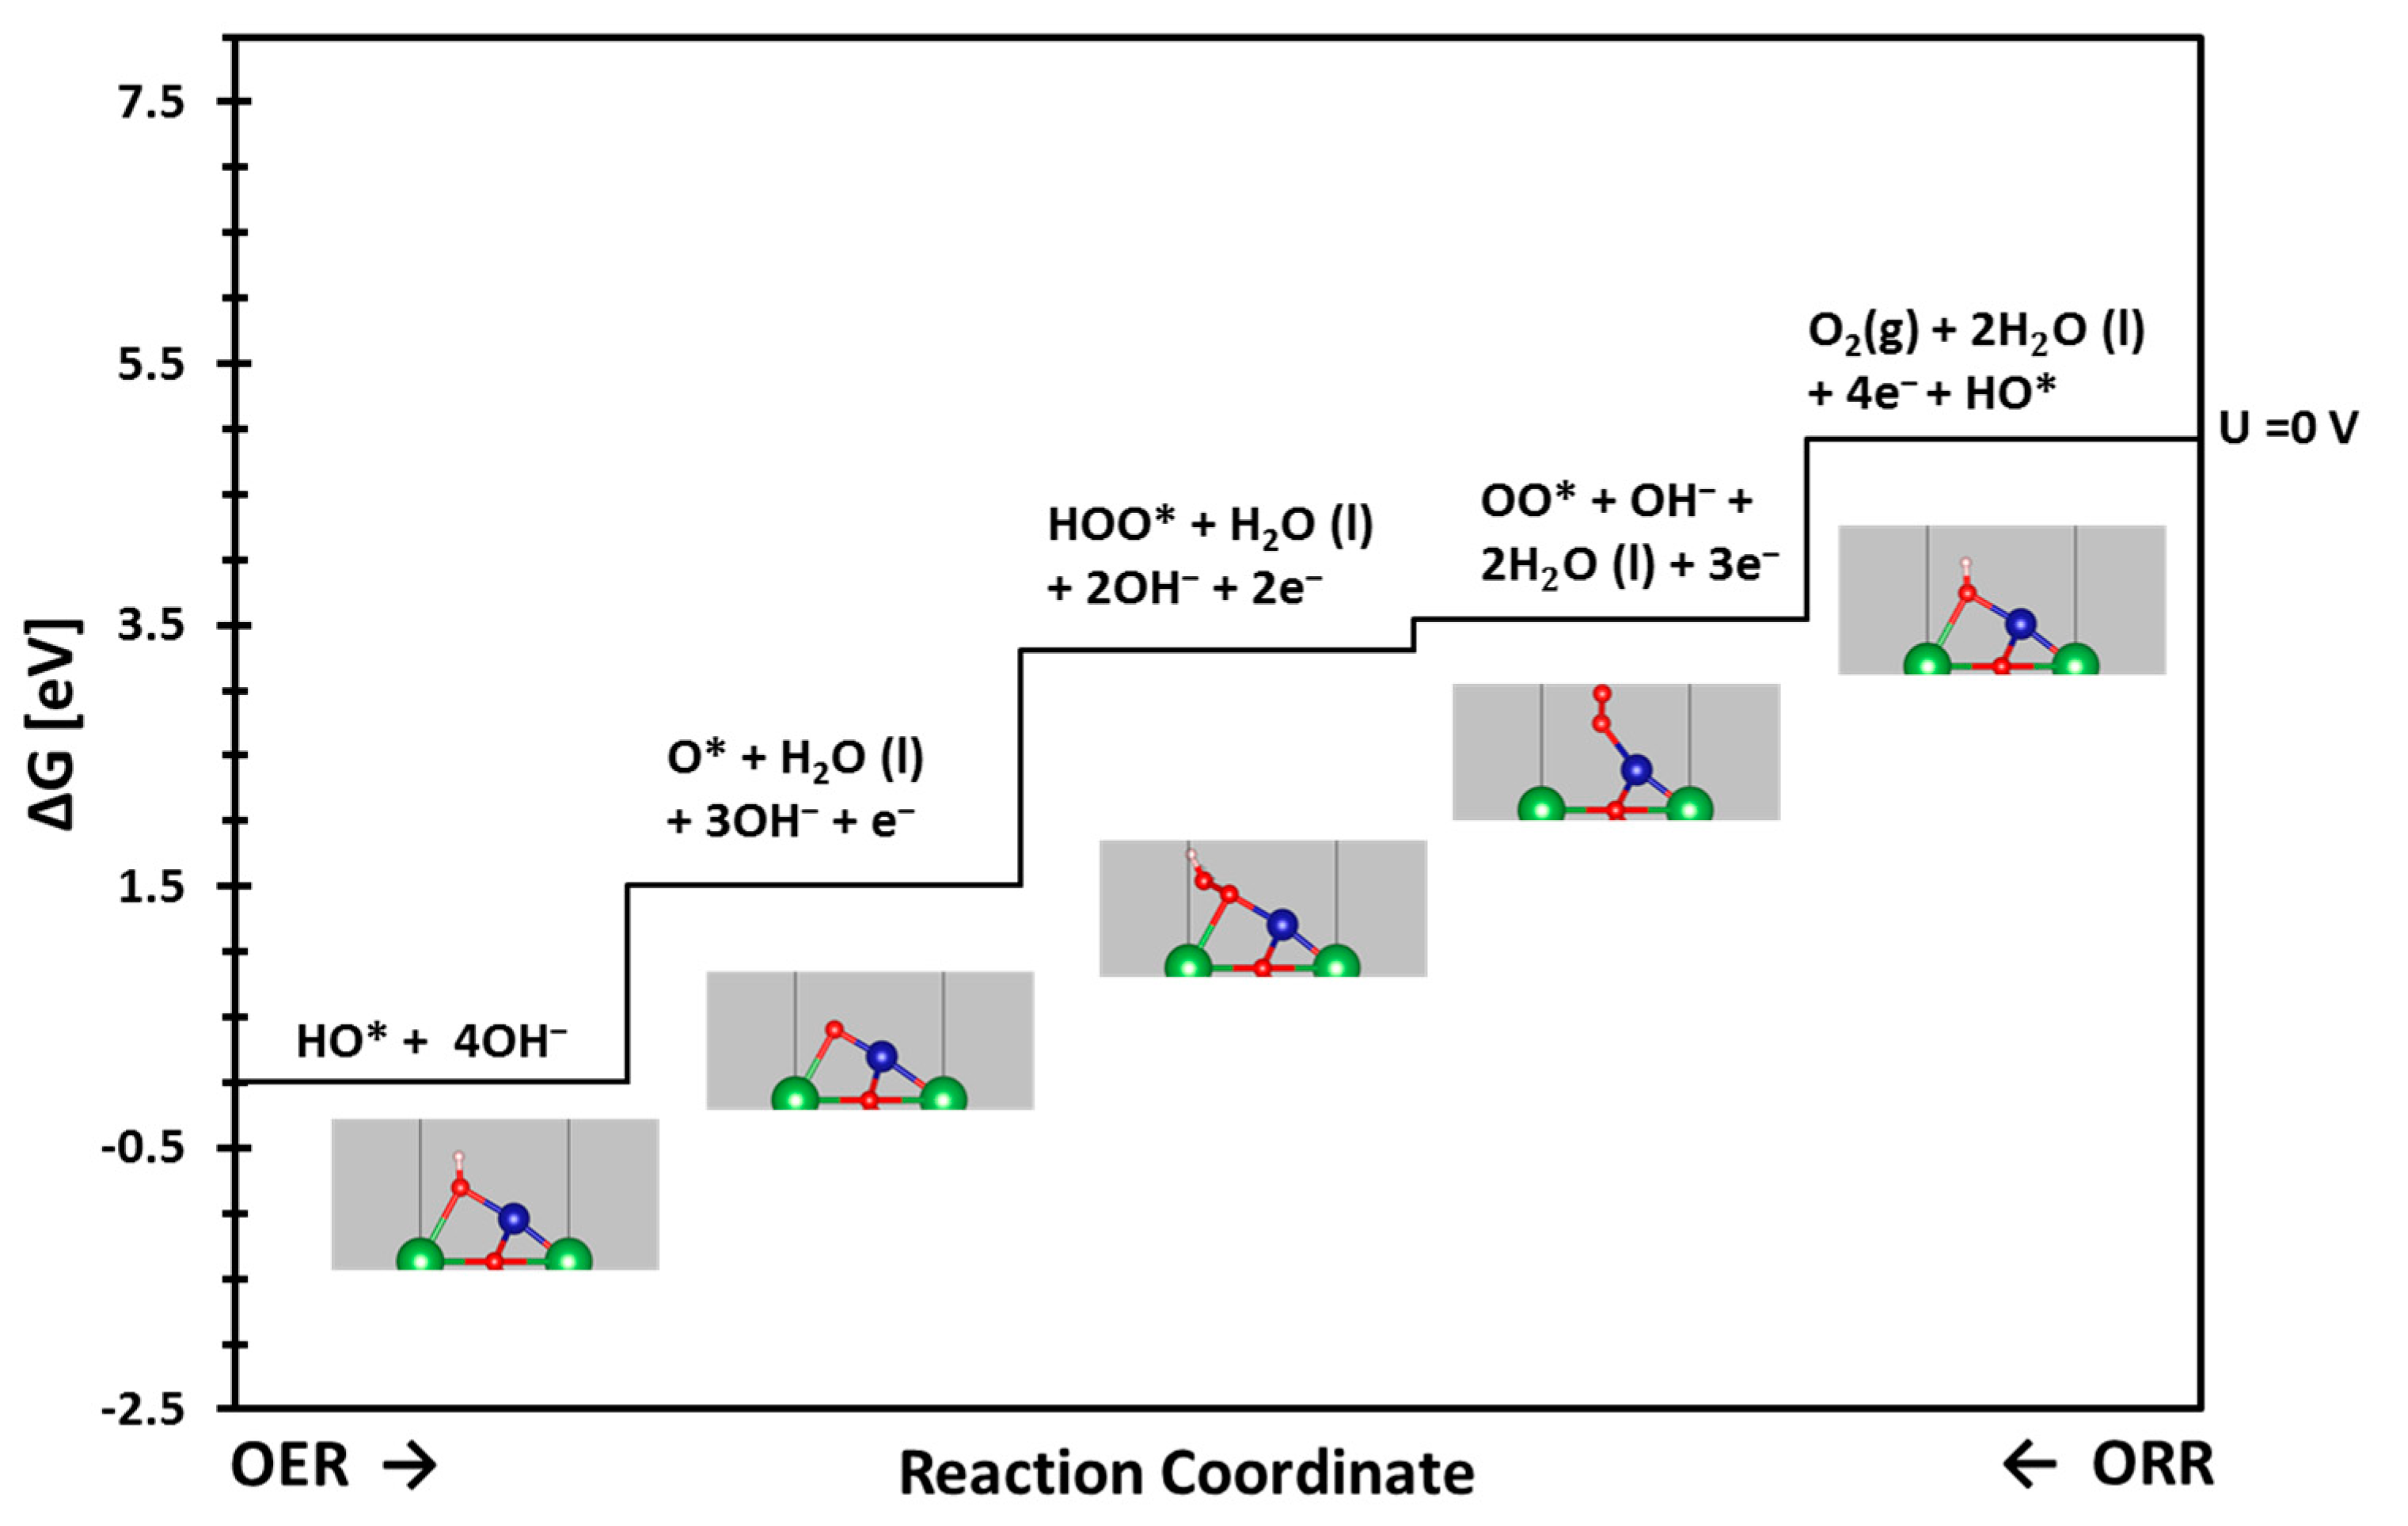
18]. It is to be noted that the ORR uses nearly the same intermediate reaction steps as OER although in the reverse order, as shown in
Figure 1.
3.1. Reactivity (OER/ORR)
All the free energy patterns of LSM, ALSM, LSMO, and ALSMO share very similar energy profiles, as shown in
Figures S2–S5 for the OER and
Figures S6–S9 for the ORR in the
Supplementary Information. All the steps are uphill/endothermic, indicating that external electrical potential is necessary to drive the OER reaction. Both the OER and ORR free energy diagrams clearly indicate that the overpotential of ALSMO has the lowest overpotential of 0.49 eV and 0.50 eV, respectively, for OER and ORR, whereas the LSMO has the highest overpotential of 1.03 eV and 1.51 eV for the OER and ORR, respectively.
The overpotential results clearly indicate that ALSMO is the most active compared to the other stoichiometric LSM structures. These results can be explained in terms of a center of measure of the same surface Mn
d-DOS, as shown in
Figure S10 in the Supplementary Information. We have considered the same surface Mn atom for the median energy from the Mn
d-DOS but with different surrounding vacancies. The median energy for the d-DOS gives a measure of the number of available antibonding and bonding states. The median energy,
Emed, is defined in Equation (10).
where
is the density of states at energy
E.
The farther away the median energy is away from the Fermi energy level, the less antibonding states. Likewise, the closer the median energy is to the Fermi level, the more antibonding states. Then, we plotted the surface Mn median energy of d-DOS against the overpotentials, as shown in
Figure 2a,b for the OER and ORR, respectively. The resulting plots seem like a possible volcano plot. The right portion of the volcano plot should correspond to high
eg (antibonding electrons) representing the intermediate state bounded to the surface too strongly, while the left portion should correspond to low
eg representing the intermediate state bounded to the surface too weakly. So, the observed volcano plots (
Figure 2) are expected to reflect the similar information for these different stoichiometric LSM structures. We also calculated the oxidation state by using the Bader charge analysis of a surface Mn atom (active center) of all the stoichiometric LSM structures (as shown in
Table S1 in the Supplementary Information). The highest oxidation state of Mn in LSMO represents the low
eg electrons, which is consistent with the volcano plots.
The ALSMO substrate was the best performing catalyst, with the lowest overpotentials, which seems to suggest that ALSMO has the right amount of antibonding states (it has close to the right number of
eg electrons). In contrast, LSMO is too bonding, as it has a Mn d-band median energy that shifts too far into lower-energy bonding states. LSMO’s overbinding is validated by
Figure S11 where LSMO had the *OH intermediates with the most negative formation energy, as shown in the
Supplementary Information. On the other hand, LSM and ALSM seem to have too many antibonding states, as their Mn d-band median is shifted to the right, corresponding with too many anti-bonding states.
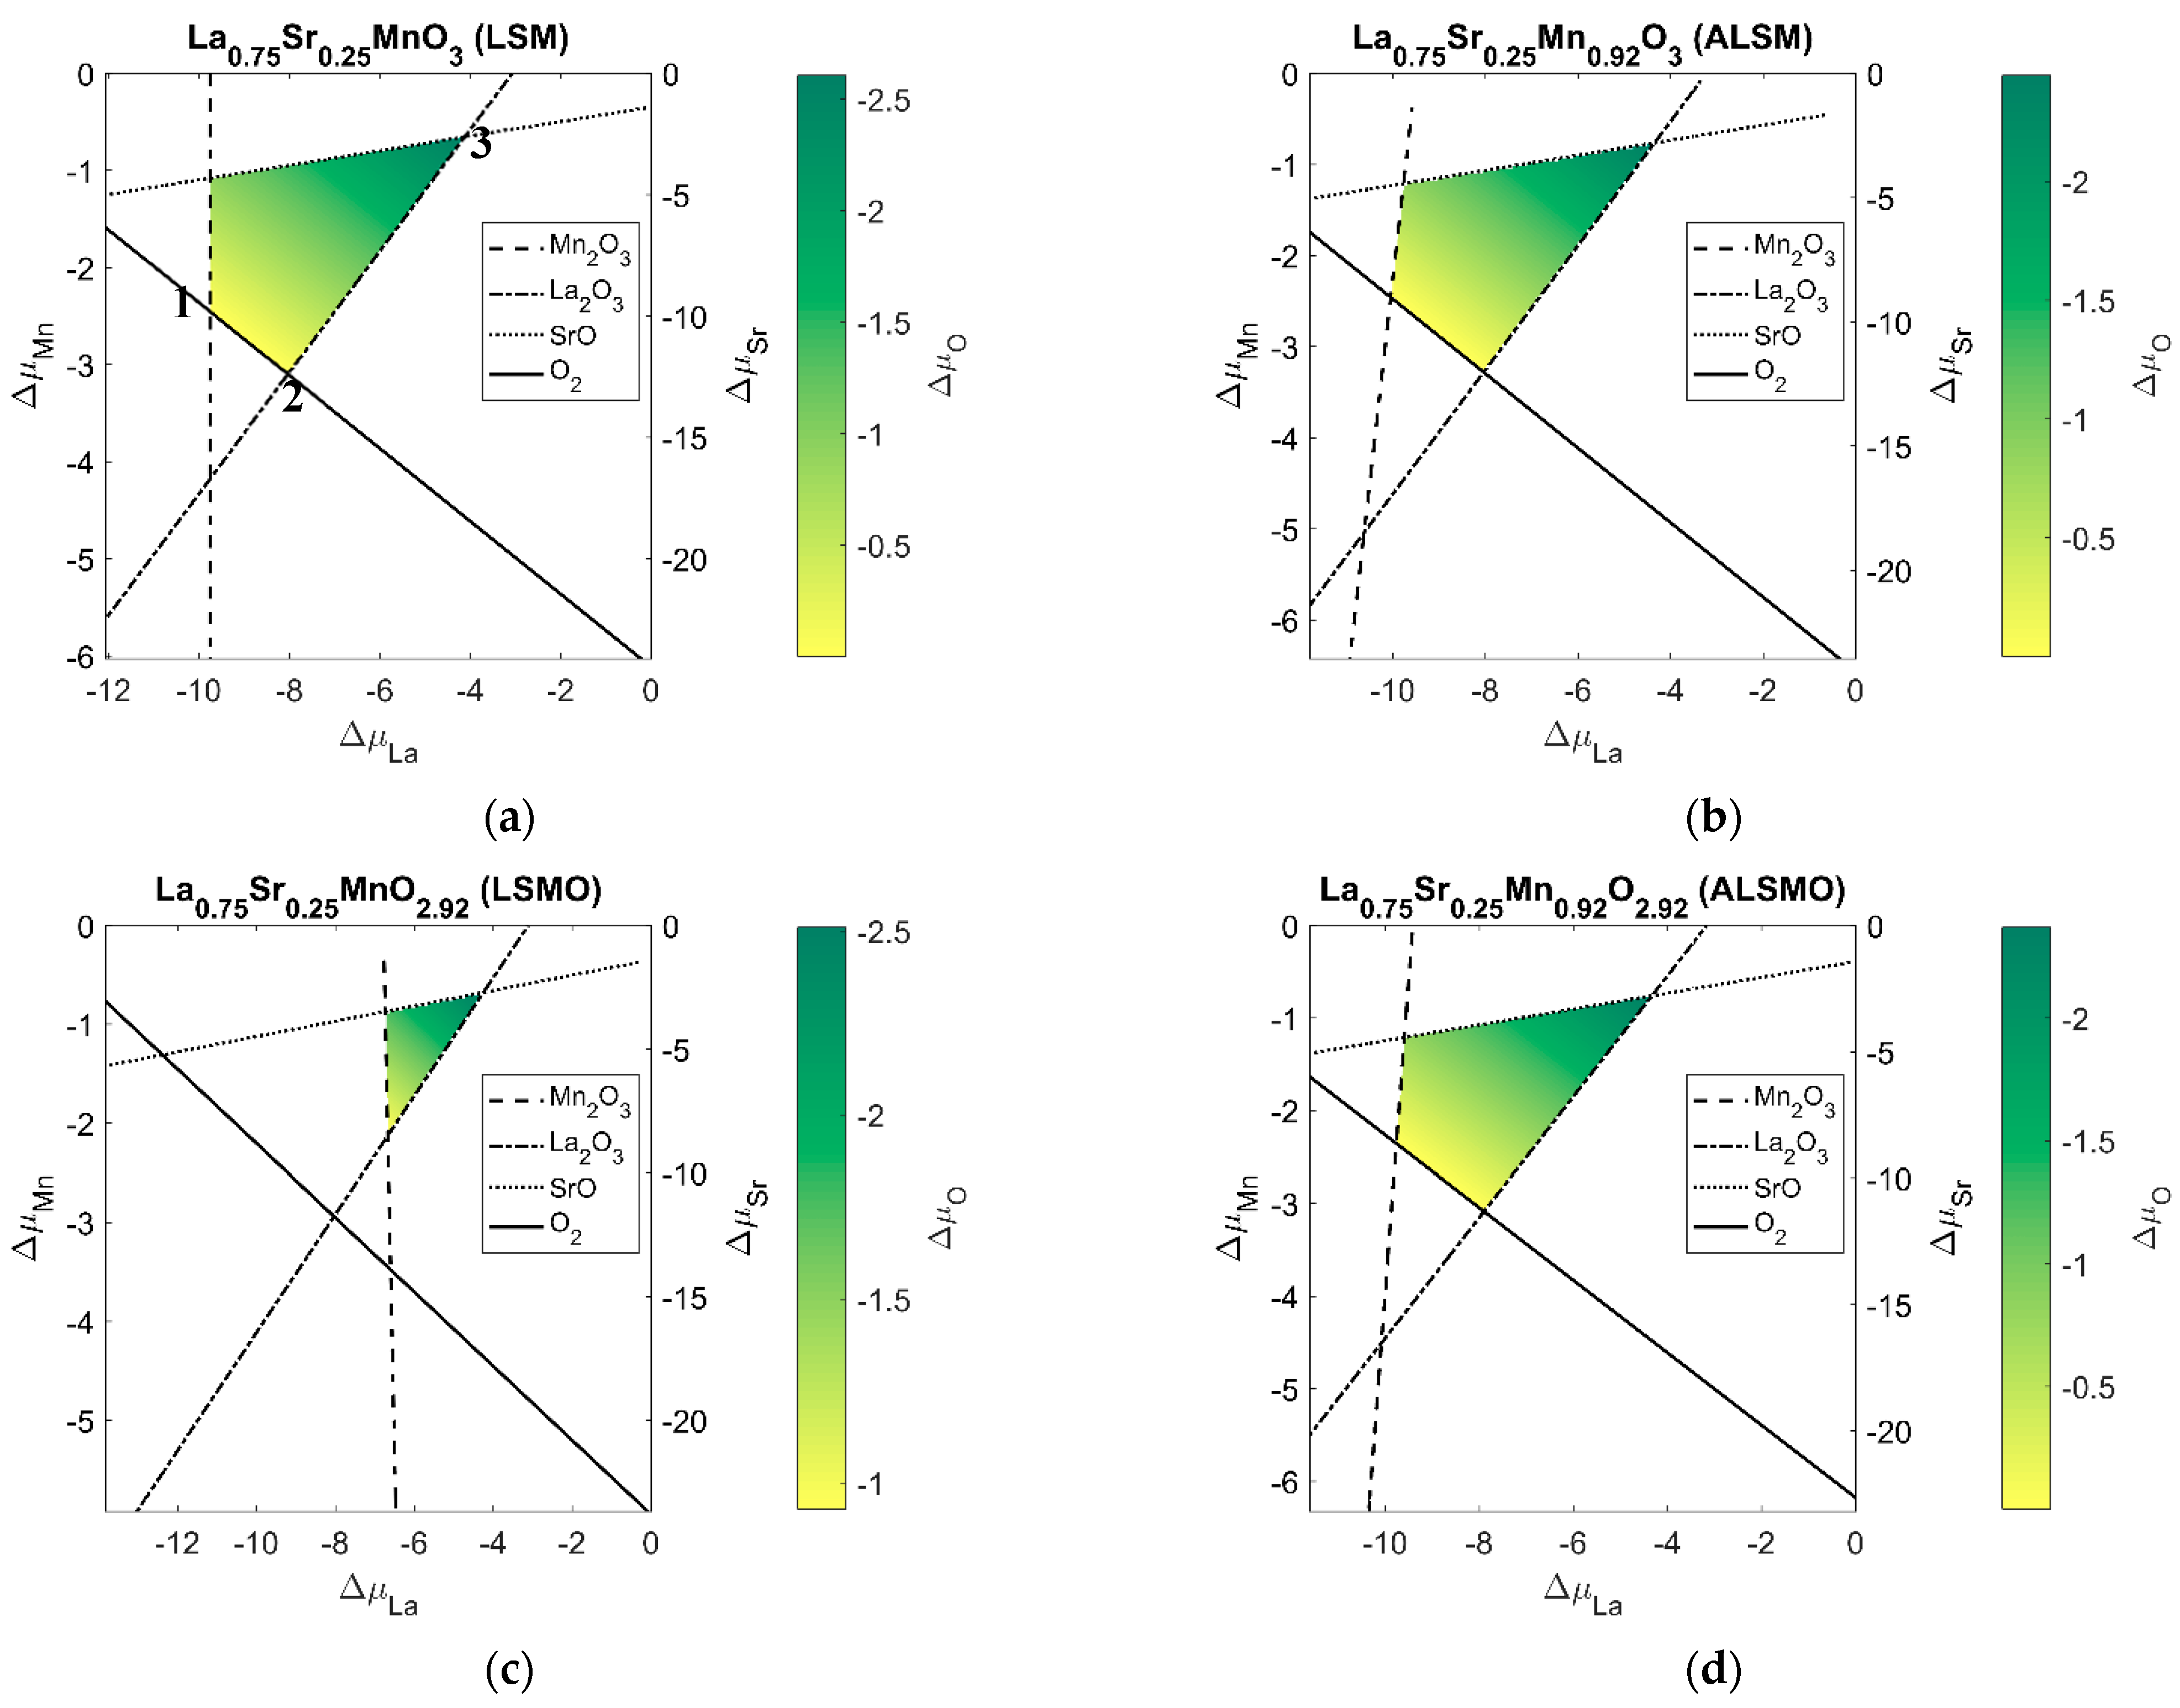
3.2. Equilibrium Stability
Alongside catalyst reactivity, catalyst stability is also important. To obtain an idea of the stability of LSM and its tuned vacant structures, phase stability plots are generated using bulk structures, as shown in
Figure 3. The phase plots approximately show where the tuned LSM structure is in equilibrium growth with an atomistic reservoir of LSM constituent elements. While LSM may not be created through equilibrium growth, the phase plots should provide some insight provided that the actual growth is sufficiently close to equilibrium growth. The plot variables of the phase plots are chemical potentials deviation. The chemical potential deviation of oxygen can be related to its partial pressure and temperature, and an estimation of vacancy concentration can be obtained for different points on the phase plots. We settle just for chemical deviation and vacancy formation energies, but an example paper where vacancy concentrations are estimated for a couple perovskite catalyst is [
19].
Unsurprisingly, the vacant structures have a smaller region of equilibrium growth region for the catalyst while avoiding competing oxide structures. This fact reflects that the vacant structures are less stable than pristine LSM. The phase plots show that there is a range of chemical potentials for each LSM variant structure for said growth. It is clear that the chemical potential has a significant effect on the vacancy formation energy, as shown in Equation (9).
It is to be noted that all the plots were constructed using ground-state electronic energies. More rigorous calculations could be performed to account for zero-point vibrational energies and finite temperature effects, as was calculated for the overpotential intermediates. Such rigor was not deemed necessary here, as it is expected that such contributions to be small compared to the electronic contribution to the free energy. Furthermore, the analysis here lends itself to a cancellation of error that occurred from ignoring temperature and zero-point vibration contributions among all considered structures.
3.3. Vacancy Formation Energies
The variation in the vacancy formation pathway (as shown in the following
Figure 4) is investigated by calculating the various vacancy formation energies using extreme chemical potential values associated with oxygen-poor and oxygen-rich conditions, as shown in
Figure 3. The vacancy formation energy pathways show that both O and Mn vacancy can be created via different pathways to achieve the desired ALSMO structures at different experimental conditions such as O-rich and O-poor environments. Using the LSM phase plot along with ground-state electronic energies of the defect structures, the vacancy formation energies are calculated, as shown in
Table 1.
The last two rows of
Table 1 share the simultaneous formation of both a Mn vacancy and an O vacancy. However, the rows differ in the relative position of the two vacancies. The second to last row is for an oxygen vacancy and a Mn vacancy placed closed together, whereas the last row is for where the oxygen vacancy and Mn are placed farther apart. The first row of
Table 1 shows the large variation in vacancy formation energy with the variation of chemical potential. Indeed, the Mn vacancy formation energy resulting in ALSM varies over a 4 eV range with the variation in the oxygen’s chemical potential. The second row of
Table 1 shows that the resulting values for vacancy formation energy, at least in the case of oxygen vacancy, make some intuitive sense, as an oxygen vacancy is much less favorable under oxygen-rich conditions than oxygen-poor conditions.
Table 1 can also be used to inform what growth conditions should be used for the perovskite catalyst. LSMO had the worse catalytic activity, while ALSMO had the best catalytic activity followed by ALSM. Therefore, it stands to reason that the oxygen-poor condition should be avoided to avoid the formation of LSMO and the oxygen-rich condition labeled “2” should be utilized to promote the formation of ALSM and ALSMO. The previous XPS results suggest that ALSM contributes to O vacancy near the catalyst’s surfaces [
2]. The vacancy formation energies reported in
Table 1 somewhat support the notion that A-site excess by Mn vacancy contributes to an O vacancy. It stands to reason that if a Mn vacancy contributes to an O vacancy, then we would expect that when the vacancies are in closer proximity, their formation energies are lower than when they are placed farther apart, as the vacancies are not interacting. Indeed, this is the case as the vacancy formation energies are all lower for the neighboring Mn and O vacancy than for the Mn and O vacancy placed farther apart. However, both vacancy formation energies clearly suggest that ALSMO is a stable material.
3.4. p-Band Center
The oxygen p-band center has been proposed as a descriptor of both catalyst activity and stability, with the most active catalyst having an oxygen p-band center neither too close nor too far from the Fermi level. However, for some Mn oxide-based catalysts, the oxygen p-band center is not a suitable descriptor of catalyst activity. This is thought to be because of a change in the reaction mechanism for some Mn oxide catalyst. Therefore, the oxygen p-band should still be a descriptor for catalyst stability. The reported limit at which a perovskite catalyst becomes unstable is when the oxygen p-band center is less than about −1.75 eV from the Fermi level [
16]. We have also calculated the p-band center of stoichiometric LSM structures, as shown in
Table 2.
The results indicate that p-band centers are within the limits of stability. However, ALSM and ALSMO are approaching close to the stability limit.


