1. Introduction
The pollution of the oceans, seas, and rivers is caused by numerous organic and inorganic dyes and consider a serious problem in our life [
1]. The vast development of chemical and petrochemical industrial operations around the world are blamed for the spread of such dangerous compounds. There are a few examples of hazardous materials such as MB, methyl violet, methyl orange, potassium permanganate, etc. [
2]. Dyes are usually poisonous due to their negative impact on environmental processes, which affects aquatic species’ gills and causes spawning places and refuges to be disrupted. Therefore, continuous searching for suitable technologies since water treatment and purification should be among the major interest in our lives. Amongst these technologies, the photocatalytic degradation of organic pollutants such as hazardous dyes is considered a promising technology for water purification [
3].
The photocatalytic performance, as well as the catalytic kinetics, were extensively studied by using numerous metal oxides, complex metal oxides, sulfides, nitrides, and semiconductors-based materials such as TiO
2, ZnO, CuO, etc. [
1,
2,
3,
4,
5,
6,
7,
8,
9,
10]. Additionally, there are several efforts for studying the photocatalytic kinetics of various composites containing various transition metal oxides and semiconductors-based materials [
1,
2,
3,
4,
5,
6]. The purpose of such studies is to shift the photodegradation from the ultraviolet into the visible or/and acquire a high degradation efficiency by controlling the optical bandgap and modifying the crystal structure and morphologies of the newly formed materials [
5,
6,
7]. For example, the photocatalytic performance of TiO
2 (anatase) was improved by covering with PbO clusters to form PbO/TiO
2 composite [
5]. To address this issue, PbO modified TiO
2 introduced new states above the TiO
2 valence band, causing the band onset to shift into the visible. Hole localization on the PbO surface and electron localization on the TiO
2 surface is the result of this updated configuration. As a result of the PbO
2 modification of TiO
2, visible light photocatalysis occurs via new states just below the TiO
2 conduction band, resulting in hole localization on TiO
2 and electron localization on PbO
2. The structural properties of PbO/TiO
2 were affected by the change of molar ratio and hence affecting their photocatalytic efficiency towards Benzophenone-3 UV filter [
6]. The doping of the prepared PbO, prepared by the hydrothermal method, with Ni enhances the photocatalytic degradation of various amounts and concentrations of methylene blue (MB) assisted by the visible light [
7]. In addition, nanocomposites-based heavy metal oxide such as PbO is applied in the radiation shielding, energy storage, sensors, and ceramics industry [
8,
9]. Besides, metal oxide-based nanomaterials are received a huge interest from scientists and researchers due to their possible use for multifunctional applications in diverse science areas [
11].
The synthesis of nanocomposites from various oxides usually reveals new properties by comparison with the individual components. For instance, Al
2O
3 exhibits a wide bandgap (~9 eV) and high dielectric constant (~9), therefore Al
2O
3 is utilized for dynamic random-access memories, organic light-emitting devices, and catalyst and absorbent applications [
12]. On the other hand, the PbO and PbO
2 have good chemical stability, micro-hardness, optical transparency, and electrical conductivity which is required for the optoelectronic industry [
13,
14,
15]. The production of nanocomposites with different PbO and Al
2O
3 contents could improve the physicochemical properties of the resulting PbO-Al
2O
3 nanocomposites. For example, the formed PbO-Al
2O
3 nanocomposites showed an improvement in harmful radiation shielding technology [
8].
Al
2O
3 nanostructure’s promising qualities qualify it for a wide range of applications in industrial and personal care goods [
16,
17,
18]. Al
2O
3 nanoparticles, on the other hand, may act as free radical scavengers. These Al
2O
3 nanoparticles appear to be able to protect cells from oxidative stress-induced cell death in a way that is dependent on the particle’s structure rather than its size [
19]. The photocatalytic performance of MB under visible light irradiation using TiO
2 catalysts was enhanced by the formation of a TiO
2/Al
2O
3 heterostructure [
20,
21]. The purpose of the formation of TiO
2 heterostructure with Al
2O
3 material is due to its thermal stability and capability to deliver catalytic activity [
22]. In general, Al
2O
3 has five discrete crystal phases which have denotations δ, η, γ, θ, and α-Al
2O
3. Due to the massive surface area of γ and α-Al
2O
3 for most photocatalytic reactions, they are considered as the strongest absorber [
23]. There are various metal oxides are incorporated together with Al
2O
3 such as V
2O
5, Fe
2O
3, Ga
2O
3, Bi
2O
3, etc., to enhance the photocatalytic performance for removing disparate hazardous dyes [
24,
25,
26]. The mechanism during electrochemical degradation of neutral red using PbO
2/α-Al
2O
3 composite was studied by Yao et al. [
27].
The conductivity and photoluminescence (PL) properties of composite solids are increased by heterogeneous doping of insulating dispersoid in the host matrix [
28]. The increase in conductivity can be explained by several factors related to the physical and chemical properties of the composites. Among the mechanisms postulated is the space-charge layer effect [
29], high concentration of point defect [
30], and phase transition [
31]. Porous materials, in general, can be used as composite solid electrolytes due to the enormous surface area available between the host matrix and the dispersoid [
32].
In the present work, PbO-x%Al2O3 composites (where x = 0, 10, 20, 30, 40, 50, 60, 70, and 100 wt%) were prepared by microwave irradiation method. Their structural parameters were investigated using the XRD, FTIR, TEM, and PL techniques. Moreover, their photocatalytic performance for removing the MB from the wasted water was studied under ultraviolet-visible or visible light irradiation for various irradiation times, and different kinetics models were investigated.
2. Results and Discussion
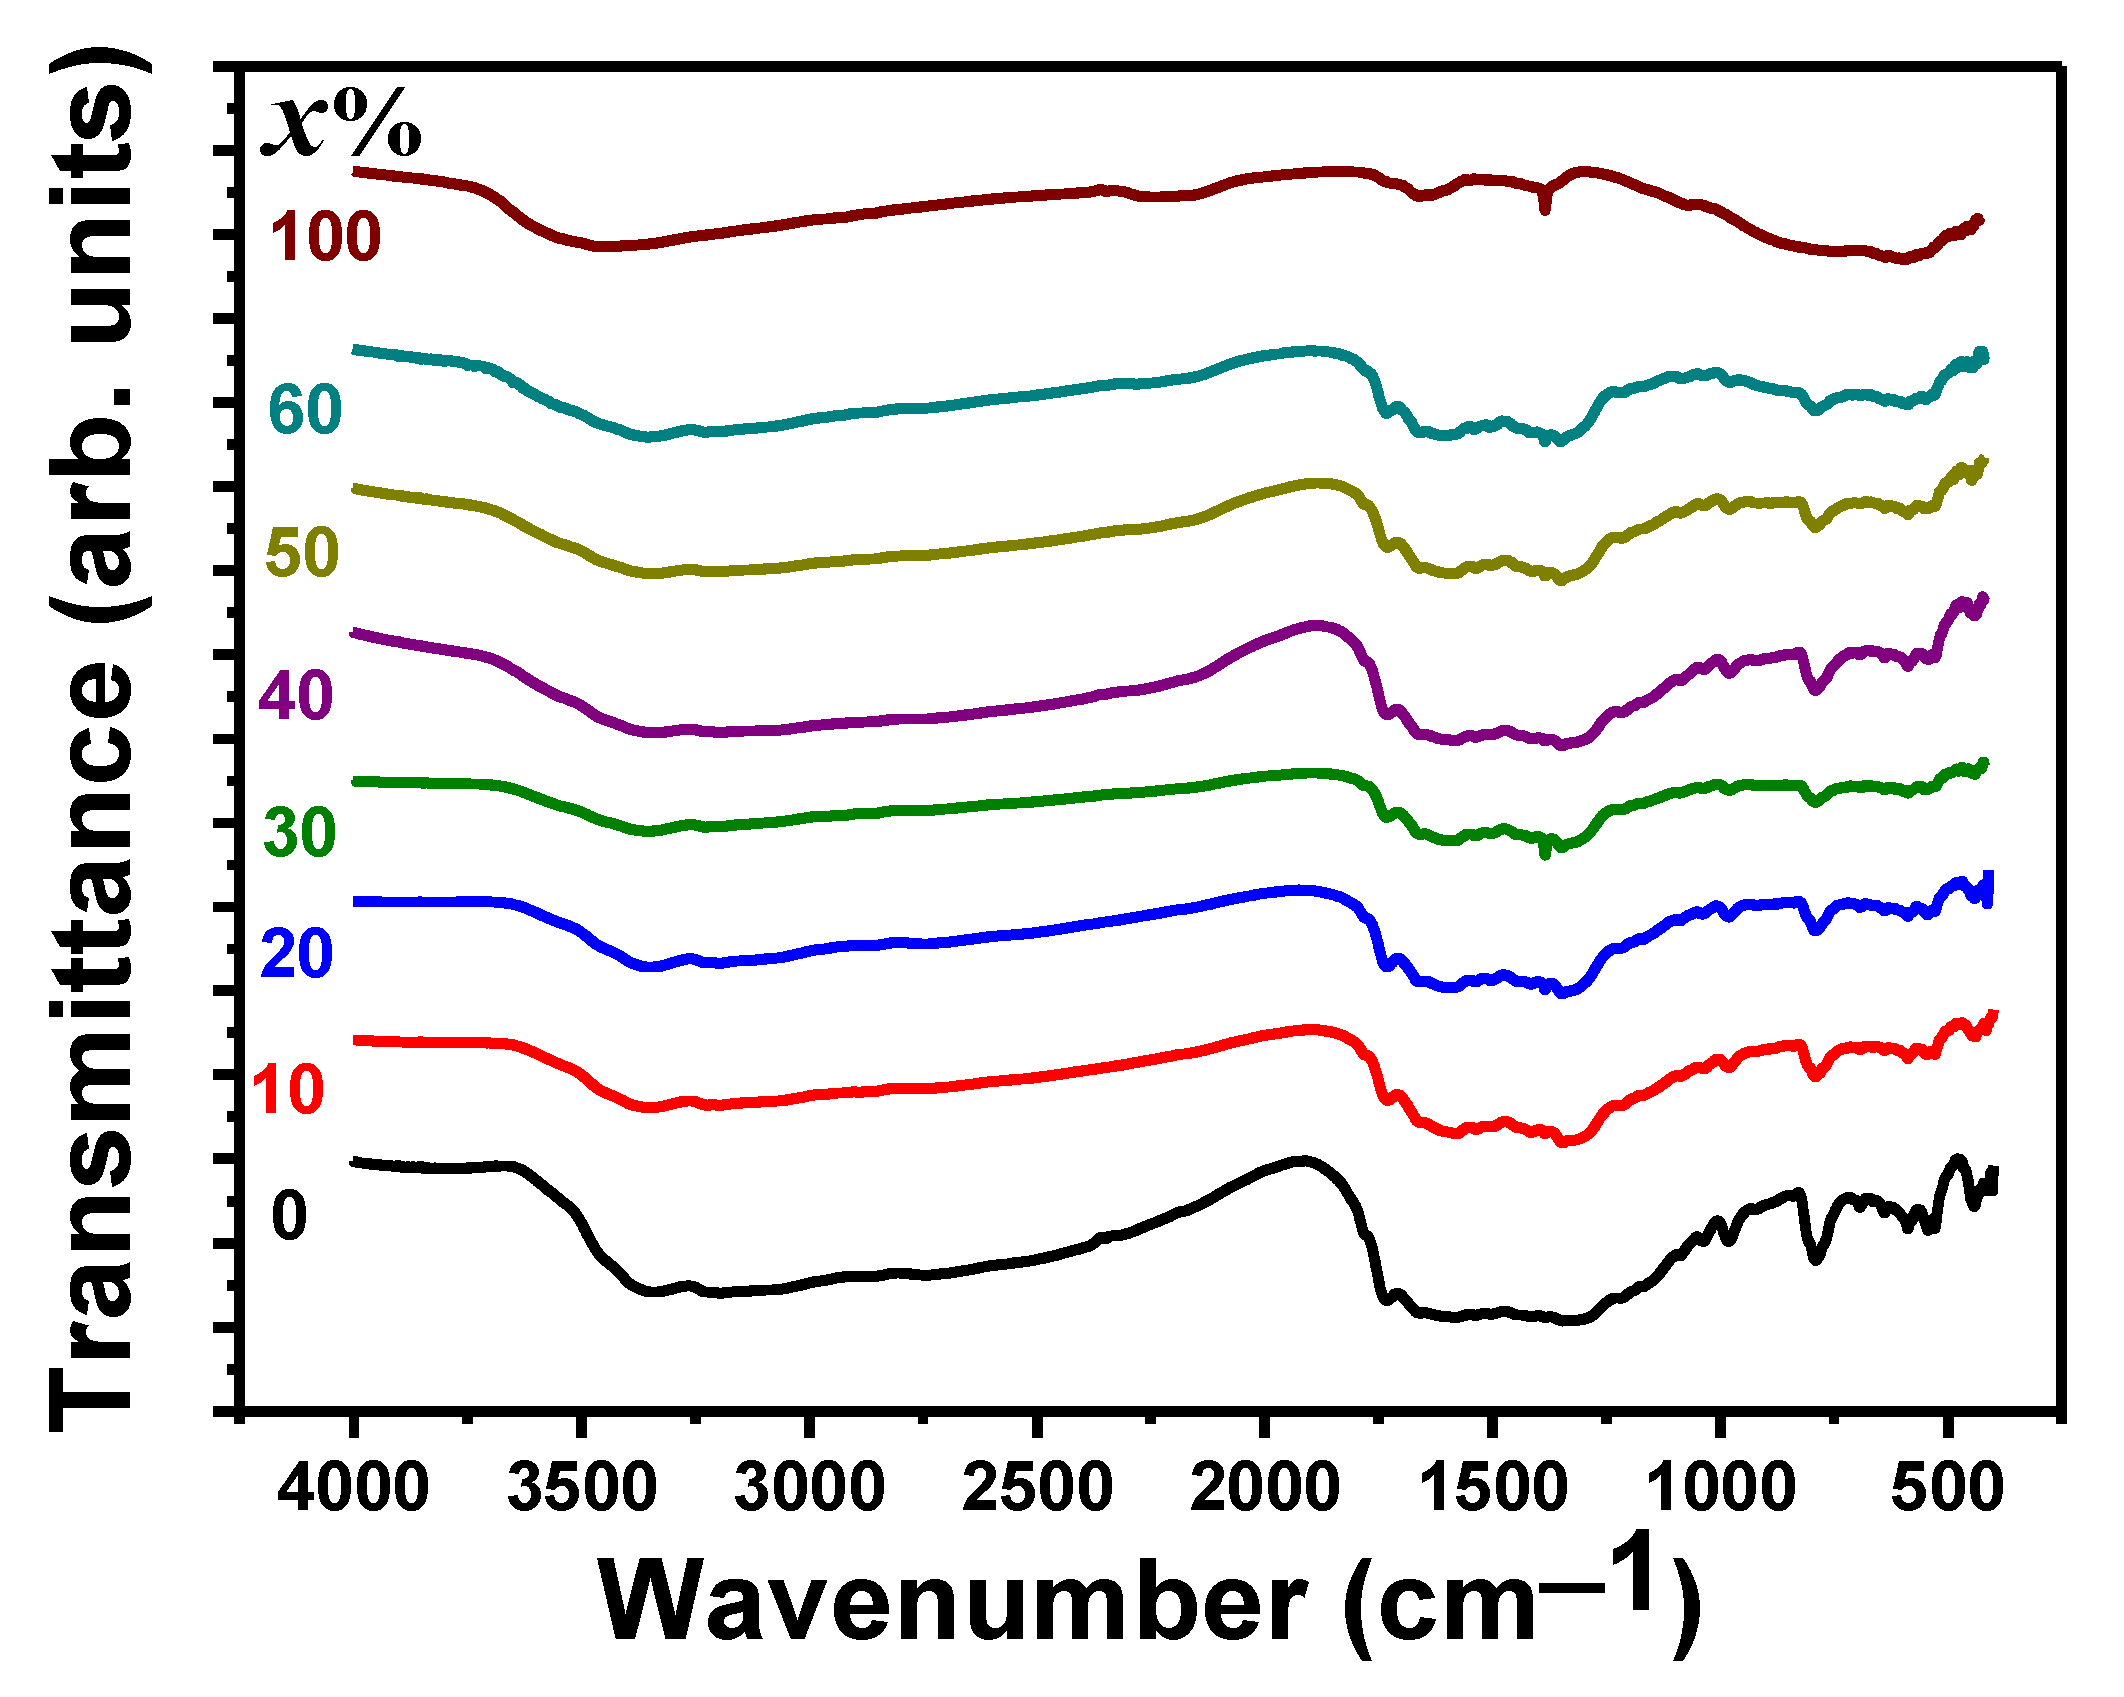
Figure 1 shows the FTIR spectra of PbO-
x%Al
2O
3 composites containing 10, 20, 30, 40, 50, 60, and 100% Al
2O
3 nanoparticles. There is an absorption peak was observed around 462 cm
−1 related to Pb-O stretching [
33], which is observed in pure PbO, whereas, in other samples, a small hump is visible [
33,
34]. A sharp peak was seen around 788 cm
−1 representing the asymmetric bending vibration of Pb-O-Pb and this peak disappears in pure Al
2O
3 nanoparticles. In other words, this peak is more intense for pure PbO samples, and their intensity decreases with an increase in the percentage of Al
2O
3 nanoparticles [
34,
35]. There is a hump appearing between 500 and 900 cm
−1 belonging to the vibrational frequencies of the coordinate O–Al–O bond [
24,
36]. The broad peak that centered around 601 cm
–1 in the region between 500 cm
−1 and 900 cm
−1 is a characteristic feature of the vibrational frequencies of coordinate O–Al–O bond. The stretching vibration of the Al–O bond is also responsible for the observed peaks at 821, 722, and 569 cm
−1 [
37]. The Al–O bonds are responsible for the bands seen at 1035, 750, and 514 cm
−1 [
38]. A sharp peak was seen at 1385 cm
−1 is a characteristic of the stretching vibration of the Al-O-Al was observed for the pure Al
2O
3. The water molecules and peaks formed in the wavenumber of 1733 cm
−1 correspond to the flexural O-H group of the water molecule.
Table 1 summarizes all of the observed FTIR peaks for more clarity and to see all of the trends and changes in the various composites.
Figure 2a shows the XRD charts for the investigated PbO-
x%Al
2O
3 composites. The pure PbO, Al
2O
3, and PbO-
x%Al
2O
3 composites are partially crystalline with crystalline ratios close to 60%, and the rest is amorphous. In addition, the formed phases in the pure or composite samples show an orthorhombic crystal structure. There are few diffraction peaks were observed for the pure Al
2O
3 phase at 2θ = 25.58, 35.14, 37.79, 43.36, 52.55, 57.52, 66.55, and 77.23° that associated with the Miller indices of (012), (104), (110), (113), (024), (116), (214), and (119), respectively. These seen diffraction peaks were well agreed with the JCPDS No-010-0173. Also, there are few diffraction peaks were observed for the pure PbO phase at 2θ = 27.60, 30.25, and 36.25° that corresponds to the Miller indices of (120), (200), and (111), respectively. These observed diffraction peaks were well agreed with the JCPDS No-04-021-0870, which is associated with the PbO phase.
The Scherrer’s equation:
, where
k is constant,
λ is the wavelength,
θ is Bragg’s angle, and
is the full width at half maximum, was used to compute the crystallite size. In addition, the dislocation density (
) and microstrain (
) were determined using
, and
, respectively. The average crystallite size for individual oxides, PbO and Al
2O
3, have an equivalent value which equals 32.10 nm. Meanwhile, the average crystallite for other composites is changed depending on the ratio of the oxide components. The values of the average crystallite size are 35.26, 16.45, 20.22, 17.90, and 32.71 nm for
x equals 20, 40, 50, 60, and 70% in the PbO-
x%Al
2O
3 composites. The smallest value for the average crystallite size was observed for PbO-40%Al
2O
3 composites. On another side, the highest value of the average crystallite size was observed for PbO-20%Al
2O
3 composites. The investigated crystal structure parameters well agree with our previous work [
8]. It was proposed in this work that the formed alloys composites formed based on the substitution of the PbO atoms by Al
2O
3 atoms as their atoms are closed together in size. The formation of such composites with smaller crystallite sizes or smaller particle sizes could be suitable for the application that required higher surface areas.
A comparison of the average crystallite size, dislocation density, and microstrain for various composites is shown in
Figure 2b. It is generally observed that the average value of the structural parameters does not take specific trends with the change of Al
2O
3 ratio in the composites. The smaller value of crystallite size could be obtained in the range from 40 to 60% of Al
2O
3 concentration. As expected from the mathematical relation that provides the microstrain and dislocation density, their trend is similar but shows an opposite change to the change of the average crystallite sizes. It is widely accepted that a decrease in crystallite size, as well as a decrease in particle size, is followed by an increase in the surface area [
39].
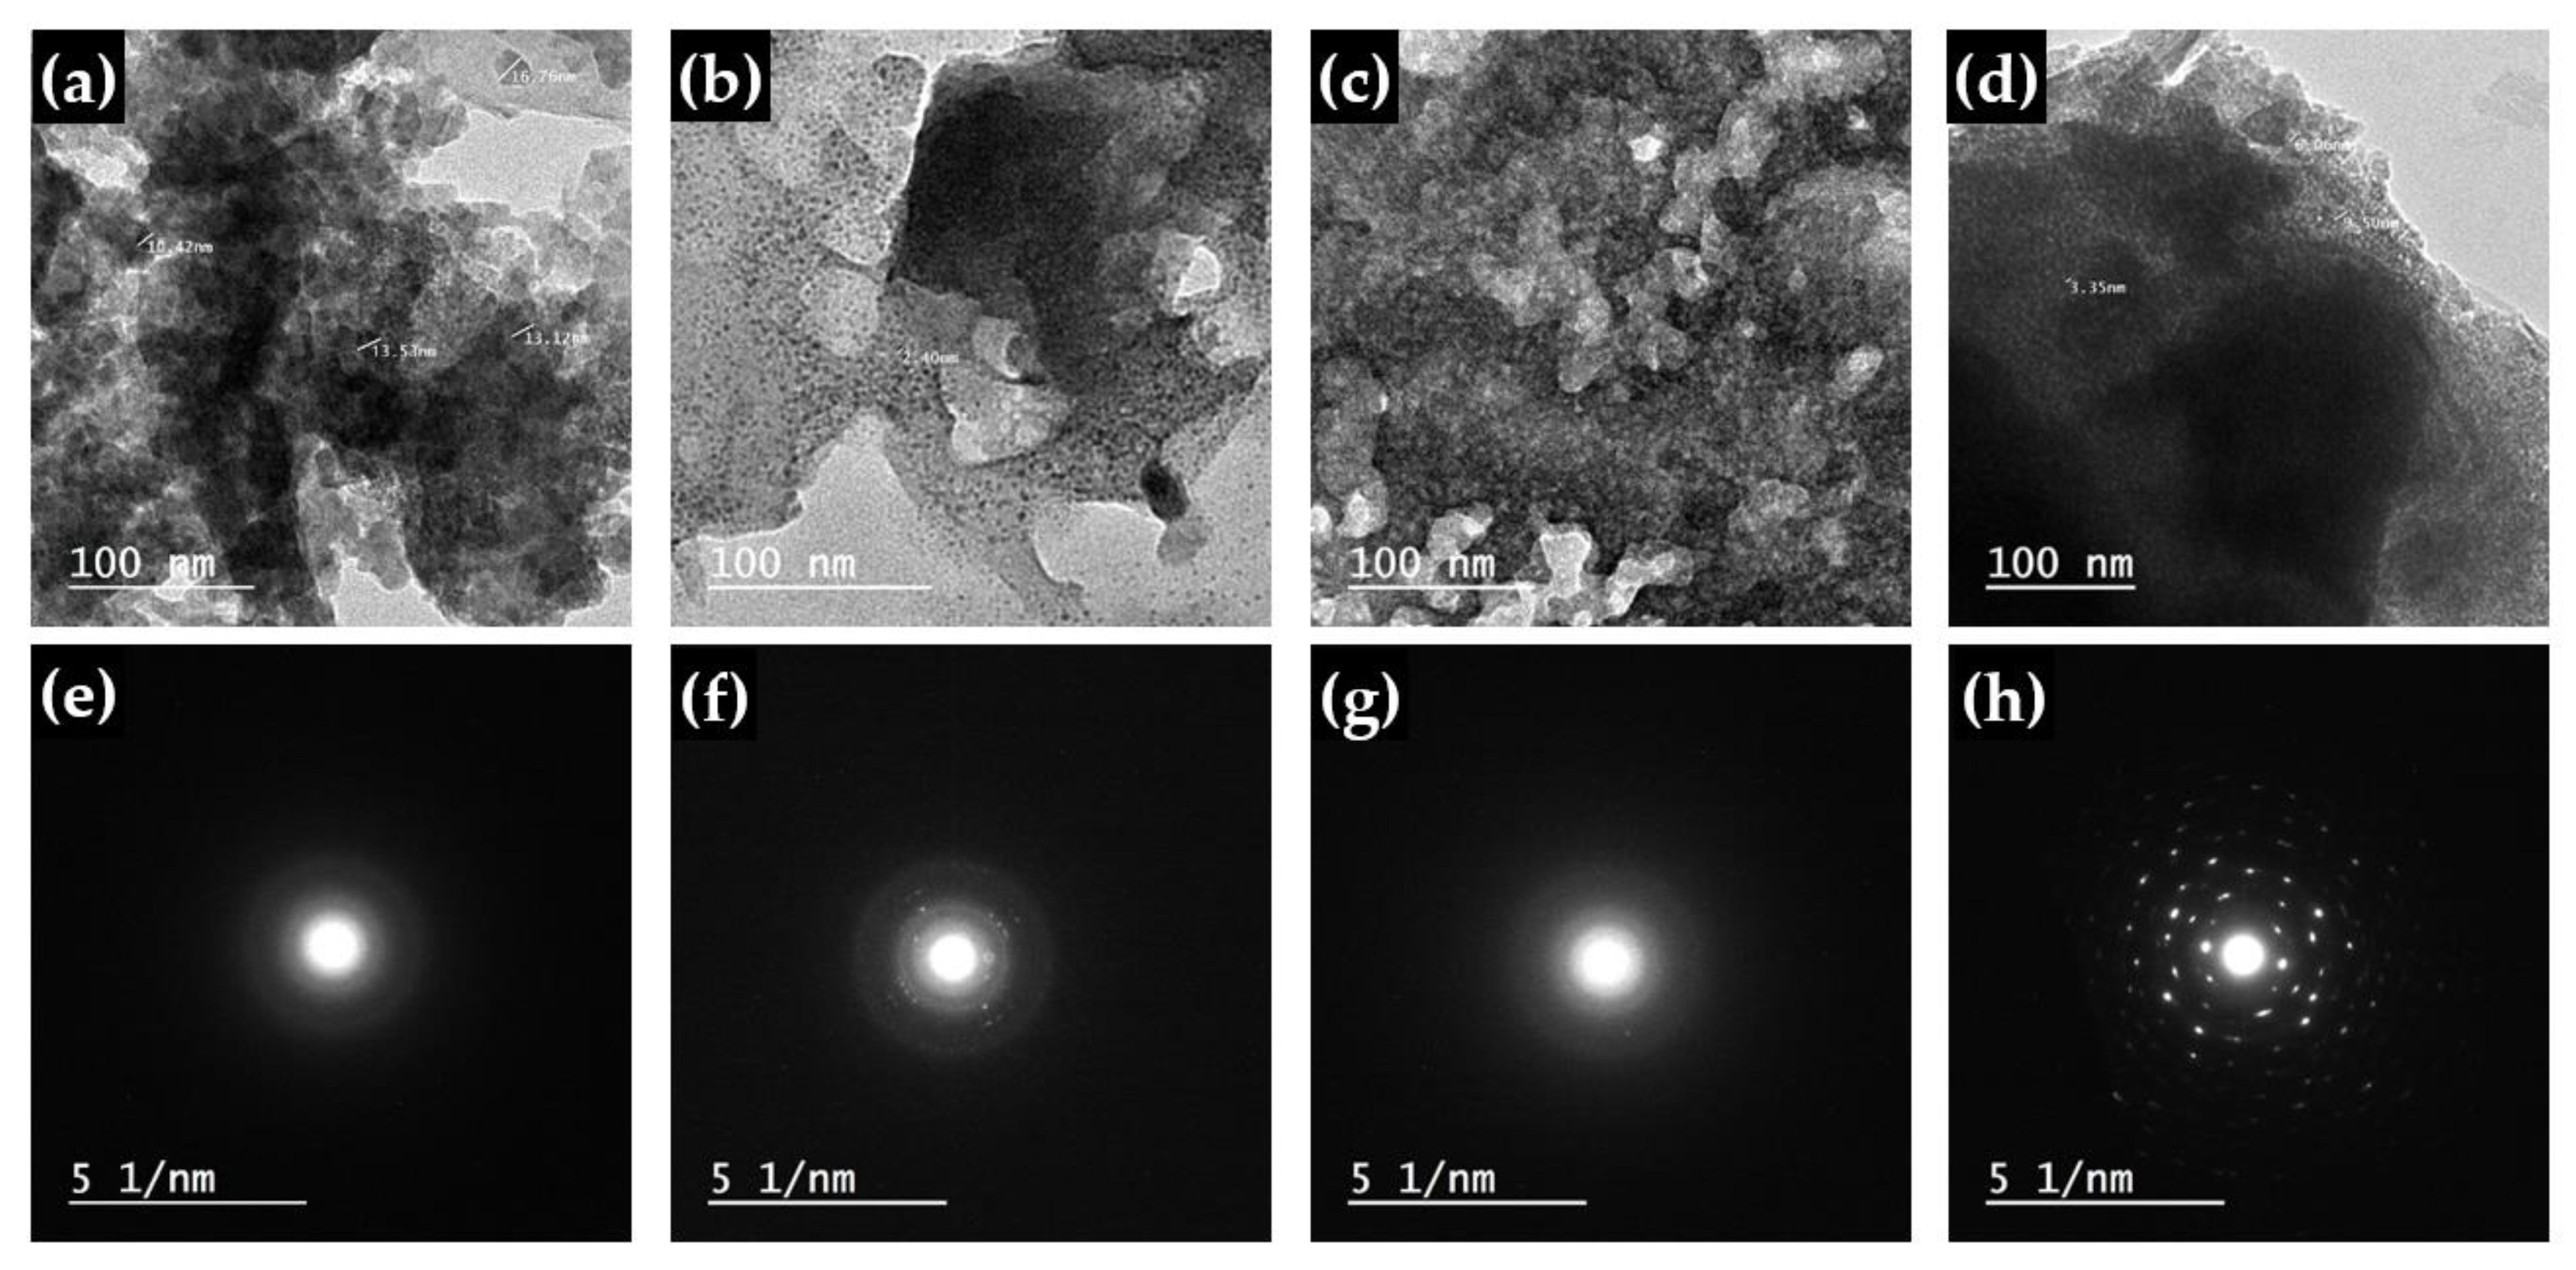
HR-TEM images at high resolving powers and a selected area electron diffraction (SAED) pattern for PbO-
x% Al
2O
3 composites (
x = 20, 40, 60, and 100%) are shown in
Figure 3a–d, and
Figure 3e–h, respectively. The HR-TEM can be used to assess the shape and size of the investigated samples in general. Particles of various shapes, such as irregularly shaped particles, have been observed. Regarding the Al
2O
3 nanoparticles (
Figure 3d), the particle is dense with an average diameter of 4 nm. Meanwhile, for the PbO-
x%Al
2O
3 composites with different contents of 20, 40, and 60, the dense particles are smaller compared to the pure Al
2O
3 sample. Moreover, the particles size is becoming large and reached 10 nm, which shows unclear crystalline lattices.
Figure 4a shows the ultraviolet-visible absorbance spectra as a function of the photon wavelength for PbO-
x%Al
2O
3 composites. The curves reveal similar behavior with the wavelength as with increasing the photon wavelength the absorbance was decreased. The decrease in the absorbance value takes place suddenly for smaller wavelengths (<350 nm), while the change in the absorbance becomes smaller for higher wavelengths (>350 nm). The maximum absorbance was observed for pure Al
2O
3 samples, while the minimum value of the absorbance was seen for PbO-60%Al
2O
3 composites. The decrease in absorption at
λ < 300 nm is caused by absorption associated with point defects in the oxygen sublattice of Al
2O
3, specifically oxygen vacancies with trapped electrons [
40].
The UV-visible absorbance spectrum was used to calculate the energy bandgap of PbO-
x% Al
2O
3 composites. Furthermore, the spectrum dependency of the absorption around the fundamental absorption edges within the framework of one electron was used to determine information about the type and mechanism of optical transitions. The experimental data of the absorbance is usually used for estimating the optical bandgap through Tauc’s function [
41].
Figure 4b demonstrates the relationship between (
αυh)
2 and (
hυ) for PbO-
x%Al
2O
3 composites. These plots show the best linear fitting to the Tauc’s relation
, where
Eg,
h, and
υ are the optical bandgap, Plank constant, and frequency, respectively. It is noticed from the graph shown in
Figure 4b that the optical transition obeys the direct allowed transition. For the extrapolation of the straight line, the optical bandgap is estimated to be equals to 4.35, 4.48, 4.61, 4.56, 4.75, and 4.83 eV for
x equals 10, 30, 40, 50, 60, and 100 in PbO-
x%Al
2O
3 composites, respectively. The estimated value of
Eg for Al
2O
3 well agrees with other work [
24]. The large values of
Eg of the prepared composites which belong to the ultraviolet range allows their application to be used as good photocatalysts under the assistance of ultraviolet irradiation and can be used for other applications that require a larger optical bandgap [
42] such as energy storage applications.
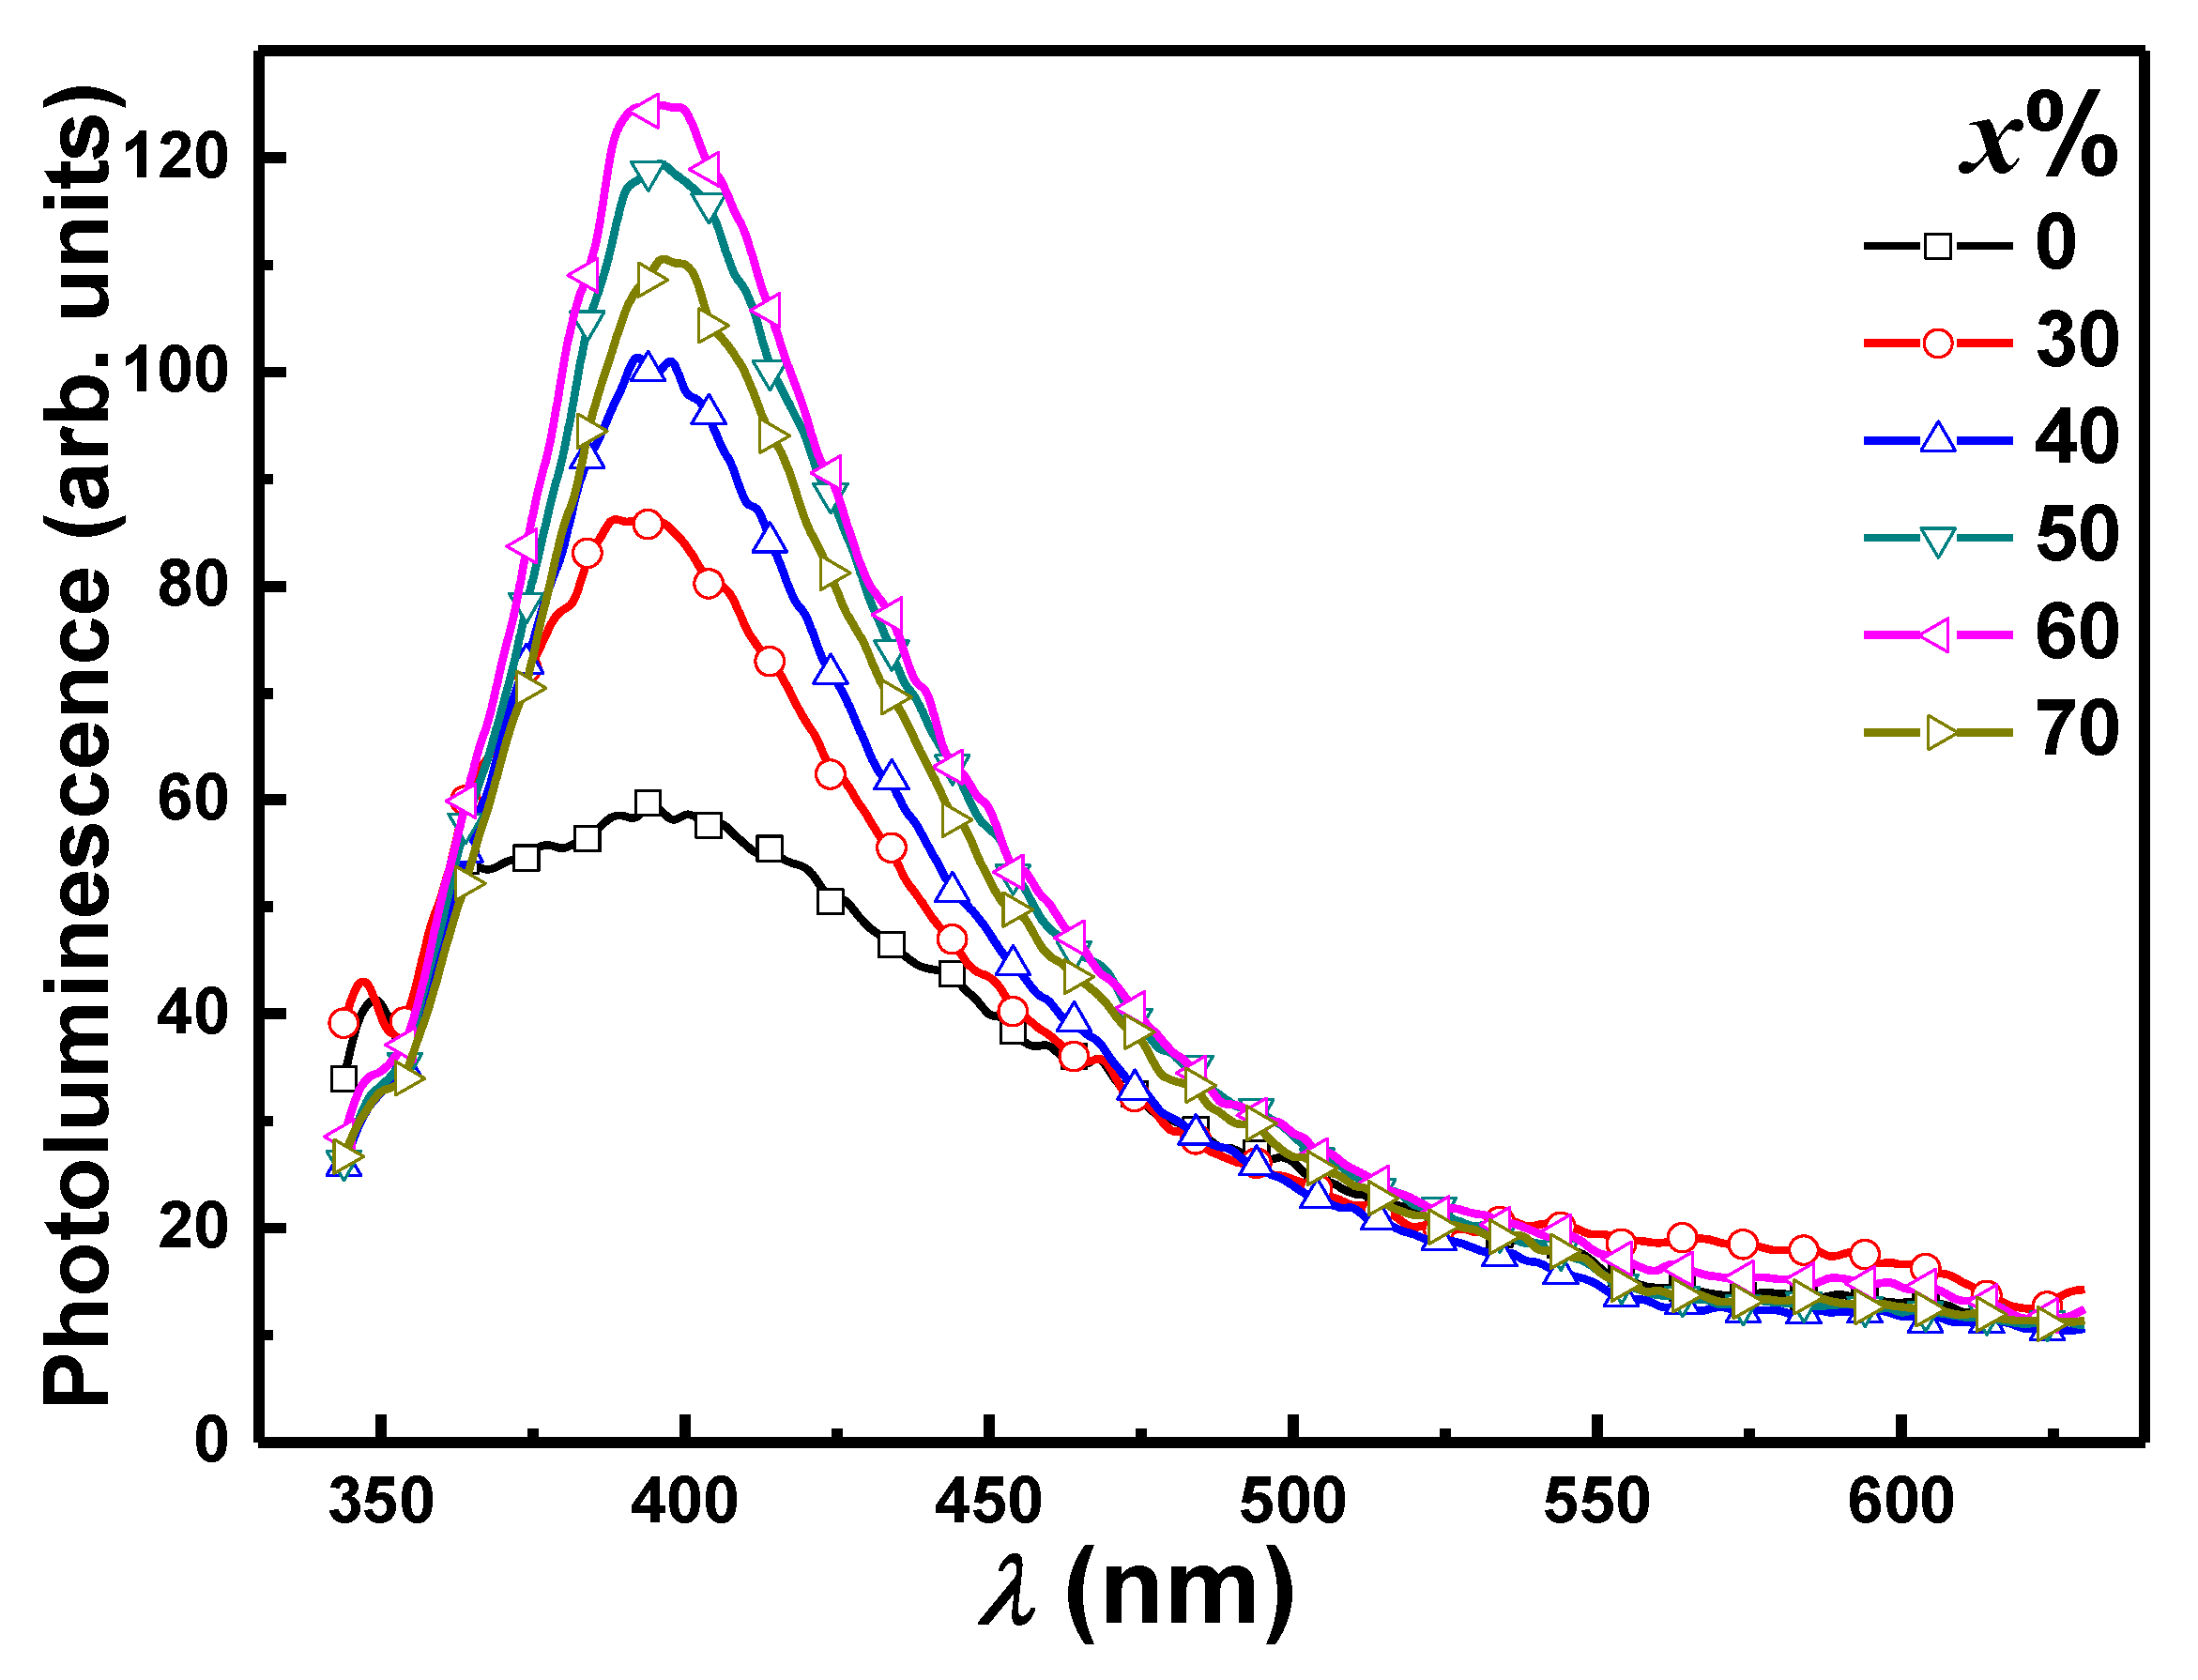
Figure 5 depicts the effect of PbO concentration on the PL emission bands of PbO-
x% Al
2O
3 composites. According to the Tauc plot analysis (
Figure 4b), the estimated optical bandgap of the PbO-
x% Al
2O
3 composites is in the range of 4.35–4.83 eV. The presence of a trap center near the band edge is indicated by the PL emission from PbO-
x% Al
2O
3 composites at 394 nm, which corresponds to 2.46 eV (less than the optical bandgap). Surface state defects in PbO-
x% Al
2O
3 composites could be responsible for trap center formation. According to the emitted PL light, the capacity of the free carriers in the trap centers is limited for pure Al
2O
3 nanoparticles. By increasing the PbO ratio in the sample, the effect of doping with PbO nanoparticles on the PL emission of PbO-
x% Al
2O
3 composites was investigated. It can be seen that the PL emission intensity at the same wavelength increases as the doping ratio increases from 0% to 60% PbO doping in PbO-
x% Al
2O
3 composites. This suggests that increasing the PbO content increases the capacity of free carriers within the trap centers. As a result, more radiative paths from these trap centers are expected. The capping agent was responsible for the observed increase in PL intensity, which was followed by the expansion of nonradiative relaxation paths on the surface of PbO nanoparticles. Increased PbO content increases PL intensity due to improved crystallinity, which is accompanied by a decrease in dangling bonds and undesirable nonradiative surface state defects. According to the preliminary results of the effect of doping in PbO-
x% Al
2O
3 composites with PbO, increasing the PbO contents in the investigated composites improved the optical properties.
Apart from investigating and determining the structural and optical bandgaps of PbO-
x% Al
2O
3 composites, these composites were also used as a catalyst for water purification or water decolorizations from waste dyes such as MB, with the use of ultraviolet irradiation.
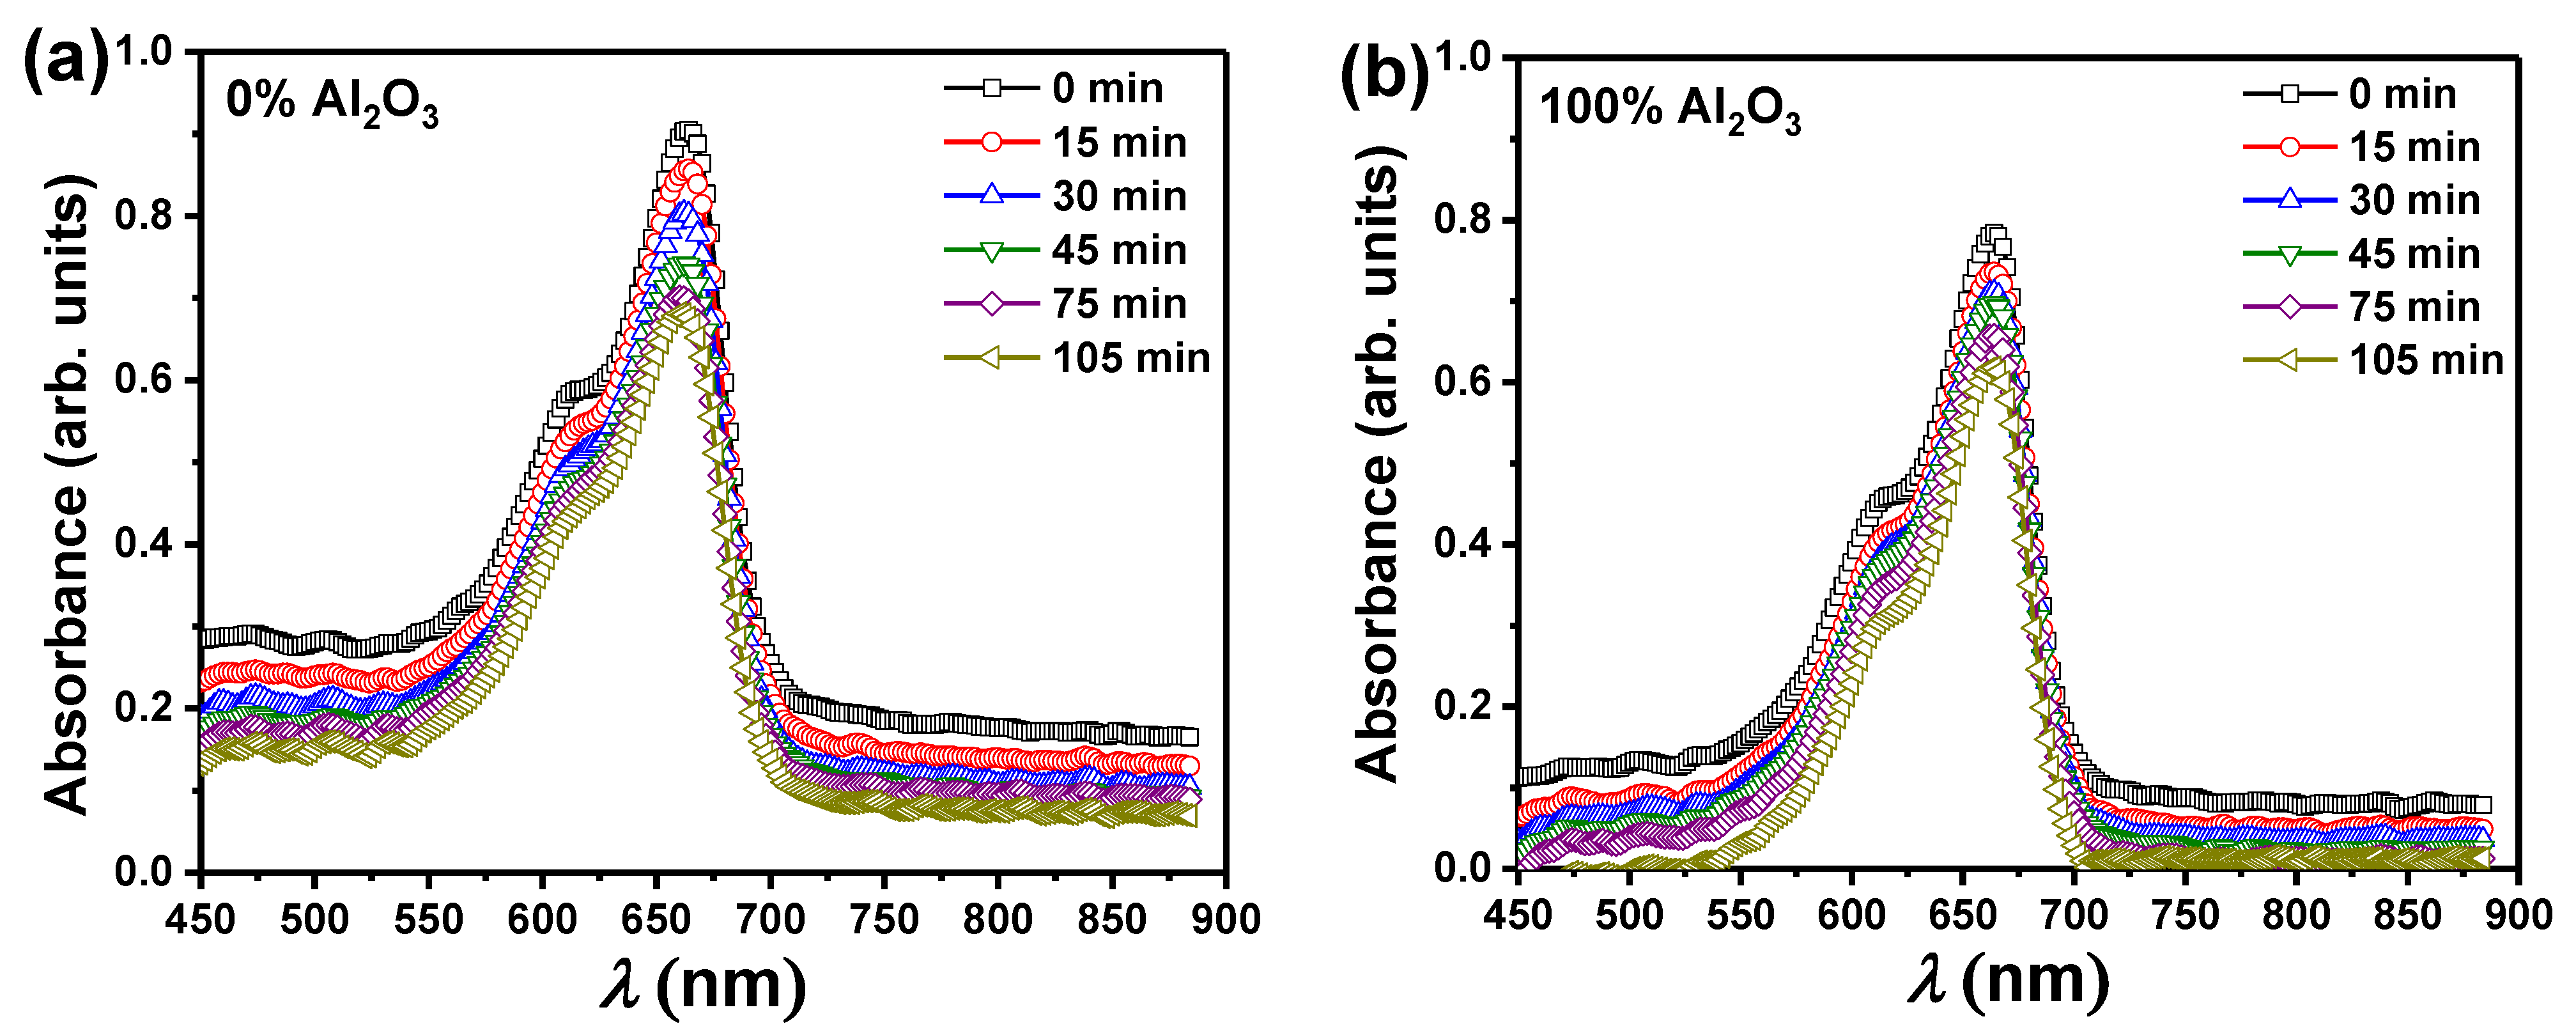
Figure 6a,b show the representative absorbance spectra as a function of incident radiation wavelength (
λ) during the removal of MB utilizing pure PbO and Al
2O
3 nanoparticles as catalysts for different irradiation periods (up to 105 min). The occurrence of one unique maximum situated at
λ = 665 nm is what characterizes the absorbance of MB solutions, according to the relationship between absorbance and
λ. Furthermore, increasing the irradiation time reduces the amount of radiation absorbed by the MB solution. This decrease demonstrates the efficacy of PbO or Al
2O
3 nanoparticles as a catalyst for removing the MB dye, and hence the possibility of wastewater treatment via photocatalytic degradation processes. The absorbance was decreased from 0.90 to 0.68 for the PbO catalyst, while for the Al
2O
3 catalyst was reduced from 0.78 to 0.62 as the irradiation time reached 105 min. Similar experiments (not shown here) were carried out for the other samples that contained both PbO, and Al
2O
3 to form PbO-
x%Al
2O
3 composites.
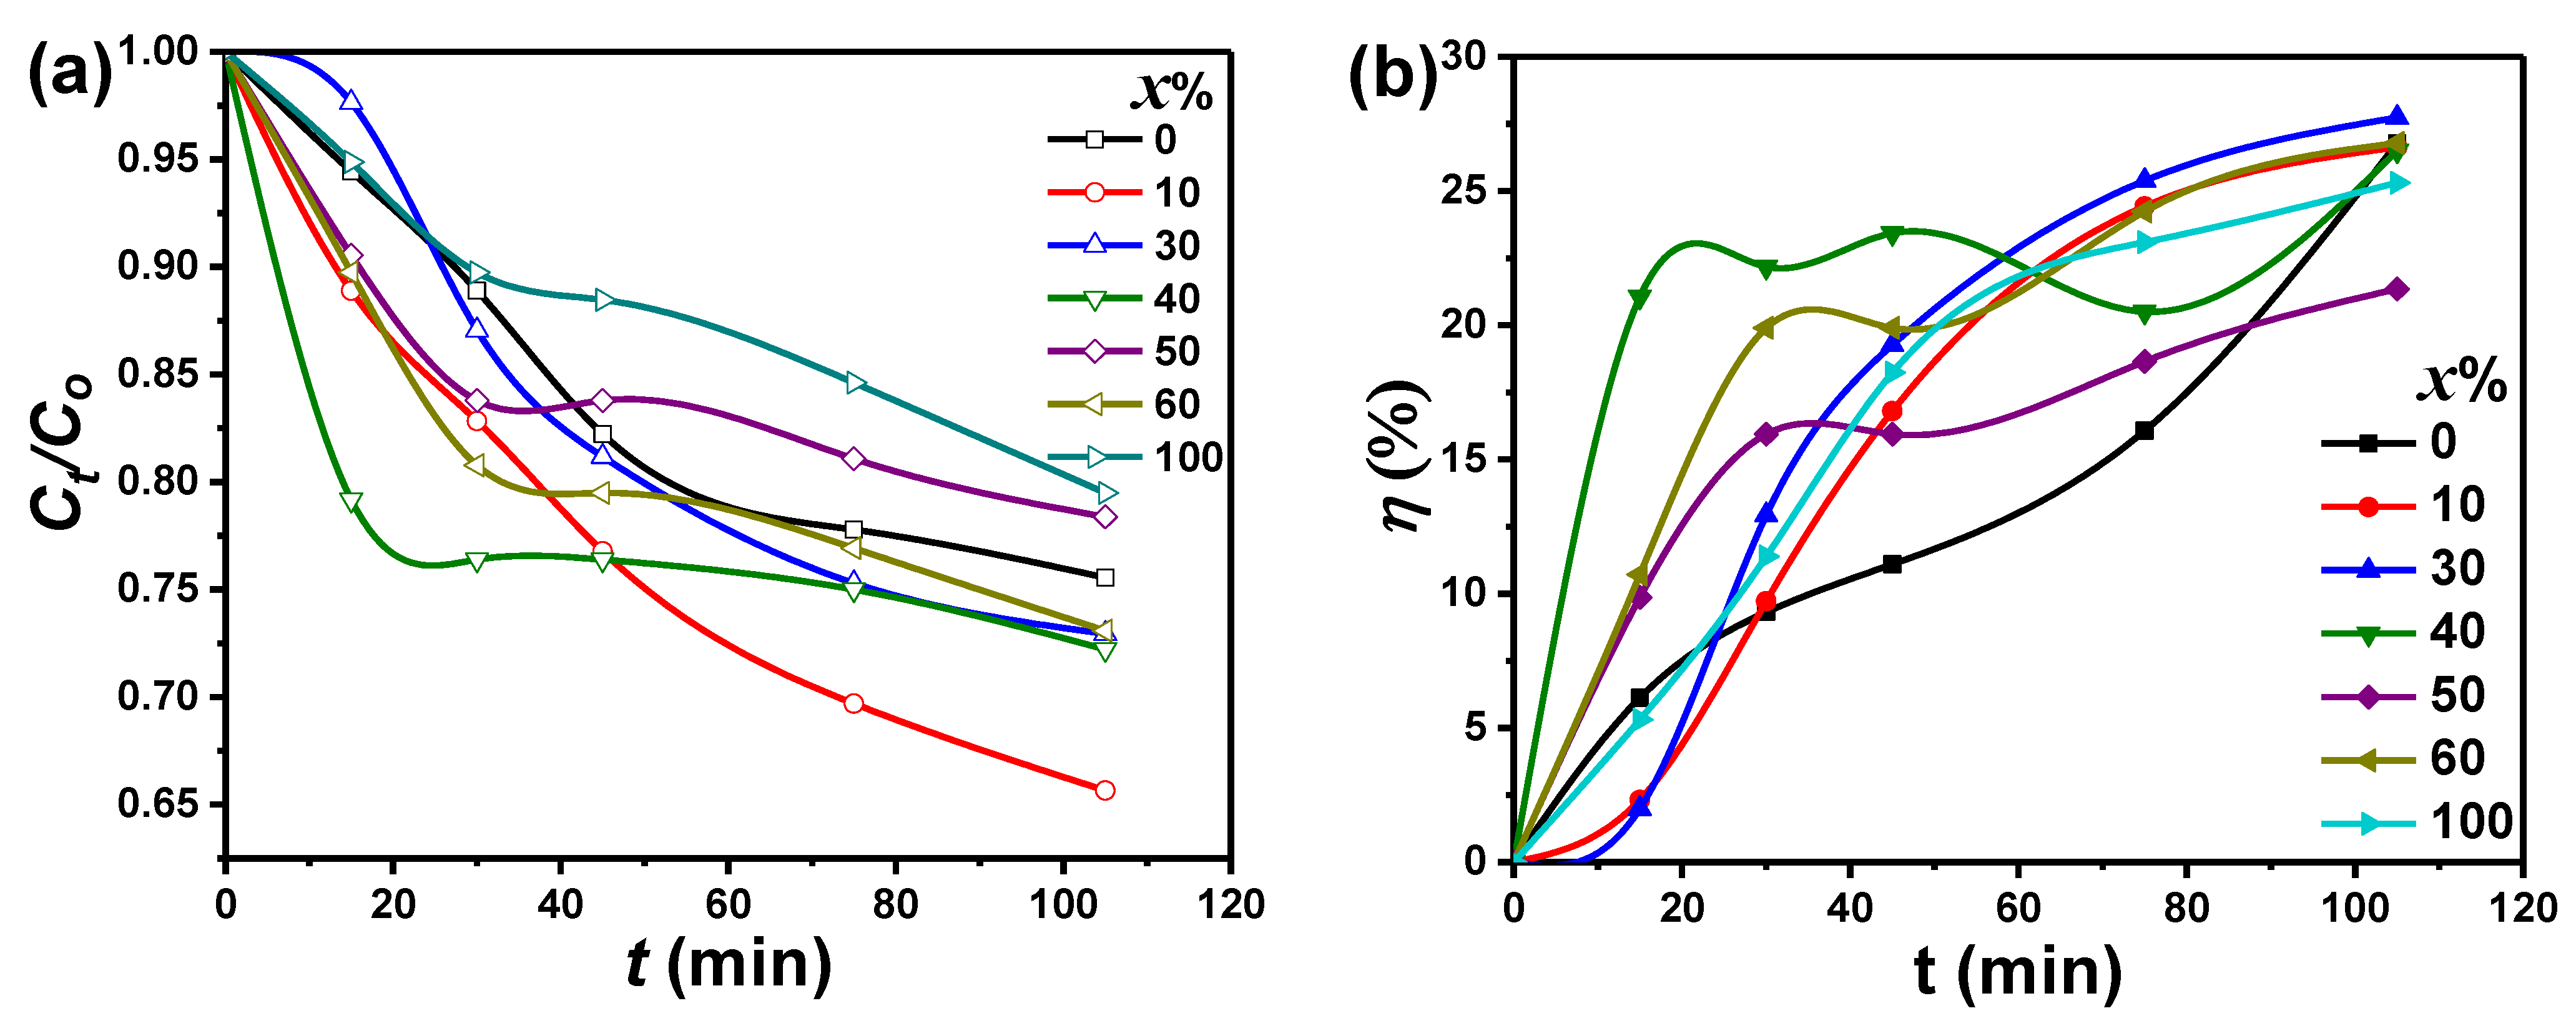
Figure 7a illustrates the MB dye photodegradation rate (
) versus the irradiation time (
t) for PbO-
x%Al
2O
3 composites. It is obvious from the figure that the PbO-40%Al
2O
3 composites showed a faster degradation rate of the MB and was reached a constant value after 20 min of the UV-visible irradiation. On another side, the PbO-10%Al
2O
3 composites revealed the highest value of photocatalytic activity compared to other composites. On the other hand, pure Al
2O
3 (100% Al
2O
3) nanoparticles had a lower photocatalytic activity value, which could be related to the greater bandgap limiting the visible absorption region. The increased photogenerated electrons and holes, which might be separated in the case of PbO nanoparticles, are the principal light absorbers for composites with a larger ratio of PbO. As a result, we may conclude that the PbO nanoparticle is a good photoelectron acceptor, trapping the photoelectron and reducing photoelectron-hole pair recombination when compared to Al
2O
3. Additional tests were performed to confirm such concerns, and the results are shown later.
The following equation can be used to evaluate the removal effectiveness of MB degradation of photocatalytic (
), as well as other dyes such as potassium permanganate and methyl orange:
[
24], where
Co is the waste initial concentration,
is the waste residual concentration after an irradiation time (
t),
is the waste initial absorbance, and
is the waste absorbance after a fixed irradiation time.
Figure 7b shows the removing efficiency of MB in the case of PbO-
x%Al
2O
3 nanocomposites as a function of
t. For PbO-40% Al
2O
3 nanocomposites, as shown in
Figure 7b, the estimated
was significantly increased up to 23% as the irradiation time increased to 20 min, while was slightly increased up to 26% with some oscillations in the efficiency value for a further increase in the UV-visible irradiation time up to 105 min. For longer periods of UV-visible irradiation, the maximum efficiency (28%) for removing MB was observed for PbO-30%Al
2O
3 composites, while the minimum value (21%) was observed for PbO-50%Al
2O
3 composites. The PbO-30%Al
2O
3 and PbO-40%Al
2O
3 composites could be considered as the best catalysts samples, and this could be attributed to the formed smallest crystallites size according to the XRD analysis, among other parameters.
The degradation rate constants of MB dye were determined using Langmuir-Hinshelwood kinetics to further investigate the catalytic activity of PbO-
x% Al
2O
3 composites. The disintegration rate of a pseudo-first-order response can be calculated using the formula:
[
43], where
k is the degradation rate constant,
K is the adsorption equilibrium constant, and
kapp is the apparent rate kinetic constant or called pseudo-first-order reaction constant. The reaction rate was evaluated from
. The determined value of
kapp for various composites was summarized in
Table 2. The largest value of
kapp is 4.6 × 10
−3 min
−1 and was observed for PbO-10%Al
2O
3 composites, while the smallest value is 2.3 × 10
−3 min
−1 and was observed for pure Al
2O
3 nanoparticles.
At any irradiation period (
) and equilibrium (
), the adsorbed masses of MB dye per unit mass of PbO-
x%Al
2O
3 composites (
q in mg/g) were calculated using:
, and
[
25]. Here,
is adsorbed capacity quantities of MB at a time (
t),
is equilibrium quantities adsorbed of MB,
is the initial concentration of MB solution (mg/L),
is concentrations of adsorbate (mg/L) at the irradiation time (
t),
is concentrations of equilibrium adsorbate (mg/L),
V is the volume of MB adsorbate (L), and
W adsorbent mass (g).
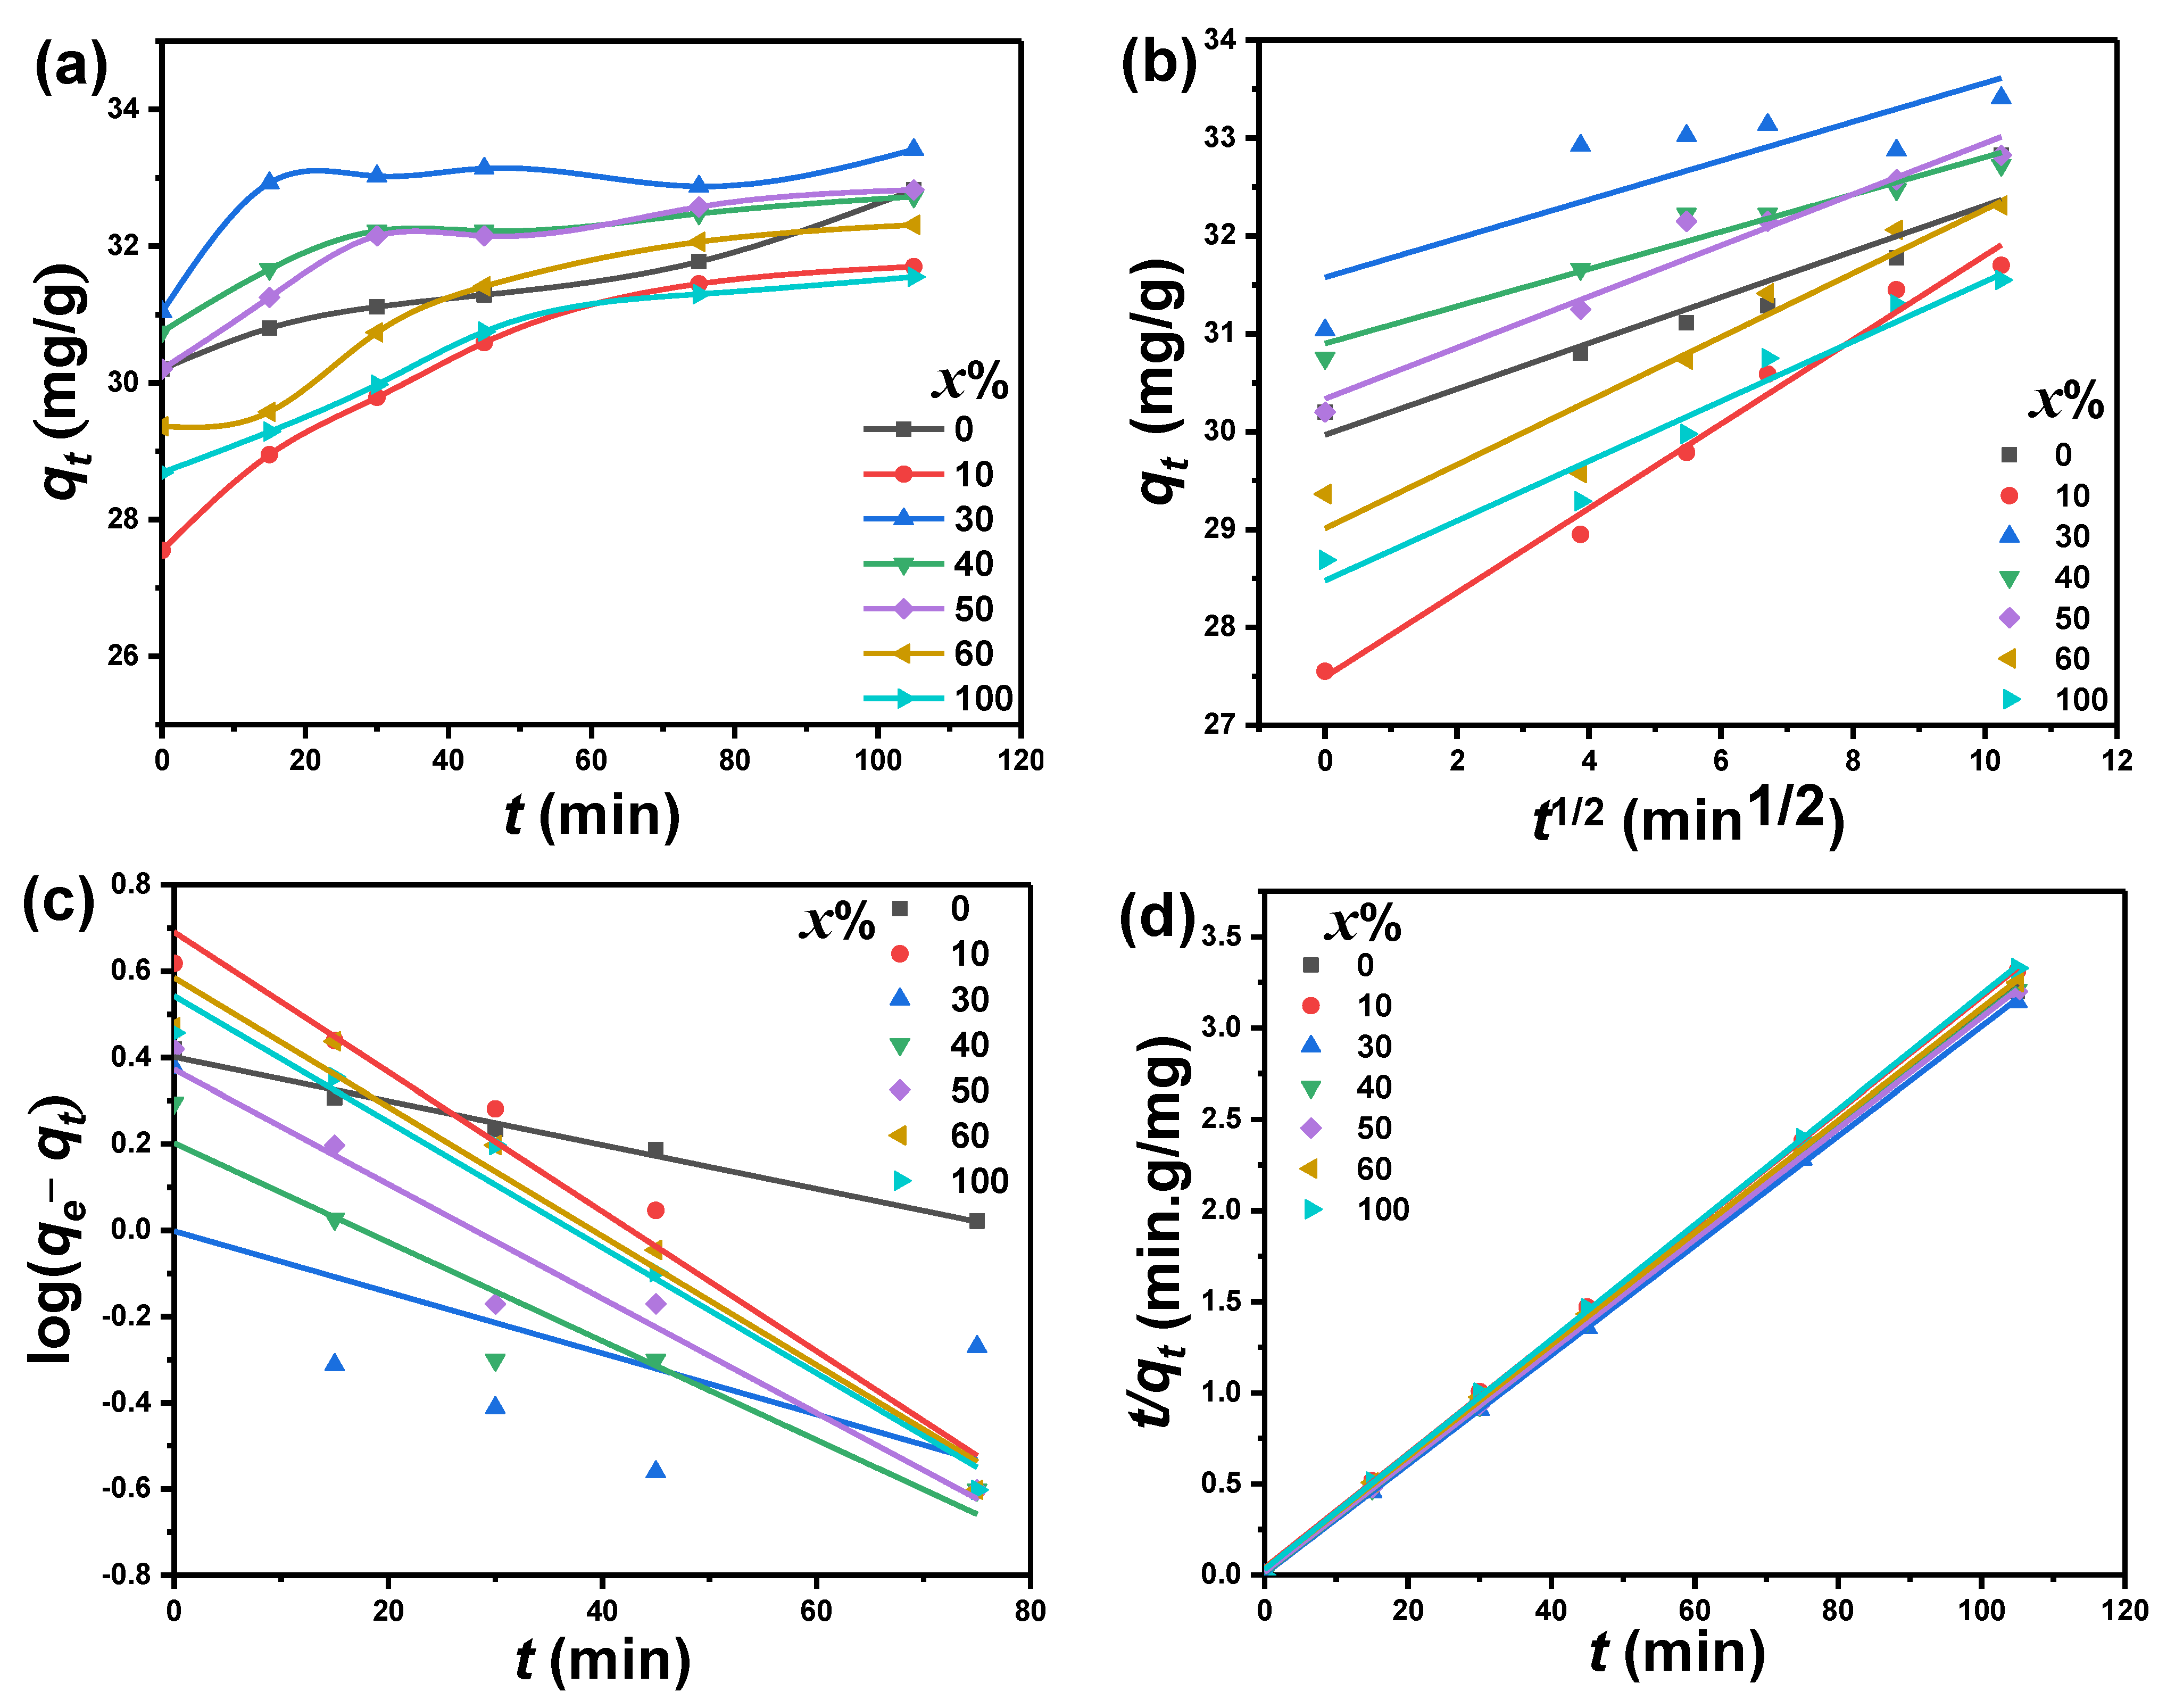
Figure 8a shows the dependence of
of MB using PbO-
x%Al
2O
3 composites as a catalytic at various irradiation times. The augmentation of
as a function of irradiation time was demonstrated, and then
reached saturated values. The plots that show the relation between
and
t are quite similar to the relation
η-
t. The PbO-30%Al
2O
3 composite shows the highest
over all of the irradiation time and amongst the studied composites. The behavior of both of these relations reveals the increase of the calculated catalytic efficiency, and these values are consistent with other studies [
26,
27].
Several models are used to analyze the catalytic degradation kinetics of the obtained data. These models include the intra-particle diffusion kinetics, the pseudo-first-order, and the pseudo-second-order models. These models are represented by the following equations, respectively:
,
, and
[
28], where
Kdiff is intraparticle diffusion kinetic model (mg/g·min
1/2),
K1,
K2 and
C are pseudo-first-order (g/mg·min), pseudo-second-order constants (g/mg·min), and kinetic parameter constants. This
C value gives the boundary-layer thickness evidence. The obtained results of MB adsorption kinetic onto PbO-
x%Al
2O
3 composites surface were studied using these mentioned models. The obtained data are plotted as shown in
Figure 8b–d, respectively. The kinetic parameters
Kdiff,
K1, and
K2 were determined and listed in
Table 2.
These values, as well as the experimental
and association coefficients (
R2), have been assessed. The dependence of
on
, for MB degradation process in the case of PbO-
x%Al
2O
3 composites is shown as a straight line as shown in
Figure 8b. The
Kdiff and
C values for PbO-
x%Al
2O
3 composites were estimated by fitting these lines. The plots have a correlation coefficient (R
2) value of various from 0.75 to 0.98. Therefore, we can conclude that the intra-particle diffusion kinetic model is more suitable to describe the degradation mechanism for the adsorption of MB onto PbO-
x%Al
2O
3 composites. The maximum estimated value of
Kdiff is 0.42 mg/g.min
1/2 corresponding to a lower value of
C and equals 27 mg/g and was observed for PbO-10%Al
2O
3 composites. Meanwhile, the minimum value of
Kdiff, 0.19 mg/g·min
1/2, was observed for PbO-40%Al
2O
3 composites. In general, the value of
Kdiff is changed between 0.19 and 0.42 mg/g·min
1/2, while
C was changed between 27 and 31 mg/g. This designates that the adsorption of MB on PbO-
x%Al
2O
3 composites has been conducted by a single step. From these results, agreement of these results with other results reported in the literature has been obtained [
29].
The use of the pseudo-first-order kinetic model for MB adsorption on the presence of PbO-
x% Al
2O
3 composites as a catalyst is shown in
Figure 8c.
Figure 8c illustrates a linear relationship between
and
t and the slope of the fitted lines were used to calculate the values of
K1. The maximum estimated values of
K1 were found to equal 2.16 h
−1 for PbO-10%Al
2O
3 composites, while the minimum value (0.67 h
−1) was observed for pure PbO nanoparticles. The plotted relation between
and
t correlates values
R2 between 0.32 and 0.98. The pseudo-second-order kinetic model for MB adsorption on PbO-
x%Al
2O
3 composites is shown in
Figure 8d. It illustrates the plots of the relation of
against
t with a good linear fitting with
R2 equals 1 for all investigated composites. The values of
K2 are calculated from the intercepts of the fitted lines and are given in
Table 2. The highest
K2 value was illustrated for PbO-30%Al
2O
3 composites and equals 13.5 × 10
−2 g/mg.min, meanwhile, the minimum value was observed for PbO-10%Al
2O
3 composites and equals 2.5 g/mg.min. The average value of
equals 32.9 mg/g. The estimated value of
is in good agreement with the experimental value of
. In the case of the pseudo-second-order kinetic model, the correlation coefficient (
R2) is approximately one. This value is higher than the intra-particle diffusion kinetic model and the pseudo-first-order kinetic model. As a result of the correlation factor’s magnitude, the pseudo-second-order kinetic model is a better fit for describing the current deterioration mechanism. The Elovic equation is another equation devised for investigating the catalytic degradation of the researched sample. In the kinetics of gas chemisorption on solids, the Elovic equation is commonly used. This Elovic equation is presented in the following equation [
44]:
, where α is the initial sorption rate (mg/g·min), and
β is a parameter in (g·min/mg). This parameter reflects the coverage of the surface as well the activation energy for chemisorption.
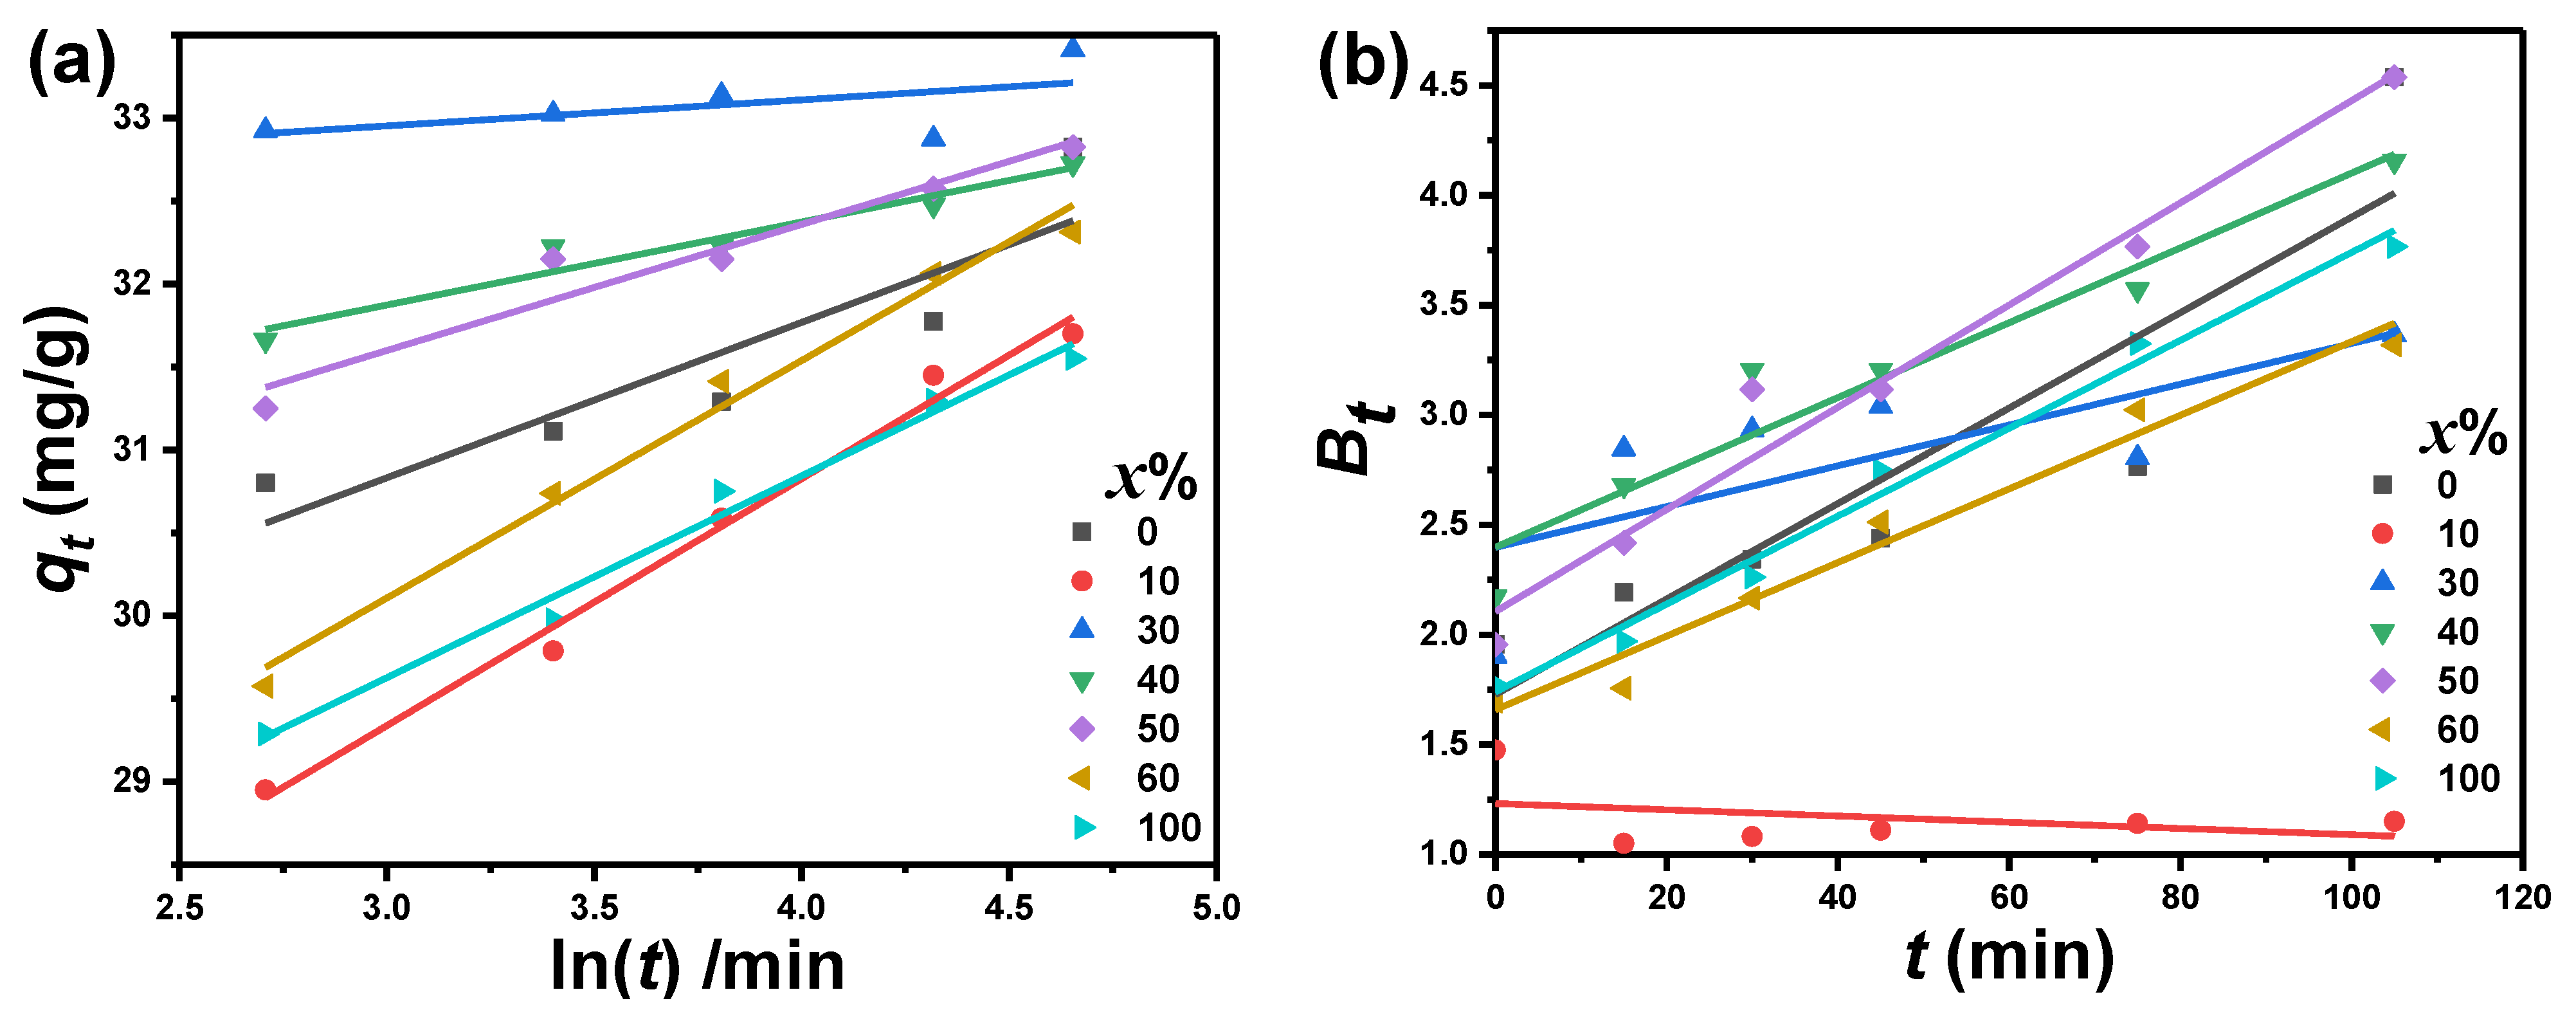
Figure 9a illustrates the dependence of
on ln(
t). It shows a linear behavior which hence well agrees with Elovic’s kinetic model. The maximum and minimum values of
β for the catalytic degradation of MB were observed in the presence of PbO-30%Al
2O
3 and PbO-60%Al
2O
3 composites and equal 6.36 g·min/mg, and 0.7 g·min/mg, respectively.
It is well known that the adsorption process can be divided into several steps. The following are the measures to take: (i) sorption and desorption within the particle and solid’s surface, (ii) diffusion on the solid’s surface (film diffusion), (iii) adsorbate transport (particle diffusion), and (iv) sorption and desorption on the solid’s surface [
31]. Film and particle diffusions are the rate-limiting processes. Boyd et al. [
45], made the suggestion a model which could be applied for investigating the diffusion mechanism during the catalytic degradation process, which mathematically written as follows [
32]:
. If the relationship between
versus
t is linear through the origin point using this Boyd’s model, the particle diffusion process is process control. If, on the other hand, this relationship predicts origin through another location, the diffusion is thought to be a rate-limiting phase.
Figure 9b shows the dependence of
on
t which shows straight lines. These lines do not intersect at the origin. As a result, the diffusion process can be thought of as a rate-limiting stage.
As is well known, oxidants increase the number of trapped electrons, preventing recombination and generating oxidizing radicals, which may enhance dye photocatalytic degradation [
46]. The increase in the rate of photocatalytic degradation of MB could be attributed to an increase in MB concentration or pH [
46]. As a result, changes in the dye molecule’s behavior may be responsible for the change in the percentage degradation of dye at higher MB concentrations. When the substrate concentration was decreased, the degradation rate could be decreased. This could be one of the reasons why the degradation rate decreases over time. The photocatalytic activity of different photocatalysts varies due to differences in lattice mismatch, surface area, and impurities on the catalyst’s surface, which affect pollutant adsorption and the lifetime and recombination rate of electron-hole pairs. A large surface area can be a deciding factor in certain photodegradation reactions, as a large amount of adsorbed organic molecules accelerates the reaction rate [
47]. However, depending on particle size, the dominant mode of electron-hole recombination may differ [
48]. As a result, since the PbO-40% Al
2O
3 composite has the smallest crystallite size, higher photocatalytic activity was observed.
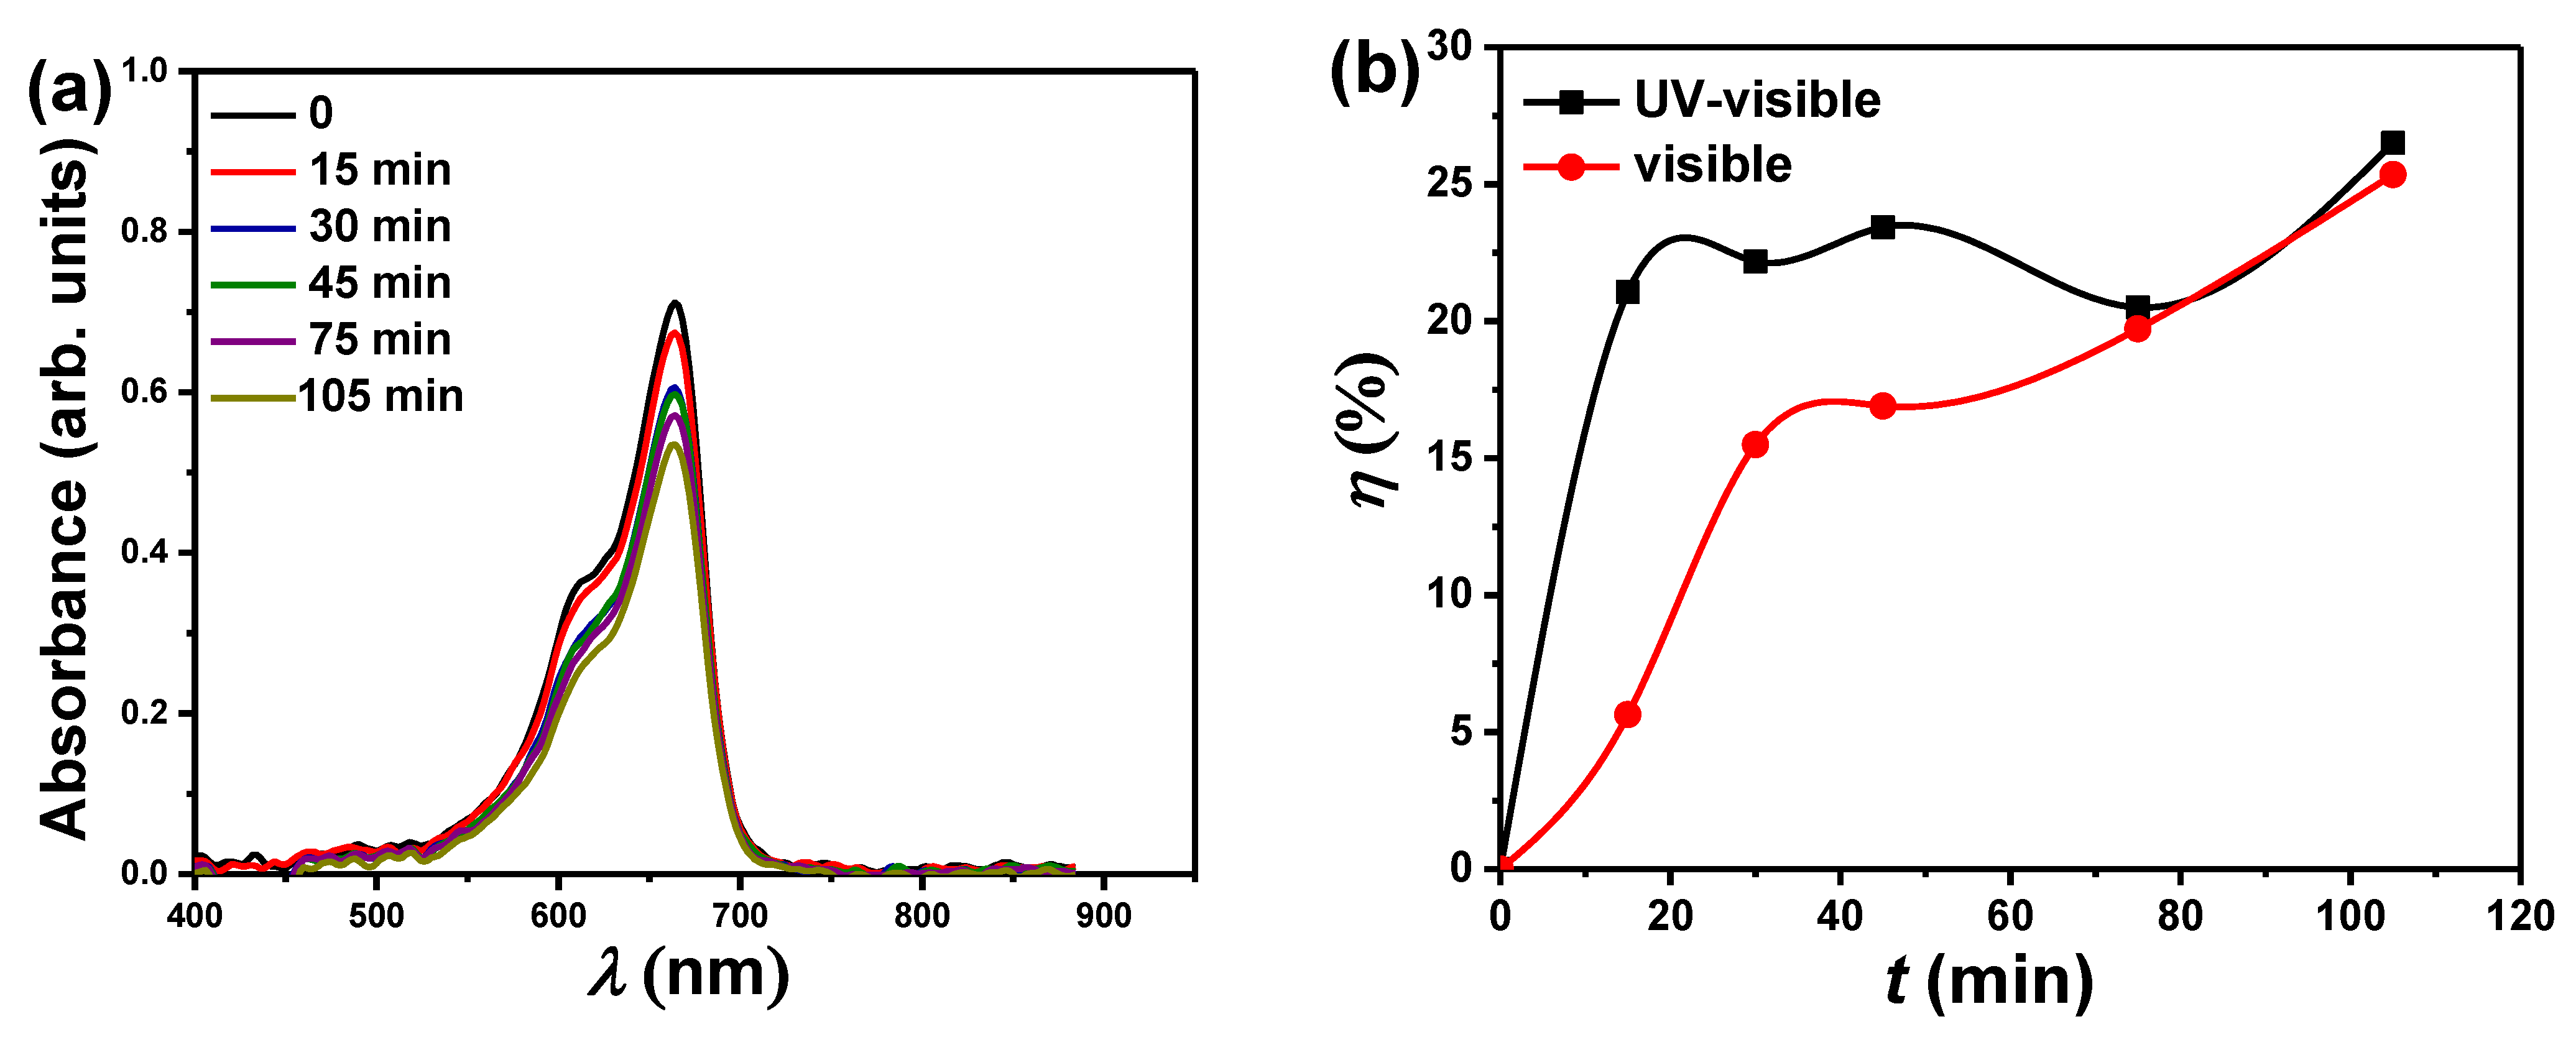
Figure 10a depicts the absorbance spectra for the degradation of MB using PbO-40% Al
2O
3 nanocomposites as a catalyst during various periods of visible light exposure only.
Figure 10b compares the photodegradation efficiency of a PbO-40% Al
2O
3 catalyst under UV-visible and visible light irradiation. In general, the absorbance decreases as the exposure time for visible light increases. When compared to UV-visible light, the photodegradation efficiency of MB using PbO-40% Al
2O
3 catalyst under visible light is acceptable. The degradation efficiency under UV-visible light is higher, particularly at low irradiation times (less than 75 min). In other words, photodegradation under UV-visible light is much faster at low irradiation times, and with the increase in the irradiation time becomes smaller and closer to photodegradation under visible light alone. For example, at the same irradiation time of 20 min, the degradation efficiency is 21% and 6%, respectively, when using PbO-40% Al
2O
3 catalyst under UV-visible light and visible light only. On the other hand, for longer irradiation times, such as 105 min, the degradation efficiency is 26.5% and 25.5%, respectively, when using PbO-40% Al
2O
3 catalyst under UV-visible light and visible light only. Such findings could demonstrate how the addition of PbO can effectively reduce the optical bandgap of the catalyst, increasing the ability to use PbO-
x% Al
2O
3 nanocomposites as a catalyst only under visible irradiation rather than UV and visible light, particularly for longer irradiation times.


 ,
, 


