
Catalytic Hydrotreatment of Humins Waste over Bifunctional Pd-Based Zeolite Catalysts

 ,
,  ,
,  , ,
, , 
 ,
, 

Abstract
1. Introduction
2. Results and Discussion
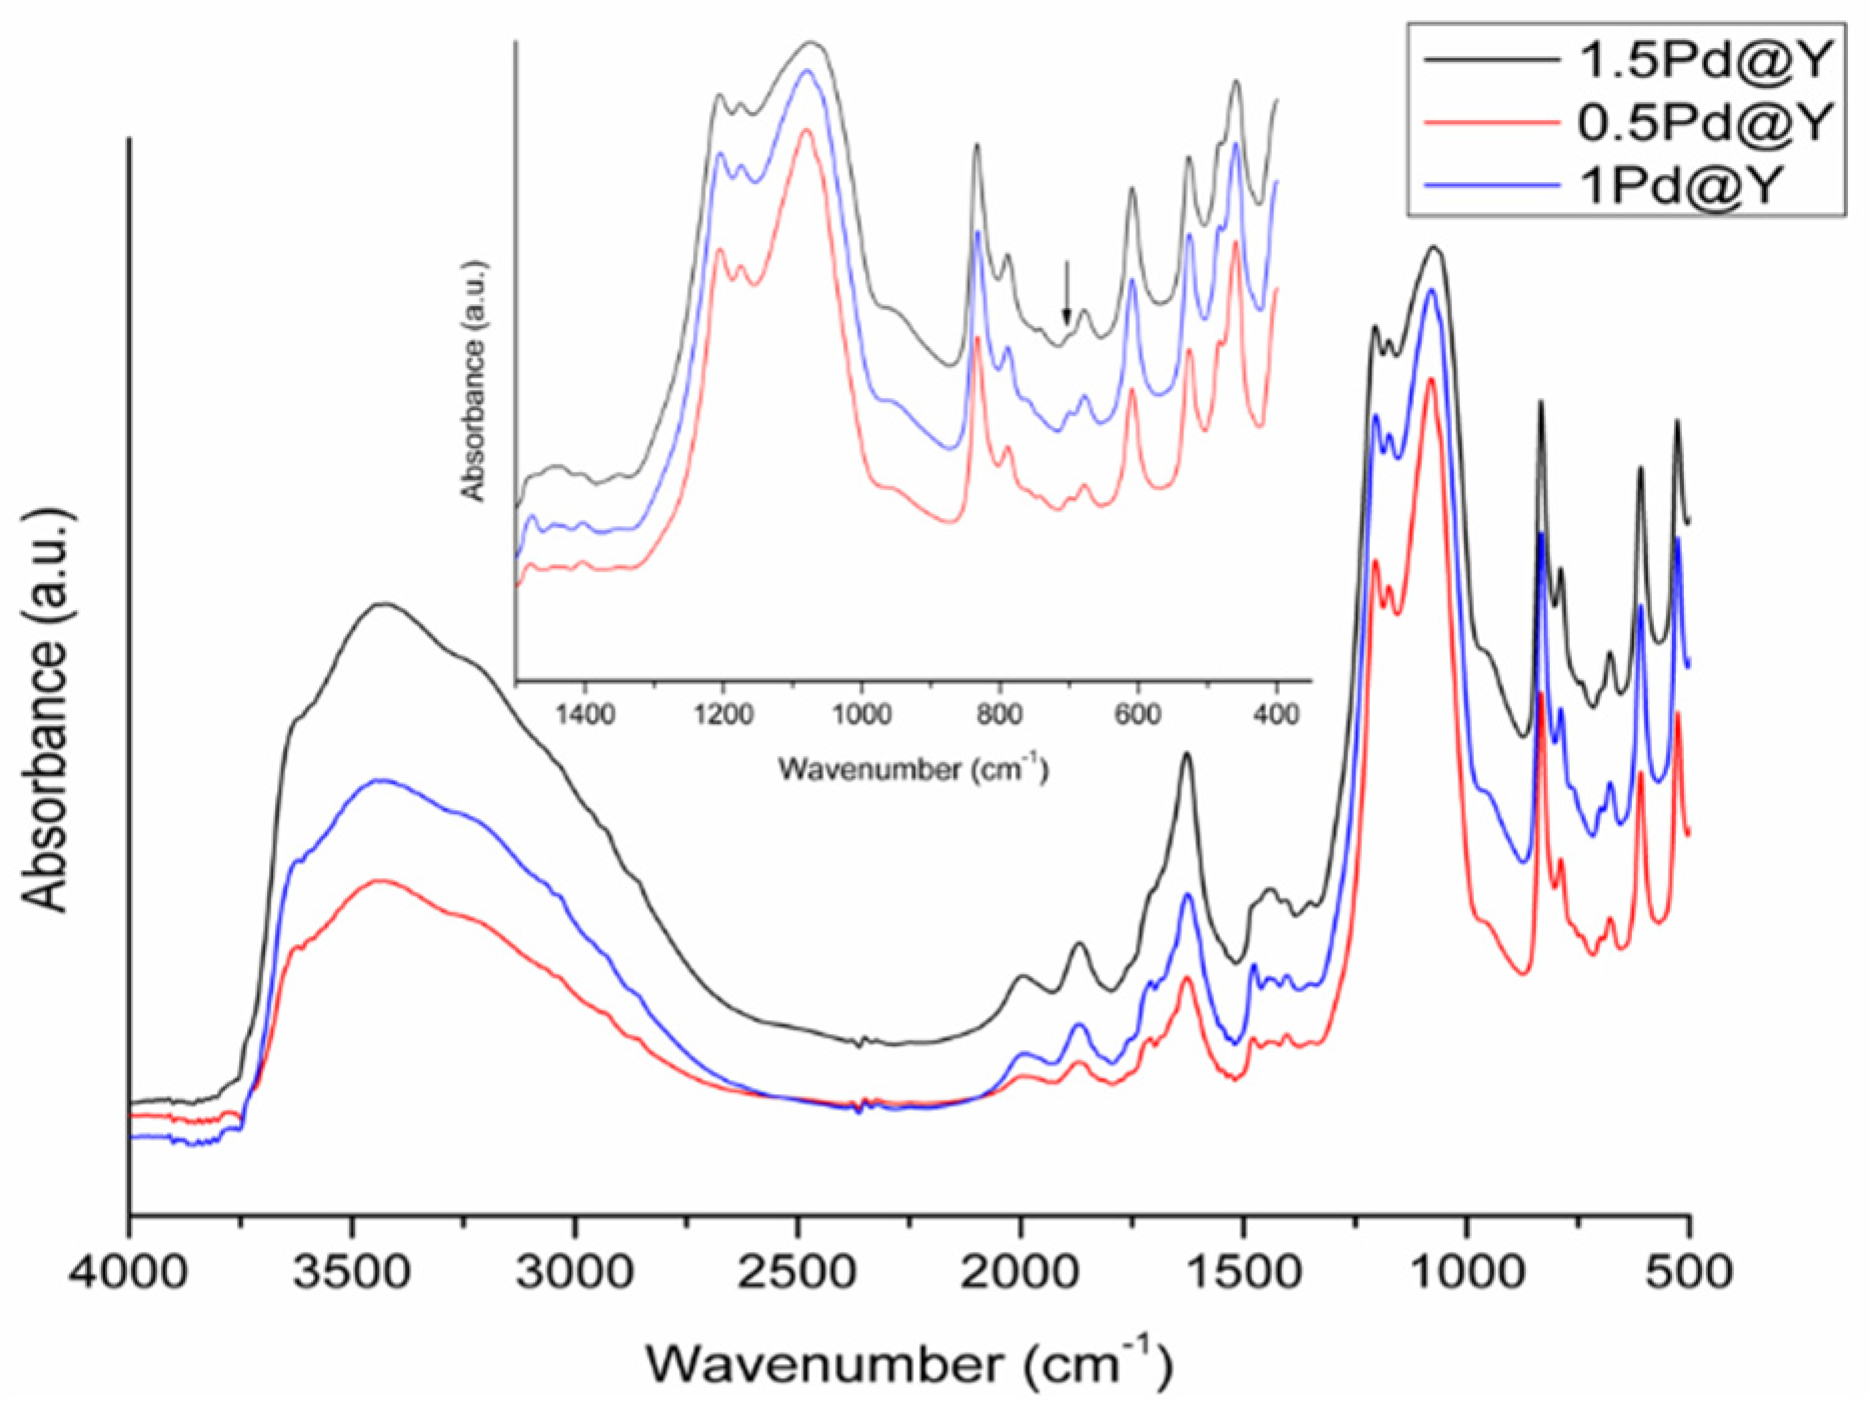
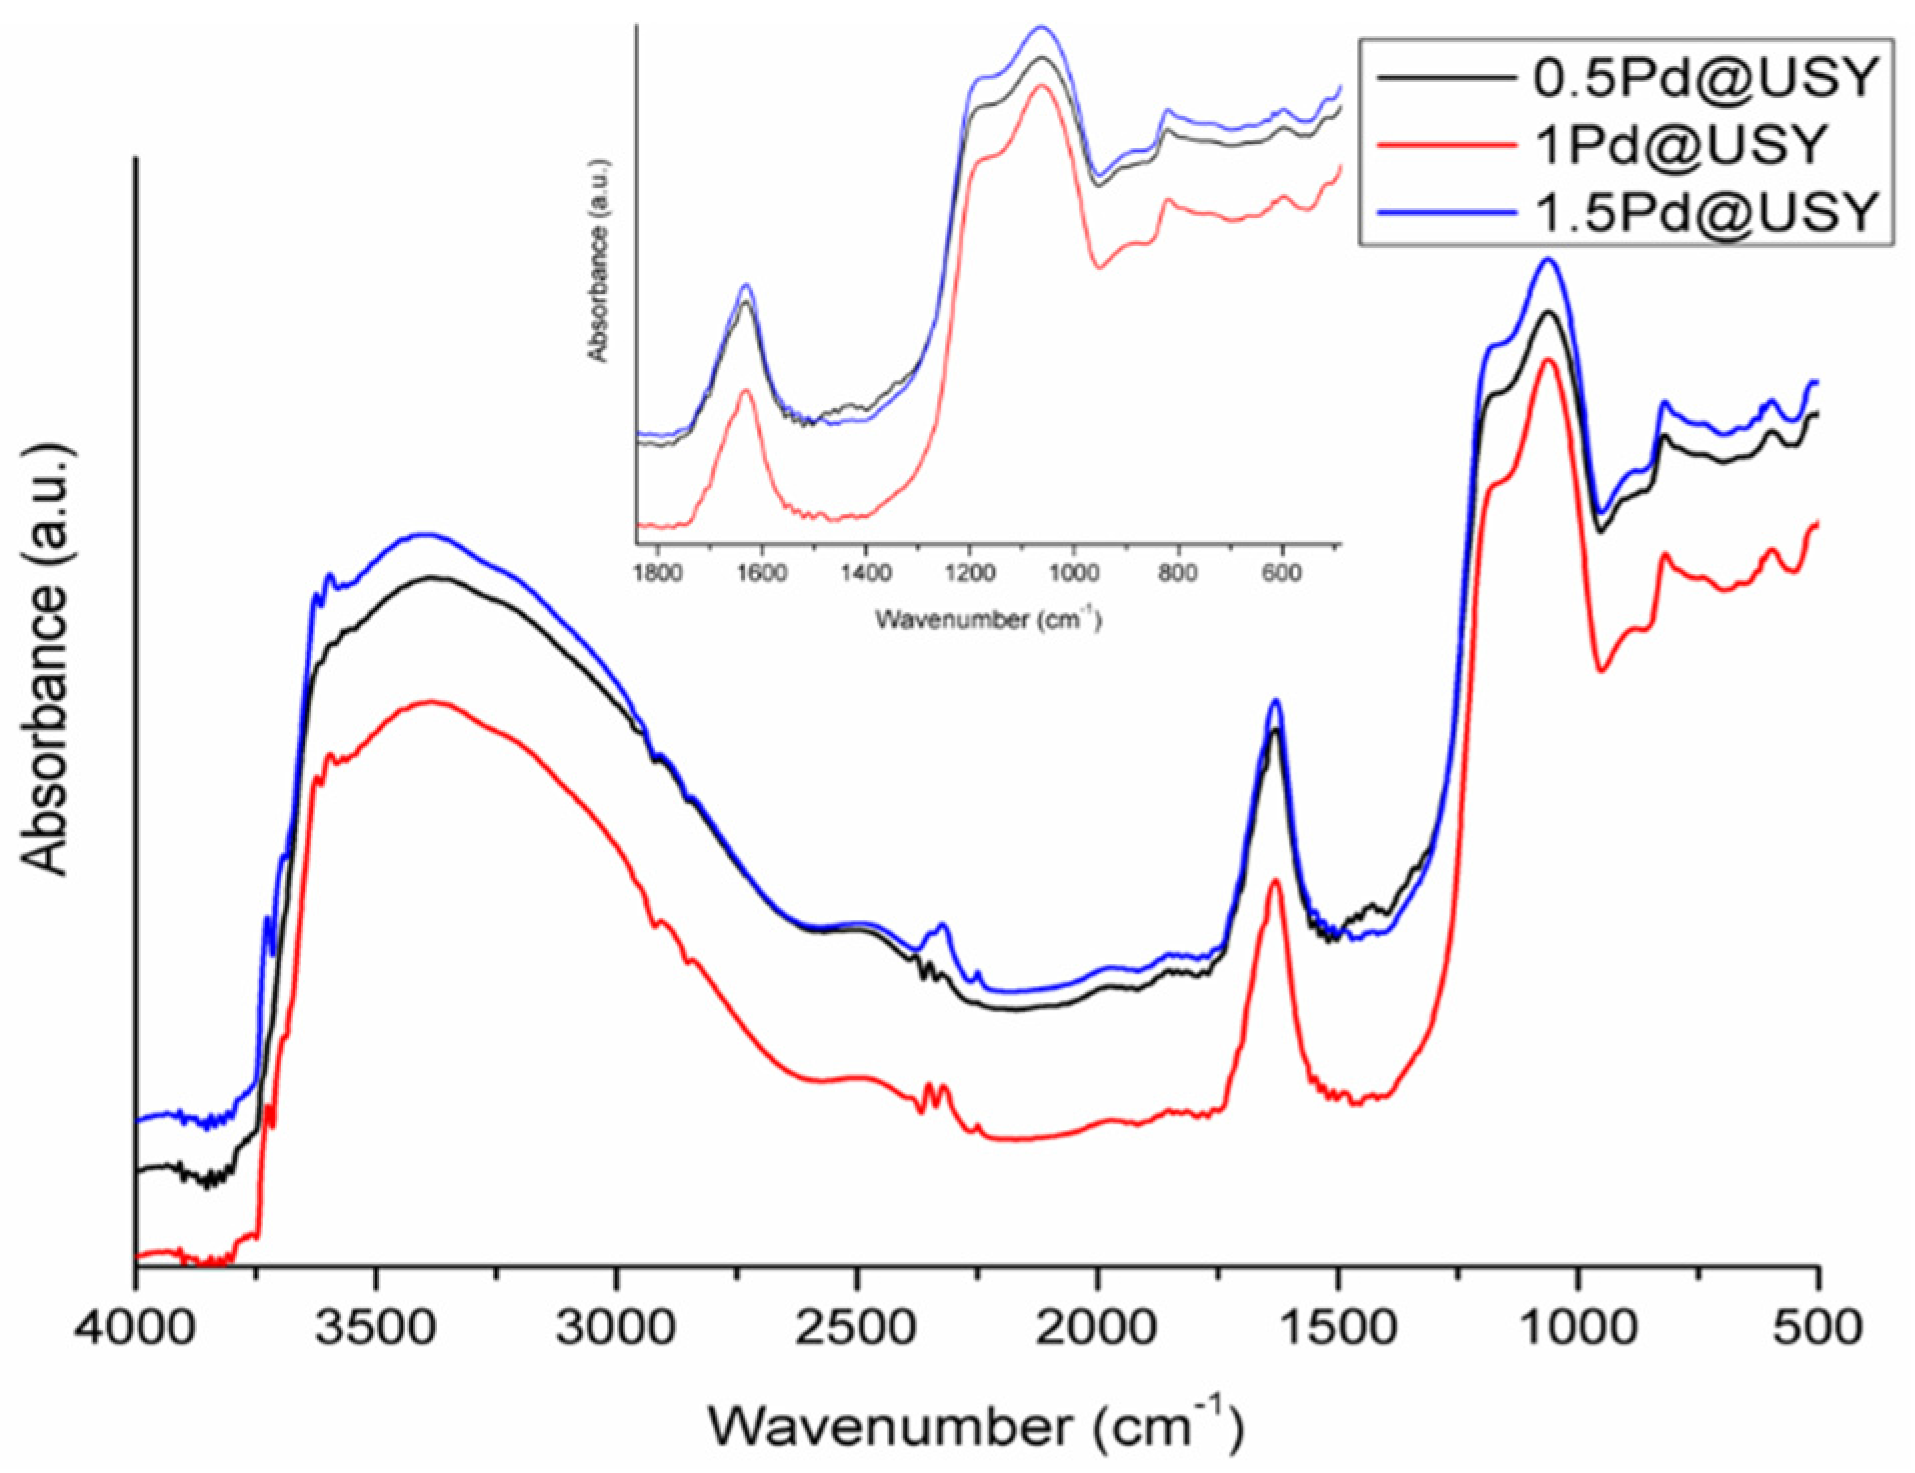
2.1. Physico-Chemical Characterization of Pd@zeolite Catalysts
2.2. Catalytic Tests
3. Materials and Methods
3.1. Humins Synthesis and Characterization
3.2. Synthesis of Bi-Functional Pd@zeolite Catalysts
3.3. Pd@zeolite Catalysts Characterization
3.4. Catalytic Tests
3.5. Products Analysis
4. Conclusions
Supplementary Materials
Author Contributions
Funding
Conflicts of Interest
References
- Jing, Y.; Guo, Y.; Xia, Q.; Liu, X.; Wang, Y. Catalytic production of value-Added chemicals and liquid fuels from lignocellulosic biomass. Chem 2019, 5, 2520–2546. [Google Scholar] [CrossRef]
- Covinich, L.G.; Clauser, N.M.; Felissia, F.E.; Vallejos, M.E.; Area, M.C. The challenge of converting biomass polysaccharides into levulinic acid through heterogeneous catalytic processes. Biofuels Bioprod. Biorefin. 2020, 14, 417–444. [Google Scholar] [CrossRef]
- Ding, D.; Wang, J.; Xi, J.; Liu, X.; Lu, G.; Wang, Y. High-yield production of levulinic acid from cellulose and its upgrading to γ-valerolactone. Green Chem. 2014, 16, 3846–3853. [Google Scholar] [CrossRef]
- Ding, D.; Xi, J.; Wang, J.; Liu, X.; Lu, G.; Wang, Y. Production of methyl levulinate from cellulose: Selectivity and mechanism study. Green Chem. 2015, 17, 4037–4044. [Google Scholar] [CrossRef]
- Mija, A.; van der Waal, J.C.; Pin, J.M.; Guigo, N.; de Jong, E. Humins as promising material for producing sustainable carbohydrate-derived building materials. Constr. Build. Mater. 2017, 139, 594–601. [Google Scholar] [CrossRef]
- Suganuma, S.; Nakajima, K.; Kitano, M.; Yamaguchi, D.; Kato, H.; Hayashi, S.; Hara, M. Hydrolysis of cellulose by amorphous carbon bearing SO3H, COOH, and OH Groups. J. Am. Chem. Soc. 2008, 130, 12787–12793. [Google Scholar] [CrossRef]
- Pye, E.K. Lignin Line and Lignin-Based Product Family Trees. In Biorefineries-Industrial Processes and Products; Kamm, B., Gruber, P.R., Kamm, M., Eds.; Wiley-VCH Verlag GmbH.: Weinheim, Germany, 2008; Volume 2, pp. 165–199. [Google Scholar]
- Hoang, T.M.C.; Eck, E.R.H.V.; Bula, W.P.; Gardeniers, J.G.E.; Lefferts, L.; Seshan, K. Humin based by-products from biomass processing as a potential carbonaceous source for synthesis gas production. Green Chem. 2015, 17, 959–972. [Google Scholar] [CrossRef]
- Wang, Y.; Agarwal, S.; Kloekhorst, A.; Heeres, H.J. Catalytic hydrotreatment of humins in mixtures of formic acid/2-Propanol with supported ruthenium catalysts. ChemSusChem 2016, 9, 951–961. [Google Scholar] [CrossRef]
- Agarwal, S.; Es, D.V.; Heeres, H.J. Catalytic pyrolysis of recalcitrant, insoluble humin byproducts from C6 sugar biorefineries. J. Anal. Appl. Pyrol. 2017, 123, 134–143. [Google Scholar] [CrossRef]
- Sangregorio, A.; Guigo, N.; Waal, J.C.V.N.; Sbirrazzuoli, N. Humins from biorefineries as thermoreactive macromolecular systems. ChemSusChem 2018, 11, 4246–4255. [Google Scholar] [CrossRef]
- Hoang, T.M.C.; Lefferts, L.; Seshan, K. Valorization of humin-based byproducts from biomass processing—A route to sustainable hydrogen. ChemSusChem 2013, 6, 1651–1658. [Google Scholar] [CrossRef]
- Maerten, S.G.; Voß, D.; Liauw, M.A.; Albert, J. Selective catalytic oxidation of humins to low-chain carboxylic acids with tailor-made polyoxometalate catalysts. ChemistrySelect 2017, 2, 7296–7302. [Google Scholar] [CrossRef]
- Wang, Y.; Agarwal, S.; Heeres, H.J. Catalytic liquefaction of humin substances from sugar biorefineries with Pt/C in 2-Propanol. ACS Sustain. Chem. Eng. 2017, 5, 469–480. [Google Scholar] [CrossRef]
- Cheng, Z.; Saha, B.; Vlachos, D.G. Catalytic hydrotreatment of humins to bio-oil in methanol over supported metal catalysts. ChemSusChem 2018, 11, 3609–3617. [Google Scholar] [CrossRef] [PubMed]
- Wang, Y.; Agarwal, S.; Tang, Z.; Heeres, H.J. Exploratory catalyst screening studies on the liquefaction of model humins from C6 sugars. RSC Adv. 2017, 7, 5136–5147. [Google Scholar] [CrossRef]
- Sun, J.; Cheng, H.; Zhang, Y.; Zhang, Y.; Lan, X.; Zhang, Y.; Xia, Q.; Ding, D. Catalytic hydrotreatment of humins into cyclic hydrocarbons over solid acid supported metal catalysts in cyclohexane. J. Energy Chem. 2021, 53, 329–339. [Google Scholar] [CrossRef]
- Sumerskii, I.V.; Krutov, S.M.; Zarubin, M.Y. Humin-like substances formed under the conditions of industrial hydrolysis of wood. Russ. J. Appl. Chem. 2010, 83, 320–327. [Google Scholar] [CrossRef]
- Fergani, M.E.; Candu, N.; Tudorache, M.; Bucur, C.; Djelal, N.; Granger, P.; Coman, S.M. From useless humins by-product to Nb@graphite-like carbon catalysts highly efficient in HMF synthesis. Appl. Catal. A Gen. 2021, 618, 118130. [Google Scholar] [CrossRef]
- Zandvoort, I.V.; Koers, E.J.; Weingarth, M.; Bruijnincx, P.C.A.; Baldus, M.; Weckhuysen, B.M. Structural characterization of 13C-enriched humins and alkali-treated 13C humins by 2D solid-state NMR. Green Chem. 2015, 17, 4383–4392. [Google Scholar] [CrossRef]
- Filiciotto, L.; Balu, A.M.; Romero, A.A.; Angelici, C.; Waal, J.C.V.D.; Luque, R. Reconstruction of humins formation mechanism from decomposition products: A GC-MS study based on catalytic continuous flow depolymerizations. Mol. Catal. 2019, 479, 110564. [Google Scholar] [CrossRef]
- Fodor, D.; Ishikawa, T.; Krumeich, F.; Bokhoven, J.A.V. Synthesis of single crystal nanoreactor materials with multiple catalytic functions by incipient wetness impregnation and ion exchange. Adv. Mater. 2015, 27, 1919–1923. [Google Scholar] [CrossRef]
- Chai, Y.; Shang, W.; Li, W.; Wu, G.; Dai, W.; Guan, N.; Li, L. Noble metal particles confined in zeolites: Synthesis, characterization, and applications. Adv. Sci. 2019, 6, 1900299. [Google Scholar] [CrossRef]
- Okumura, K.; Niwa, M. Regulation of the Dispersion of PdO through the interaction with acid sites of zeolite studied by extended X-ray absorption fine structure. J. Phys. Chem. B 2000, 104, 9670–9675. [Google Scholar] [CrossRef]
- Fergani, M.E.; Candu, N.; Coman, S.M.; Parvulescu, V.I. Nb-Based zeolites: Efficient bi-functional catalysts for the one-pot synthesis of succinic acid from glucose. Molecules 2017, 22, 2218. [Google Scholar] [CrossRef]
- Beyerlein, R.A.; Choi Feng, C.; Hall, J.B.; Huggins, B.J.; Ray, G.J. Effect of steaming on the defect structure and acid catalysis of protonated zeolites. Top. Catal. 1997, 4, 27–42. [Google Scholar] [CrossRef]
- Remy, M.J.; Stanica, D.; Poncelet, G.; Feijen, E.J.P.; Grobet, P.J.; Martens, J.A.; Jacobs, P.A. Dealuminated H-Y zeolites: Relation between physicochemical properties and catalytic activity in heptanes and decane isomerization. J. Phys. Chem. 1996, 100, 12440–12447. [Google Scholar] [CrossRef]
- Jamalzadeh, Z.; Haghighi, M.; Asgari, N. Synthesis, physicochemical characterizations and catalytic performance of Pd/carbon-zeolite and Pd/carbon-CeO2 nanocatalysts used for total oxidation of xylene at low temperatures. Front. Environ. Sci. Eng. 2013, 7, 365–381. [Google Scholar] [CrossRef]
- Jabłon′ska, M.; Król, A.; Kukulska-Zajac, E.; Tarach, K.; Chmielarz, L.; Góra-Marek, K. Zeolite Y modified with palladium as effective catalyst for selective catalytic oxidation of ammonia to nitrogen. J. Catal. 2014, 316, 36–46. [Google Scholar] [CrossRef]
- Tian, F.; Wu, Y.; Shen, Q.; Li, X.; Chen, Y.; Meng, C. Effect of Si/Al ratio on mesopore formation for zeolite beta via NaOH treatment and the catalytic performance in α-pinene isomerization and benzoylation of naphthalene. Micropor. Mesopor. Mat. 2013, 173, 129–138. [Google Scholar] [CrossRef]
- Penner, S.; Wang, D.; Jenewein, B.; Gabasch, H.; Klotzer, B.; Knop-Gericke, A.; Schlogl, B.; Hayek, K. Growth and decomposition of aligned and ordered PdO nanoparticles. J. Chem. Phys. 2006, 125, 94703. [Google Scholar] [CrossRef]
- Fleisch, T.H.; Hicks, R.F.; Bell, A.T. An XPS study of metal-support interactions on PdSiO2 and PdLa2O3. J. Catal. 1984, 87, 398–413. [Google Scholar] [CrossRef]
- Chichova, D.; Mäki-Arvela, P.; Heikkilä, T.; Kumar, N.; Väyrynen, J.; Salmi, T.; Murzin, D.Y. X-ray Photoelectron Spectroscopy Investigation of Pd-Beta Zeolite Catalysts with Different Acidities. Top. Catal. 2009, 52, 359–379. [Google Scholar] [CrossRef]
- Stakheev, A.Y.; Kustov, L.M. Effects of the support on the morphology and electronic properties of supported metal clusters: Modern concepts and progress in 1990s. Appl. Catal. A Gen. 1999, 188, 3–35. [Google Scholar] [CrossRef]
- Klie, R.F.; Browning, N.D.; Chowdhuri, A.R.; Takoudis, C.G. Analysis of ultrathin SiO2 interface layers in chemical vapor deposition of Al2O3 on Si by in situ scanning transmission electron microscopy. Appl. Phys. Lett. 2003, 83, 1187. [Google Scholar] [CrossRef]
- Guillemot, D.; Polisset-Thfoin, M.; Fraissard, J.; Bonnin, D. New Method for Obtaining Palladium Particles on Y Zeolites. Characterization by TEM, 129Xe NMR, H2 Chemisorption, and EXAFS. J. Phys. Chem. B 1997, 101, 8243–8249. [Google Scholar] [CrossRef]
- Wagner, C.D.; Davis, L.E.; Zeller, M.V.; Taylor, J.A.; Raymond, R.H.; Gale, L.H. Empirical atomic sensitivity factors for quantitative analysis by electron spectroscopy for chemical analysis. Surf. Interface Anal. 1981, 3, 211–225. [Google Scholar] [CrossRef]
- Gallagher, P.K.; Gross, M.E. The thermal decomposition of palladium acetate. J. Therm. Anal. 1986, 31, 1231–1241. [Google Scholar] [CrossRef]
- Shen, W.J.; Okumura, M.; Matsumura, Y.; Haruta, M. The influence of the support on the activity and selectivity of Pd in CO hydrogenation. Appl. Catal. A Gen. 2001, 213, 225–232. [Google Scholar] [CrossRef]
- Pieterse, J.A.Z.; Van den Brink, R.W.; Booneveld, S.; de Bruijn, F.A. Influence of zeolite structure on the activity and durability of Co-Pd-zeolite catalysts in the reduction of NOx with methane. Appl. Catal. B-Environ. 2003, 46, 239–250. [Google Scholar] [CrossRef]
- Chang, T.-C.; Chen, J.-J.; Yeh, C.-T. Temperature-Programmed Reduction and Temperature-Resolved Sorption Studies of Strong Metal-Support Interaction in supported palladium catalysts. J. Catal. 1985, 96, 51–57. [Google Scholar] [CrossRef]
- Byun, M.Y.; Park, D.W.; Lee, M.S. Effect of Oxide Supports on the Activity of Pd Based Catalysts for Furfural Hydrogenation. Catalysts 2020, 10, 837. [Google Scholar] [CrossRef]
- Zheng, Q.; Farrauto, R.; Deeba, M. Part II: Oxidative Thermal Aging of Pd/Al2O3 and Pd/CexOy-ZrO2 in Automotive Three Way Catalysts: The Effects of Fuel Shutoff and Attempted Fuel Rich Regeneration. Catalysts 2015, 5, 1797–1814. [Google Scholar] [CrossRef]
- Flanigen, E.M.; Khatami, H.; Szymanski, H.A. Infrared Structural Studies of Zeolite Frameworks. In Molecular Sieve Zeolites, Advances in Chemistry 101; Flanigen, E.M., Sand, L.B., Eds.; American Chemical Society: Washington, DC, USA, 1971; pp. 201–229. [Google Scholar] [CrossRef]
- Banse, B.A.; Koel, B.E. Interaction of oxygen with Pd(111): High effective O2 pressure conditions by using nitrogen dioxide. Surf. Sci. 1990, 232, 275–285. [Google Scholar] [CrossRef]
- Sacchetto, V.; Gatti, G.; Paul, G.; Braschi, I.; Berlier, G.; Cossi, M.; Marchese, L.; Bagatin, R.; Bisio, C. The interactions of methyl tert-butyl ether on high silicazeolites: A combined experimental and computational study. Phys. Chem. Chem. Phys. 2013, 15, 13275–13287. [Google Scholar] [CrossRef]
- Othman, I.; Mohamed, R.M.; Ibrahim, I.A.; Mohamed, M.M. Synthesis and modification of ZSM-5 with manganese and lanthanum and their effects on decolorization of indigo carmine dye. Appl. Catal. A-Gen. 2006, 299, 95–102. [Google Scholar] [CrossRef]
- Topsøe, N.Y.; Pedersen, K.; Derouane, E.G. Infrared and temperature-programmed desorption study of the acidic properties of ZSM-5-type zeolites. J. Catal. 1981, 70, 41–52. [Google Scholar] [CrossRef]
- Bläkera, C.; Pasel, C.; Luckas, M.; Dreisbach, F.; Bathen, D. Investigation of load-dependent heat of adsorption of alkanes and alkenes on zeolites and activated carbon. Micropor. Mesopor. Mat. 2017, 241, 1–10. [Google Scholar] [CrossRef]
- Zhang, J.; Wang, L.; Zhu, L.; Wu, Q.; Chen, C.; Wang, X.; Ji, Y.; Meng, X.; Xiao, F.S. Solvent-Free Synthesis of Zeolite Crystals Encapsulating Gold–Palladium Nanoparticles for the Selective Oxidation of Bioethanol. ChemSusChem 2015, 8, 2867–2871. [Google Scholar] [CrossRef]
- Panagiotopoulou, P.; Vlachos, D.G. Liquid phase catalytic transfer hydrogenation of furfural over a Ru/C catalyst. Appl. Catal. A Gen. 2014, 480, 17–24. [Google Scholar] [CrossRef]
- Jae, J.; Zheng, W.; Lobo, R.F.; Vlachos, D.G. Production of Dimethylfuran from Hydroxymethylfurfural through Catalytic Transfer Hydrogenation with Ruthenium Supported on Carbon. ChemSusChem 2013, 6, 1158–1162. [Google Scholar] [CrossRef]
- Jongerius, A.L.; Copeland, J.R.; Foo, G.S.; Hofmann, J.P.; Bruijnincx, P.C.A.; Sievers, C.; Weckhuysen, B.M. Stability of Pt/γ-Al2O3 catalysts in lignin and lignin model compound solutions under liquid phase reforming reaction conditions. ACS Catal. 2013, 3, 464–473. [Google Scholar] [CrossRef]
- Zeolyst International. Available online: https://www.zeolyst.com/our-products/standard-zeolite-powders.html (accessed on 1 June 2021).
- Teodorescu, C.M.; Esteva, J.M.; Karnatak, R.C.; Afif, A.E. An approximation of the Voigt I profile for the fitting of experimental x-ray absorption data. Nucl. Instrum. Methods Phys. Res. Sect. A Accel. Spectrom. Dect. Assoc. Equip. 1994, 345, 141–147. [Google Scholar] [CrossRef]
- Mardare, D.; Luca, D.; Teodorescu, C.M.; Macovei, D. On the hydrophilicity of nitrogen-doped TiO2 thin films. Surf. Sci. 2007, 601, 4515–4520. [Google Scholar] [CrossRef]


| Entry | Catalyst | SBET (m2/g) a | Sext (m2/g) b | Smicro (m2/g) | V total (cm3/g) c | Vmeso (cm3/g) d | Vmicro (cm3/g) e |
|---|---|---|---|---|---|---|---|
| 1 | 0.5Pd@Beta | 500 | 177 | 323 | 0.65 | 0.50 | 0.15 |
| 2 | 1Pd@Beta | 504 | 183 | 321 | 0.70 | 0.55 | 0.15 |
| 3 | 1.5Pd@Beta | 433 | 153 | 280 | 0.56 | 0.43 | 0.13 |
| 4 | 1Pd@USY | 668 | 174 | 494 | 0.45 | 0.22 | 0.23 |
| 5 | 1Pd@Y | 352 | 79 | 273 | 0.31 | 0.18 | 0.13 |
| Sample | Si/Al Bulk | O 1s (%) | Si 2p (%) | Al 2p (%) | Si/Al XPS | Pd 3d5/2 (at%) | Pd0/Pdn+ |
|---|---|---|---|---|---|---|---|
| 1Pd@Beta | 12.5 | 62.07 | 34.9 | 2.95 | 11.8 | 0.08 | 4.8 |
| 1.5Pd@Beta | 12.5 | 62.38 | 34.82 | 2.66 | 13.1 | 0.14 | 4.1 |
| 1Pd@USY | 15.0 | 59.49 | 30.00 | 10.39 | 2.9 | 0.11 | 4.6 |
| 1Pd@Y | 2.6 | 63.58 | 35.11 | 1.23 | 28.5 | 0.07 | 5.1 |
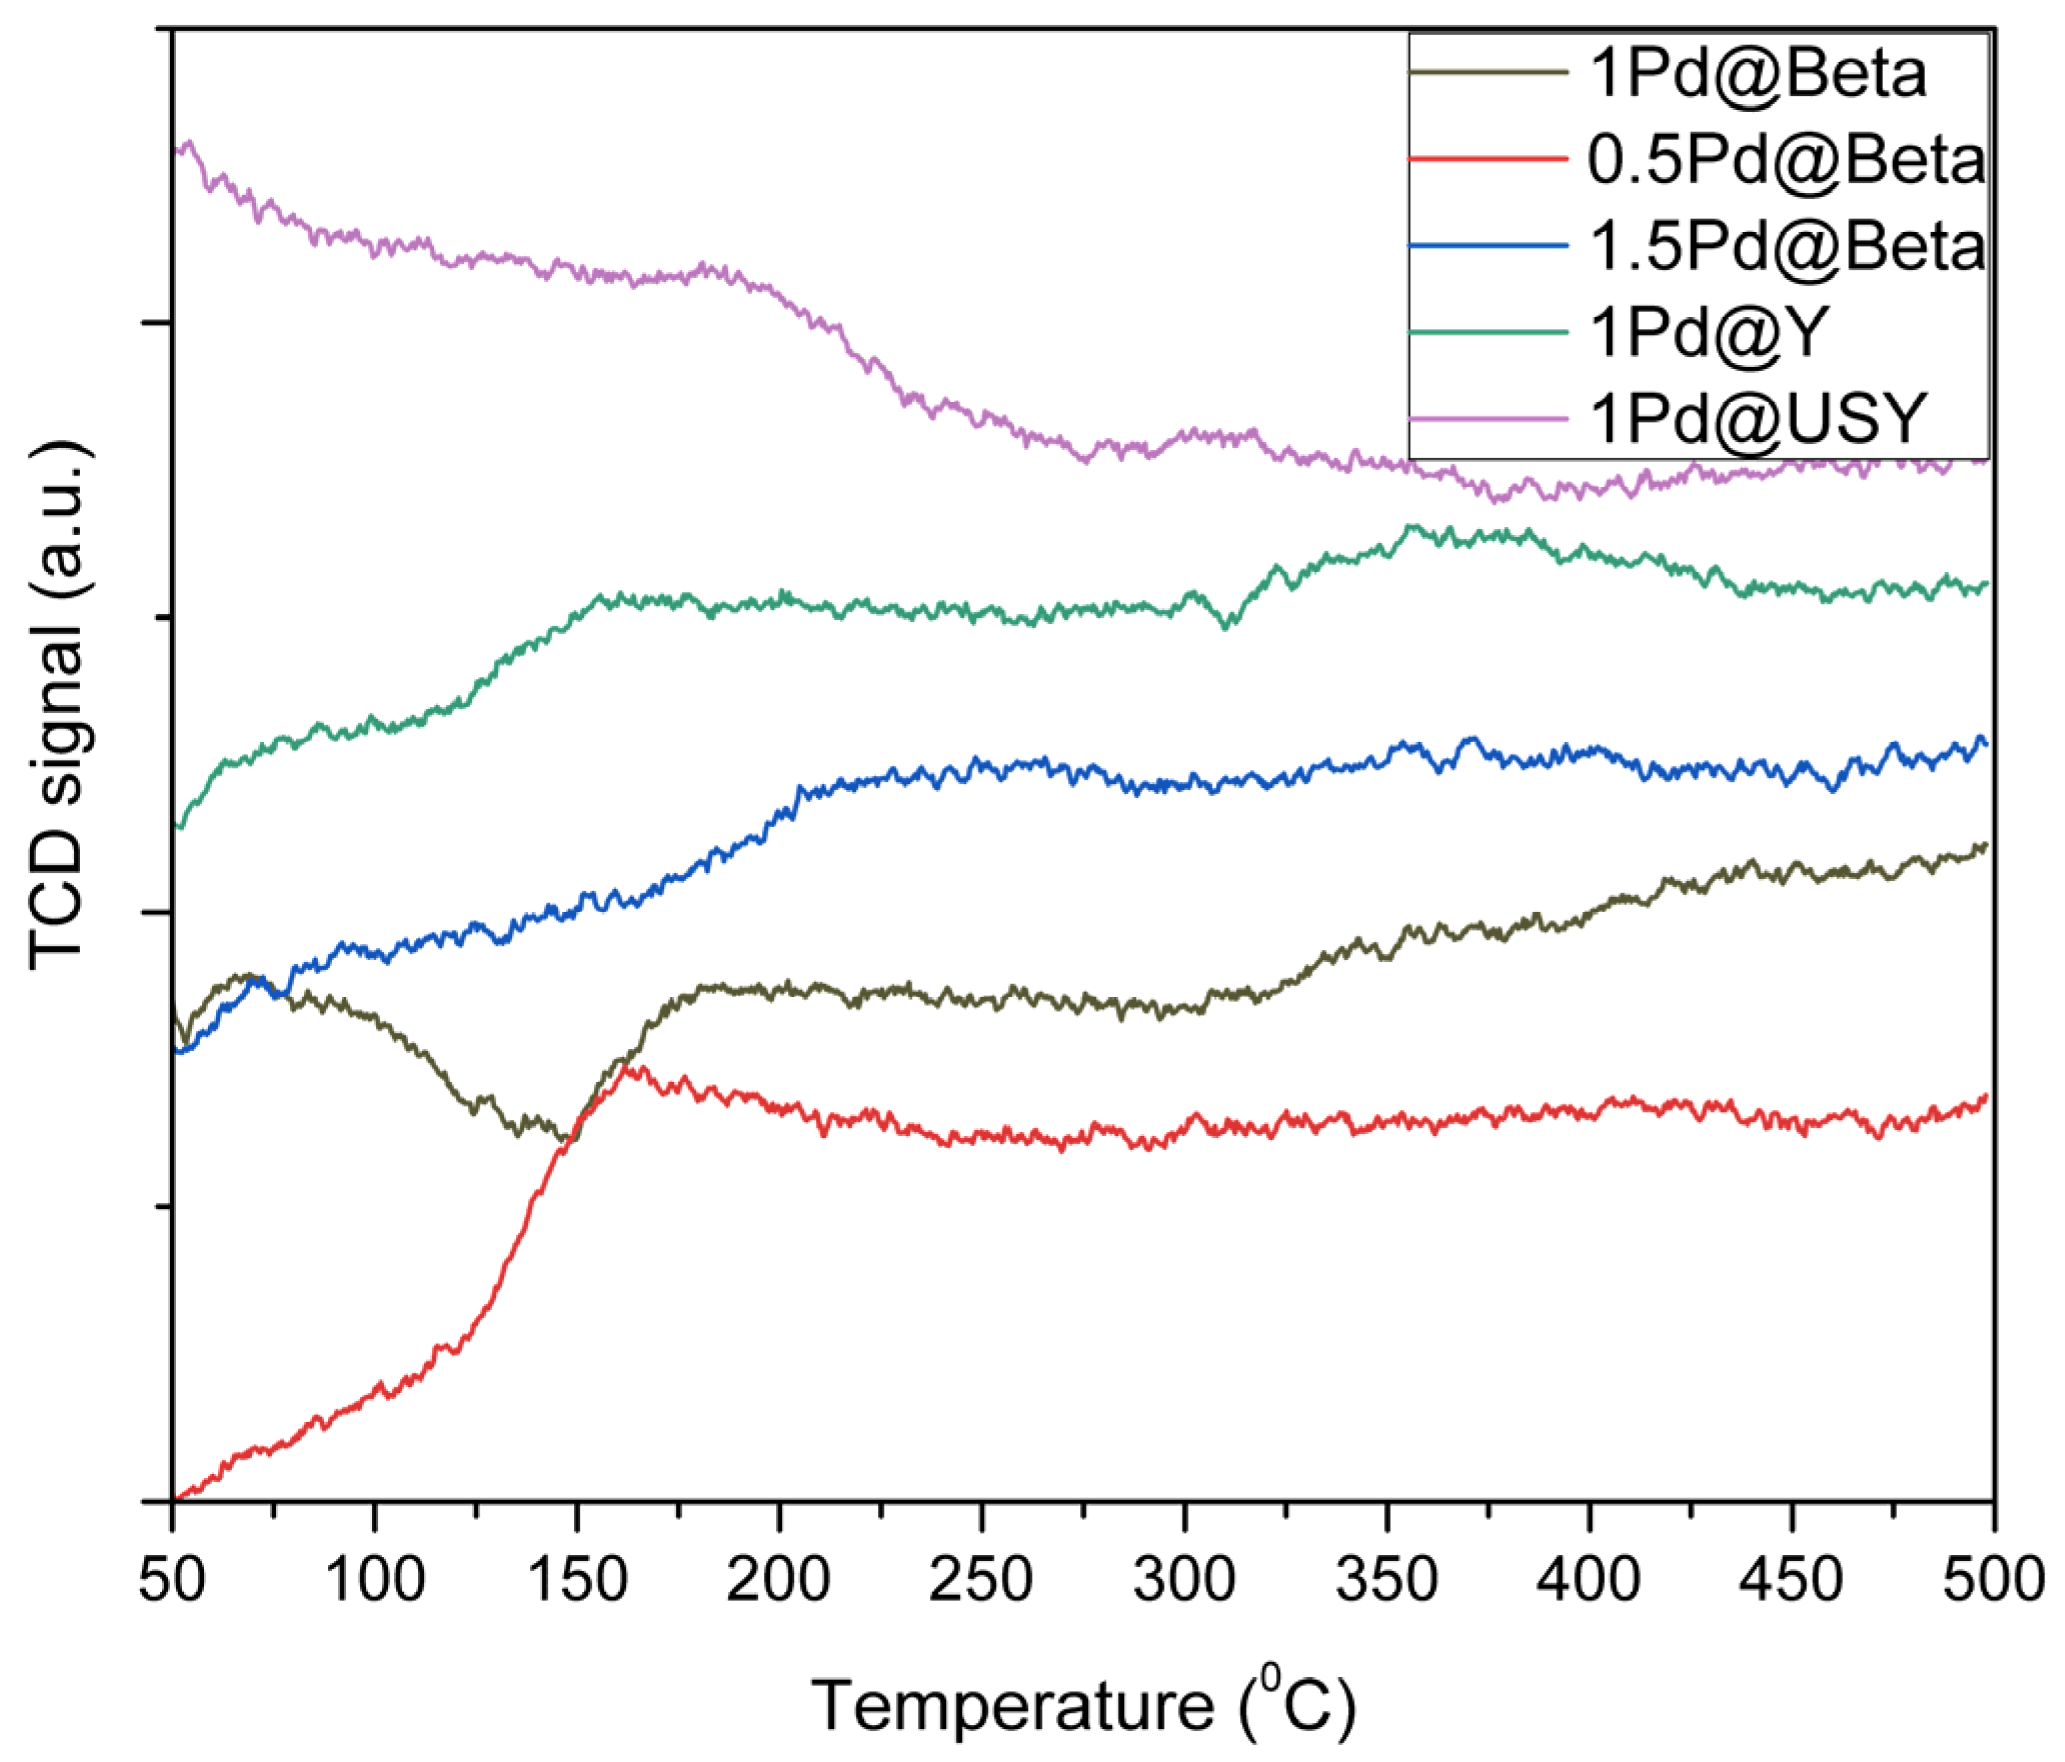
| Catalyst | Acid Site Concentration (µmols NH3/g) | ||||
|---|---|---|---|---|---|
| 50–150 °C | 150–250 °C | 250–400 °C | Total | L/B Ratio | |
| H-Beta | 66.0 (<300 °C) | 4.0 (>300 °C) | 70.0 | - | |
| 0.5Pd@Beta | 85.6 | 19.9 | 1.01 | 106.51 | 19.7 |
| 1Pd@Beta | 91.51 | 20.08 | 1.81 | 113.40 | 11.1 |
| 1.5Pd@Beta | 117.97 | 10.57 | 3.70 | 132.24 | 2.9 |
| 1 Pd@Y | 54.27 | - | 14.92 | 69.19 | 0 |
| 1Pd@USY | 110.49 | 0.12 (260 °C) | 2.97 | 113.58 | 0.04 |
| Entry | Catalyst | Mw (Da) | Mn (Da) | PD |
|---|---|---|---|---|
| 1 | 1Pd@Beta | 26,383 | 9600 | 2.7 |
| 2 | 1.5Pd@Beta | 22,835 | 7195 | 3.2 |
| 3 1 | 1.5Pd@Beta | 17,390 | 5923 | 2.9 |
| 4 2 | 1.5Pd@Beta | 11,312 | 3902 | 2.9 |
| 5 3 | 1.5Pd@Beta | 8370 | 4740 | 1.8 |
| 6 | 1Pd@USY | 80,534 | 53,204 | 1.5 |
| 7 | 1.5Pd@USY | 81,631 | 31,419 | 2.6 |
| Alkanes |  |
| Alcohols |  |
| Acids |  |
| Esters |  |
| Phenolics |  |
| Esters |  |
Publisher’s Note: MDPI stays neutral with regard to jurisdictional claims in published maps and institutional affiliations. |
© 2022 by the authors. Licensee MDPI, Basel, Switzerland. This article is an open access article distributed under the terms and conditions of the Creative Commons Attribution (CC BY) license (https://creativecommons.org/licenses/by/4.0/).
Share and Cite
El Fergani, M.; Candu, N.; Podolean, I.; Cojocaru, B.; Nicolaev, A.; Teodorescu, C.M.; Tudorache, M.; Parvulescu, V.I.; Coman, S.M. Catalytic Hydrotreatment of Humins Waste over Bifunctional Pd-Based Zeolite Catalysts. Catalysts 2022, 12, 1202. https://doi.org/10.3390/catal12101202
El Fergani M, Candu N, Podolean I, Cojocaru B, Nicolaev A, Teodorescu CM, Tudorache M, Parvulescu VI, Coman SM. Catalytic Hydrotreatment of Humins Waste over Bifunctional Pd-Based Zeolite Catalysts. Catalysts. 2022; 12(10):1202. https://doi.org/10.3390/catal12101202
Chicago/Turabian StyleEl Fergani, Magdi, Natalia Candu, Iunia Podolean, Bogdan Cojocaru, Adela Nicolaev, Cristian M. Teodorescu, Madalina Tudorache, Vasile I. Parvulescu, and Simona M. Coman. 2022. "Catalytic Hydrotreatment of Humins Waste over Bifunctional Pd-Based Zeolite Catalysts" Catalysts 12, no. 10: 1202. https://doi.org/10.3390/catal12101202
APA StyleEl Fergani, M., Candu, N., Podolean, I., Cojocaru, B., Nicolaev, A., Teodorescu, C. M., Tudorache, M., Parvulescu, V. I., & Coman, S. M. (2022). Catalytic Hydrotreatment of Humins Waste over Bifunctional Pd-Based Zeolite Catalysts. Catalysts, 12(10), 1202. https://doi.org/10.3390/catal12101202