
Enhanced Photocatalytic Activity of Ficus elastica Mediated Zinc Oxide-Zirconium Dioxide Nanocatalyst at Elevated Calcination Temperature: Physicochemical Study


 ,
,  ,
,  , ,
, ,
Abstract
:1. Introduction
2. Results and Discussion
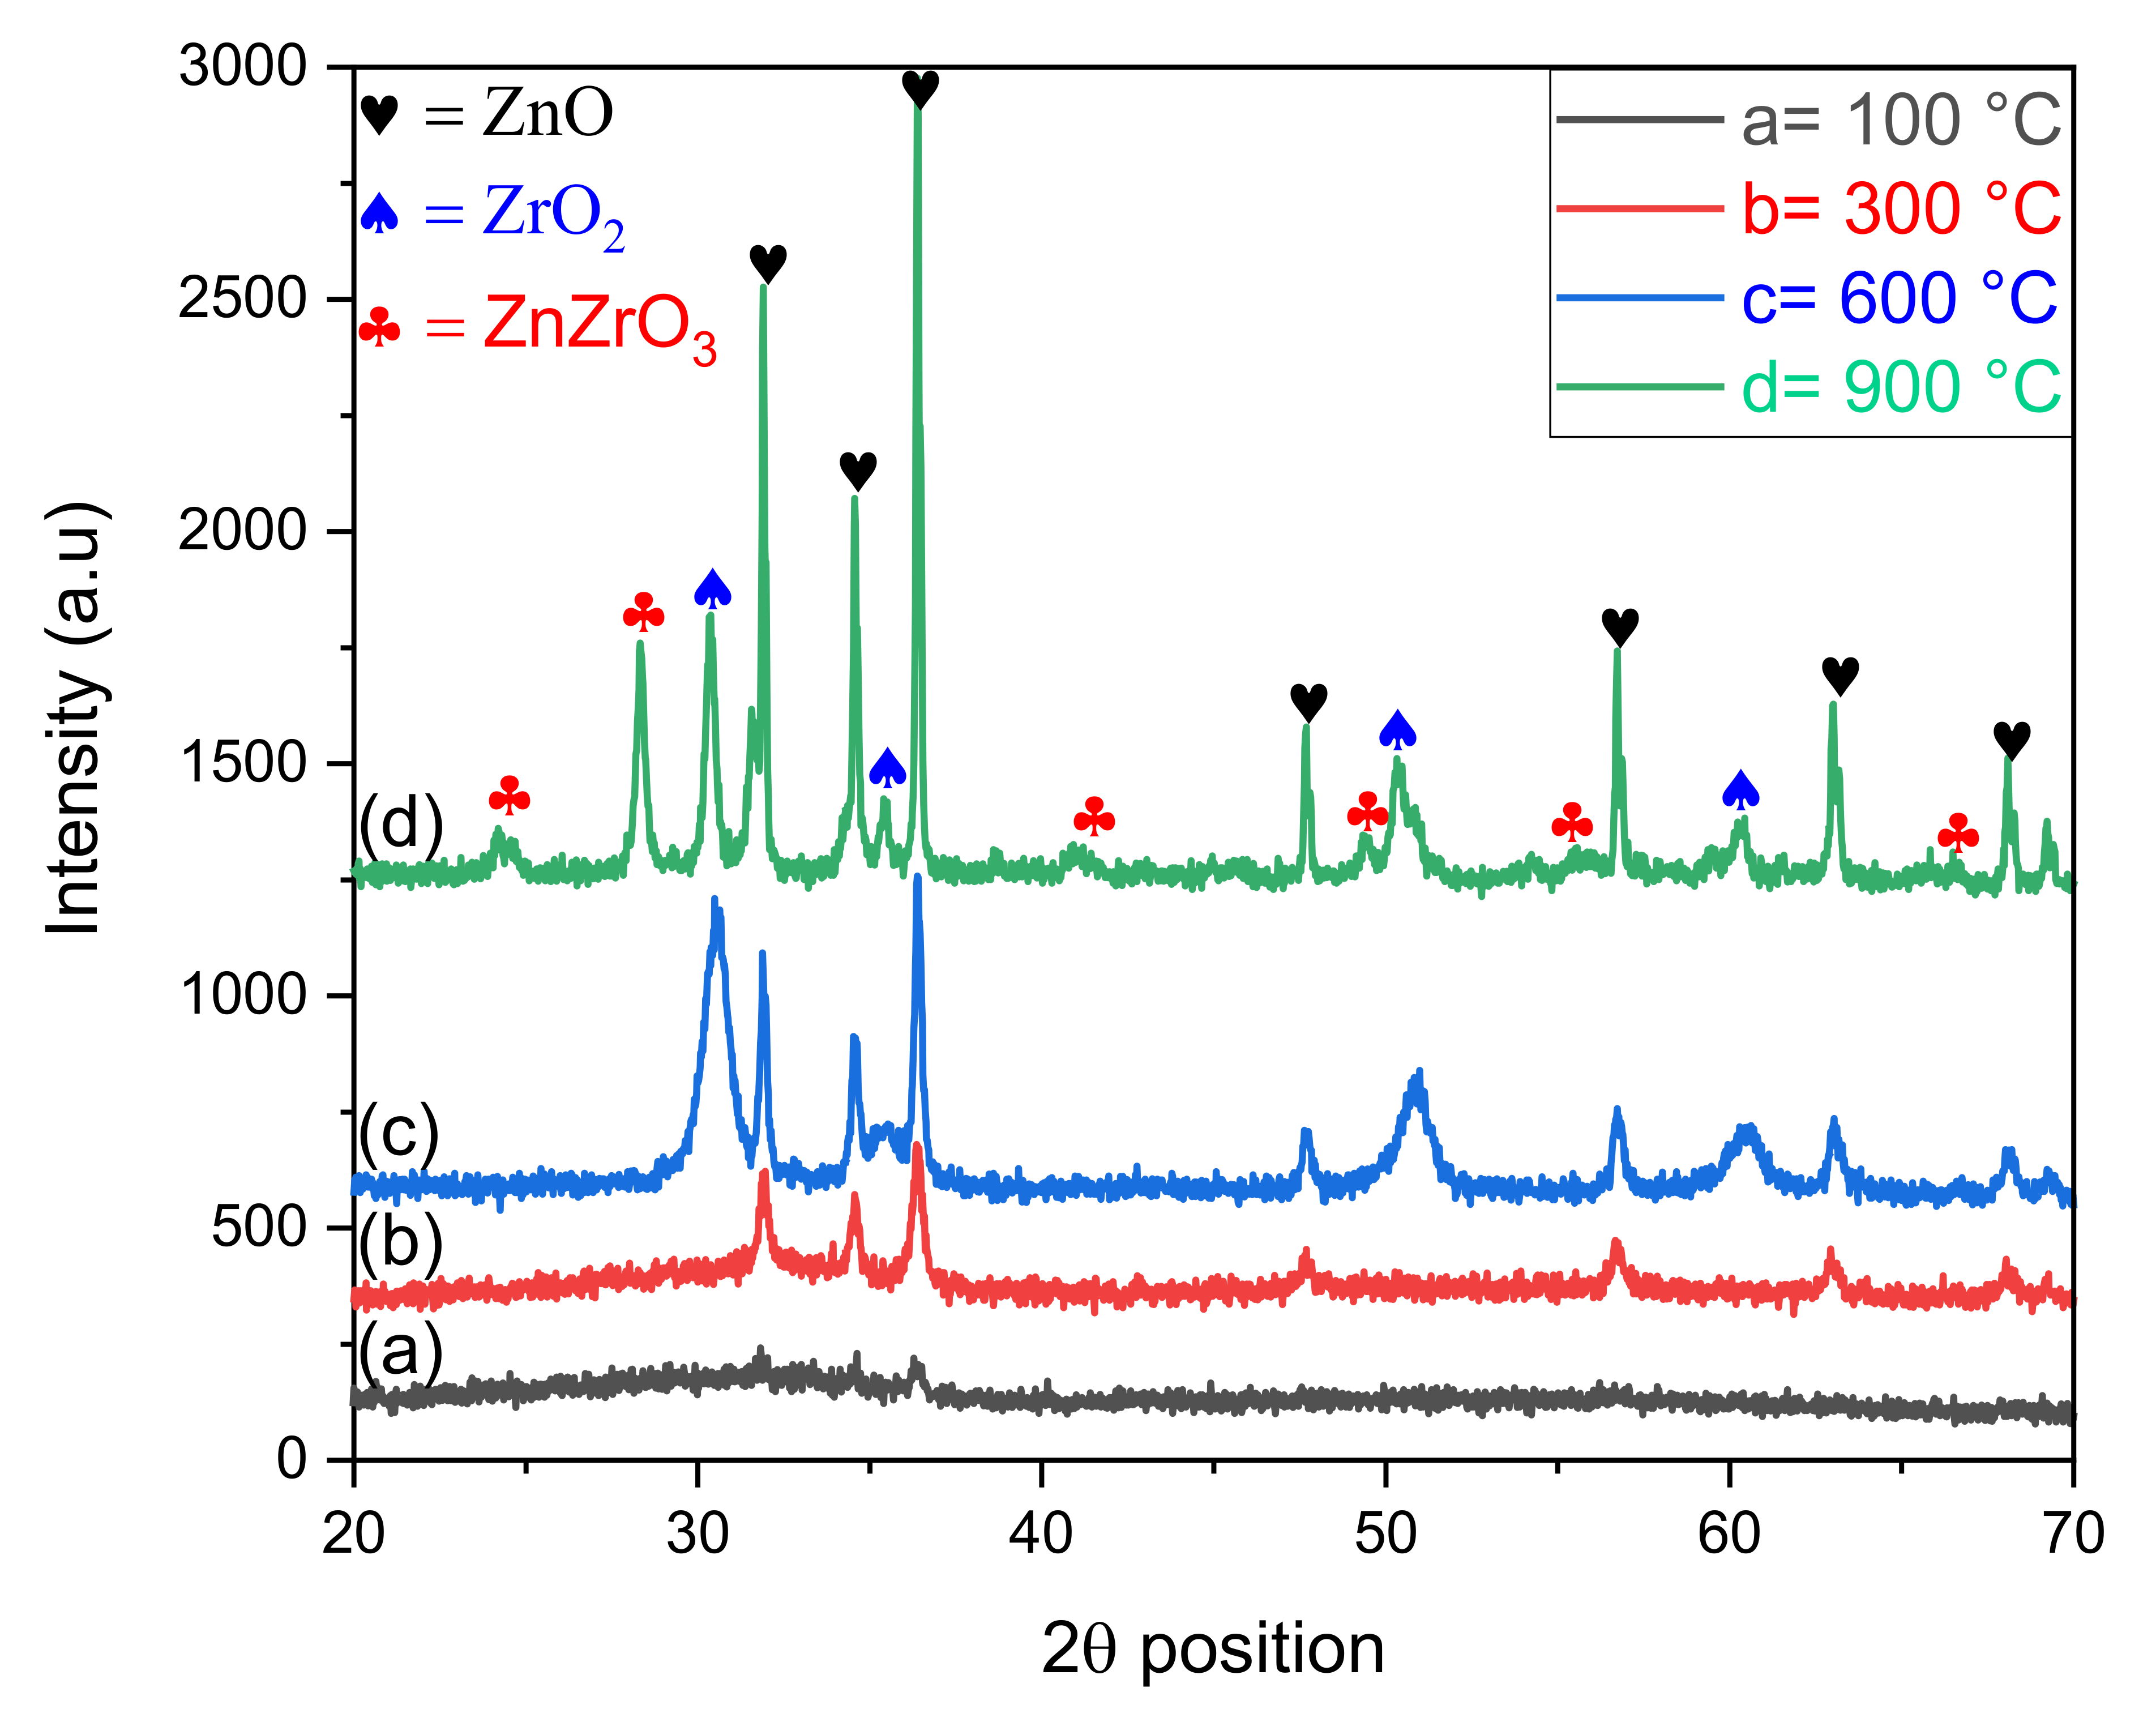
2.1. XRD Analysis
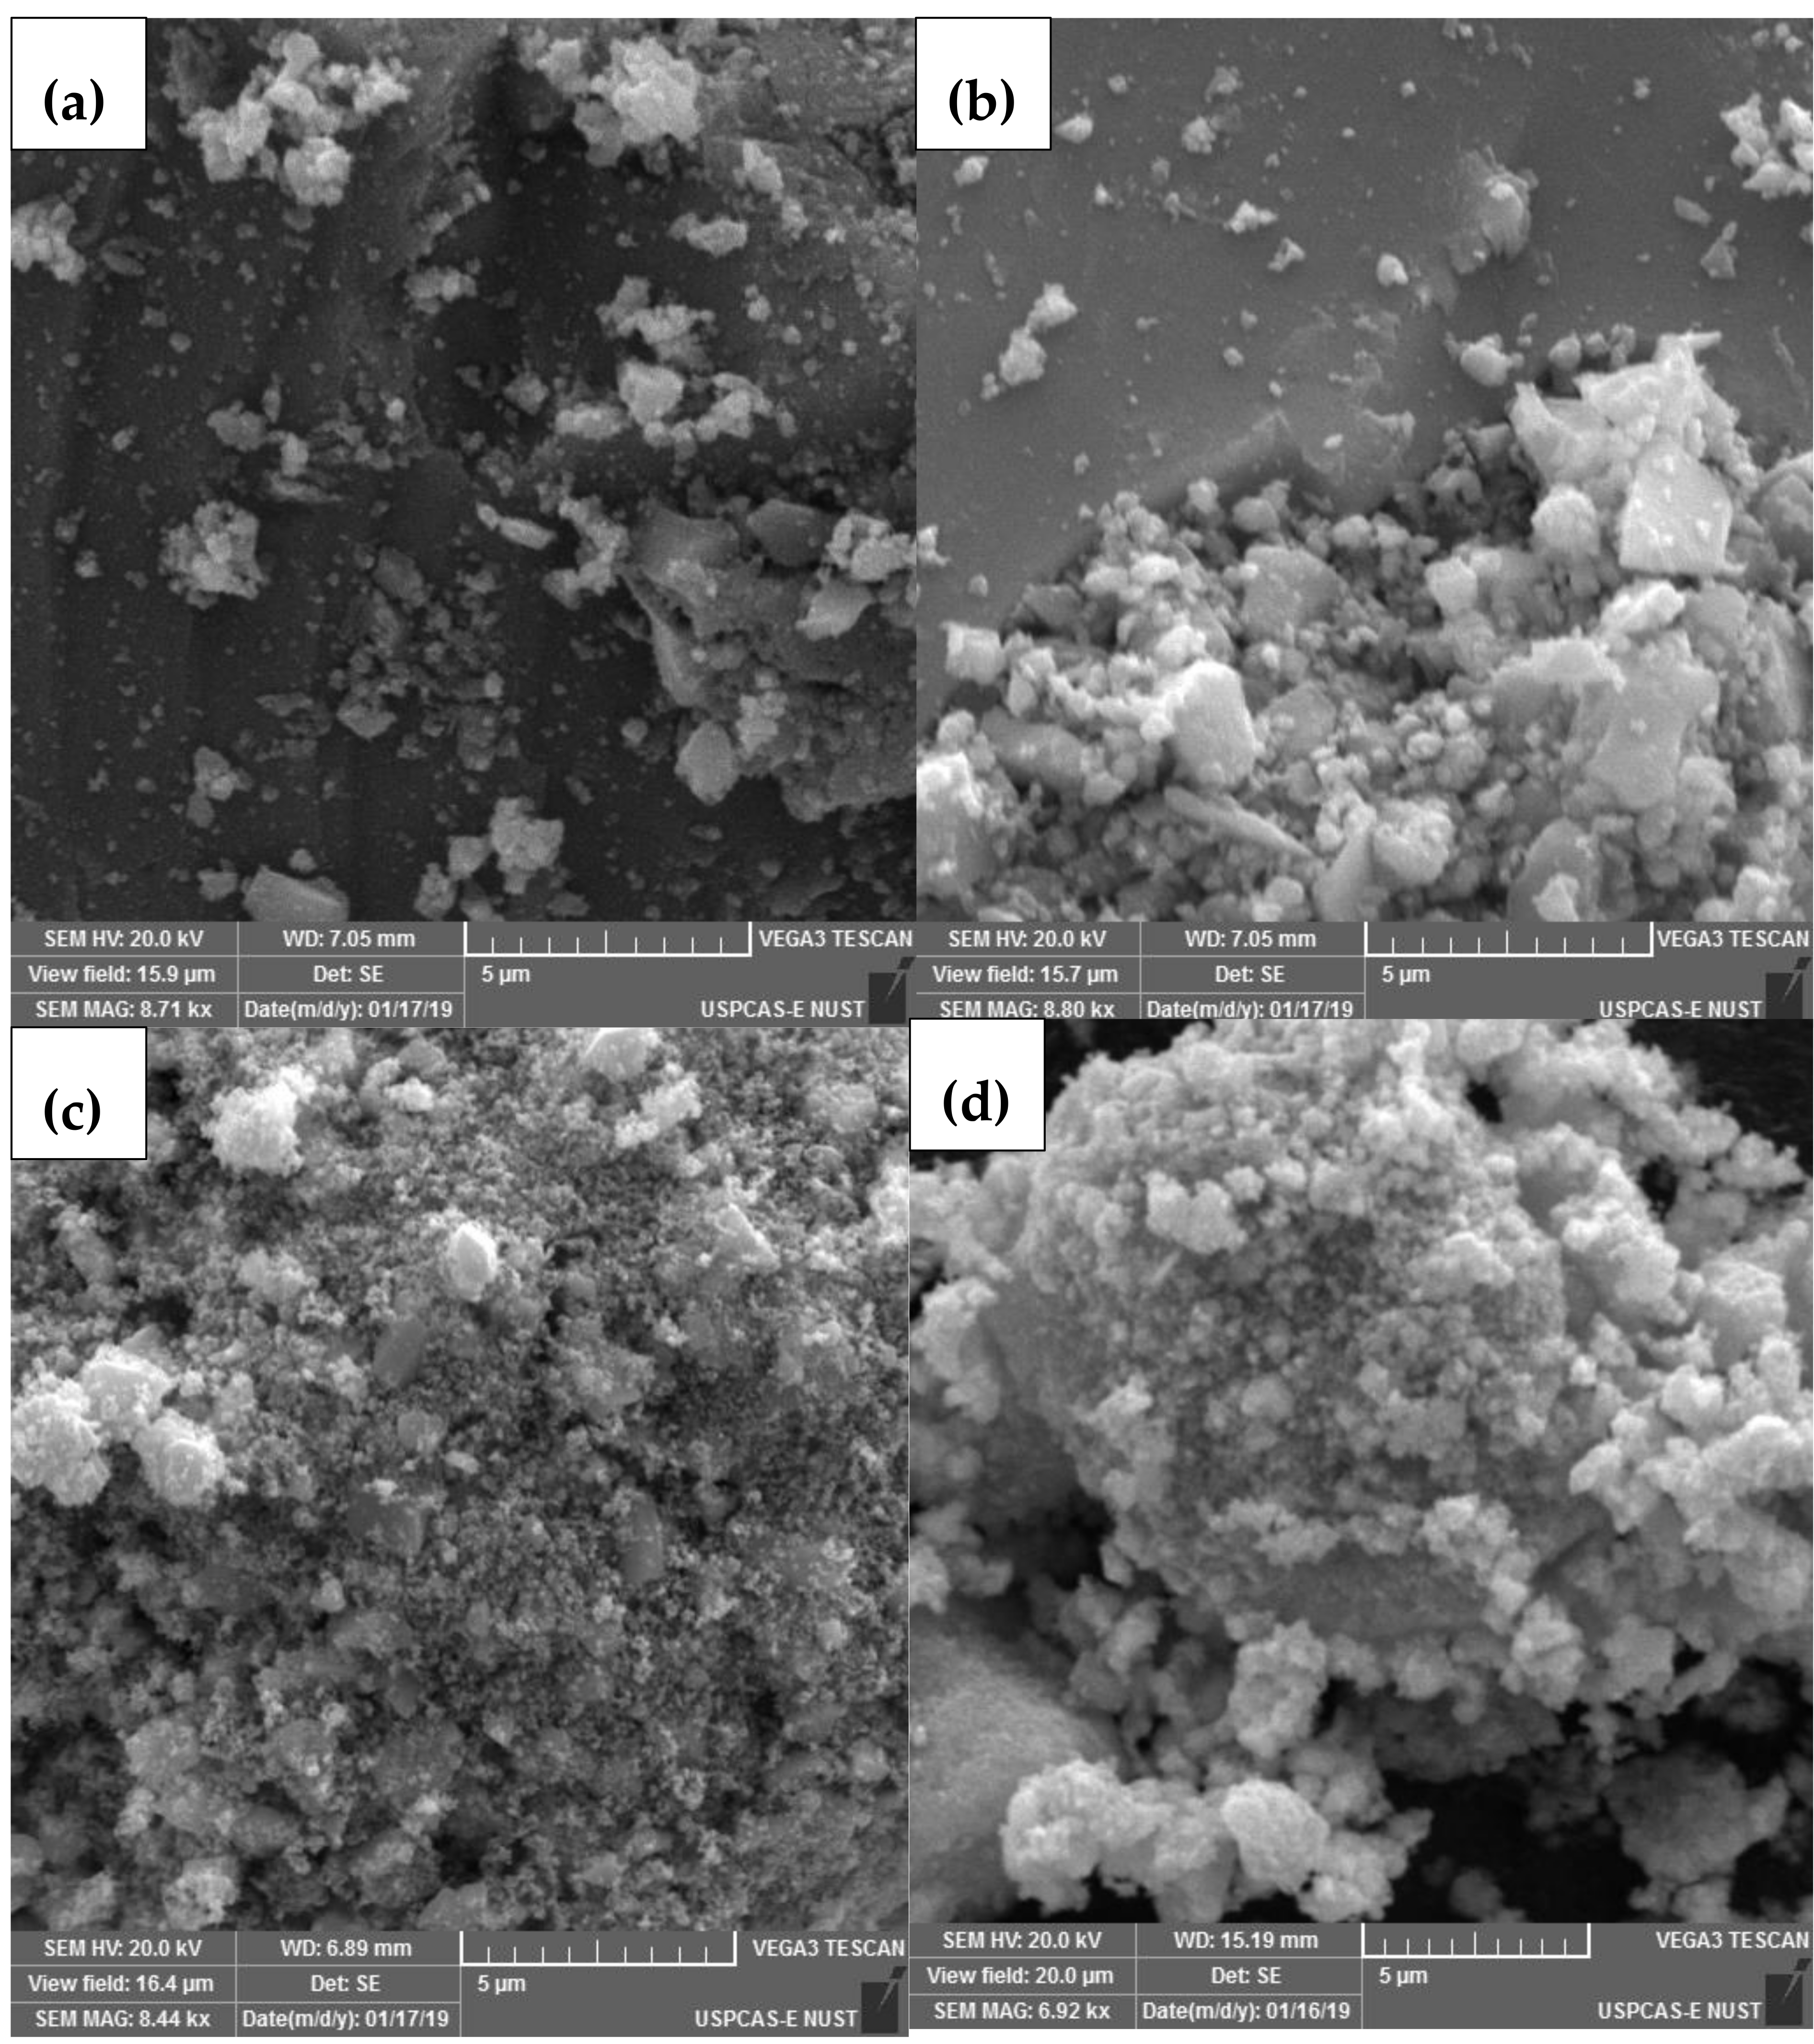
2.2. SEM Analysis
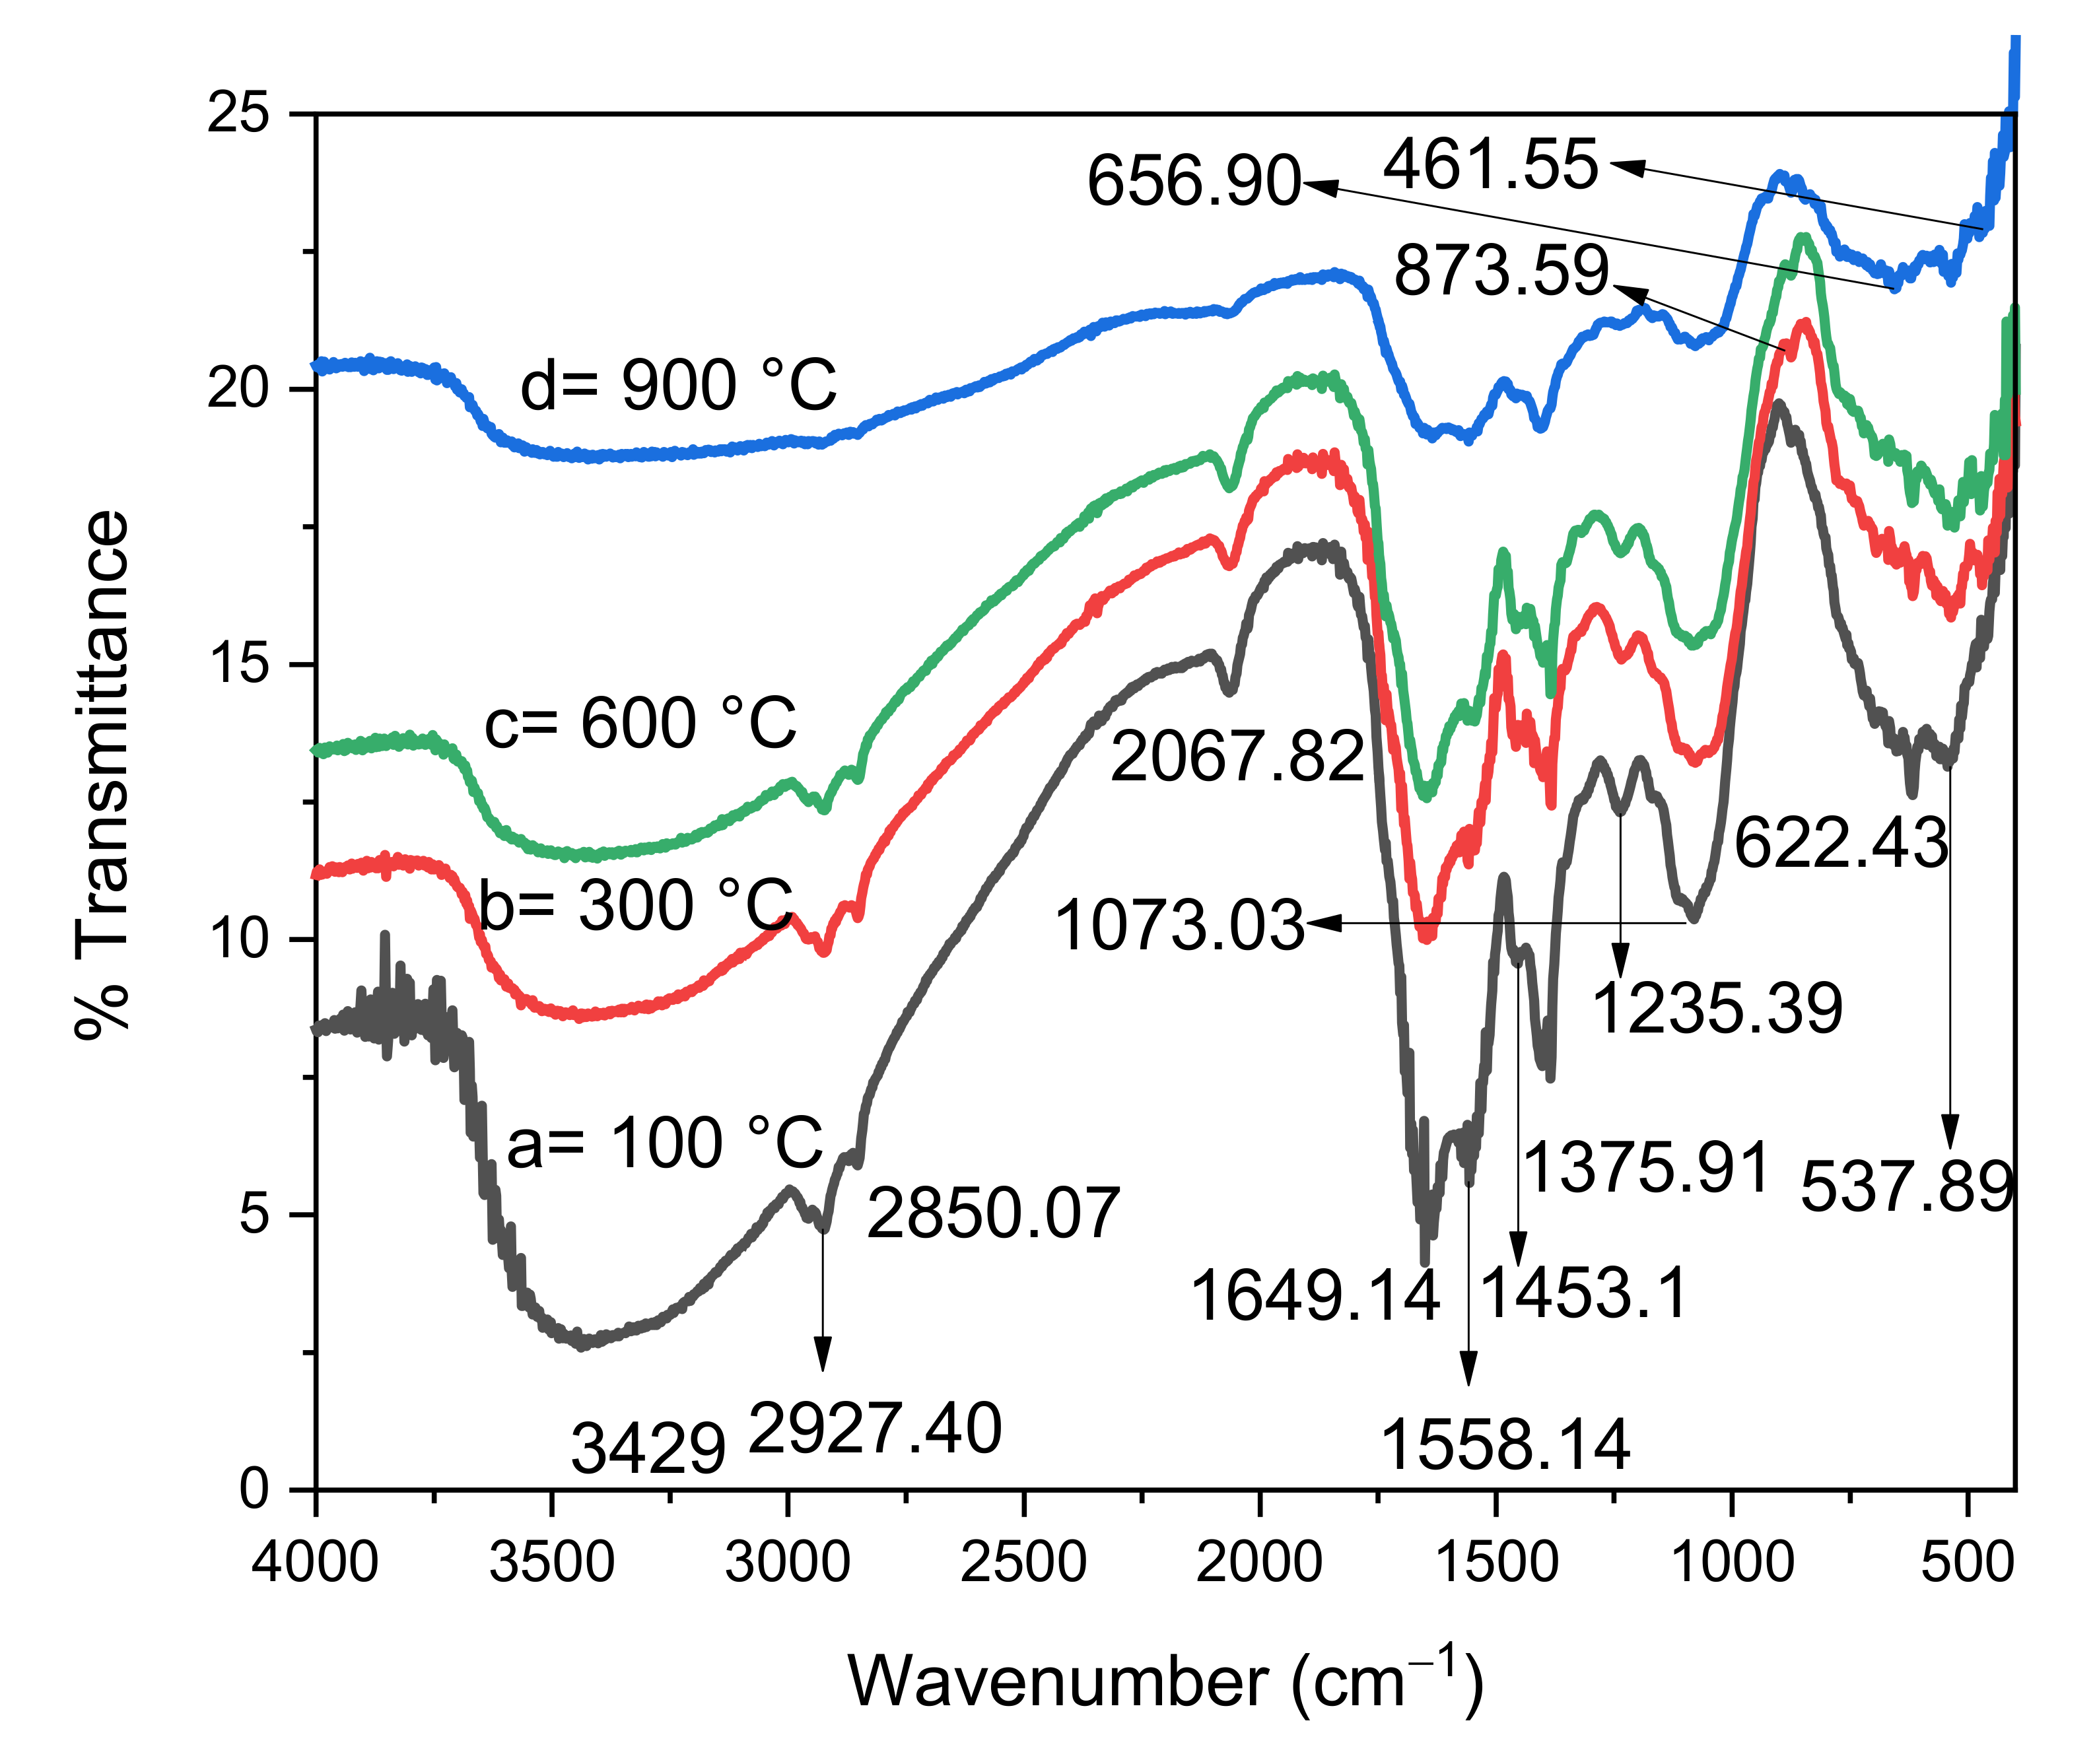
2.3. FTIR Analysis
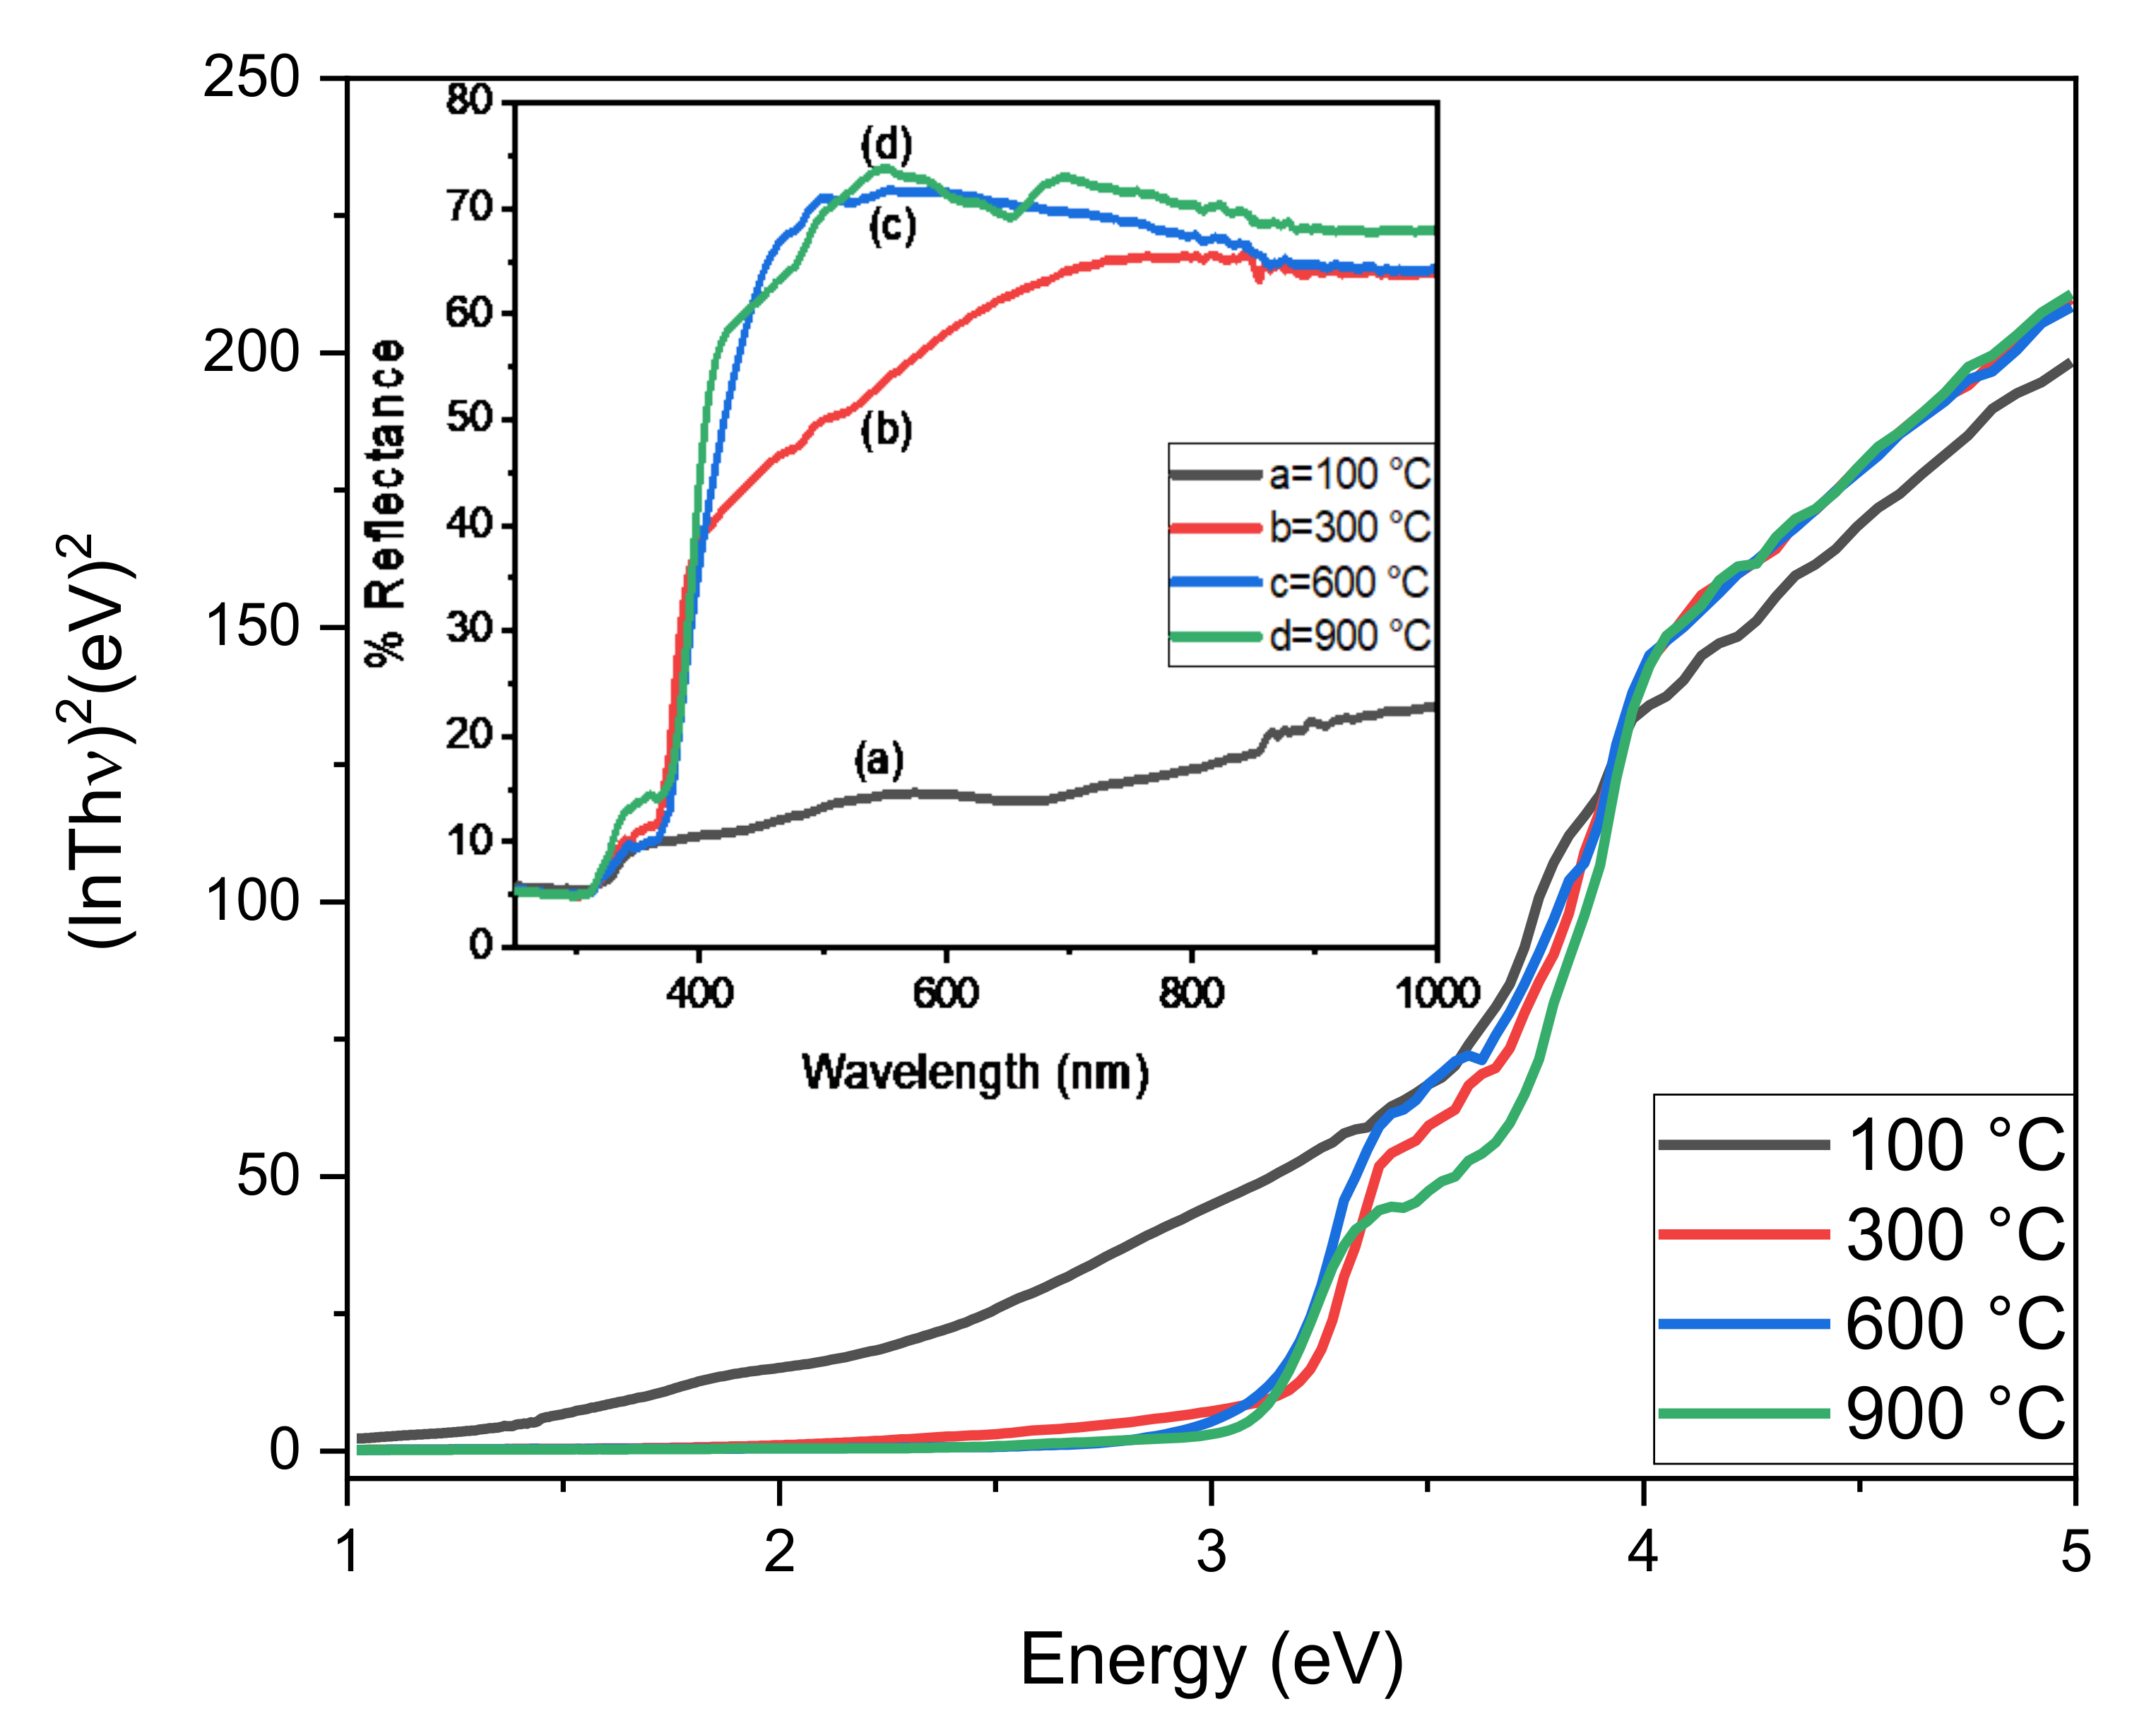
2.4. DRS Analysis
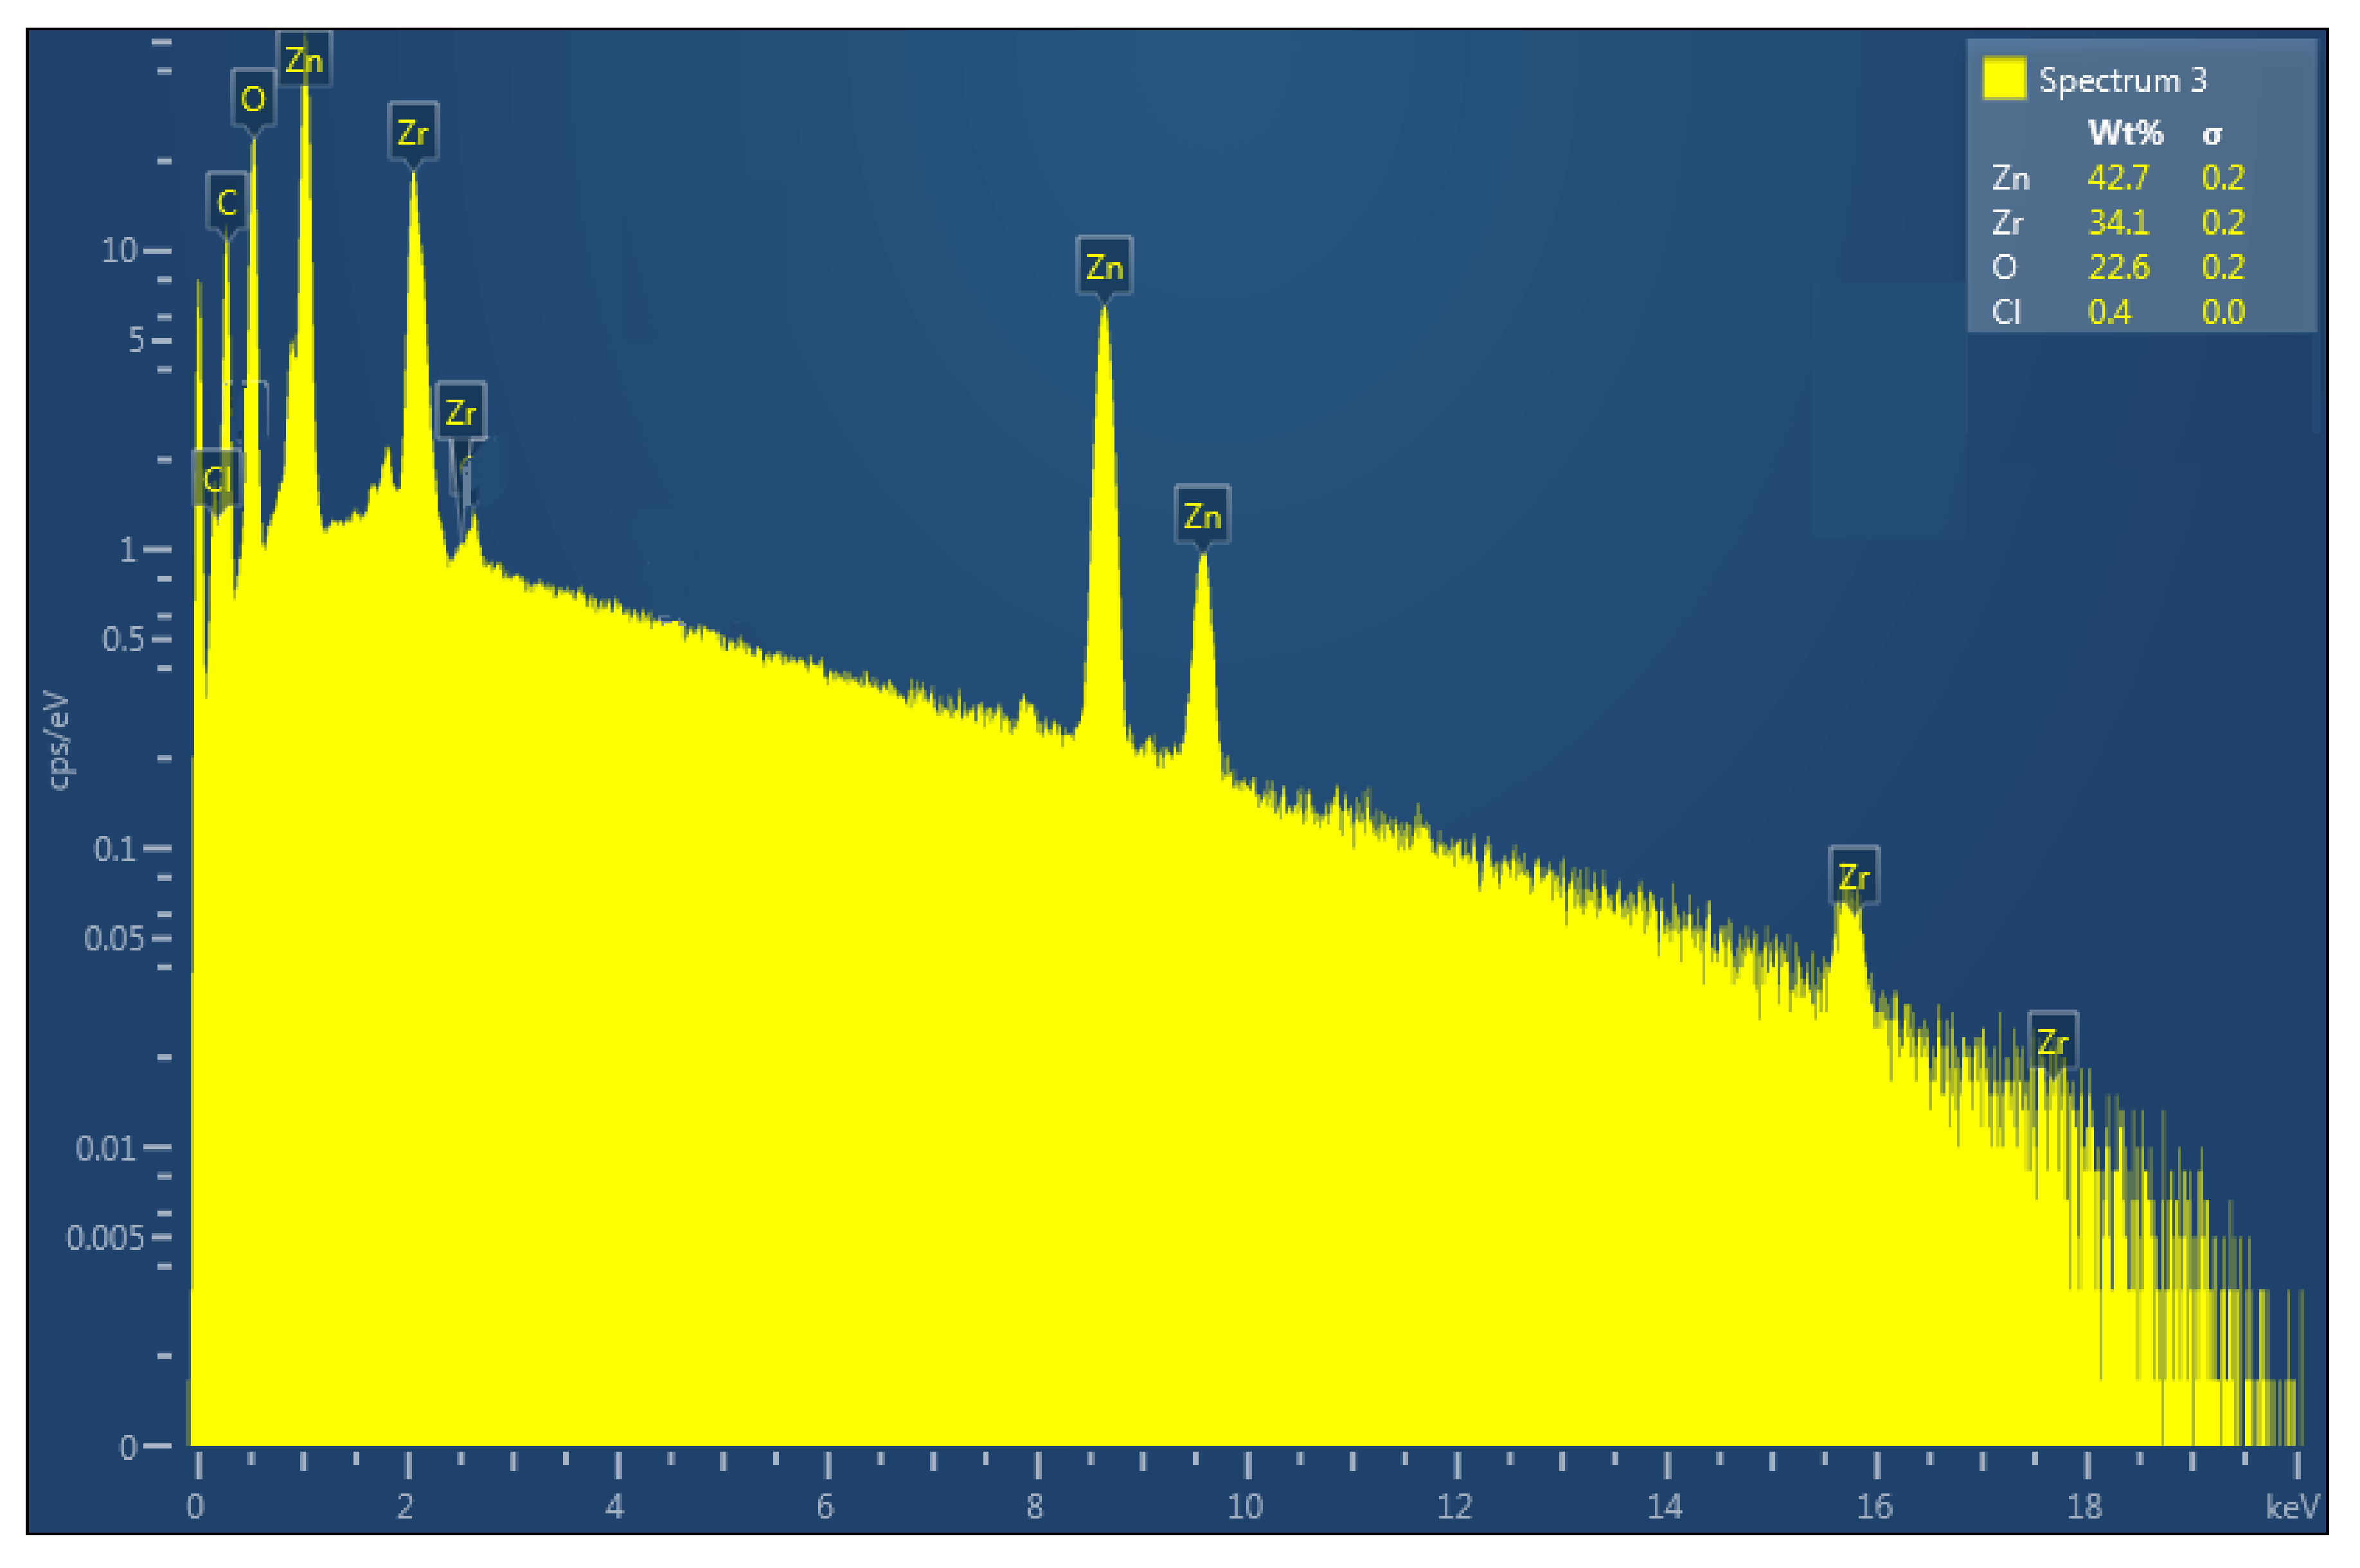
2.5. EDX Analysis
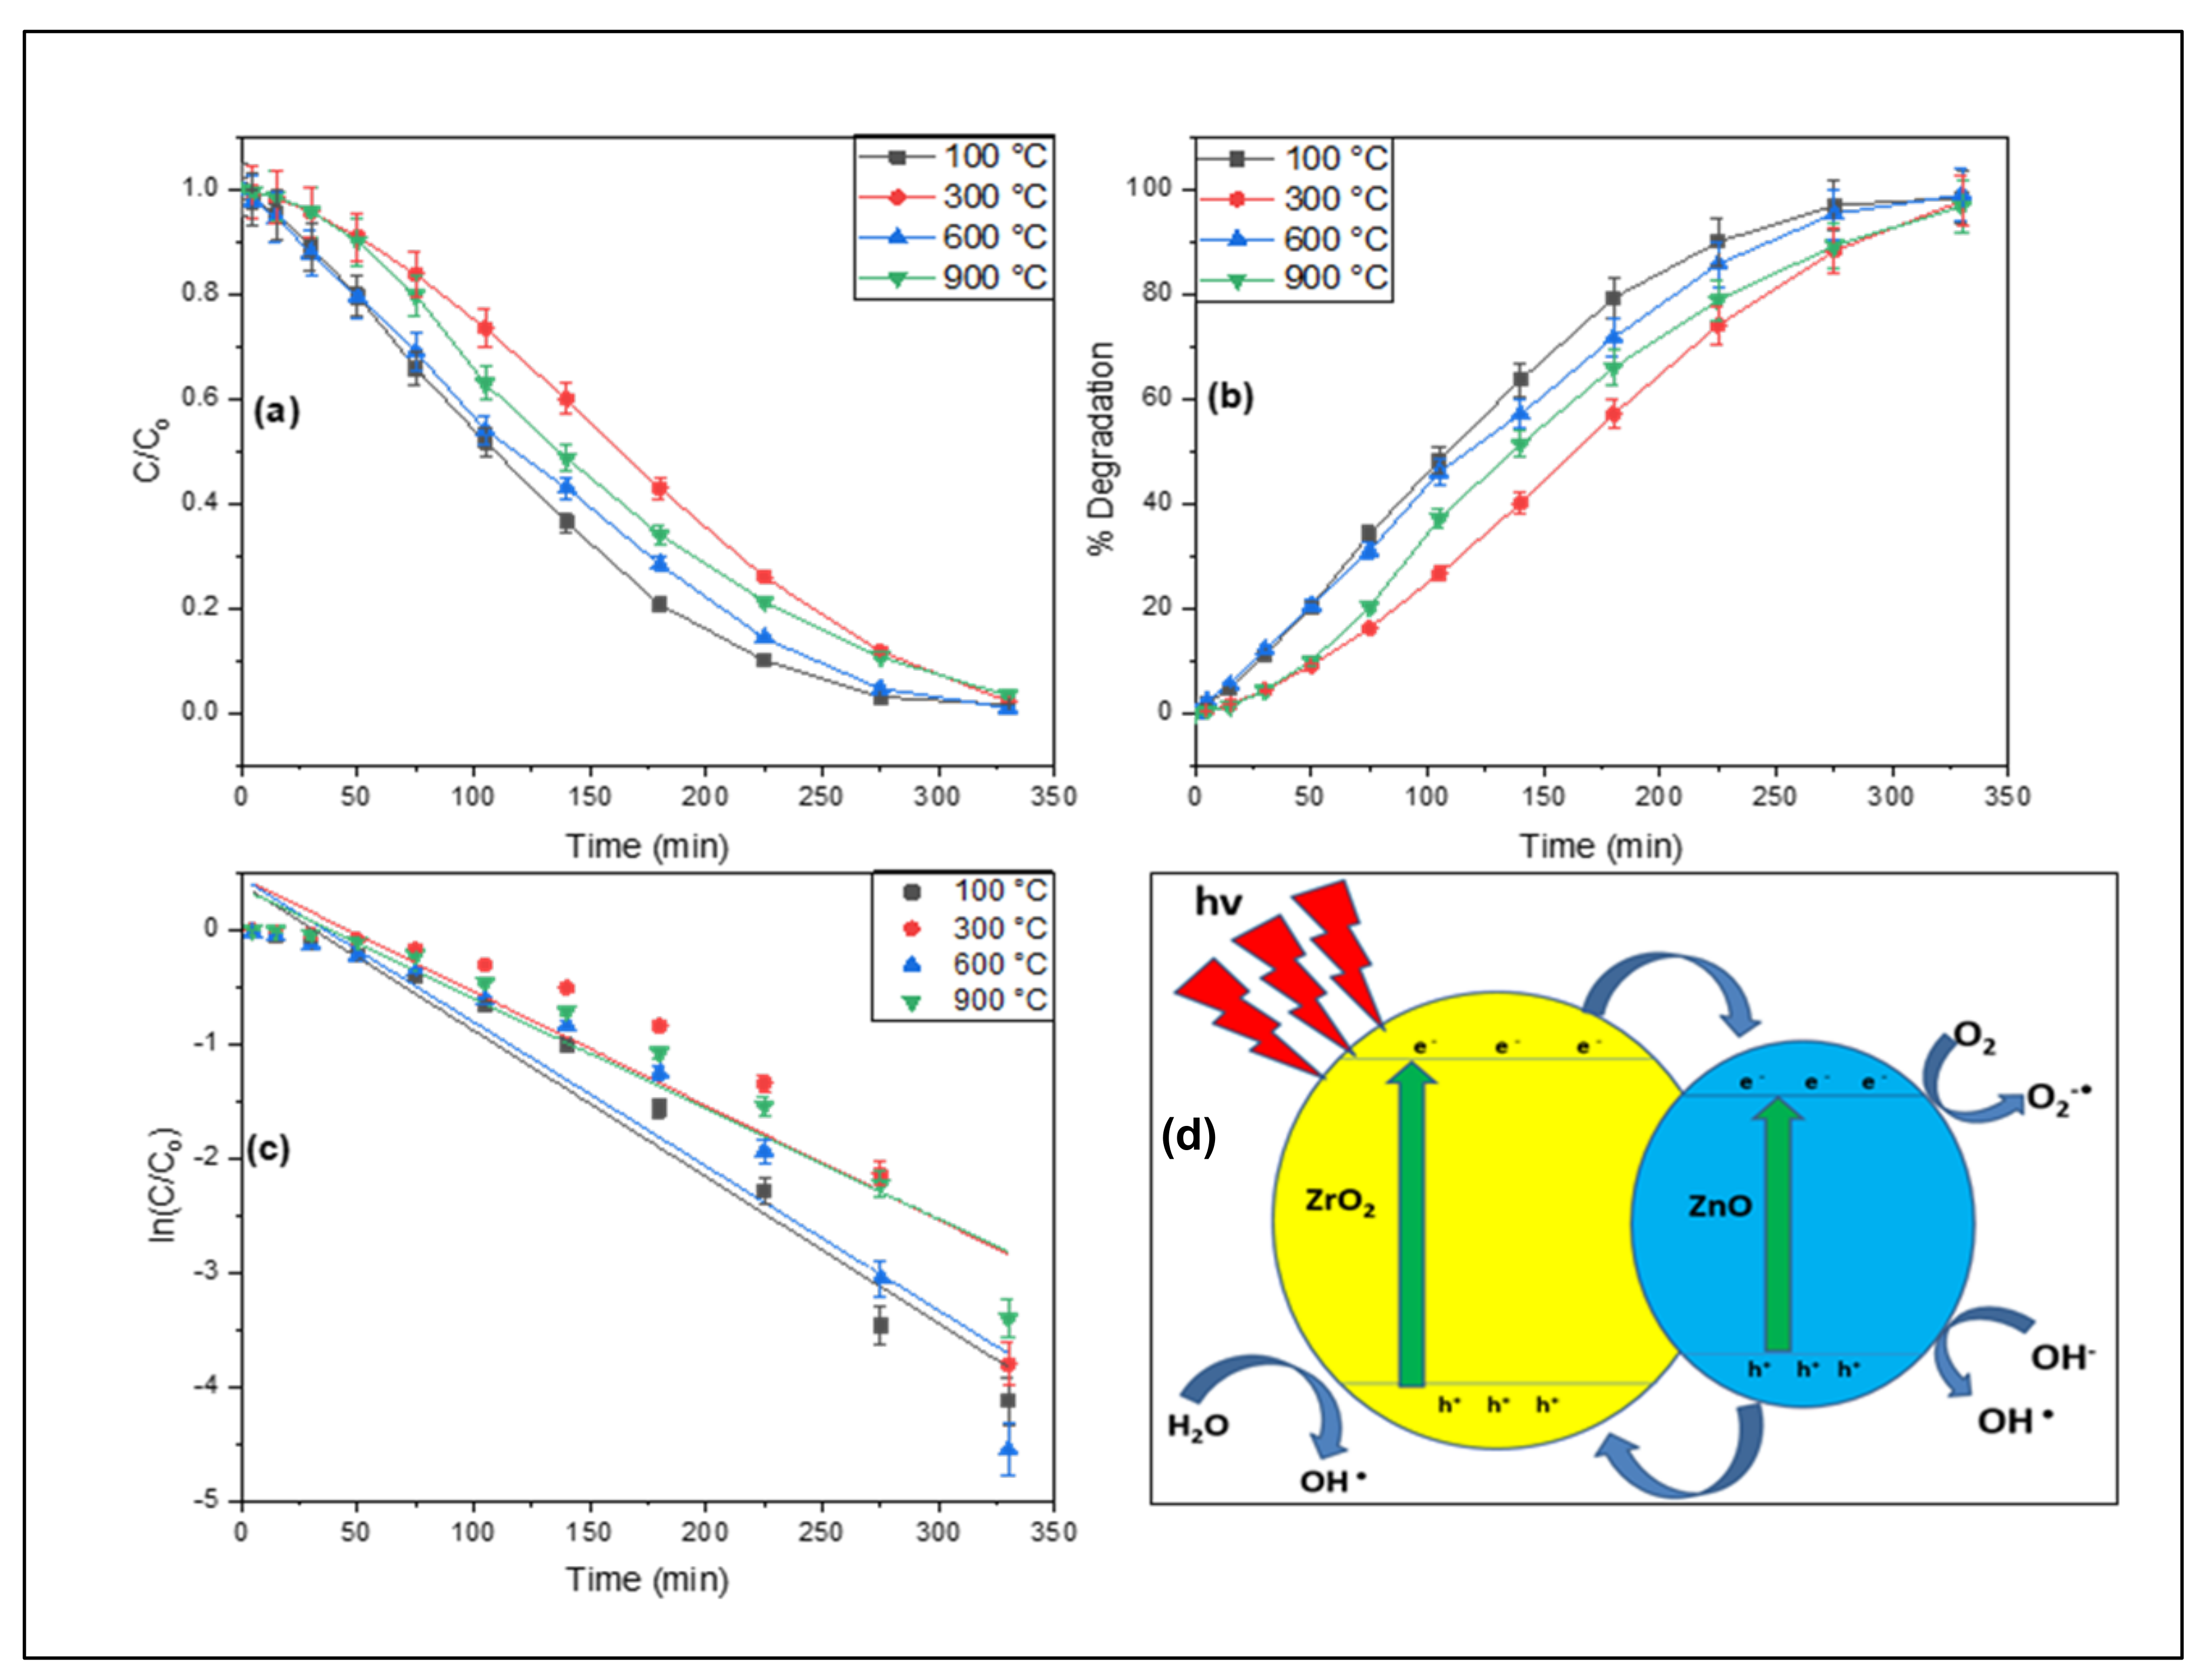
2.6. Photocatalytic Activity
2.7. Factors Affecting the Photocatalytic Activity
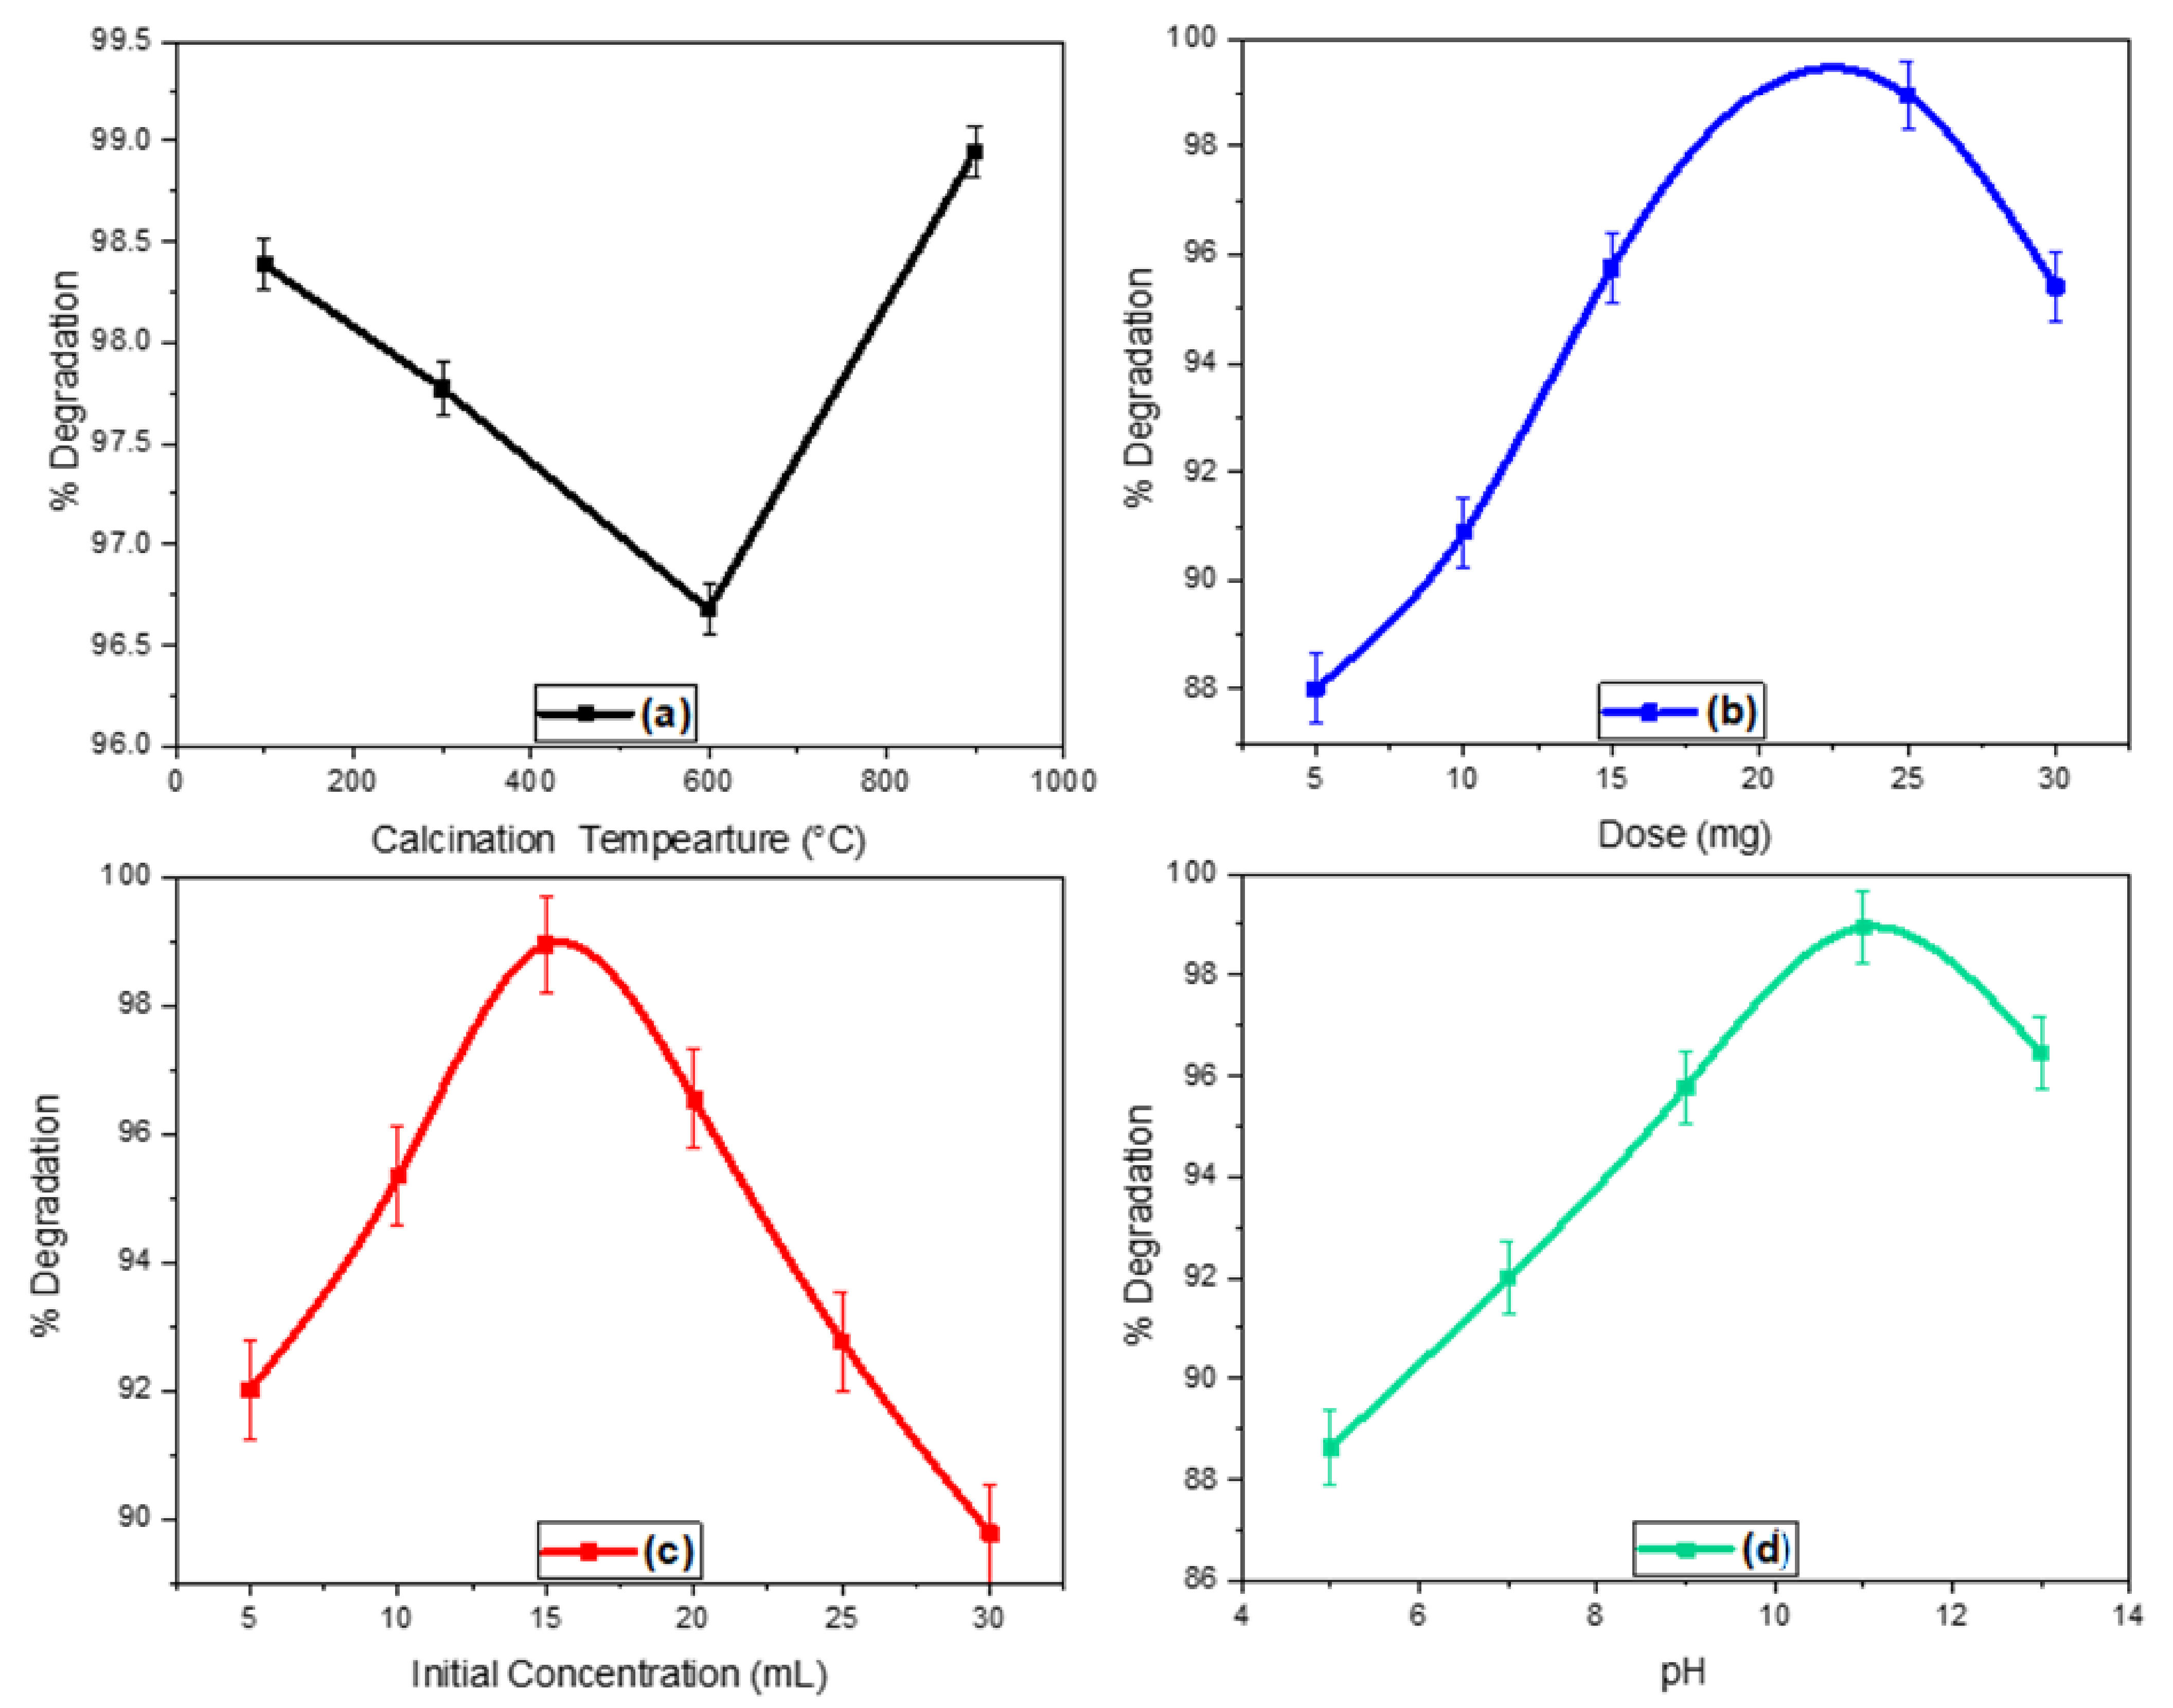
2.7.1. Effect of Calcination Temperature
2.7.2. Effect of Catalyst Dose
2.7.3. Effect of Initial Concentration of Dye
2.7.4. Effect of pH
3. Materials and Methods
3.1. Materials
3.2. Preparation of F. Elastic Leaves Extract
3.3. Synthesis of ZnO-ZrO2 NC
3.4. Characterization
3.5. Photocatalytic Activity
4. Conclusions
Author Contributions
Funding
Data Availability Statement
Acknowledgments
Conflicts of Interest
References
- Das, R.; Sypu, V.S.; Paumo, H.K.; Bhaumik, M.; Maharaj, V.; Maity, A. Silver decorated magnetic nanocomposite (Fe3O4@PPy-MAA/Ag) as highly active catalyst towards reduction of 4-nitrophenol and toxic organic dyes. Appl. Catal. B Environ. 2019, 244, 546–558. [Google Scholar] [CrossRef]
- Ismail, M.; Akhtar, K.; Khan, M.I.; Kamal, T.; Khan, M.A.; Asiri, A.M.; Seo, J.; Khan, S.B. Pollution, Toxicity and Carcinogenicity of Organic Dyes and their Catalytic Bio-Remediation. Curr. Pharm. Des. 2019, 25, 3645–3663. [Google Scholar] [CrossRef]
- Gusain, R.; Gupta, K.; Joshi, P.; Khatri, O.P. Adsorptive removal and photocatalytic degradation of organic pollutants using metal oxides and their composites: A comprehensive review. Adv. Colloid Interface Sci. 2019, 272, 102009. [Google Scholar] [CrossRef] [PubMed]
- Hunge, Y.M.; Yadav, A.A.; Mahadik, M.A.; Bulakhe, R.N.; Shim, J.J.; Mathe, V.L.; Bhosale, C.H. Degradation of organic dyes using spray deposited nanocrystalline strati fi ed WO 3 / TiO 2 photoelectrodes under sunlight illumination. Opt. Mater. 2018, 76, 260–270. [Google Scholar] [CrossRef]
- Kaykhaii, M.; Sasani, M.; Marghzari, S. Removal of Dyes from the Environment by Adsorption Process. Chem. Mater. Eng. 2018, 6, 31–35. [Google Scholar] [CrossRef] [Green Version]
- Hunge, Y.M.; Yadav, A.A.; Kang, S.W.; Kim, H. Photocatalytic degradation of tetracycline antibiotics using hydrothermally synthesized two-dimensional molybdenum disulfide/titanium dioxide composites. J. Colloid Interface Sci. 2022, 606, 454–463. [Google Scholar] [CrossRef]
- Karuppaiah, S.; Annamalai, R.; Muthuraj, A.; Kesavan, S.; Palani, R.; Ponnusamy, S.; Nagarajan, E.R.; Meenakshisundaram, S. Efficient photocatalytic degradation of ciprofloxacin and bisphenol A under visible light using Gd 2 WO 6 loaded ZnO/bentonite nanocomposite. Appl. Surf. Sci. 2019, 481, 1109–1119. [Google Scholar] [CrossRef]
- Chiu, Y.-H.; Chang, T.-F.M.; Chen, C.-Y.; Sone, M.; Hsu, Y.-J. Mechanistic Insights into Photodegradation of Organic Dyes Using Heterostructure Photocatalysts. Catalysts 2019, 9, 430. [Google Scholar] [CrossRef] [Green Version]
- Shah, J.H.; Fiaz, M.; Athar, M.; Ali, J.; Rubab, M.; Mehmood, R.; Jamil, S.U.U.; Djellabi, R. Facile synthesis of N/B-double-doped Mn2O3 and WO3 nanoparticles for dye degradation under visible light. Environ. Technol. 2020, 41, 2372–2381. [Google Scholar] [CrossRef]
- Hunge, Y.M.; Uchida, A.; Tominaga, Y.; Fujii, Y.; Yadav, A.A.; Kang, S.W.; Suzuki, N.; Shitanda, I.; Kondo, T.; Itagaki, M.; et al. Visible light-assisted photocatalysis using spherical-shaped bivo4 photocatalyst. Catalysts 2021, 11, 460. [Google Scholar] [CrossRef]
- Yadav, A.A.; Kang, S.W.; Hunge, Y.M. Photocatalytic degradation of Rhodamine B using graphitic carbon nitride photocatalyst. J. Mater. Sci. Mater. Electron. 2021, 32, 15577–15585. [Google Scholar] [CrossRef]
- Dashairya, L.; Sharma, M.; Basu, S.; Saha, P. SnS2/RGO based nanocomposite for efficient photocatalytic degradation of toxic industrial dyes under visible-light irradiation. J. Alloys Compd. 2019, 774, 625–636. [Google Scholar] [CrossRef]
- David, L.; Moldovan, B. Green Synthesis of Biogenic Silver Nanoparticles for Efficient Catalytic Removal of Harmful Organic Dyes. Nanomaterials 2020, 10, 202. [Google Scholar] [CrossRef] [Green Version]
- Wang, Y.; Hu, K.; Yang, Z.; Ye, C.; Li, X.; Yan, K. Facile Synthesis of Porous ZnO Nanoparticles Efficient for Photocatalytic Degradation of Biomass-Derived Bisphenol A Under Simulated Sunlight Irradiation. Front. Bioeng. Biotechnol. 2021, 8, 616780. [Google Scholar] [CrossRef] [PubMed]
- Uribe López, M.C.; Alvarez Lemus, M.A.; Hidalgo, M.C.; López González, R.; Quintana Owen, P.; Oros-Ruiz, S.; Uribe López, S.A.; Acosta, J. Synthesis and characterization of ZnO-ZrO2 nanocomposites for photocatalytic degradation and mineralization of phenol. J. Nanomater. 2019, 2019, 1015876. [Google Scholar] [CrossRef] [Green Version]
- Długosz, O.; Szostak, K.; Banach, M. Photocatalytic properties of zirconium oxide–zinc oxide nanoparticles synthesised using microwave irradiation. Appl. Nanosci. 2020, 10, 941–954. [Google Scholar] [CrossRef] [Green Version]
- Aghabeygi, S.; Khademi-Shamami, M. ZnO/ZrO2 nanocomposite: Sonosynthesis, characterization and its application for wastewater treatment. Ultrason. Sonochem. 2018, 41, 458–465. [Google Scholar] [CrossRef]
- Khataee, A.; Gholami, P.; Kayan, B.; Kalderis, D.; Dinpazhoh, L.; Akay, S. Synthesis of ZrO2 nanoparticles on pumice and tuff for sonocatalytic degradation of rifampin. Ultrason. Sonochem. 2018, 48, 349–361. [Google Scholar] [CrossRef]
- Precious Ayanwale, A.; Reyes-López, S.Y. ZrO2-ZnO Nanoparticles as Antibacterial Agents. ACS Omega 2019, 4, 19216–19224. [Google Scholar] [CrossRef] [Green Version]
- Midala, I.H.; Kamari, H.M.; Al-Hada, N.M.; Tim, C.K.; Muhamad, S.; Hamza, A.M.; Abubakar, T.R.; Nuhu, I.M. Structural, morphological and optical properties of (ZnO)0.2 (ZrO2)0.8 nanoparticles. Appl. Phys. A Mater. Sci. Process. 2019, 125, 668. [Google Scholar] [CrossRef]
- Haq, S.; Rehman, W.; Waseem, M.; Meynen, V.; Awan, S.U.; Saeed, S.; Iqbal, N. Fabrication of pure and moxifloxacin functionalized silver oxide nanoparticles for photocatalytic and antimicrobial activity. J. Photochem. Photobiol. B Biol. 2018, 186, 116–124. [Google Scholar] [CrossRef] [PubMed]
- Obaidullah, M.; Furusawa, T.; Siddiquey, I.A.; Bahadur, N.M.; Sato, M.; Suzuki, N. A fast and facile microwave irradiation method for the synthesis of ZnO@ZrO2 core-shell nanocomposites and the investigation of their optical properties. Adv. Powder Technol. 2018, 29, 1804–1811. [Google Scholar] [CrossRef]
- Sherly, E.D.; Vijaya, J.J.; Kennedy, L.J.; Meenakshisundaram, A.; Lavanya, M. A comparative study of the effects of CuO, NiO, ZrO2 and CeO2 coupling on the photocatalytic activity and characteristics of ZnO. Korean J. Chem. Eng. 2016, 33, 1431–1440. [Google Scholar] [CrossRef]
- Bibi, N.; Haq, S.; Rehman, W.; Waseem, M.; Rehman, M.U.; Shah, A.; Khan, B.; Rasheed, P. Low temperature fabrication of SnO2, ZnO and Zn2SnO4 nanostructures for the degradation of Rhodamine 6G: Characterization. Biointerface Res. Appl. Chem. 2020, 10, 5895–5900. [Google Scholar]
- Shah, A.; Haq, S.; Rehman, W.; Muhammad, W.; Shoukat, S.; Rehman, M. Photocatalytic and antibacterial activities of Paeonia emodi mediated silver oxide nanoparticles. Mater. Res. Express 2019, 6, 045045. [Google Scholar] [CrossRef]
- Rasheed, P.; Haq, S.; Waseem, M.; Rehman, S.U.; Rehman, W.; Bibi, N.; Shah, S.A.A. Green synthesis of vanadium oxide-zirconium oxide nanocomposite for the degradation of methyl orange and picloram. Mater. Res. Express 2020, 7. [Google Scholar] [CrossRef]
- Haq, S.; Shoukat, S.; Rehman, W.; Waseem, M.; Shah, A. Green fabrication and physicochemical investigations of zinc-cobalt oxide nanocomposite for wastewater treatment. J. Mol. Liq. 2020, 318, 114260. [Google Scholar] [CrossRef]
- Basahel, S.N.; Ali, T.T.; Mokhtar, M.; Narasimharao, K. Influence of crystal structure of nanosized ZrO2 on photocatalytic degradation of methyl orange. Nanoscale Res. Lett. 2015, 10, 73. [Google Scholar] [CrossRef] [Green Version]
- Anju, S.G.; Yesodharan, S.; Yesodharan, E.P. Zinc oxide mediated sonophotocatalytic degradation of phenol in water. Chem. Eng. J. 2012, 189–190, 84–93. [Google Scholar] [CrossRef]
- Farhan Hanafi, M.; Sapawe, N. Effect of Calcination Temperature on the Structure and Catalytic Performance of ZrO2 Catalyst in Phenol Degradation. Mater. Today Proc. 2019, 19, 1533–1536. [Google Scholar] [CrossRef]
- Movahedi, M.; Mahjoub, A.R.; Janitabar-Darzi, S. Photodegradation of Congo red in aqueous solution on ZnO as an alternative catalyst to TiO2. J. Iran. Chem. Soc. 2009, 6, 570–577. [Google Scholar] [CrossRef]
- Pouretedal, H.; Hosseini, M. Bleaching Kinetic and Mechanism Study of Congo Red Catalyzed by ZrO2 Nanoparticles Prepared by Using a Simple Precipitation Method. Acta Chim. Slov. 2010, 57, 415–423. [Google Scholar] [PubMed]
- Hassan, N.S.; Jalil, A.A.; Aziz, F.F.A.; Fauzi, A.A.; Azami, M.S.; Jusoh, N.W.C. Tailoring the Silica Amount in Stabilizing the Tetragonal Phase of Zirconia for Enhanced Photodegradation of 2-Chlorophenol. Top. Catal. 2020, 63, 1145–1156. [Google Scholar] [CrossRef]
- Zyoud, A.H.; Asaad, S.; Zyoud, S.H.; Zyoud, S.H.; Helal, M.H.; Qamhieh, N.; Hajamohideen, A.R.; Hilal, H.S. Raw clay supported ZnO nanoparticles in photodegradation of 2-chlorophenol under direct solar radiations. J. Environ. Chem. Eng. 2020, 8, 104227. [Google Scholar] [CrossRef]
- Satpal, S.B.; Athawale, A.A. Synthesis of ZnO and Nd Doped ZnO Polyscales for Removal of Rhodamine 6G Dye under UV Light Irradiation. Mater. Res. Bull. 2018, 5, 085501. [Google Scholar] [CrossRef]
- Haq, S.; Rehman, W.; Waseem, M.; Meynen, V.; Awan, S.U.; Khan, A.R.; Hussain, S.; Zain-ul-Abdin; Din, S.U.; Hafeez, M.; et al. Effect of Annealing Temperature on Structural Phase Transformations and Band Gap Reduction for Photocatalytic Activity of Mesopores TiO2 Nanocatalysts. J. Inorg. Organomet. Polym. Mater. 2021, 31, 1312–1322. [Google Scholar] [CrossRef]
- Ahmad, M.; Rehman, W.; Khan, M.M.; Qureshi, M.T.; Gul, A.; Haq, S.; Ullah, R.; Rab, A.; Menaa, F. Phytogenic fabrication of ZnO and gold decorated ZnO nanoparticles for photocatalytic degradation of Rhodamine B. J. Environ. Chem. Eng. 2021, 9, 104725. [Google Scholar] [CrossRef]
- Zada, N.; Saeed, K.; Khan, I. Decolorization of Rhodamine B dye by using multiwalled carbon nanotubes/Co–Ti oxides nanocomposite and Co–Ti oxides as photocatalysts. Appl. Water Sci. 2020, 10, 40. [Google Scholar] [CrossRef] [Green Version]
- Kaur, J.; Bansal, S.; Singhal, S. Photocatalytic degradation of methyl orange using ZnO nanopowders synthesized via thermal decomposition of oxalate precursor method. Phys. B Condens. Matter 2013, 416, 33–38. [Google Scholar] [CrossRef]

| Dye | ZnO | ZrO2 | ZnO-ZrO2 | References | |||
|---|---|---|---|---|---|---|---|
| % Degradation | Time (min) | % Degradation | Time (min) | % Degradation | Time (min) | ||
| Methyl orange | 99.55 | 80 | 99 | 110 | No literature found | [28,29] | |
| Phenol | 74 | 120 | 78 | 320 | 89 | 120 | [15,30] |
| Congo red | 30 | 11 | 98 | 125 | 90 | 120 | [31,32] |
| Methylene blue | 87 | 90 | 11 | 70 | 97 | 30 | [15] |
| 2-Chlorophenol | 61 | 60 | 51 | 240 | No literature found | [33,34] | |
| Rhodamine 6G | 55.51 | 180 | No literature found | 98.94 | 330 | [35] and present study | |
Publisher’s Note: MDPI stays neutral with regard to jurisdictional claims in published maps and institutional affiliations. |
© 2021 by the authors. Licensee MDPI, Basel, Switzerland. This article is an open access article distributed under the terms and conditions of the Creative Commons Attribution (CC BY) license (https://creativecommons.org/licenses/by/4.0/).
Share and Cite
Haq, S.; Afsar, H.; Din, I.U.; Ahmad, P.; Khandaker, M.U.; Osman, H.; Alamri, S.; Shahzad, M.I.; Shahzad, N.; Rehman, W.; et al. Enhanced Photocatalytic Activity of Ficus elastica Mediated Zinc Oxide-Zirconium Dioxide Nanocatalyst at Elevated Calcination Temperature: Physicochemical Study. Catalysts 2021, 11, 1481. https://doi.org/10.3390/catal11121481
Haq S, Afsar H, Din IU, Ahmad P, Khandaker MU, Osman H, Alamri S, Shahzad MI, Shahzad N, Rehman W, et al. Enhanced Photocatalytic Activity of Ficus elastica Mediated Zinc Oxide-Zirconium Dioxide Nanocatalyst at Elevated Calcination Temperature: Physicochemical Study. Catalysts. 2021; 11(12):1481. https://doi.org/10.3390/catal11121481
Chicago/Turabian StyleHaq, Sirajul, Humma Afsar, Israf Ud Din, Pervaiz Ahmad, Mayeen Uddin Khandaker, Hamid Osman, Sultan Alamri, Muhammad Imran Shahzad, Nadia Shahzad, Wajid Rehman, and et al. 2021. "Enhanced Photocatalytic Activity of Ficus elastica Mediated Zinc Oxide-Zirconium Dioxide Nanocatalyst at Elevated Calcination Temperature: Physicochemical Study" Catalysts 11, no. 12: 1481. https://doi.org/10.3390/catal11121481
APA StyleHaq, S., Afsar, H., Din, I. U., Ahmad, P., Khandaker, M. U., Osman, H., Alamri, S., Shahzad, M. I., Shahzad, N., Rehman, W., & Waseem, M. (2021). Enhanced Photocatalytic Activity of Ficus elastica Mediated Zinc Oxide-Zirconium Dioxide Nanocatalyst at Elevated Calcination Temperature: Physicochemical Study. Catalysts, 11(12), 1481. https://doi.org/10.3390/catal11121481