Article

The Photocatalytic Degradation of 2,3,7,8-Tetrachlorodibenzo-p-Dioxin in the Presence of Silver–Titanium Based Catalysts

Department of Biology, Chemistry and Environmental Sciences, American University of Sharjah, P.O.Box 26666 Sharjah, UAE
*
Authors to whom correspondence should be addressed.
Catalysts 2020, 10(9), 957; https://doi.org/10.3390/catal10090957
Submission received: 19 July 2020 / Revised: 7 August 2020 / Accepted: 9 August 2020 / Published: 21 August 2020
(This article belongs to the Special Issue Catalytic Materials for Application in Water Purification)

Abstract

:
Polychlorinated dibenzo-p-dioxins (PCDD) are persistent toxic compounds that are ubiquitous in the environment. The photodegradation of 2,3,7,8-tetrachlorodibenzo-p-dioxin (TCDD) in the presence of silver titanium oxide (AgTi) and silver titanium doped into the Y-zeolite (AgTiY) was tested using high (254 nm) and mid (302 nm) energy UV irradiation sources. AgTi and AgTiY, both showed success in the photodegradation of 2,3,7,8-TCDD dissolved in methanol/tetrahydrofuran solution. Both catalysts were found to effectively decompose TCDD at 302 nm (lower energy) reaching in between 98–99% degradation after five hours, but AgTiY showed better performance than AgTi at 60 min reaching 91% removal. Byproducts of degradation were evaluated using Gas chromatography/mass spectrometry (GC–MS), resulting in 2,3,7-trichlorodibenzo-p-dioxin, a lower chlorinated congener and less toxic, as the main degradation product. Enzyme Linked Immunosorbent Assay (ELISA) was used to evaluate the relative toxicity of the degradation byproducts were a decrease in optical density indicated that some products of degradation could be potentially more toxic than the parent TCDD. On the other hand, a decrease in toxicity was observed for the samples with the highest 2,3,7,8-TCDD degradation, confirming that AgTiY irradiated at 302 nm is an excellent choice for degrading TCDD. This is the first study to report on the efficiency of silver titanium doped zeolites for the removal of toxic organic contaminants such as dioxins and furans from aquatic ecosystems.

Graphical Abstract

1. Introduction

Polychlorinated dibenzo-p-dioxins (PCDDs) and dibenzofurans (PCDFs) are persistent organic pollutants (POPs). POPs are introduced heavily in wastewater discharges, which as a result, depletes the oxygen and leads to fish suffocation, excessive algal growth and negatively affecting aquatic organisms [1]. PCDDs/Fs are released in the environment as unintentional byproducts of combustion and industrial processes such as waste incineration and bioaccumulate through the food chain [2]. In addition, natural disasters and certain processes such as volcanic eruptions, forest fires, and photolytic reactions of natural substrates can release PCDD/Fs into the environment [2]. This group of compounds are present in trace amounts in the environment and are of concern due to their toxicity and carcinogenicity [3]. There is a total of 210 possible congeners of PCDDs/Fs, from which seventeen are toxic, with 2,3,7,8-tetrachlorodibenzo-p-dioxin (2,3,7,8-TCDD) being the most toxic [3,4]. The 2,3,7,8-TCDD, shown in Figure 1, tends to accumulate in body tissues and organs of living organisms [5]. The main route of entry to living organisms is through dietary intake from drinking water and consuming dairy products and seafood. In addition, it is found in soil, dust and air [5,6].
The harmful and toxic effects of 2,3,7,8-TCDD not only on aquatic life and marine environment, but also on humans, have been widely documented. Fiorito et al. [5] stated that even low dose exposure to 2,3,7,8-TCDD can result in immune system suppression in humans and act as a risk factor for developing viral diseases [5]. Moreover, studies on dioxins confirm that exposure to 2,3,7,8-TCDD in particular suppresses the immune system of animals [6], causes chloracne, changes the liver enzymes levels, causes endocrine system disruptions and immune system disorders in humans [7]. In addition, 2,3,7,8-TCDD is classified as a group 1 carcinogen based on limited evidence in humans as identified by the WHO’s International Agency for Research on Cancer (IARC) in 1997 [6,7,8].
Due to their persistent and bioaccumulative nature and in response to this global dilemma, the Stockholm Convention, which was adopted in 2001, required all parties to eliminate and/or reduce the release of POPs into the environment [9]. Hence, several methods have been proposed and studied in the literature to develop an efficient approach for the elimination and destruction of PCDD/Fs focusing in particular on 2,3,7,8-TCDD. Previous studies have successfully decomposed or removed 2,3,7,8-TCDD by applying techniques such as photocatalysis [10,11,12], photolysis [13,14], Fenton based oxidation [2] and sonolysis [2].
Several studies have discussed the applicability and efficiency of the photodecomposition process of 2,3,7,8-TCDD with the aid of catalytic activity using several catalysts while varying radiation conditions for the optimal decomposition of 2,3,7,8-TCDD [10,12]. We have previously discussed the possibility of photodecomposition of 2,3,7,8-TCDD using UV radiation at 302 nm and 254 nm with the presence and absence of the photocatalyst silver doped zeolite. Results of the study showed that in the presence of the photocatalyst decomposed 86% of the 2,3,7,8-TCDD, whereas in the absence of the photocatalyst decomposed only 28% of the 2,3,7,8-TCDD under UV radiation at 254 nm after six hours, suggesting enhanced photodecomposition with the use of photocatalysts [10]. Intensive studies were also conducted to synthesize an efficient photocatalyst for the photodecomposition of persistent organic pollutants that achieves an increased reaction rate as well as a maximum photodecomposition of the pollutant [15]. The photodecomposition of propyzamide using several photocatalysts such as naked titanium dioxide (TiO2), TiO2 with three different adsorbent support materials namely zeolite (mordenite), silica and activated carbon have previously been reported. The study by Torimoto et al. [15] reported that the use of adsorbents supports eliminated unwanted degradation intermediates from accumulation and allows for the collection of the toxic target substance from the solution. Hence, the use of adsorbent supports such as zeolites doped with TiO2 is recommended to enhance the rate of photodecomposition and the reduction of intermediates. Other studies discussed the use of TiO2-modified by silver nanoparticles to achieve photocatalytic activity—revealing that the silver nanoparticles may trigger an increase in photocatalysis when compared to the use of titanium dioxide alone [16]. Albiter et al. [17] studied the synthesis and photocatalytic decomposition activity of Ag/TiO2 compared with unmodified TiO2 and found out that TiO2 modified with Ag achieved higher photocatalytic activity as compared with the use of unmodified TiO2. Moreover, Blanco et al. [18] focused on the synthesis of polyamide 6 nanofiber membranes modified with TiO2 nanoparticles for photocatalytic water treatment. The experimental results showed a 70% decomposition of an organic pollutant in the presence of the photocatalyst irradiated under UV light after 240 min, suggesting efficient photocatalytic activity of the catalyst [18].
The aim of this study was to evaluate the degradation of 2,3,7,8-TCDD dissolved in methanol/tetrahydrofuran (THF) solution in the presence of two synthesized silver–titanium-oxides and silver–titanium zeolites catalysts using two sources of UV irradiation at 254 and 302 nm. Gas chromatography–mass spectrometry (GC–MS) was used for the identification of the degradation byproducts, and enzyme linked immunosorbent assay (ELISA) was used for the evaluation of the relative toxicity of the degradation byproducts. To our knowledge, this is the first study to introduce the use of silver titanium and silver titanium doped zeolites for the removal of 2,3,7,8-TCDD.

2. Results and Discussion

2.1. Characterization of Silver Titanium Oxide Samples (AgTi and AgTiY)

AgTi catalysts were synthesized in this study and analyzed using scanning electron microscopy coupled with energy dispersive x-ray spectroscopy (SEM/EDS) for their surface and elemental composition (as shown in Figure 2). Figure 2 shows the image of the surface of the AgTi sample (a) and its respective elemental composition (c). As shown 2a, AgTi has a crystalline morphology with a variation in the distribution of silver on TiO2. Additionally, it is evident that silver deposits, which are aggregates of tiny crystals with regular spherical-shapes cover the surface of TiO2 particles. The EDS analysis of AgTi (Figure 2c) shows pure Ti mixed silver oxide composites with average composition of 64.2% of silver (Ag), 12.4% of titanium (Ti) and 23.4% resulting in a cluster with Ti3Ag7O17 composite. On the other hand, the AgTiY catalyst (Figure 2b) shows a porous morphology with average composition (Figure 2d) of 29.9% Ag, 19.2% Ti and 44.6% O, in addition to the presence of Si and Al which are associated with the zeolite framework.
BET surface area measurements using Quantachrome autosorb iQ, USA for both AgTi and AgTiY, were reported to be 26.2 m2/g and below 10 m2/g, respectively. The pore size distribution curve (Figure 2e) indicates a supermicropore with pore diameter of 8–9 Å with a slight micropore distribution observed for both samples.
The XPS spectrum shows the characteristic high purity peaks obtained for silver, oxygen and titanium (Figure 3). The Ag 3d peaks appears at 371.45 and 365.25 eV (3d3/2 and 3d5/2, respectively). In addition, the 2p-Ti peaks are observed at 462.21 and 455.7 eV (2p1/2 and 2p3/2, respectively) while the major O1s peaks are observed at 528.15 and 530.73 eV. The reported binding energy values corresponding to 3d level Ag at different oxidation states (Ago, Ag2O and AgO) are very similar to those reported in previous studies for 3d5/2 obtained within: 368.0–368.3 eV, 367.6–367.8 eV and 367.3–367.4 eV, respectively [19,20]. The binding energy observed for the 3d5/2 in AgTi was observed at 365.25 eV, which is lower than the analog normal modes reported for metallic silver or silver oxides. The Ag 3d5/2 spectrum reveals that the peak maximum occurs at 365.25 eV and it is assigned to Ag (III). This peak is associated with the presence of environments that are not due to the nonmetallic form and the normal silver oxygen linkage. These results agree with the observed bands reported in previous studies for Ag (III) oxide [21].
Concurrent with the new spectral features in the Ag 3d peaks, a second lattice oxygen peak appears in the O 1s spectrum (Figure 3) at 528.15 eV [21]. Typically, silver oxides consist of only one oxygen lattice position, but in this study a substantial contribution from a peak centered at 528.15 eV indicates that the oxide is a mixed-phase material. In contrast, the 2p3/2 titanium peak appears at 455.71 eV corresponding to the Ti (II) oxide peak that appears at 455.5 eV [22]. Moreover, the binding energy differs from the energy reported for the 2p3/2 peak of the different titanium forms including: Ti (0), Ti (III) oxide or Ti (IV) oxide which appear at 453.9, 457.3 and 458.7 eV, respectively. The splitting between the two 2p peaks is measured at 6.5 eV which is different than the values reported for Ti (0) (6.05 eV) and Ti (IV) (5.72 eV), providing evidence of the availability of a variety of environments in addition to the sole Ti–O bond linkage. Finally, the O1s binding energy in the AgTi sample (Figure 3) provides two unified signals at 528.15 and 530.73 eV, which is typical for the oxygen binding to Ti or silver ions environment. For instance, the O1s peak appears at 530.73 eV for O2− bulk of Ti (II) oxide while the 528.15 eV peak is assigned to the Ag (III) oxide as supported by previously reported results [21].

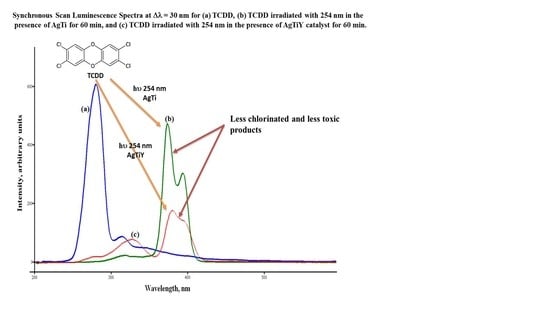
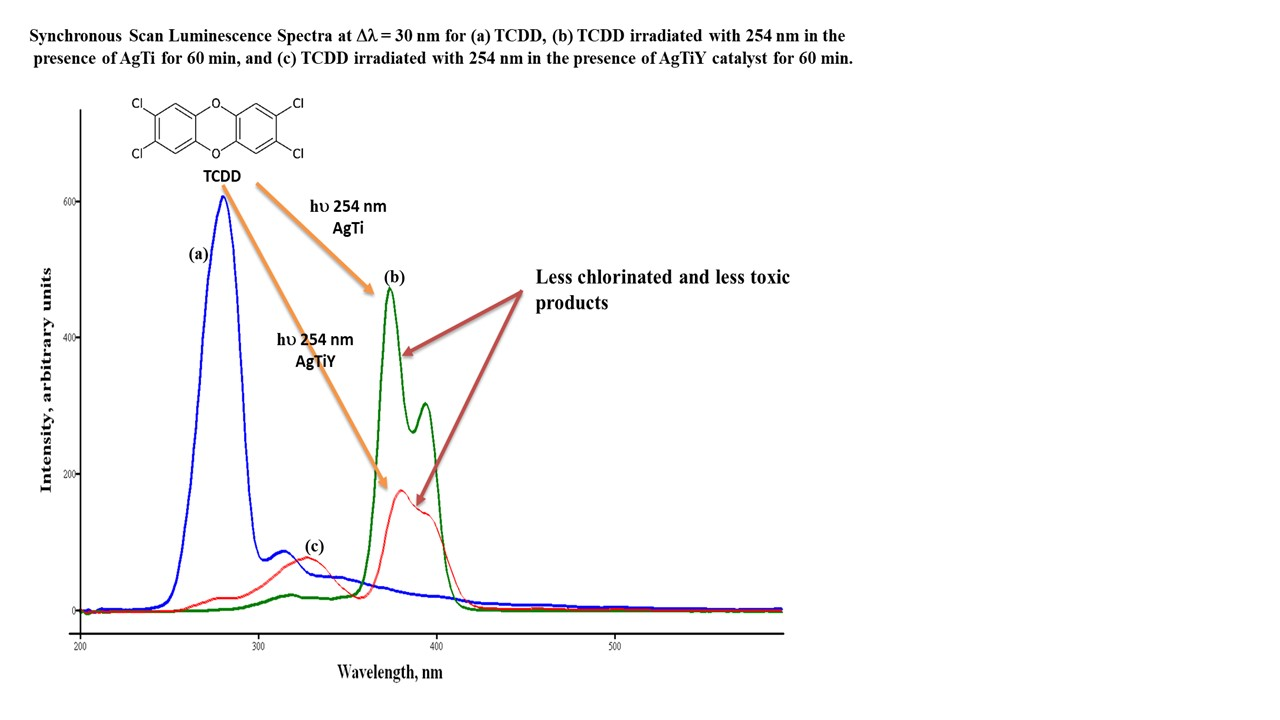
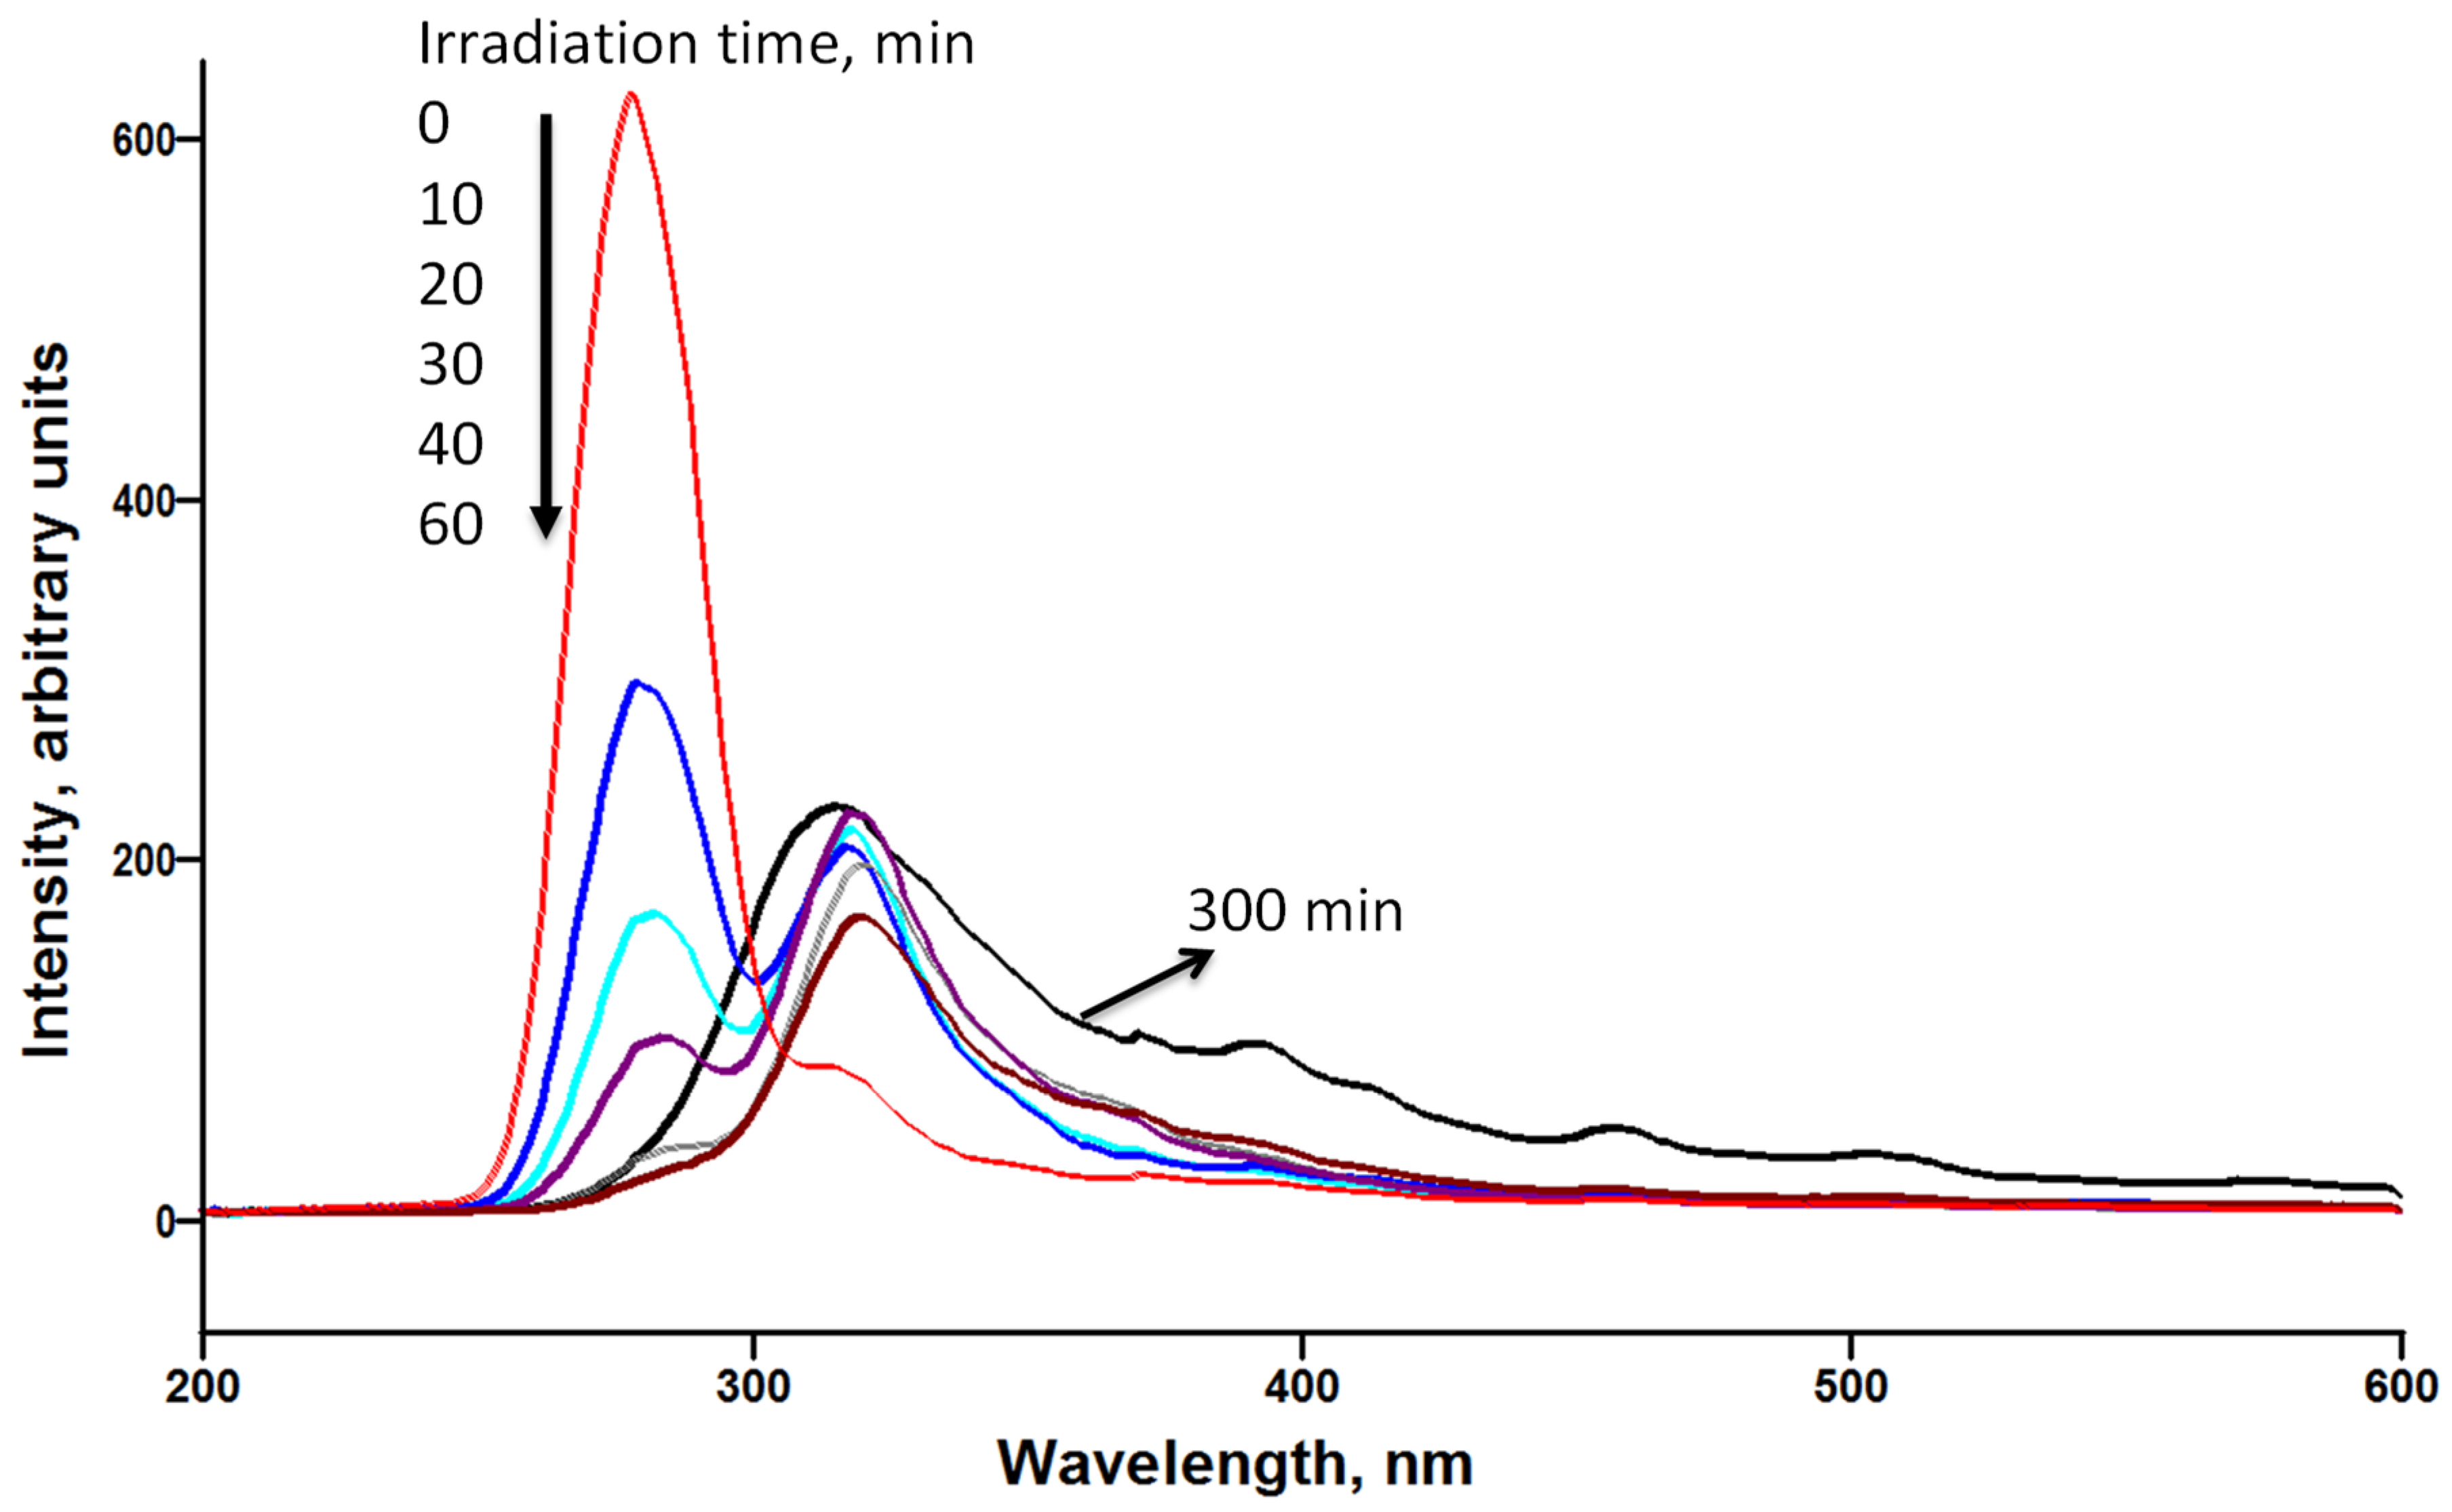
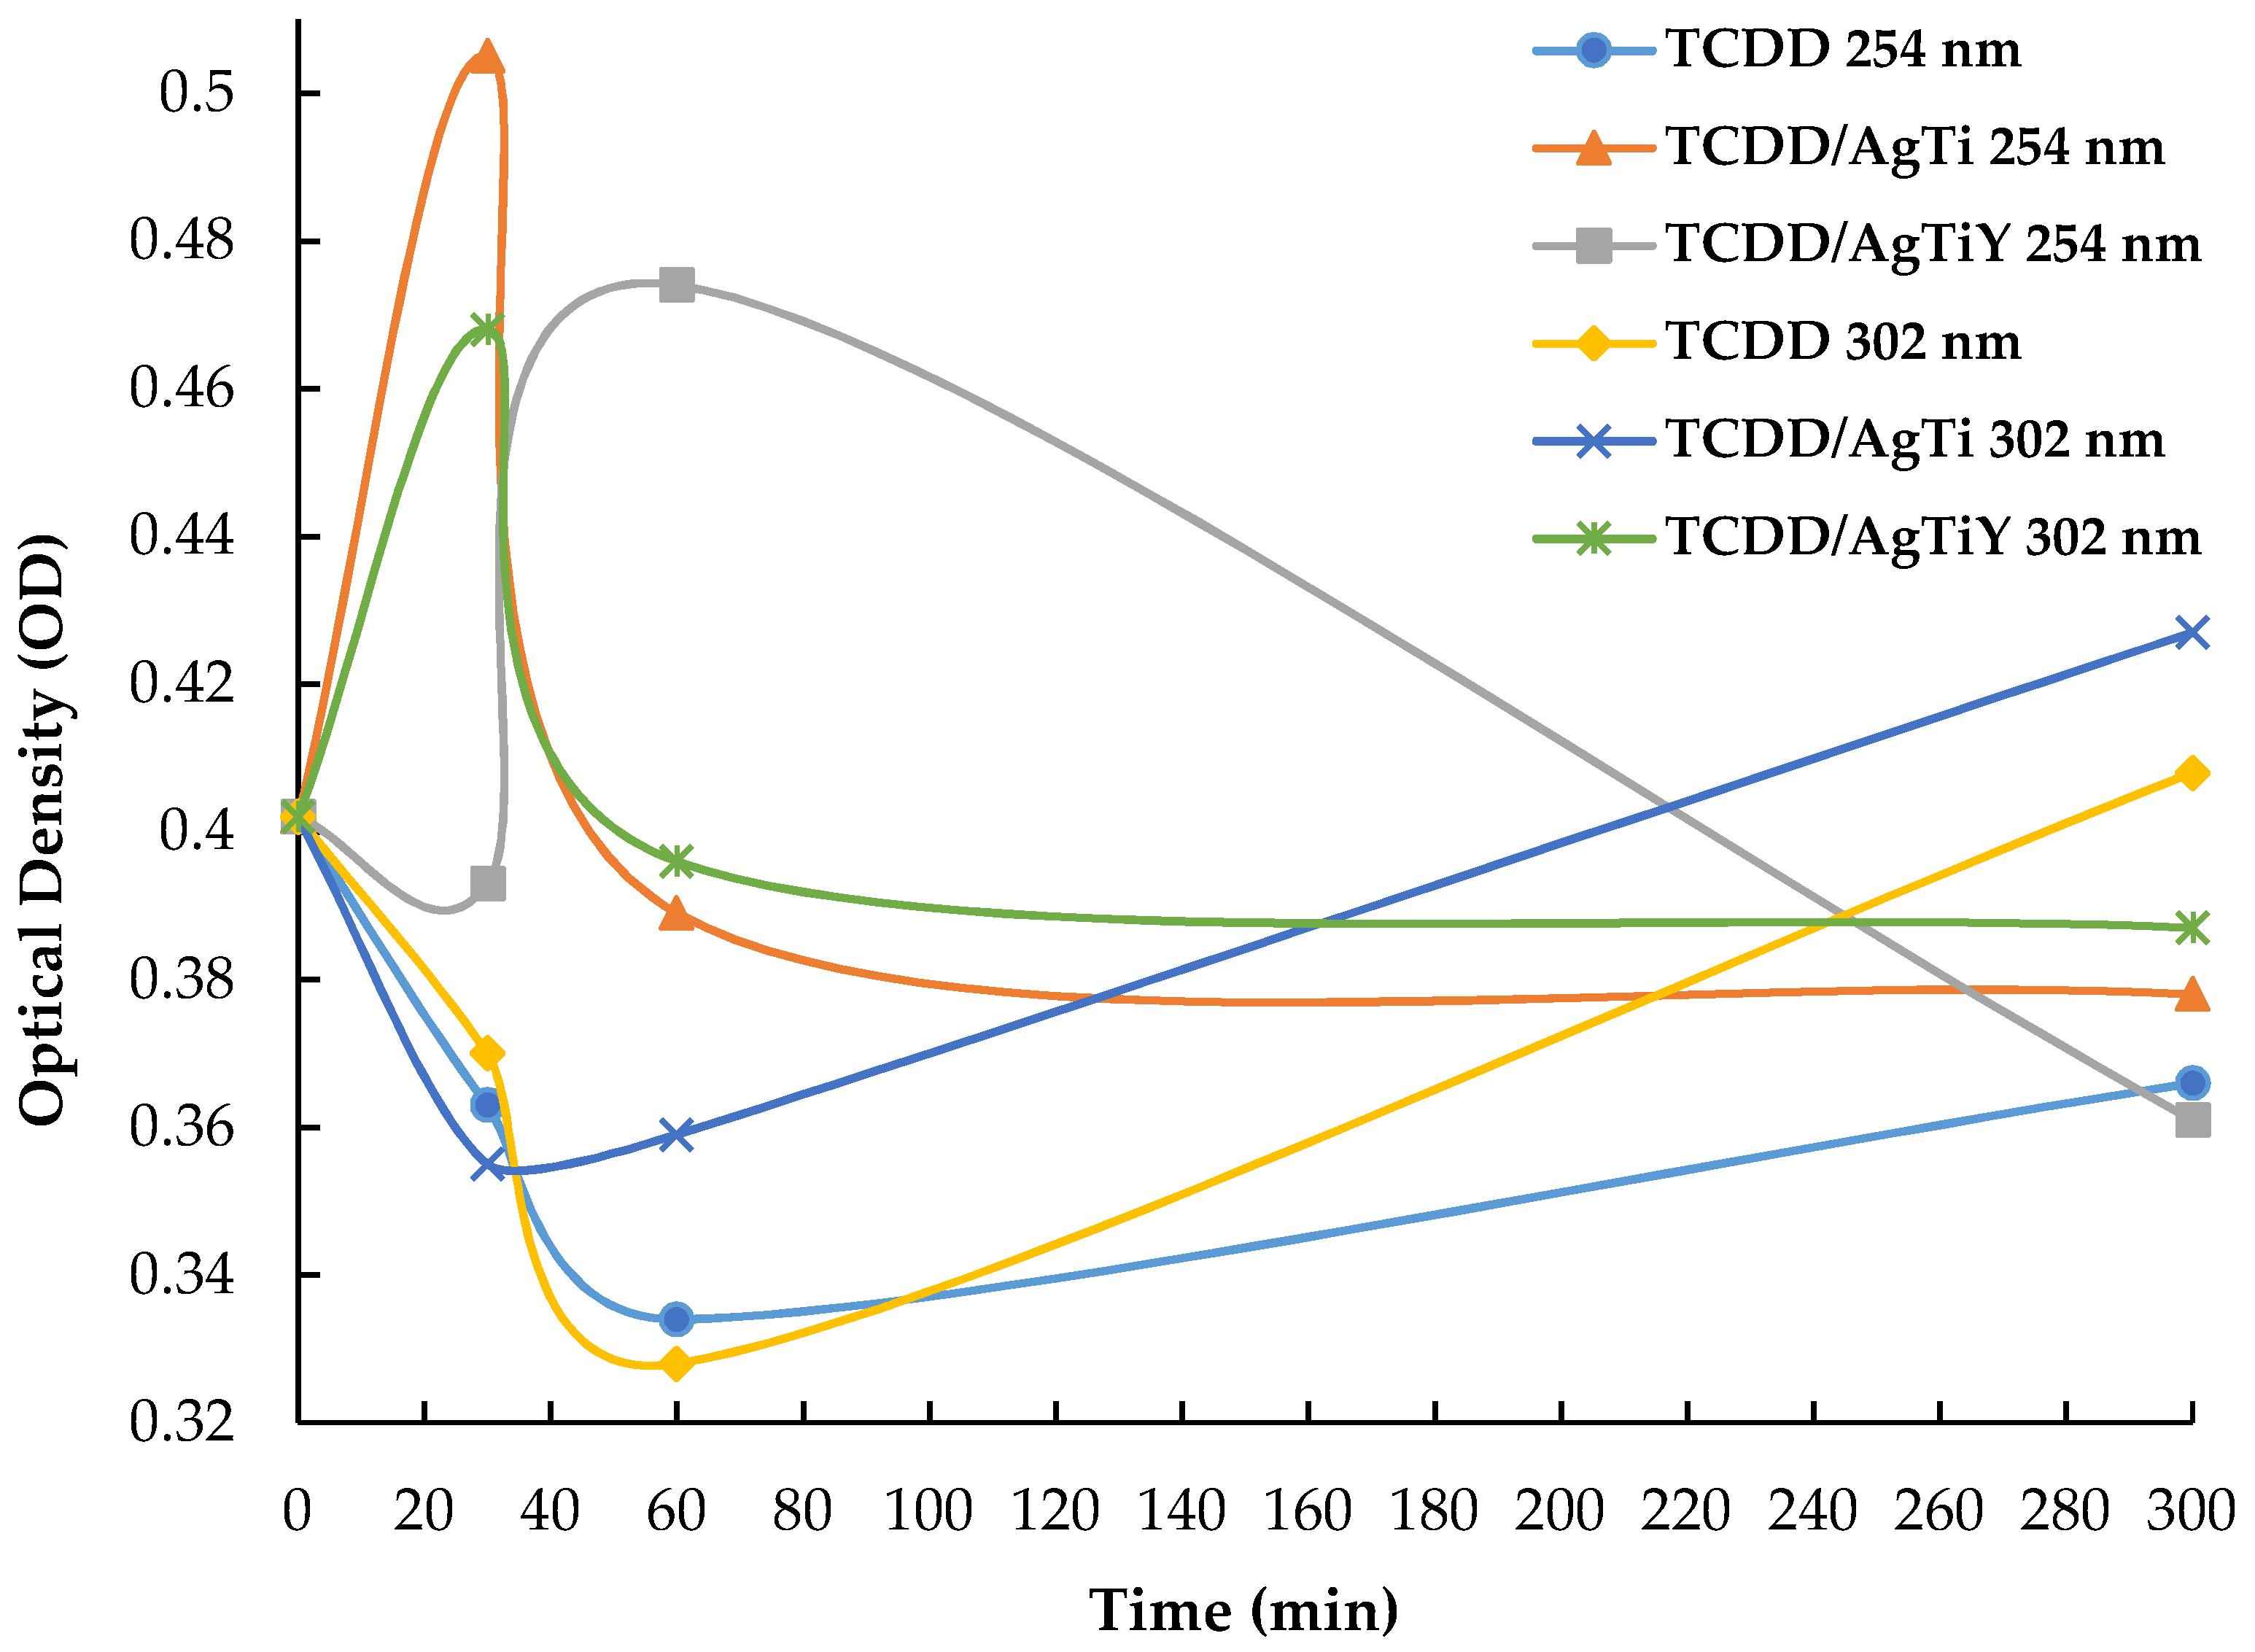
2.2. Photodegradation Experiments

The photodegradation of 2,3,7,8-TCDD was studied in the presence and absence of two catalysts including silver titanium (AgTi) and silver titanium zeolite (AgTiY). The irradiation of the compound was performed using a UV lamp at mid- and high energy: 302 and 254 nm, respectively. The selection of the above UV light sources is associated with the observed maximum absorption bands associated with TCDD that occur within the 250–320-nm range as described below. The photodecomposition of 10-ppm 2,3,7,8-TCDD was monitored using both, a Varian Cary Eclipse fluorescence spectrometer and a Cary 50 UV-visible spectrometer.
Synchronous scan luminescence spectra (SSLS) of the 10-ppm 2,3,7,8-TCDD were recorded by scanning the wavelength of both excitation and emission of the monochromators simultaneously with a constant wavelength difference ∆λ = 30 in Figure 4 shows the SSLS of the TCDD solution recorded at ∆λ = 30 nm before and after being irradiated with 254 nm (Figure 4a) and 302 nm (Figure 4b) for various periods of time. The original TCDD exhibits a strong SSL band at 285 nm, which slowly declines with the irradiation time. The drop in the emission intensity associated with TCDD results in the appearance of a new band at 320 nm, where the intensity experienced a gradual enhancement. In general, irradiation of 2,3,7,8-TCDD at 254 nm and 302 nm shows that the intensity of the peak decreases as irradiation time increases from 0 min to 300 min. At 254 nm (Figure 4a), a slow rate decrease is observed from 0–20 min, followed by a large decrease in intensity from 20–40 min, hence, alluding to the degradation of the 2,3,7,8 TCDD. After 60 min of the irradiation, a new intense band appears that is associated with the disappearance of the original TCDD peak and the formation of new products. Finally, an increase in band intensity is observed from 60 to 300 min possibly due to the formation of a new product with strong intensity.
On the other hand, when 2,3,7,8-TCDD was irradiated at 302 nm (Figure 4b), a high rate of decrease in the intensity of the peak appearing at 285 nm is observed in the time interval 0–10 min. In addition, the appearance of the new band at 320 nm happens right after 10 min. This new band was enhanced with the increase in irradiation time. The close proximity of the bands observed from 40–60 min in the SSLS shows that the increase in absorbance happens at a slow rate. However, when TCDD was irradiated at 302 nm (Figure 4b), the rate of increase of the intensity was higher than that observed for irradiated samples with the 254-nm UV source (Figure 4a).
The photodegradation process was also monitored with UV-vis absorption spectroscopy. The results recorded for the initial and irradiated TCDD samples shows a similar behavior as that observed using SSLS. Figure 5 shows the UV-vis absorption spectra recorded for TCDD before and after the irradiation with 254-nm UV light, where the absorption of the TCDD declines upon irradiation for 20 and 40 min. An absorption maximum at 320 nm was observed after 60 min exposure. The absorption at 320 nm declines upon irradiation for 300 min, where a new band appears at 310 nm. This trend is very clear in the data presented in Figure 4a. Given the broad features observed in the UV spectrum compared to the well-defined and sharp SSLS bands illustrated in Figure 4, we rely on the SSLS in our further analysis.
Irradiation of the TCCD samples over several periods of time in the presence of mixed silver–titanium oxide (labeled as AgTi) as catalyst, was also studied. The SSLS of TCDD/AgTi samples irradiated with 254 nm (Figure 6a) and 302 nm (Figure 6b) UV lights indicate variations in the degradation protocol with similar products appearing after 300 min of irradiation. After 300 min, all samples showed the appearance of the same SSLS band. The results obtained for the irradiated samples of TCDD in the presence of AgTi catalyst are illustrated in Figure 6, where a very strong band appears between 375–400 nm.
Upon mixing 2,3,7,8-TCDD with the AgTi catalyst, the TCDD emission band is shifted from 285 nm to appear at 375 nm. The 375-nm band intensity was directly enhanced upon initial irradiation but declined as irradiation time increased. The shift is very large to be associated with simple ligand metal or metal ligand charge transfer processes. Instead, it is a clear indication of the excimer formation upon exciting the TCDD molecule in the presence of the AgTi surface. The excited state bonding between adjacent units (called an Excimer) is well known for planar conjugated molecules like anthracene as well as the metal–metal excimers in the case of silver clusters [23,24,25,26,27,28,29,30,31]. The adsorbed TCDD on the surface provides a suitable orientation for two adjacent TCDD units to establish electron transfer from a TCDD π-electrons to the excited conjugated π-π* bond in another molecule which leads to the dimer (excimer formation). This excimer has a longer chain of conjugation that leads to the observed red shift which appears at 375–400 nm (3.3–3.1 eV) instead of the monomer that showed an emission at higher energy (4.35 eV).
When irradiated in the presence of AgTi at 254 nm (Figure 6a), some of the TCDD was absorbed on the catalyst surface leading to the formation of a new product with low intensity. An increase in intensity was observed at 20 min, followed by a decline in intensity from 20 to 60 min, representative of degradation. At 300 min, a decline in intensity was observed and a new band appears at 310 nm indicating the formation of a new degradation product as a final stable molecule under the experimental conditions. On the other hand, when 2,3,7,8-TCDD was mixed with AgTi at 302 nm (Figure 6b), the intensity of the mixed 2,3,7,8-TCDD/AgTi was much lower than the intensity of the TCDD alone in comparison to the irradiation at 254 nm. As a result, a great decrease in intensity at 10 min with a red shift due to the excimer formation is observed. Due to the strong intensity of the low energy excimer bands, irradiations in the presence of the catalyst with the 254-nm experiments (Figure 6a) were monitored by adjusting the emission slit 10 nm instead of 20 nm that was used for other experiments. In addition, two isosbestic points were observed when 2,3,7,8-TCDD/AgTi was irradiated at 302 nm, one at 290 nm and another at 340 nm, pertaining to the formation of two different products. After 300 min of irradiation, the intensity of the band increases, showing an increase in the concentration of the formed products. Irradiation at 302 nm shows lower intensity than that at 254 nm, meaning that the TCDD has a higher degradation on the AgTi surface.
To get a better understanding of the degradation process and the appearance of the emission modes between 350–400 nm that takes place in the presence of the catalyst, we conducted the same experiments in the presence of the same AgTi synthesis protocol but encapsulated in porous materials like zeolite. The Ag–Ti mixed oxides were incorporated into zeolite Y (AgTiY). Figure 7 shows the SSLS of the TCDD irradiated with 302-nm UV light in the presence of AgTiY sample. As presented in Figure 7, the photodegradation of TCDD in the presence of the AgTiY sample is similar to the protocol recorded for TCDD without a catalyst (Figure 4), indicating that the AgTi surface plays a significant role in the degradation mechanism and that adsorption is not the only pathway in the process. The AgTi doped into a porous host like zeolite Y, allows the metals to be encapsulated into the pore as well as into the surface as supported by BET surface area measurements. The presence of the porous composite limits the excimer formation which is confirmed by the disappearance of the 375–400-nm emission peaks in Figure 6. The results of the SSLS for 2,3,7,8-TCDD with AgTiY irradiated at 302 nm at various times shows that initially, the intensity of the mixture 2,3,7,8-TCDD/AgTiY is very high, followed by a big drop in intensity at 10 min where most TCDD was adsorbed at the surface. Additionally, a new peak forms at 310 nm showing the presence of a new product as determined by GC–MS analysis. The intensities of the 285-nm peak decreases with time. This reduction in the emission intensity is associated with a gradual increase in the 320-nm band intensity that becomes dominant after 300 min where the product becomes dominant in the final solution.

2.3. Evaluation of the Efficiency of Degradation

2.3.1. Degradation Assessment Using GC–MS

The degradation percentage of 2,3,7,8-TCDD irradiated at 254 nm and 302 nm, in the absence and presence of catalysts was examined using Gas chromatography/mass spectrometry (GC–MS). Figure 8, shows the degradation of 2,3,7,8-TCDD irradiated at 254 and 302 nm, without catalyst, in the presence of AgTi and in the presence of AgTiY from 0 to 300 min. As shown in Figure 8, after 300 min, irradiation at 302 nm (with and without the catalysts) gave the best photodecomposition ranging from 97–99%. The highest photodegradation of TCDD was observed when irradiated at 302 nm, in the presence of AgTiY reaching 53% in 30 min and 91% in 60 min, followed by irradiation at 302-nm without the catalysts (46% at 30 min and 77% at 60 min) and irradiation at 302 nm in the presence of AgTi, reaching 63% at 60 min. After 300 min, irradiation at 302 nm (with and without the catalysts) gave the best photodecomposition ranging from 97–99%. On the other hand, irradiation at 254 nm only reached between 31% to 47% degradation at 60 min, with and without the catalyst, and it only improved at 300 min in the presence of AgTi, to a maximum of 91%.
Furthermore, GC–MS was used to identify the degradation products obtained for the different irradiation conditions of 2,3,7,8-TCDD and results are summarized in Table 1. GC–MS showed that 2,3,7,8-TCDD degraded to lower and less toxic chlorinated congeners which included: 2,3,7-trichlorodibenzo-p-dioxin (2,3,7-triCDD) and followed by 2,7-dichlorodibenzo-p-dioxin (2,7-DCDD). Additionally, several degradation products were observed mostly during irradiation in the presence of catalysts including: (2,3-diphenylcyclopropyl) methyl phenyl sulfoxide and 2,6-Di-T-butyl-4-methylene-2,5-cyclohexadien-1, which are low to no toxicity. The only degradation products which may be slightly toxic were: methyl-2-ethyhexyl phthalate, which was observed when TCDD/AgTi was exposed at 254 nm for 300 min and 1-heptadecence when TCDD/AgTi exposed at 302 nm for 30 and 60 min. A slightly toxic compound, 4-hydroxy-3,5-ditertbutylbenzaldehyde, was detected when TCDD/AgTiY exposed at 302 nm for 30 min.

2.3.2. Degradation Assessment Relative to Other Studies

Several studies have reported on the efficiency of degradation of PCDDs/Fs at different conditions [2]. Previously, we reported that in the presence of a silver doped zeolite (AgY) catalyst irradiated at 254 nm for 6 h, 2,3,7,8-TCDD achieved 86% degradation [10]. In addition, other studies have shown the possibility of degrading TCDD using TiO2 irradiated at 300–400 nm, reporting degradation of 70% after 24 h [32], 85% for 15 h [33] and 99% in 4 h [34]. The present study revealed that TCDD/AgTiY irradiated at 302 nm achieved 91% degradation after 60 min and 98% after 5 h, indicating the potential use of both irradiation at 302 nm and silver titanium zeolites for the environmental removal of TCDD. Moreover—as shown in Figure 8—great degradation of TCDD can be achieved at 60 min in the presence of AgTiY catalyst.

2.4. Toxicity Comparison of the Degraded Sample Using ELISA

In order to evaluate the variation in toxicity that results from the degradation products, the degradation of TCDD at 254 and 302 nm in presence of AgTi and AgTiY was further explored using Enzyme Linked Immunosorbent Assay (ELISA). ELISA operates on the basis of competitive enzyme immunoassay, which corresponds to the competitive inhibition of a polyclonal antibody that is specific to 2,3,7,8 tetrachlorodibenzo-p-dioxin. In this assay the binding of the antibody is affected by the concentration and cross-reactivity of the analyte, in this case 2,3,7,8-TCDD. The cross-reactivity of other analytes to bind to the antibody decreases as structural similarity to 2,3,7,8-TCDD decreases. ELISA specificity is stronger for PCDDs/Fs with 3–6 chlorines, with the highest cross-reactivity towards 2,3,7,8-Cl-substituted congeners [35]. The experiments conducted in this study are summarized in the methodology section. For this experiment, ELISA results are expressed in optical density (OD), and all solutions are compared to the 2,3,7,8-TCDD. The changes in ELISA response of the irradiated samples with or without catalyst at 30, 60 and 300 min were compared to the response of 2,3,7,8-TCDD alone. Figure 9 shows a plot of the results obtained after each irradiation experiment presented in optical density plotted against time. To understand the observed behavior, it was assumed that a decrease in OD suggests an increase in toxicity of the sample (or in similarity to the parent 2,3,7,8-TCDD). When AgTi (irradiated at 254 nm) and AgTiY (irradiated at 302 nm) for 30 min an increase in OD was observed due to the decrease in concentration of 2,3,7,8-TCDD. On the other hand, the rest of the samples irradiated for 30 min showed an increased in OD which corresponds to the availability of undegraded TCDD in the sample. At 60 min, both mixtures decreased in OD alluding to the presence of leftover TCDD, but also to the formation of lower chlorinated forms of dioxin as shown in Table 1. Additionally, the results of the ELISA analysis concludes that at 300 min irradiation, only AgTi at 302 nm increases slightly in OD, confirming the results of Table 1, that shows that at 300 min AgTi at 302 nm, is the only sample that does not contain any lower chlorinated dioxin as a degradation product, specifically 2,3,7-trichlorodibenzo-p-dioxin (2,3,7-triCDD).
Additionally, for comparison purposes, the percentage change of the sample was calculated by subtracting the OD obtained initially to the OD after irradiation with or without the catalyst to estimate the change in toxicity of the sample prior and after irradiation at 0, 30, 60 and 300 min. A negative percentage indicates a decrease in toxicity, while a positive percentage indicates an increase in toxicity. The results show that when TCDD was irradiated with AgTi at 302 nm, the percent change ranged from 4.7% at 30 min to −2.5% after 300 min, indicating a decrease in toxicity due to the photodecomposition of TCDD. When TCDD was irradiated with AgTiY at 302 nm, at 30 min a decrease in toxicity was observed followed by a slight increase at 60 min, −6.6% to 0.6%, respectively, possibly due to the formation of byproducts which can slightly cross-react with the ELISA [36]. Irradiation at 254 nm, with and without the catalyst AgTi and AgTiY, showed an increase in toxicity after 300 min, due to the incomplete decomposition of 2,3,7,8-TCDD.

3. Materials and Methods

3.1. Reagents and Solvents

A 10-ppm standard solution of 2,3,7,8-tetrachlorodibenzo-p-dioxin (2,3,7,8-TCDD) was prepared in 1:1 methanol/tetrahydrofuran. Solutions were prepared under methanol/tetrahydrofuran solvents, in order to ensure that the solution is suitable for all instrumentation used in these experiments. As both solvents are miscible in water we expect the same behavior to occur in aquatic conditions. The standard 2,3,7,8-TCDD was purchased from Accustandard (New Haven, CT, USA). All solvents were HPLC grade and obtained from Sigma-Aldrich Chemical Company (St. Louis, MO, United States).

3.2. Silver Titanium and Silver Titanium-Zeolite Preparation and Characterization

The silver titanium zeolite was prepared by mixing 40 mL of 3.0-M AgNO3 in ammonia with 2 mL acetaldehyde and 1.0 g of zeolite Y. Followed by the addition of 1 mL of TiCl4-with continuous stirring. The solution was stirred for 24 h at 75 °C and then annealed at 300 °C for 3 h. The silver titanium was prepared by mixing 40 mL of 3.0-M AgNO3 in ammonia with 2-mL acetaldehyde in span 60 surfactant. The solution was stirred and 1 mL of TiCl4 was added. The final solution was stirred for 48 h then annealed at 500 °C for 3 h. The material was characterized by scanning electron microscopy coupled with energy dispersive X-ray spectroscopy (SEM/EDS). A small amount of the dried sample was mounted onto a carbon tape and placed inside the SEM column for SEM/EDS analysis. The high energy electron beam was focused on multiple areas on the sample surface to generate X-ray to ensure representative EDS analysis of the whole surface. Surface morphologies were analyzed by scanning electron microscope (Tescan Vega 3 LMU, tungsten-heated cathode electron gun, accelerating voltage 0.2–30 kV) (Brno, Czech Republic). Surface composition was evaluated by energy-dispersive x-ray detector (Oxford Instruments, X-ACT EDX/S detector; EDS resolution 127 eV, 10-mm detector size) (High Wycombe, UK). XPS analysis were done using a unique controlled atmosphere photoelectron spectrometer (CAPES) which permits surface characterization by XPS in ambient atmospheres at pressures on the order of 1 torr. The system consists of a commercial XPS instrument modified by the addition of a differentially pumped movable aperture assembly. The instrument can either be used as a UHV XPS instrument (p < 10−9 torr) or, after insertion of the aperture, to analyze materials at ambient pressures of up to 1 torr.

3.3. Irradiation of 2,3,7,8-TCDD

The irradiation of 2,3,7,8-TCDD was performed at 254 nm and 302 nm, using UV lamps (model UVS-28) from VWR Scientific, Inc. (USA). The relative intensity of the two lamps was 1300 W/cm2 at a distance between the samples and the lamp of 3.0 inches to maintain maximum output of the lamp. For the experiments six different setups were tested including irradiation of 2,3,7,8-TCDD (1) without a catalyst irradiated at 254 nm, (2) in the presence of AgTi catalyst irradiated at 254 nm, (3) in the presence of AgTiY catalyst irradiated at 254 nm (4) without a catalyst irradiated at 302 nm, (5) in the presence of AgTi catalyst irradiated at 302 nm and, (6) in the presence of AgTiY catalyst irradiated at 302 nm. A volume of 10 mL of 10-ppm solution of 2,3,7,8-TCDD was placed in quartz test tubes with an internal diameter of 12.5 mm, length of 10 mm and wall thickness of 1 mm, prior to irradiation. For the experiments containing the catalyst 0.1 g of catalyst/10 mL of 10-ppm solution of 2,3,7,8-TCDD was mixed. The samples were irradiated one at a time for a total of 300 min, and an aliquot was removed every 10 min for UV-visible spectrometer and Varian fluorescence spectrometer analysis. The aliquots collected at 30, 60 and 300 min were further evaluated by GC–MS and ELISA as indicated in Section 3.4 and Section 3.5.

3.4. GC–MS Analysis

Gas chromatography/mass spectrometry (GC–MS) was used to analyze the samples of irradiated 2,3,7,8-TCDD and identify the formed products at a variety of times using a QP2010 Ultra gas chromatography/mass spectrometry (GC–MS) (Shimadzu, Japan). The gas chromatography was connected with a standard RTX-1 capillary column with dimensions of 0.25 µm thickness × 0.25-mm diameter × 30.00-m length from Restek (Bellefonte, PA, USA). For the assessment, the following method was adapted: the injector temperature was set at 250 °C, and the initial oven temperature was 60 °C held for 1 min. Then it was raised to 160 °C at 25 °C /min and held for 0 min, followed by a raise to 240 °C at a rate of 4 °C /min and held for 0 min, followed by a further rise to 290 °C at a rate of 10 °C /min and a hold time of 11 min. Ion source temperature of the Mass spectrometer detector was set at 200 °C and interface temperature was set at 300 °C. The carrier gas used was helium at a flow rate of 1.0 mL/min. Scan mode was used to identify the TCDD (m/z) and the newly formed products.

3.5. Toxicity Assessment of the Irradiation Products

Enzyme Linked Immunosorbent Assay (ELISA) was used to compare the toxicity of the irradiated products. An ELISA kit was purchased from Cape Technologies (South Portland, ME, USA) and previously described [35]. Briefly, an aliquot of 50 µL of standards, blanks and irradiated 2,3,7,8-TCDD were added to antibody-coated tubes containing aqueous sample diluent and kept overnight for antibody–analyte interaction. Tubes were washed with 0.01% v/v Triton X-100 in water solution, and a conjugate of a dioxin-like competitor coupled to the enzyme horseradish peroxidase was added. The tubes were incubated for 15 min then washed with water, followed by the addition of enzyme substrate. A color change is observed at this point due to the captured horseradish peroxidase–competitor conjugate, were the color intensity increased with the increase of the amount captured. The tubes were then kept for 30 min then stop solution was added for arresting the development of color. The optical density (OD) values were recorded using a handheld spectrophotometer at 450 nm [10,11].

4. Conclusions

The degradation of 2,3,7,8-TCDD was evaluated using two types of irradiation light sources in the absence and the presence of AgTi and AgTiY catalysts. As reported in previous studies on the efficiency of titania in heterogeneous photocatalysis of organic and inorganic water pollutants [37], both catalysts were effective in degrading 2,3,7,8-TCDD. However, limited studies have elaborated on the silver titanium doped zeolite. In all cases, irradiation for 300 min (5 h) in both catalyzed and uncatalyzed systems resulted in a final product that looked similar as evidenced with the formation of the SSLS band at 310 nm in all experiments and supported by the GC–MS data presented earlier. However, variation in toxicity is due to the complete or incomplete degradation process reached after 300 min. The presence of the AgTi catalyst, facilitated the excimer formation during the degradation process, whereas the same composite incorporated into the zeolite porous host, eliminate the suitable orientation of adsorbed TCDD to dimerize upon excitation. The best degradation achieved at a lower irradiation time of 60 min was only observed in the presence of AgTiY catalyst irradiated at 302 nm (91%). After five hours, irradiation at 302 nanometers at all studied conditions provided the best photodegradation of TCDD ranging between 97–99%, coinciding with previous studies which reported similar TCDD degradation using TiO2 of 99% for four hours [34]. The obtained results shed light on the positive outcome of using titanium oxides silver catalysts doped in zeolite for the decontamination of aquatic environmental compartments, with minimal toxic byproducts.
Future work on the effect of the silver and titanium loadings on the observed catalytic activity as well as TCDD mineralization during the photocatalytic studies using THF/methanol/water mixed solvent system is under investigation.

Author Contributions

Conceptualization: F.S. and S.K.; methodology: F.S., S.K. and T.G.; formal analysis: F.S., N.A.F. and S.K.; resources: F.S. and S.K.; writing—original draft preparation: F.S. and S.K.; writing—review and editing, F.S., S.K., N.A.F. and T.G.; supervision, F.S. and S.K.; project administration, F.S. and S.K.; funding acquisition, F.S. and S.K. All authors have read and agreed to the published version of the manuscript.

Funding

The work in this paper was supported by the Research office at the American University of Sharjah through grant #: FRG17-R-16-AS0179. The work is also partially supported by the Open Access Program from the American University of Sharjah. This article represents the opinions of the author(s) and does not mean to represent the position or opinions of the American University of Sharjah. The funders had no role in the design of the study; in the collection, analyses or interpretation of data; in the writing of the manuscript or in the decision to publish the results.

Acknowledgments

The authors of this paper would like to thank the American University of Sharjah for supporting this research.

Conflicts of Interest

The authors declare no conflicts of interest.

References

  1. Samara, F.; Elsayed, Y.; Soghomonian, B.; Knuteson, S.L. Chemical and biological assessment of sediments and water of Khalid Khor, Sharjah, United Arab Emirates. Mar. Pollut. Bull. 2016, 111, 268–276. [Google Scholar] [CrossRef] [PubMed]
  2. Vallejo, M.; Román, M.F.S.; Ortiz, I.; Irabien, A. Overview of the PCDD/Fs degradation potential and formation risk in the application of advanced oxidation processes (AOPs) to wastewater treatment. Chemosphere 2015, 118, 44–56. [Google Scholar] [CrossRef] [PubMed]
  3. Kanan, S.; Samara, F. Dioxins and furans: A review from chemical and environmental perspectives. Trends Environ. Anal. Chem. 2018, 17, 1–13. [Google Scholar] [CrossRef]
  4. Marinković, N.; Pašalić, D.; Ferenčak, G.; Grskovic, B.; Rukavina, A. Dioxins and Human Toxicity. Arch. Ind. Hyg. Toxicol. 2010, 61, 445–453. [Google Scholar] [CrossRef] [PubMed] [Green Version]
  5. Fiorito, F.; Santamaria, R.; Irace, C.; De Martino, L.; Iovane, G. 2,3,7,8-tetrachlorodibenzo-p-dioxin and the viral infection. Environ. Res. 2017, 153, 27–34. [Google Scholar] [CrossRef] [PubMed]
  6. Mandal, P.K. Dioxin: A review of its environmental effects and its aryl hydrocarbon receptor biology. J. Comp. Physiol. B 2005, 175, 221–230. [Google Scholar] [CrossRef] [PubMed]
  7. International Agency for Research on Cancer. Polychlorinated dibenzo-para-dioxins and polychlorinated dibenzofurans. IARC Monogr. Eval. Carcinog. Risk Hum. 1997, 69, 228–238. [Google Scholar]
  8. Steenland, K.; Bertazzi, P.A.; Baccarelli, A.A.; Kogevinas, M. Dioxin Revisited: Developments since the 1997 IARC Classification of Dioxin as a Human Carcinogen. Environ. Health Perspect. 2004, 112, 1265–1268. [Google Scholar] [CrossRef] [Green Version]
  9. US EPA, O. Persistent Organic Pollutants: A Global Issue, a Global Response. Available online: https://www.epa.gov/international-cooperation/persistent-organic-pollutants-global-issue-global-response (accessed on 1 June 2020).
  10. Samara, F.; Jermani, E.; Kanan, S. Photocatalytic UV-degradation of 2,3,7,8-tetrachlorodibenzo-p-dioxin (TCDD) in the presence of silver doped zeolite. Arab. J. Chem. 2019, 12, 1870–1878. [Google Scholar] [CrossRef] [Green Version]
  11. Samara, F.; Al Shamsi, M.; Kanaan, F.; Kanan, S. Photocatalytic UV degradation of 2,3,7,8-tetrachlorodibenzofuran in the presence of silver zeolite. Res. Chem. Intermed. 2017, 46, 1017–1032. [Google Scholar] [CrossRef]
  12. Wu, C.-H.; Chang-Chien, G.-P.; Lee, W.-S. Photodegradation of polychlorinated dibenzo-p-dioxins: Comparison of photocatalysts. J. Hazard. Mater. 2004, 114, 191–197. [Google Scholar] [CrossRef] [PubMed]
  13. Hosoya, K.; Kumata, K.; Fukunishi, K.; Tanaka, N.; Patterson, N.G.; Alexander, L.R.; Barnhart, E.R.; Barr, J. Photodecomposition of 1,2,3,4-and 2,3,7,8-tetrachlorodibenzo-p-dioxin (TCDD) in water-alcohol media on a solid support. Chemosphere 1995, 31, 3687–3698. [Google Scholar] [CrossRef]
  14. Kieatiwong, S.; Nguyen, L.V.; Hebert, V.R.; Hackett, M.; Miller, G.C.; Miille, M.J.; Mitzel, R. Photolysis of chlorinated dioxins in organic solvents and on soils. Environ. Sci. Technol. 1990, 24, 1575–1580. [Google Scholar] [CrossRef]
  15. Torimoto, T.; Ito, S.; Kuwabata, S.; Yoneyama, H. Effects of Adsorbents Used as Supports for Titanium Dioxide Loading on Photocatalytic Degradation of Propyzamide. Environ. Sci. Technol. 1996, 30, 1275–1281. [Google Scholar] [CrossRef]
  16. Wodka, D.; Bielanńska, E.; Socha, R.P.; Wodka, M.E.; Gurgul, J.; Nowak, P.; Warszynński, P.; Kumakiri, I. Photocatalytic Activity of Titanium Dioxide Modified by Silver Nanoparticles. ACS Appl. Mater. Interfaces 2010, 2, 1945–1953. [Google Scholar] [CrossRef]
  17. Albiter, E.; Valenzuela, M.; Alfaro, S.; Valverde-Aguilar, G.; Martínez-Pallares, F. Photocatalytic deposition of Ag nanoparticles on TiO2: Metal precursor effect on the structural and photoactivity properties. J. Saudi Chem. Soc. 2015, 19, 563–573. [Google Scholar] [CrossRef] [Green Version]
  18. Blanco, M.; Monteserín, C.; Angulo, A.; Perez-Marquez, A.; Maudes, J.; Murillo, N.; Aranzabe, E.; Ruiz-Rubio, L.; Vilas, J.L. TiO2-Doped Electrospun Nanofibrous Membrane for Photocatalytic Water Treatment. Polymer 2019, 11, 747. [Google Scholar] [CrossRef] [Green Version]
  19. You, X.; Chen, F.; Zhang, J.; Anpo, M. A novel deposition precipitation method for preparation of Ag-loaded titanium dioxide. Catal. Lett. 2005, 102, 247–250. [Google Scholar] [CrossRef]
  20. Hou, X.; Wu, X.; Liu, A. Studies on photocatalytic activity of Ag/TiO2 films. Front. Chem. China 2006, 1, 402–407. [Google Scholar] [CrossRef]
  21. Kaspar, T.C.; Droubay, T.C.; Chambers, S.A.; Bagus, P.S. Spectroscopic Evidence for Ag(III) in Highly Oxidized Silver Films by X-ray Photoelectron Spectroscopy. J. Phys. Chem. C 2010, 114, 21562–21571. [Google Scholar] [CrossRef]
  22. X-Ray Photoelectron Spectroscopy (XPS) Reference Pages: Titanium. Available online: http://www.xpsfitting.com/2008/09/titanium.html (accessed on 25 June 2020).
  23. Zhao, C.; Cai, X.; Ma, Z.; Shi, J.; Xu, L.; Wang, H. Excimer formation from particially overlapped anthracene dimer based on saddle-shaped cyclooctatetrathiophene as spacer. J. Photochem. Photobiol. A Chem. 2018, 355, 318–325. [Google Scholar] [CrossRef]
  24. Mondal, P.; Banerjee, S.; Rath, S.P. Controlling the Photophysics of Aromatic Guests Using a Cyclic Porphyrin Dimer: Synthesis, Structure, and Encapsulation-Mediated “ON-OFF” Switch. Eur. J. Inorg. Chem. 2019, 2019, 3629–3637. [Google Scholar] [CrossRef]
  25. Ahern, J.C.; Kanan, S.; Sara, Z.; Job, T.; Alnaizy, R.; Abu Farha, N.; Patterson, H.H. Photocatalysis of fenoxycarb over silver-modified zeolites. Environ. Sci. Pollut. Res. 2014, 22, 3186–3192. [Google Scholar] [CrossRef] [PubMed]
  26. Kanan, S.; Samara, F.; Abu-Yousef, I.A.; Abdo, N.; Tobias, D. Silver nanoclusters doped in zeolite to decontaminate water resources from the quinalphos pesticide. Res. Chem. Intermed. 2010, 36, 473–482. [Google Scholar] [CrossRef]
  27. Kanan, S.; Kanan, M.C.; Patterson, H.H. Silver nanoclusters doped in X and mordenite zeolites as heterogeneous catalysts for the decomposition of carbamate pesticides in solution. Res. Chem. Intermed. 2006, 32, 871–885. [Google Scholar] [CrossRef]
  28. Kanan, S.; Abdo, N.; Khalil, M.; Li, X.; Abu-Yousef, I.A.; Barilrobert, F.; Patterson, H.H. A study of the effect of microwave treatment on metal zeolites and their use as photocatalysts toward naptalam. Appl. Catal. B Environ. 2011, 106, 350–358. [Google Scholar] [CrossRef]
  29. Kanan, M.C.; Kanan, S.M.; Austin, R.N.; Patterson, H.H. Photodecomposition of Carbaryl in the Presence of Silver-Doped Zeolite Y and Suwannee River Natural Organic Matter. Environ. Sci. Technol. 2003, 37, 2280–2285. [Google Scholar] [CrossRef]
  30. Kanan, S.M.; Omary, M.A.; Patterson, H.H.; Matsuoka, M.; Anpo, M. Characterization of the Excited States Responsible for the Action of Silver(I)-Doped ZSM-5 Zeolites as Photocatalysts for Nitric Oxide Decomposition. J. Phys. Chem. B 2000, 104, 3507–3517. [Google Scholar] [CrossRef]
  31. Husseini, G.A.; Kanan, S.; Al-Sayah, M. Investigating the Fluorescence Quenching of Doxorubicin in Folic Acid Solutions and Its Relation to Ligand-Targeted Nanocarriers. J. Nanosci. Nanotechnol. 2016, 16, 1410–1414. [Google Scholar] [CrossRef]
  32. Muto, H.; Saitoh, K.; Funayama, H. PCDD/DF formations by the heterogeneous thermal reactions of phenols and their TiO2 photocatalytic degradation by batch-recycle system. Chemosphere 2001, 45, 129–136. [Google Scholar] [CrossRef]
  33. Choi, W.; Hong, S.J.; Chang, Y.-S.; Cho, Y. Photocatalytic Degradation of Polychlorinated Dibenzo-p-dioxins on TiO2 Film under UV or Solar Light Irradiation. Environ. Sci. Technol. 2000, 34, 4810–4815. [Google Scholar] [CrossRef]
  34. Wu, C.-H.; Chang-Chien, G.-P.; Lee, W.-S. Photodegradation of tetra-and hexachlorodibenzo-p-dioxins. J. Hazard. Mater. 2005, 120, 257–263. [Google Scholar] [CrossRef] [PubMed]
  35. IN-DF1 Kit Insert. Available online: http://www.cape-tech.com/literature/kits/in_df1a.htm (accessed on 16 May 2020).
  36. Samara, F.; Gullett, B.; Harrison, R.O.; Chu, A.; Clark, G.C. Determination of relative assay response factors for toxic chlorinated and brominated dioxins/furans using an enzyme immunoassay (EIA) and a chemically-activated luciferase gene expression cell bioassay (CALUX). Environ. Int. 2009, 35, 588–593. [Google Scholar] [CrossRef] [PubMed]
  37. Stathatos, E.; Lianos, P.; Falaras, P.; Siokou, A. Photocatalytically Deposited Silver Nanoparticles on Mesoporous TiO2 Films. Langmuir 2000, 16, 2398–2400. [Google Scholar] [CrossRef]
Figure 1. Structure of 2,3,7,8-tetrachlorodibenzo- p-dioxin (2,3,7,8-TCDD).
Catalysts 10 00957 g001
Figure 2. Scanning electron microscopy (SEM) of (a) AgTi (b) AgTiY, energy dispersive x-ray spectroscopy (EDS) profile of (c) AgTi and (d) AgTiY and pore size distributions of both (e) AgTi and AgTiY.
Catalysts 10 00957 g002
Figure 3. XPS spectra for the TiAg sample along with the assigned major binding energy peaks.
Catalysts 10 00957 g003
Figure 4. SSLS recorded at Δλ = 30 nm for 2,3,7,8-TCDD before and after irradiation with 254 nm (a) and 302 nm (b) UV lights for various times.
Catalysts 10 00957 g004
Figure 5. UV-visible spectra recorded for 2,3,7,8-TCDD before and after irradiation with 254-nm UV light for various times.
Catalysts 10 00957 g005
Figure 6. Synchronous scan luminescence spectra (SSLS) recorded at Δλ = 30 nm for 2,3,7,8-TCDD in the presence of AgTi catalyst before and after irradiation with (a) 254-nm and (b) 302-nm UV lights for various times.
Catalysts 10 00957 g006
Figure 7. SSLS recorded at Δλ = 30 nm for 2,3,7,8-TCDD in the presence of AgTiY catalyst before and after irradiation with 302-nm UV light for various times.
Catalysts 10 00957 g007
Figure 8. Photodecomposition of 2,3,7,8-TCDD without catalyst, in the presence of AgTi catalyst and in the presence of AgTiY catalyst before and after irradiation with 254-nm and 302-nm UV lights for various times.
Catalysts 10 00957 g008
Figure 9. ELISA results of the optical density versus time for 2,3,7,8-TCDD without catalyst, in the presence of AgTi catalyst and in the presence of AgTiY catalyst before and after irradiation with 254 nm and 302-nm UV lights for various times.
Catalysts 10 00957 g009
Table 1. Photodegradation byproducts detected with GC–MS on irradiated samples with and without catalyst.
Degradation ProductsTCDD
(254 nm)
TCDD/AgTi
(254 nm)
TCDD/AgTiY
(254 nm)
TCDD
(302 nm)
TCDD/AgTi
(302 nm)
TCDD/AgTiY (302 nm)
Irradiation Time (min)
306030030603003060300306030030603003060300
2,7-dichlorodibenzo-p-dioxin (2,7-DCDD)XXXX
2,3,7-trichlorodibenzo-p-dioxin (2,3,7-triCDD)XXXXXXXXXXXXXXXXX
1,3-dixolaneX
docosanoic acidX
2-eicosanolX
methyl-2-ethyhexyl phthalateX
1-heptadecenceXX
(2,3-diphenylcyclopropyl) methyl phenyl sulfoxideXXX
2,6-di-T-butyl-4-mmethylene-2,5-cyclohexadien-1XXX
1-dotriacontanolX
4-hydroxy-3,5-ditertbutylbenzaldehydeX

