Abstract
The traditional methods used to synthesize graphene layers over semiconductors are chemical-based methods. In the present investigation, a novel photoelectroactive electrode was synthesized using a chitosan biopolymer without the usage of chemicals. A chitosan-biopolymer layer over the surface of TiO2 was generated by electrodeposition. Furthermore, the pyrolysis method was used for the conversion of a biopolymer into graphene layers. The catalytic activity of the fabricated electrodes was investigated by the photo-electro-Fenton (PEF) process to oxidize chloramphenicol and nadolol pharmaceutical drugs in wastewater, remove metals (scandium, neodymium, and arsenic) and degrade real municipal wastewater. The PEF operational parameters (pH, voltage, reaction time, and Fenton catalytic dose) were optimized for the overall degradation of chloramphenicol and nadolol pharmaceutical drugs in wastewater. It was observed that at the optimum process operational parameters it took 40 min to degrade chloramphenicol and nadolol pharmaceutical drugs in wastewater. It was proved that biopolymer-based photoelectroactive novel electrodes render good catalytic activity. Furthermore, the reusability study of fabricated electrodes showed excellent storage and self-healing properties.
1. Introduction
The graphene structure has many superior properties for wastewater treatment studies by advanced oxidation processes [1]. Graphene has a zero bandgap between its valence and conduction bands and a strong ambipolar electric field effect at room temperature [2,3]. Moreover, graphene has attracted immense interest owing to its lightweight, unique planar structure, excellent mechanical strength, superior electron conductivity (107–108 S/m) and mobility, high specific surface area (2630 m2/g), and good adsorption capacity [4]. Graphene is an excellent electrocatalyst with thermal and photochemical stability [5]. All these outstanding properties have thus aroused great research interest from the fundamental study of various applications of graphene. Some researchers used graphene as a photocatalyst [6,7], but most of the researchers focused on modified graphene [8,9]. Numerous methods have been employed for the synthesis of graphene, such as the mechanical exfoliation method, thermal decomposition, chemical vapor deposition, the exfoliation and reduction of chemically oxidized graphite, etc. Among those methods, chemical oxidants have been widely used for the exfoliation of graphite into graphene oxide and then graphene [10]. To avoid the huge amount of chemical consumption, researchers have been producing green reducing agents (biopolymers) for graphene oxide and graphene composites. These composites have been used as catalysts for various processes. However, these composites have not been used as photo-electro-catalysts. So, researchers have been focused on the direct electrodeposition of graphene over the semiconductor, but to adhere to the surface of the semiconductor graphene needs to be partially reduced to graphene oxide. It has been substantially used for sensors, photovoltaic cells, supercapacitor lithium-ion batteries, and, more recently, electro-photocatalysis. Furthermore, it has been investigated that the electrochemically reduced graphene oxide after electrodeposition forms a huge number of oxygen-carrying groups, promoting the development of graphene-based materials [11,12]. However, the major drawback of the partial reduction of the graphene oxide approach over the semiconductors is that it generates hydrogen bubbles during the electrochemical reduction process and these hydrogen bubbles ultimately destroy the π-conjugation stack of graphene and reduce its conductivity. This drawback affects the successive applications of the electrodeposited film [13,14]. To overcome these issues, many approaches have been developed to enhance electrochemical performance without the reduction of graphene. Nevertheless, graphene is a highly conductive material with a conductance of 600,000 S/m and the fabrication of a highly active photo-catalyst on conductive or semiconductive base metal is desirable, with an ordered geometry and without using any binders [15].
Recently, there has been interest in the use of green materials such as biopolymers as an alternative to reduced graphene layers or synthesis of the graphene layer without any binder. These green materials yield high-quality single-layer and few-layer graphene sheets and massive production of graphene for the practical application over the semiconductor by electrodeposition. The biopolymer method approach has been successfully used for the development of photocatalytic material [16], to be readily applicable in photo-electroFenton. Among other biopolymers, chitosan has been extensively suitable for electrodeposition [17,18]. It has been illustrated that chitosan can be electrodeposited as a stable thin film on the cathode, by a successfully generated cathodic neutralization mechanism. Researchers have used this technique for biomedical purposes due to the component properties of electrogenerated chitosan thin films [19,20]. Moreover, the electrodeposition process permits a chitosan film to be deposited directly onto the surface of the metal [21,22]. In the present study, novel TiO2-G film electrodes have been synthesized using a chitosan biopolymer for the generation of graphene layers over the surface of the TiO2 cylindrical tube (semiconductor) without using any binder. A nano-oxide layer has been synthesized over the semiconductor and acts as a binder between the semiconductor and the graphene layer. Chitosan is a cheap biomaterial from natural resources without chemical modification or binders, it has been used for the synthesis of the graphene layer. The pyrolysis conversion method has been used to convert the chitosan layer into the graphene layer and it shows good adhesive properties over the surface of TiO2. The catalytic activity of the synthesized TiO2-G film electrodes has been investigated through its treatment of synthetic pharmaceutical wastewater (chloramphenicol and nadolol), the removal of metals (scandium, neodymium, and arsenic), and the degradation of real municipal wastewater by the photo-electro-Fenton (PEF) process. The PEF process experiments have been statistically designed by response surface methodology. The degradation mechanism in terms of oxidation radicals during the PEF treatment process has been investigated. Furthermore, the reusability of fabricated electrodes has been examined to assess the stability and adhesive properties of the graphene layer over the surface of TiO2 after the PEF treatment process.
2. Results and Discussion
2.1. Characteristics of TiO2-G Electrode
The TiO2-G electrode characterization was performed with an emission scanning electron microscopy (SEM) and energy-dispersive X-ray spectroscopy (EDS) to examine the microstructure of the electrode. The graphene layer was scratched from the surface of the electrode to confirm the deposition. Its surface morphology was studied with SEM-EDS. Figure 1a shows a large graphene flake scratched from the surface of TiO2 and it looked like a membrane or a layer. Moreover, Figure 1b shows the adhered uniform layer of graphene over the surface of TiO2. The corresponding EDS spectrum of TiO2-G exhibited the existence of carbon (16.04%wt), oxygen (10.71%wt), and titanium (73.25%wt). EDS mapping evidenced the presence of graphene over the TiO2 surface (Figure S1). The X-ray diffraction (XRD) spectroscopy pattern of the synthesized TiO2-G film was shown in Figure 2a. The formation of the TiO2 rutile phase was confirmed, with the presence of two signature peaks of the TiO2 rutile phase (JCPDS No. 21-1276) that appeared at 36.1 and 42.02° indexed to (101) and (110) plane, respectively [22,23]. Contrarily, the XRD pattern of the TiO2-G film exhibited diffraction peaks at 60.8 and 72.8°, which were attributed to the adherence of graphene film over the surface of TiO2. Additionally, diffraction peaks at 39.9, 52.3, and 76.8°, corresponding to the characteristic peaks of titanium [24], represented the titanium (Ti) base metal. The presence of the graphene was further supported by Raman spectroscopy. Figure 2b shows the Raman spectra for the electrode TiO2-G. The representative D and G peaks expected of the graphene layer were identified at 1351 and 1596 cm−1, respectively, over the TiO2 surface. To confirm the presence of graphene, pristine graphene was used as a reference. The intensity ratio (ID/IG) of the D and G band confirmed the presence of graphene over the TiO2 surface. Furthermore, the existence of characteristic bands at A1g (607 cm−1) and Eg (400 cm−1) of TiO2 in the lower wavenumber range showed the presence of the TiO2 rutile phase [25].
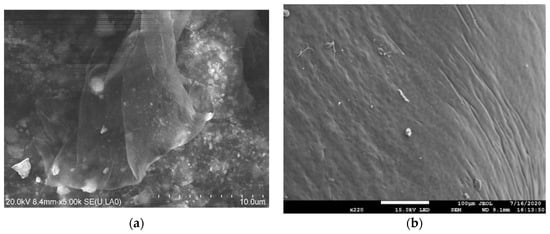
Figure 1.
SEM images: (a) interspersed graphene flakes, (b) graphene layer adhered uniformly on the TiO2 base metal surface.

Figure 2.
(a) The X-ray diffraction spectroscopy pattern of TiO2-G film. (b) Raman spectra recorded for the electrode TiO2-G film and pristine graphene.
2.2. Photo-Electrocatalytic Activity (PEA)
The PEA of TiO2-G film electrodes was estimated by the oxidative degradation of chloramphenicol and nadolol simulated wastewater, the removal of metals, and municipal wastewater degradation by PEF. Design-expert software (version: 11) was employed to optimize the experimental runs for the determination of the PEA of the fabricated electrodes. Response surface methodology (RSM) is a fact-based approach for precising the experimental runs and evaluating the impacts of independent process parameters on the chosen responses. Central composite design (CCD) using a second-order polynomial equation was used for the optimization of the operational parameters of the PEF process using TiO2-G film electrodes concerning the overall degradation of drugs [26]. To design the experimental runs, the selected PEF process independent variables were pH (X1), voltage (X2), Fe dose (X3), reaction time (X4), and response in terms of catalytic activity was taken as overall degradation of drugs (%D) in the simulated wastewater. Preliminary PEF experiments were performed to determine the high and low values of the operational parameters. All the variables were coded and demonstrated as low-level (−2, −1), medium level (0), and high-level (+1, +2) as shown in Table 1.

Table 1.
Ranges of selected independent parameters.
2.2.1. Model Fitting and Analysis of Variance
RSM for the experimental design such as CCD fitted the model under least square error. When several operational parameters are involved in the optimization process then RSM is an effective tool for optimization with a minimal number of experiments. The adequacy of the model was diagnostically checked by the analysis of variance (ANOVA) [27]. The interaction of operational parameters would be easily employed by response surface plots. The most important parameters were selected for the PEF process from literature and preliminary experiments [28]. Experiments recommended by CCD (Table 2) were carried out to determine the catalytic activity of synthesized electrodes. A quadratic model was best fitted for RSM modeling of the PEF process. The adequacy of the quadratic model was assessed by utilizing a sequential F-test, model summary, and subsequent ANOVA. The adequate precision values for %D (overall degradation) were 19.01 respectively. An adequate precision ratio greater than 4 was desirable and indicated that the design space would be navigated by the RSM model. It also provided information about the efficacy of the suggested model to understand the relationship between independent variables and the responses. The model F-values indicated the significance of the model and P < 0.05 indicated the significant PEF model-independent parameters as shown in Table 3. The significant model parameters with respect to %D were pH, time (t), voltage (V), Fe dose (Fe), (pHxFe), (txV), pH2, V2, Fe2. The Lack of Fit F-values were not significant relative to the pure error function so, it was good for accurate model fitting. The significance of the quadratic model was observed with a 95% confidence level.
Table 2.
Design of an experimental set for the PEF process.
Table 3.
The statistical analysis in terms of ANOVA and the impact of PEF operational parameters over the response %D.
The variations between the actual and predicted were very small (<1.5%). The values of the coefficient of the determinant (R2, adjusted R2, and predicted R2) were 0.96, 0.93, and 0.82, respectively. The predicted R2 of 0.82 was in reasonable agreement with the adjusted R2 of 0.93, i.e., the difference was less than 0.2. So, there was a good correlation between predicted and experimental data. Furthermore, the residual plot confirmed the validation of the quadratic model (Figure S2). In terms of significant process parameters, Equation (1) supported the best fitting of the quadratic model. The relative impact of the process parameters was identified from the coded equation as shown below.
% D = 68.3 − 9.6pH + 3.3t + 7.3V − 5.3Fe + 9.2 (pHxFe) − 4.2 (txV) + pH2 − 3.1V2 − 7.1Fe2
2.2.2. Effect of Operational Parameters
ANOVA analysis provided information regarding the significance of operational parameters on the overall degradation-based p-values during PEF treatment. A P-value less than 0.05 specified that the model terms were significant, i.e., process parameters showed a remarkable impact on the variability of the response. Parametric analysis was studied by 3D response surface graphs. It provided information about the effect of interactive parameters on the catalytic activity of PEF process. The correlative impact (95% of confidence interval) of the parameters, voltage, time, pH and Fe dose on the %D are illustrated in Figure 3a–c. It could be perceived that at the upper side of pH range (7–11), %D was found always decreasing with the increase in t-value. A sharp increase in %D was observed with an increase in pH value from 3 to 7 with a rise in t-value from 30 to 75 min. However, pH 5, at t = 50 min, showed a maximum %D (Figure 3a). The pH value plays an important role in the PEF process: when the pH of the photoelectron chemical cell was varied from 2.0 to 5.5, a sharp increase was observed in %D. However, with a further increase in pH (>5.5), there was a sharp decline in %D. It might have been because of the nature of the degrading compound (chloramphenicol and nadolol) or if it contained an amide group (pub-chem, molecule structure). So, it exhibited alkaline characteristics when dissolved in water, and to degrade it, acidic conditions were more favorable. On the other hand, when there was an increase in pH, the redox potential of chloramphenicol and nadolol decreased. Therefore, a major part of the photogenerated electrons were directly absorbed by chloramphenicol and nadolol, which ultimately lowered the thermodynamic driving force and oxidative ability of photoanode [28]. The valence band potential of photoanodes was affected by higher pH, and it shifted towards more negative potential. It reduced the electron (e-)/hole (h+) separation effect, which ultimately disturbed the oxidizing power (Jia et al., 2020) and affected the catalytic performance. Therefore, optimal pH was a necessity for PEF, but for most of the cases highly acidic conditions were favorable for PEF. Highly acidic pH (<4) was very difficult to maintain and aftertreatment disposal of highly acidic treated wastewater would be very problematic. So, goethite and hematite were used for Fe dose because they worked under a wide range of pH (=7). Goethite and hematite acted as a Fenton catalyst to proceed the Fenton reaction in a less acidic medium [29]. The increase and decrease of Fe dose and the pH of the photo-electrocatalytic chamber worked differently over the %D as shown in Figure 3b. An increased Fe dose (0.1–0.4 mM) increased the %D at all pH values but when the Fe dose was >0.4 mM, there was a sharp decrease in %D at all pH values. It was observed that oxidation of pollutants by electrochemically generated H2O2 occurred mainly on the surface of goethite and hematite photocatalysts rather than in bulk [29]. It enhanced the photocatalytic performance of catalysts by conducting an electron scavenging oxidation reaction. In general, the charge carriers (e- and h+) were generated upon light illumination (Equations (2)–(6) [30].
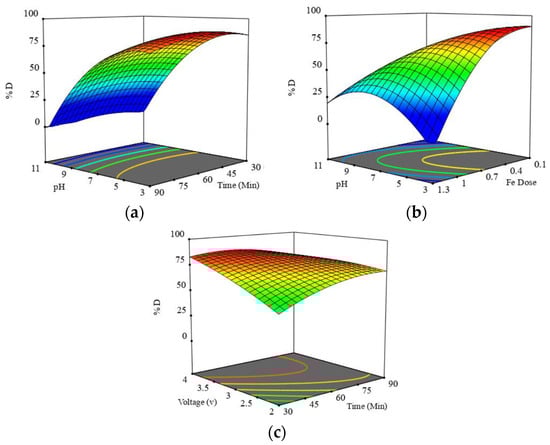
Figure 3.
(a–c) The effect of PEF independent operational parameters (pH, time, Fe dose, and voltage) over the overall catalytic activity of electrodes in terms of %D (95% CI).
Figure 3c demonstrates that the %D increased with an increase in voltage up to 3.8 V concerning t-value. However, %D was sharply affected when the voltage increased from 3.8 V with the increase in t-value. At the t-value of 60 min, %D was highest with the increase in voltage.
It implies that the degradation process was very fast, which indicated that mediated oxidation was prominent in the PEF process. Due to UVC illumination and applied voltage, radicals were generated via Equations (7)–(10).
It was evidenced that the voltage was a highly significant parameter in the PEF process. Fe dose > 0.4 mM at voltage > 3.8 V, negatively impacted the photo-electroFenton reaction because other weaker reactive oxygen species such as H2O2 and hydroperoxyl radical () come into existence via reactions (11) and (12).
With an increase in voltage at a higher Fe dose, the photo-electrochemical electrolyte would increase the weaker reactive oxygen species and ultimately reduce the %D. There was a direct relation between the applied voltage to the band bending of the semiconductor, it improved the charge separation and transfer of charge carriers between the graphene and TiO2 [31]. When the applied voltage became greater than the flat band potential (3.8 V) of TiO2-G film, it negatively affected the %D. Voltage of 3.8 V was enough for complete band bending and more efficient separation of the photogenerated electrons and holes [32]. Remarkably, optimized voltage (high bias potential) was important for avoiding side reactions during the PEF process. However, when the applied potential of the electrode increased from flat band potential, it ultimately decreased the %D because of the generation of repulsive forces between the charge carriers due to high voltage. The voltage-triggered electrons in the TiO2 conduction band (Equation (13)) would react with the oxygen-generated ∙O2− radicals (Equation (14)).
2.2.3. Optimization
The optimization of PEF independent parameters with the response (%D) for the degradation of chloramphenicol- and nadolol-simulated pharmaceutical wastewater by the PEF process using TiO2-G film electrodes, with desirability function was executed. To optimize the values of the operating parameters, the target was set to maximize %D removal, while keeping electric energy consumption as a minimum. As a result, the optimum condition was found by the desirability function approach using R as pH = 5, voltage = 3.8 V, time = 45 min and Fe dose = 0.40 mM with a predicted response of %D = 86.02%. A set of three experiments was conducted with the optimized conditions. Average experimental %D values at optimal conditions came out to be 85.86%, which was in good compliance with the predicted value.
2.3. Degradation Mechanism
To investigate the feasible PEF mechanism of chloramphenicol and nadolol degradation, a free-radical quenching study was performed to determine the effect of active radicals by using different scavengers, i.e., 1,4-benzoquinone, ethylenediaminetetraacetic acid and tert-butyl alcohol were used as the scavengers of superoxide radical (∙O2−), hole (h+) and hydroxyl radical (), respectively. Figure 4 shows the catalytic activity of TiO2-G film electrodes before and after adding 1,4-benzoquinone, ethylenediaminetetraacetic acid and tert-butyl alcohol. In the presence of scavengers, catalytic activity in terms of degradation was reduced from 85.86% to 22.5% within 45 min under the optimized operational conditions of PEF. The catalytic activity of TiO2 becomes almost double with the graphene layer. It was proved that were responsible for the chloramphenicol and nadolol degradation, whereas holes and ∙O2− radicals acted equally in the degradation process as shown in Figure 4. The result of the quenching study was supported by electron paramagnetic resonance (EPR). The spin adducts observed by the EPR (DMPO) represent the presence of four distinctive peaks having an intensity proportion of 1:2:2:1 (Figure 5). It ensured the generation of in the PEF treatment process [33], while 2,2,6,6-tetramethylpiperidine 1-oxyl (TEMPO) showed a typical signal of three peaks with an intensity of 1:1:1. The signal intensity secured the presence of ∙O2− radicals as shown in Figure 5. The results revealed that TiO2-G film was excited by photons and electrical influence, which promoted the generation of and ∙O2− species. The collaborative effect of graphene and TiO2 intensified the catalytic activity. The heterojunction structure of the TiO2 rutile phase promoted the segregation of e−/h+ pairs and ultimately enhanced the catalytic activity. The e− in the conduction band of graphene reduced the interface barrier and migrated towards the conduction band of titanium oxide and became involved in the cathode circuit. These electrons were further captured by oxygen in the electrolyte solution and converted into ∙O2−. The holes in the valence band of TiO2 directly attacked the organic matter. The electrons from TiO2 transferred into the G film. Holes in the valence band of G film also participated in the direct degradation of organics but the electrons with the effect of applied voltage moved into the circuit and also participated in the water molecule splitting to generate ∙O2− and radicals [34]. Furthermore, it was involved in the degradation of chloramphenicol and nadolol into small molecules, ultimately decreasing reaction time. Herein, the synergistic effect of graphene and TiO2 significantly enhanced the e−/h+ separation, which provided a higher catalytic activity.

Figure 4.
Catalytic activity of TiO2-G film electrodes and TiO2-G film electrodes with scavengers (1,4-benzoquinone, ethylenediaminetetraacetic acid and tert-butyl alcohol) at optimized operational conditions.
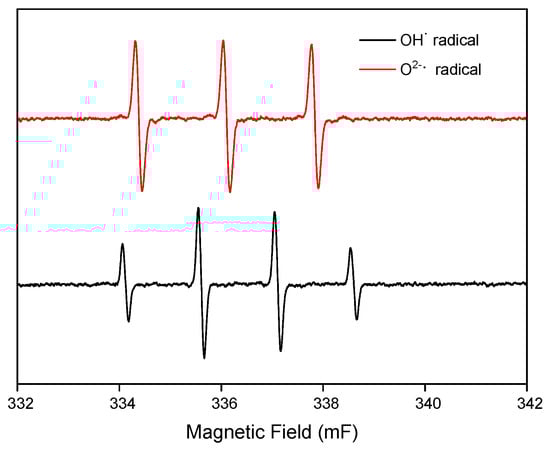
Figure 5.
Electron paramagnetic resonance (EPR) representing the presence of ∙OH and O2−.
2.4. Removal of Rare Earth Metals and Arsenic from Simulated Wastewater
The photocatalytic activity of the synthesized electrodes was also investigated for metals by the removal of scandium, arsenic, and neodymium from simulated wastewater. Simulated wastewater was prepared by dissolving scandium (50 ppm), arsenic (50 ppm), and neodymium (50 ppm) in tap water. A batch experiment was performed with the optimized operational parameters and 84.23% of arsenic removal, 81.12% of scandium removal, and 74.56% of neodymium removal was observed. In the case of arsenic removal at the anode, the oxidation of water molecules occurred, which ultimately oxidized the oxo-anions (As III) to form complex H3AsO4. At the cathode oxo-anions (As V) became reduced and formed complex HAsO3−2 and HAsO3− [35]. In the case of rare-earth metals, the accurate mechanism behind the removal is not yet clear. Rare earth metals form complexes with a Fenton catalyst and with reduction and oxidation of water molecules. Furthermore, the stripping with H2SO4 helps to recover the high purity (99%) of rare earth metals [36,37].
2.5. Degradation of Municipal Wastewater
The photocatalytic activity of the synthesized electrodes was also investigated for real municipal wastewater. Real municipal wastewater was collected from the Mikkeli, Finland wastewater plant. The initial chemical oxygen demand of the wastewater was 745 mg/L, pH = 7.2, Total organic carbon = 56.6 mg/L. A batch experiment was performed using the process with the optimized parameters. Removal of COD (67.56%) and TOC (60.18%) was observed after 45 min of the reaction time. The real wastewater study shows that there are certain real wastewater parameters (Fe concentration = 13mg/L, phosphorus = 11mg/L, nickel = 6.5 mg/L) that reduce the activity of synthesized electrodes [38], which ultimately increase the reaction time. The accuracy of the optimized operational parameters of heterogenous photo-electrocatalysis was confirmed.
2.6. Electrode Durability and Reusability
It is crucial to evaluate the durability and reusability of the catalysts for practical applications of photo-electrocatalysis in the real water treatment process. From a practical point of view, the durability of the electrode is very important. The stability of the TiO2-G film was examined under optimized PEF process conditions. The anodic voltage was maintained at 3.8 V with an increase in the reaction time. The fresh electrode provided %D of 85.86% but after the 10 × 5 h of successive PEF reactions, the efficiency of the electrodes was reduced by 1.32%. After successive reactions, the reduction of the catalytic activity was observed due to (i) the structural change of the metal and biopolymer layer, (ii) perturbation of the electrons and holes during the reaction with organic compounds, and (iii) diffusion between the surface of the electrode and the bulk solution. After the long-term PEF experiments, the used TiO2-G film electrode was re-examined by XRD, RAMAN, and SEM. It was observed that the structural configuration of the electrodes (RAMAN) was not much affected (Figure 6a) but in Figure 6b, the XRD peak shift was observed after the treatment process. XRD peak shift can be caused by several factors. In the present conditions, applied voltage, hematite and goethite might be responsible for the XRD peak shift. It revealed a little consistent shifting for characteristic peaks to higher 2θ values because of the lattice parameters of the synthesized electrode undergoing material change with the effect of voltage and the Fenton catalyst in the electrolyte. This variation in lattice parameters would lead to the lattice strains, ultimately creating the internal stress and decreasing the length of lattice parameters, leading to increased molecular size which in turn depicted a peak shifting towards greater 2θ in XRD analysis [39,40]. An XRD peak corresponding to Ti showed higher intensity after treatment. It showed that the oxide layer was a little bit depleted after treatment. SEM images showed minute cracks in the GO film after successive PEF reactions as shown in Figure 7a. The TiO2-G film electrodes were stored in tap water for two days; then a PEF reaction was run for chloramphenicol and nadolol oxidation and excellent catalytic activity towards chloramphenicol and nadolol oxidation was observed (85.58%). In terms of conductivity, chitosan-modified membranes have excellent stability in water [41]. Further, SEM was performed again to understand the structural changes of TiO2-G film. This indicated that the TiO2-G film electrodes regained their catalytic activity in the presence of water as shown in Figure 7b. After 50 (5 h per day) h of PEF reactions, their catalytic activity was reduced and further regenerated after two days of storage in water. The chitosan membranes have self-healing properties [42,43]. The consistency of the graphene layer was damaged with a successive PEF reaction but the minute cracks were healed over the surface of the electrode. Its further use may provide reduced catalytic activity with time. So, further modification to the electrode synthesis is required to increase the adhesive properties of graphene over the surface of the semiconductor to achieve long durability. Overall, the present electrode synthesis method provides good restorable catalytic activity and storage properties of the catalytic electrode.

Figure 6.
Comparative (a) RAMAN and (b) XRD spectra of fresh and used electrodes.

Figure 7.
SEM image of TiO2-G film (a) after successive PEF reaction and (b) after storing in tap water for two days.
3. Experimental
3.1. Chemicals and Materials
All chemicals used for the present study were of analytical grade reagents without further purification. Chloramphenicol (C11H12Cl2N2O5), nadolol (C17H27NO4), goethite (FeO(OH)), acetic acid (CH3COOH), sodium hydroxide (NaOH), and hydrochloric acid (HCl) were purchased from Sigma Aldrich. Silicon carbide sandpaper, hematite (Fe2O3), acetone ((CH3)2CO), isopropanol (C3H8O), hydrofluoric acid (HF), nitric acid (HNO3) were purchased from VWR International Oy, Valimotie Helsinki, Finland. Chitosan was purchased from Sigma-Aldrich, St. Louis, MO, USA used as graphene precursors. The aqueous solutions were prepared in deionized water.
3.2. Electrode Fabrication (TiO2-G Film)
A seamless Ti tube with 165 cm2 area was used as a base material for electrode fabrication. Silicon carbide sandpaper was used to polish the roughness of the Ti tube and then it was cleaned with acetone, isopropanol and finally with distilled water. Mechanical etching of the Ti tube was performed ultrasonically with 1:10 (acetone and water) for 60 min. Chemical etching of the Ti tube was performed (HF: HNO3: H2O; 1:4:10) for 10 s and then rinsed with distilled water. Anodization was performed with Ti seamless perforated tube (3 cm) as a positive electrode and copper tube (3 cm) as a negative electrode. The distance maintained between the electrodes was 1 cm in 5% HF electrolyte at 20 V (Minipa MPL-1303 power supply) for 2 h. The fresh anodized electrode was calcinated in the muffle furnace (500 °C) for 3 h. The electrodeposition of chitosan proceeded with the preparation of the chitosan solution. An aqueous solution of chitosan was prepared by dissolving 600 mg of chitosan in 800 mL of water and 1% (V/V) acetic acid. The prepared stock solution was stirred for 1 h. During the electrodeposition process, TiO2 was used as a cathode and a parallel copper tube as an anode. Direct current was supplied for the electrodeposition (Model: Minipa MPL-1303) with a constant voltage of 20 V for 3 h. Furthermore, after the electrodeposition process, the electrodes were rinsed with distilled water and then dried at 50 °C in the air-dry oven overnight. The thin film was pyrolyzed under the Ar atmosphere at 900 °C. Characterization of the synthesized electrode was performed using an X-ray diffractometer (XRD, Empyrean series 2 PANalytical X-ray with Co-anode at 40 kW, 30 mA), Monochromator 3D, a high dynamic range pixel detector was purchased from Malvern Panalytical a spectris company, Malvern, United Kingdom. HORIBA Jobin Yvon LabRAM HR, RAMAN spectroscopy, HORIBA UK limited, Northampton, United Kingdom (a green laser with wavelength 514.53 nm) explored the chemical and molecular interaction. The surface material elemental and chemical composition of the synthesized electrode was explored by scanning electron microscopy (SEM)-energy dispersive X-ray spectroscopy (EDS) (Hitachi S-4800, Krefeld, Germany). The synthesized electrode was cut into a 0.5 × 0.5 cm2 piece. This electrode piece was directly used as a sample for characterization. In the case of SEM-EDS, the direct electrode (0.5 × 0.5 cm2 piece) and a scratch from the surface of the TiO2 base were used as samples for characterization. The accelerating voltage and emission current for SEM were 2.00 kV and 65.8 µA, respectively.
3.3. Design of Experiments, Experimental Setup and Procedure
The experiments were designed using the statistical design-expert software version 11 (STAT-EASE Inc., Minneapolis, MN, USA) program. Central composite design (CCD) based on response surface methodology (RSM) was used for the experimental design and analysis of the experimental data. It consisted of factorial runs (2N), axial runs (2N) and experimental error calculated by center runs (CE). CCD was implemented for the quadratic effect because the second-order effect did not estimate separately by 2N factorial design. In the statistical analysis, the desired response was optimized corresponding to the independent process parameters. The statistical parameters were calculated by ANOVA with the aid of RSM [37]. CCD under RSM statistically designed the experiments, furthermore, determined the mathematical model, and finally checked the accuracy of the mathematical model in terms of F-value. The selected PEF process independent variables were pH (X1), voltage (X2), Fe dose (X3), reaction time (X4), and response in terms of catalytic activity was taken as overall degradation of drugs in the simulated wastewater. The range and level of the factors varied accordingly to pre-performed experiments (Equation (15)).
where X was the response of the system andX1, X2, X3, and X4 were independent selected PEF process variables. A true correlation between the independent variables and responses was needed to identify the optimization of response variables concerning independent variables. CCD arranged the designed experimental run in standard order for data clustering to diminish the error and effect of the uncontrolled factors. An empirical model second-order polynomial equation was generated to correlate between the independent variables and response (Equation (16)).
where is the constant coefficient, , , were linear interaction coefficients, quadratic, and second-order terms, respectively. The terms xi and xj were variables and was an error function. The accuracy of the model was determined in terms of R2, adjusted R2, and predicted R2. The statistical significance of the model was observed by an adequate precision ratio.
A batch reactor was designed at a laboratory scale for the treatment of chloramphenicol- and nadolol-simulated pharmaceutical wastewater by PEF process with a working volume of 1 L and fused glass bubblers at the substratum of the reactor for injecting air. UV-C18 W lamps (Philips) were positioned at the top and the bottom of the reactor. For PEF designed experiments, the TiO2-G film electrodes as anode and cathode were placed inside the glass reactor (diameter of 3 cm) as shown in Figure 8. The voltage for an experimental condition was managed by using a direct current power supply (Minipa PL-1303). All the experiments were carried out in a laboratory with excellent air ventilation. The pH of each experimental run was adjusted according to requirements. After the termination of each run, the withdrawn samples were permitted to settle dispersed particles for 60 min. The upper liquid phase was taken for further analysis.

Figure 8.
Experimental setup.
3.4. Analytical Methods
A MeterLab standard pH meter was used to measure the pH of the wastewater. A double beam UV−visible spectrophotometer (HACH, DR 5000, Colorado, CO, USA) was used to analyze the degradation of simulated wastewater samples. The λmax of chloramphenicol is 272 nm and nadolol displays three absorption peaks in the ultraviolet region at about 218, 270, and 278 nm. Catalytic activity in terms of overall degradation (%D) was calculated by using Equation (17), where B1 = initial absorbance; B2 = final absorbance. Chloramphenicol sample absorbance was observed at 272 nm and nadolol absorbance was observed at three peaks, 218, 270, and 278 nm.
An inductively coupled plasma-optical emission spectroscopy (ICP-OES) Optima 8000 Series-Perkin Elmer Co., USA was used to determine the concentration of metals in the synthetic wastewater. The catalytic mechanism was explained by EPR (EPRA-9300/CMS 8400) to observe the generation of radicals during the PEF treatment process.
4. Conclusions
Graphene film TiO2 electrodes have been successfully synthesized with the pyrolysis method. It has been concluded that the nano-oxide layer acts as a good binder between the semiconductor and the graphene layer. A nano-oxide layer increases the adhesive properties of graphene over the surface of the semiconductor. The catalytic activity of the TiO2-G film electrode was investigated by the PEF process to oxidize pharmaceutical drugs, remove metals, and treat municipal wastewater. It has been concluded that due to the high conductivity of graphene, the electrons in the conduction band of graphene reduce the interface barrier and migrate towards the conduction band of TiO2 and get involved in the cathode circuit. It ultimately acts as a photocatalyst and an electrocatalyst for the degradation of pharmaceutical drugs. The catalytic activity of TiO2-G film is quite good for the treatment of municipal wastewater. So, TiO2-G film electrodes have good catalytic activities to be used for real applications. It has been proved that the catalytic activity of titanium oxide doubled with the synthesis of the graphene layer over it. The reusability study of the fabricated electrode showed its better durability, excellent storage, and self-healing properties but needed modification for long term use of TiO2-G film electrodes in practical applications. Nevertheless, the prepared TiO2-G film electrodes exhibited excellent degradation capacity, demonstrating a promising technology for the treatment of pharmaceuticals, metal removal, as well as real wastewater micropollutants.
Supplementary Materials
The following are available online at https://www.mdpi.com/2073-4344/10/9/1050/s1. Figure S1. SEM-EDS mapping of synthesized electrodes. Figure S2. Residual plot for studentized residuals.
Author Contributions
P.K.: Conceptualization, Investigation, Data Curation, Writing original draft, Visualization; S.F.: Material Synthesis, Characterization; Y.P.: Writing—Review & Editing; M.S.: Validation, Resources, Writing—Review & Editing, Supervision, Funding acquisition; M.A.I.: Methodology, Software, Formal analysis. All authors have read and agreed to the published version of the manuscript.
Funding
This research was funded by MAA-JA VESITEKNIIKAN TUKI.
Acknowledgments
The authors would like to express their gratitude for the financial support provided by the MAA-JA VESITEKNIIKAN TUKI.
Conflicts of Interest
The authors declare no conflict of interest
References
- Yu, X.; Cheng, H.; Zhang, M.; Zhao, Y.; Qu, L.; Shi, G. Graphene-based smart materials. Nat. Rev. Mater. 2017, 2, 1–13. [Google Scholar] [CrossRef]
- Meric, I.; Han, M.Y.; Young, A.F.; Ozyilmaz, B.; Kim, P.; Shepard, K.L. Current saturation in zero-bandgap, top-gated graphene field-effect transistors. Nat. Nanotechnol. 2008, 3, 654–659. [Google Scholar] [CrossRef] [PubMed]
- Rana, F. Electron-hole generation and recombination rates for Coulomb scattering in graphene. Phys. Rev. B 2007, 76, 155431. [Google Scholar] [CrossRef]
- Saba, N.; Alothman, O.Y.; Almutairi, Z.; Jawaid, M.; Asad, M. Introduction of graphene-based nanotechnologies. In Graphene-Based Nanotechnologies Energy Environ; Elsevier: Amsterdam, The Netherlands, 2019; pp. 3–21. [Google Scholar]
- Samarathunga, D.N.; Gunathilake, C.A. Synthesis of Graphene Oxide from Graphite for Water Treatment. 2019. Available online: http://erepo.lib.uwu.ac.lk/bitstream/handle/123456789/239/202.pdf?sequence=1&isAllowed=y (accessed on 7 September 2020).
- Xiang, Q.; Yu, J.; Jaroniec, M. Graphene-based semiconductor photocatalysts. Chem. Soc. Rev. 2012, 41, 782–796. [Google Scholar] [CrossRef] [PubMed]
- Li, H.; Wang, P.; Yi, X.; Yu, H. Edge-selectively amidated graphene for boosting H2-evolution activity of TiO2 photocatalyst. Appl. Catal. B Environ. 2020, 264, 118504. [Google Scholar] [CrossRef]
- Huang, X.; Wang, L.; Zhou, J.; Gao, N. Photocatalytic decomposition of bromate ion by the UV/P25-Graphene processes. Water Res. 2014, 57, 1–7. [Google Scholar] [CrossRef] [PubMed]
- Ganiyu, S.O.; Zhou, M.; Martínez-Huitle, C.A. Heterogeneous electro-Fenton and photoelectro-Fenton processes: A critical review of fundamental principles and application for water/wastewater treatment. Appl. Catal. B Environ. 2018, 235, 103–129. [Google Scholar] [CrossRef]
- Lee, X.J.; Hiew BY, Z.; Lai, K.C.; Lee, L.Y.; Gan, S.; Thangalazhy-Gopakumar, S.; Rigby, S. Review on graphene and its derivatives: Synthesis methods and potential industrial implementation. J. Taiwan Inst. Chem. Eng. 2019, 98, 163–180. [Google Scholar] [CrossRef]
- Liu, C.; Wang, K.; Luo, S.; Tang, Y.; Chen, L. Direct electrodeposition of graphene enabling the one-step synthesis of graphene–metal nanocomposite films. Small 2011, 7, 1203–1206. [Google Scholar] [CrossRef]
- Zhang, Y.; Hao, H.; Wang, L. Effect of morphology and defect density on electron transfer of electrochemically reduced graphene oxide. Appl. Surf. Sci. 2016, 390, 385–392. [Google Scholar] [CrossRef]
- Hilder, M.; Winther-Jensen, B.; Li, D.; Forsyth, M.; MacFarlane, D.R. Direct electro-deposition of graphene from aqueous suspensions. Phys. Chem. Chem. Phys. 2011, 13, 9187–9193. [Google Scholar] [CrossRef] [PubMed]
- Li, W.; Liu, J.; Yan, C. Reduced graphene oxide with tunable C/O ratio and its activity towards vanadium redox pairs for an all vanadium redox flow battery. Carbon 2013, 55, 313–320. [Google Scholar] [CrossRef]
- Zhang, Y.; Cui, W.; An, W.; Liu, L.; Liang, Y.; Zhu, Y. Combination of photoelectrocatalysis and adsorption for removal of bisphenol A over TiO2-graphene hydrogel with 3D network structure. Appl. Catal. B Environ. 2018, 221, 36–46. [Google Scholar] [CrossRef]
- Tseng, I.H.; Liu, Z.C.; Chang, P.Y. Bio-friendly titania-grafted chitosan film with biomimetic surface structure for photocatalytic application. Carbohydr. Polym. 2020, 230, 115584. [Google Scholar] [CrossRef] [PubMed]
- Gray, K.M.; Liba, B.D.; Wang, Y.; Cheng, Y.; Rubloff, G.W.; Bentley, W.E.; David, L.; Montembault, A.; Royaud, I.; Payne, G.F. Electrodeposition of a biopolymeric hydrogel: Potential for one-step protein electroaddressing. Biomacromolecules 2012, 13, 1181–1189. [Google Scholar] [CrossRef] [PubMed]
- Cheng, Y.; Luo, X.; Betz, J.; Buckhout-White, S.; Bekdash, O.; Payne, G.F.; Bentley, W.E.; Rubloff, G.W. In situ quantitative visualization and characterization of chitosan electrodeposition with paired sidewall electrodes. Soft Matter 2010, 6, 3177–3183. [Google Scholar] [CrossRef]
- Zhao, P.; Liu, Y.; Xiao, L.; Deng, H.; Du, Y.; Shi, X. Electrochemical deposition to construct a nature inspired multilayer chitosan/layered double hydroxides hybrid gel for stimuli responsive release of protein. J. Mater. Chem. B 2015, 3, 7577–7584. [Google Scholar] [CrossRef]
- Ghach, W.; Etienne, M.; Billard, P.; Jorand, F.P.; Walcarius, A. Electrochemically assisted bacteria encapsulation in thin hybrid sol–gel films. J. Mater. Chem. B 2013, 1, 1052–1059. [Google Scholar] [CrossRef]
- Chen, X.; Liang, Y.; Wan, L.; Xie, Z.; Easton, C.D.; Bourgeois, L.; Wang, Z.; Bao, Q.; Zhu, Y.; Tao, S.; et al. Construction of porous N-doped graphene layer for efficient oxygen reduction reaction. Chem. Eng. Sci. 2019, 194, 36–44. [Google Scholar] [CrossRef]
- Primo, A.; Forneli, A.; Corma, A.; García, H. From biomass wastes to highly efficient CO2 adsorbents: Graphitisation of chitosan and alginate biopolymers. ChemSusChem 2012, 5, 2207–2214. [Google Scholar] [CrossRef]
- Wategaonkar, S.B.; Pawar, R.P.; Parale, V.G.; Nade, D.P.; Sargar, B.M.; Mane, R.K. Synthesis of rutile TiO2 nanostructures by single step hydrothermal route and its characterization. Mater. Today Proc. 2020, 23, 444–451. [Google Scholar] [CrossRef]
- Frindy, S.; Primo, A.; Bouhfid, R.; Lahcini, M.; Garcia, H.; Bousmina, M.; El Kadib, A. Insightful understanding of the role of clay topology on the stability of biomimetic hybrid chitosan-clay thin films and CO2-dried porous aerogel microspheres. Carbohydr. Polym. 2016, 146, 353–361. [Google Scholar] [CrossRef] [PubMed]
- Sun, Q.; Huston, L.Q.; Tang, C.; Wei, L.L.; Sheppard, L.R.; Chen, H.; Frankcombe, T.J.; Bradby, J.E.; Liu, Y. Chemical Synthesis and High Pressure Reaction of Nb5+ Mono-Doped Rutile TiO2 Nanocrystals. J. Phys. Chem. C 2020. [Google Scholar] [CrossRef]
- Kaur, P.; Kushwaha, J.P.; Sangal, V.K. Electrocatalytic oxidative treatment of real textile wastewater in continuous reactor: Degradation pathway and disposability study. J. Hazard. Mater. 2018, 346, 242–252. [Google Scholar] [CrossRef] [PubMed]
- Asfaram, A.; Ghaedi, M.; Agarwal, S.; Tyagi, I.; Gupta, V.K. Removal of basic dye Auramine-O by ZnS: Cu nanoparticles loaded on activated carbon: Optimization of parameters using response surface methodology with central composite design. RSC Adv. 2015, 5, 18438–18450. [Google Scholar] [CrossRef]
- Wu, Z.; Zhou, Z.; Zhang, Y.; Wang, J.; Shi, H.; Shen, Q.; Wei, G.; Zhao, G. Simultaneous photoelectrocatalytic aromatic organic pollutants oxidation for hydrogen production promotion with a self-biasing photoelectrochemical cell. Electrochim. Acta 2017, 254, 140–147. [Google Scholar] [CrossRef]
- Pouran, S.R.; Raman, A.A.A.; Daud, W.M.A.W. Review on the application of modified iron oxides as heterogeneous catalysts in Fenton reactions. J. Clean. Prod. 2014, 64, 24–35. [Google Scholar] [CrossRef]
- Behfar, R.; Davarnejad, R. Pharmaceutical wastewater treatment using UV-enhanced electro-Fenton process: Comparative study. Water Environ. Res. 2019, 91, 1526–1536. [Google Scholar] [CrossRef]
- Bessegato, G.G.; Cardoso, J.C.; Da Silva, B.F.; Zanoni MV, B. Combination of photoelectrocatalysis and ozonation: A novel and powerful approach applied in Acid Yellow 1 mineralization. Appl. Catal. B Environ. 2016, 180, 161–168. [Google Scholar] [CrossRef]
- Berger, T.; Lana-Villarreal, T.; Monllor-Satoca, D.; Gómez, R. Charge transfer reductive doping of nanostructured TiO2 thin films as a way to improve their photoelectrocatalytic performance. Electrochem. Commun. 2006, 8, 1713–1718. [Google Scholar] [CrossRef]
- Lin, P.; Shen, J.; Tang, H.; Lin, Z.; Jiang, Y. Enhanced photocatalytic H2 evolution of ultrathin g-C3N4 nanosheets via surface shuttle redox. J. Alloys Compd. 2019, 810, 151918. [Google Scholar] [CrossRef]
- Yang, L.; Li, Z.; Jiang, H.; Jiang, W.; Su, R.; Luo, S.; Luo, Y. Photoelectrocatalytic oxidation of bisphenol A over mesh of TiO2/graphene/Cu2O. Appl. Catal. B Environ. 2016, 183, 75–85. [Google Scholar] [CrossRef]
- Lacasa, E.; Cañizares, P.; Rodrigo, M.A.; Fernández, F.J. Electro-oxidation of As (III) with dimensionally-stable and conductive-diamond anodes. J. Hazard. Mater. 2012, 203, 22–28. [Google Scholar] [CrossRef] [PubMed]
- Jang, J.; Kim, T.; Kim, G.Y.; Yoon, D.; Lee, S. Uranium recovery via electrochemical deposition with a liquid zinc cathode followed by electrochemical oxidation of rare earth metals. J. Nucl. Mater. 2019, 520, 245–251. [Google Scholar] [CrossRef]
- Zhou, Y.; Schulz, S.; Lindoy, L.F.; Du, H.; Zheng, S.; Wenzel, M.; Weigand, J.J. Separation and recovery of rare earths by in situ selective electrochemical oxidation and extraction from spent fluid catalytic cracking (FCC) catalysts. Hydrometallurgy 2020, 105300. [Google Scholar] [CrossRef]
- Kaur, P.; Kushwaha, J.P.; Sangal, V.K. Transformation products and degradation pathway of textile industry wastewater pollutants in Electro-Fenton process. Chemosphere 2018, 207, 690–698. [Google Scholar] [CrossRef]
- Fouad, D.E.; Zhang, C.; El-Didamony, H.; Yingnan, L.; Mekuria, T.D.; Shah, A.H. Improved size, morphology and crystallinity of hematite (α-Fe2O3) nanoparticles synthesized via the precipitation route using ferric sulfate precursor. Results Phys. 2019, 12, 1253–1261. [Google Scholar] [CrossRef]
- Stanjek, H. XRD peak migration and apparent shift of cell-edge lengths of nano-sized hematite, goethite and lepidocrocite. Clay Miner. 2002, 37, 629–638. [Google Scholar] [CrossRef]
- Dashtimoghadam, E.; Hasani-Sadrabadi, M.M.; Moaddel, H. Structural modification of chitosan biopolymer as a novel polyelectrolyte membrane for green power generation. Polym. Adv. Technol. 2010, 21, 726–734. [Google Scholar] [CrossRef]
- Chang, R.; Ma, S.; Guo, X.; Xu, J.; Zhong, C.; Huang, R.; Ma, J. Hierarchically Assembled Graphene Oxide Composite Membrane with Self-Healing and High-Efficiency Water Purification Performance. ACS Appl. Mater. Interfaces 2019, 11, 46251–46260. [Google Scholar] [CrossRef]
- Kumar, S.; Ye, F.; Dobretsov, S.; Dutta, J. Chitosan nanocomposite coatings for food, paints, and water treatment applications. Appl. Sci. 2019, 9, 2409. [Google Scholar] [CrossRef]


© 2020 by the authors. Licensee MDPI, Basel, Switzerland. This article is an open access article distributed under the terms and conditions of the Creative Commons Attribution (CC BY) license (http://creativecommons.org/licenses/by/4.0/).