Article

A High-Throughput Screening Approach to Identify New Active and Long-Term Stable Catalysts for Total Oxidation of Methane from Gas-Fueled Lean–Burn Engines

1
Technische Universität Chemnitz, Fakultät für Naturwissenschaften, Institut für Chemie, Professur Chemische Technologie, Straße der Nationen 62, 09111 Chemnitz, Germany
2
Heraeus Deutschland GmbH & Co. KG, Heraeusstr. 12 - 14, 63450 Hanau, Germany
*
Author to whom correspondence should be addressed.
Catalysts 2020, 10(2), 159; https://doi.org/10.3390/catal10020159
Submission received: 18 December 2019 / Revised: 8 January 2020 / Accepted: 20 January 2020 / Published: 1 February 2020
(This article belongs to the Special Issue Catalytic Concepts for Methane Combustion)

Abstract

:
A unique high-throughput approach to identify new catalysts for total oxidation of methane from the exhaust gas of biogas-operated lean-burn engines is presented. The approach consists of three steps: (1) A primary screening using emission-corrected Infrared Thermography (ecIRT). (2) Validation in a conventional plug flow gas phase reactor using a model exhaust gas containing CH4, O2, CO, CO2, NO, NO2, N2O, SO2, H2O. (3) Ageing tests using a simplified exhaust gas (CH4, O2, CO2, SO2, H2O). To demonstrate the efficiency of this approach, one selected dataset with a sol-gel-based catalysts is presented. Compositions are 3 at.% precious metals (Pt, Rh) combined with different amounts of Al, Mn, and Ce in the form of mixed oxides. To find new promising materials for the abatement of methane, about two thousand different compositions were synthesized and ranked using ecIRT, and several hundred were characterized using a plug flow reactor and their ageing behaviour was determined.

Graphical Abstract

1. Introduction

Methane is a readily available resource, e.g., from natural gas or from biogas, but also occurs in other instances, e.g., landfill gas and mine gas. Agriculture, especially livestock, is said to account for about 40% to 50% of total CH4 emission [1].
Because of its abundance, methane has many applications. It can be used to power engines in transportation, to generate electricity, and for heating.
Emissions from agriculture can, despite improving technologies, usually not be reduced with the same techniques that are used in industrial environments, and are, therefore, not further discussed in this paper.
Methane has a global warming potential (greenhouse effect) that is said to be 10–86 times higher than carbon dioxide, therefore, methane emissions should be reduced [2,3]. Methane-emitting sources have various gas compositions and other process values that affect possible methods to reduce emission. Some of these parameters—among others—are gas temperature, emitted volume, and steady-state/cyclic operation. Different situations demand individual approaches to handle methane emissions; in larger applications (e.g., large chemical plants), a torch might be feasible, whereas in smaller applications (e.g., transportation sector), a catalytic converter is likely to be better suited. The catalytic total oxidation of methane has been in the focus of research for quite some time [4,5]. Many recent publications focus on palladium-containing catalysts [6,7,8,9,10,11,12,13,14,15,16,17,18,19,20,21,22,23,24,25,26,27,28,29,30,31,32,33,34,35,36,37,38] or try to find other precious metal (PM) [12,39,40,41,42,43,44,45] and PM-free catalysts [46,47,48,49,50,51,52,53,54,55].
Our research is closely related to biogas-operated combined heat and power plants (CHPs). The number of biogas-operated CHPs in Germany has increased by a factor of almost three in the last decade [56]. These plants often use a lean-operated gas engine. The lean operation results in better efficiency, but results in methane-containing exhaust gases. To the best of our knowledge, there are no legal regulations applicable in August 2019 for methane emission from biogas operated plants in Germany. A reason for this might be the lack of a stable industrial applicable catalytic system to eliminate the methane slip of the engines. The challenge for methane abatement in the presented case is the high amount of H2O as well as other by-products from combustion in the exhaust gas. Therefore, research aims to discover new suitable compositions for the abatement of methane from a biogas-operated CHPs.
In this paper, we describe our high-throughput approach to discover new promising materials for application as catalysts in methane abatement. The basic principle as well as results from a first generation of samples have been described previously [42]. Based on the experiences from the first iteration of our high-throughput cycle, we designed a second generation, where we added an additional PM as well as another additional chemical element to check for beneficial effects. A finer granularity of elemental composition in our second generation allowed us to better check for local catalytic performance maxima. In this paper, we focus on one subset from the second generation to promote the efficiency with witch we can investigate a large number of samples and find promising samples.
Using a high-throughput approach usually involves a cycle containing four steps. First, in design of experiment, samples and compositions to be tested are defined. Synthesis of the samples in a suitable and fast way, often automated, is the second step. The third step is to test these samples for desired properties, like catalytic performance or stability. Tests might be carried out with different levels of detail, a low level of detail screening (primary screening) might be followed by one or more in-depth analyses (secondary screening, tertiary screening, etc.). The primary screening can be used to quickly separate between potentially promising combinations of parameters and materials, which are further investigated (so called hits) and less promising samples. The last step is to use the obtained data to generate knowledge, often called data mining. This cycle can be repeated multiple times if necessary; hit compositions from the first iteration will be used for the design of experiments of following generations. More details about high-throughput screening (HTS), or high-throughput in general, are described in detail elsewhere [57].
First of all, we describe our design of experiment; our synthesis methods as well as our high-throughput primary screening using emission-corrected Infrared Thermography (ecIRT). Promising materials are validated in a conventional plug-flow gas phase reactor and measurements regarding ageing stability are done for promising materials.

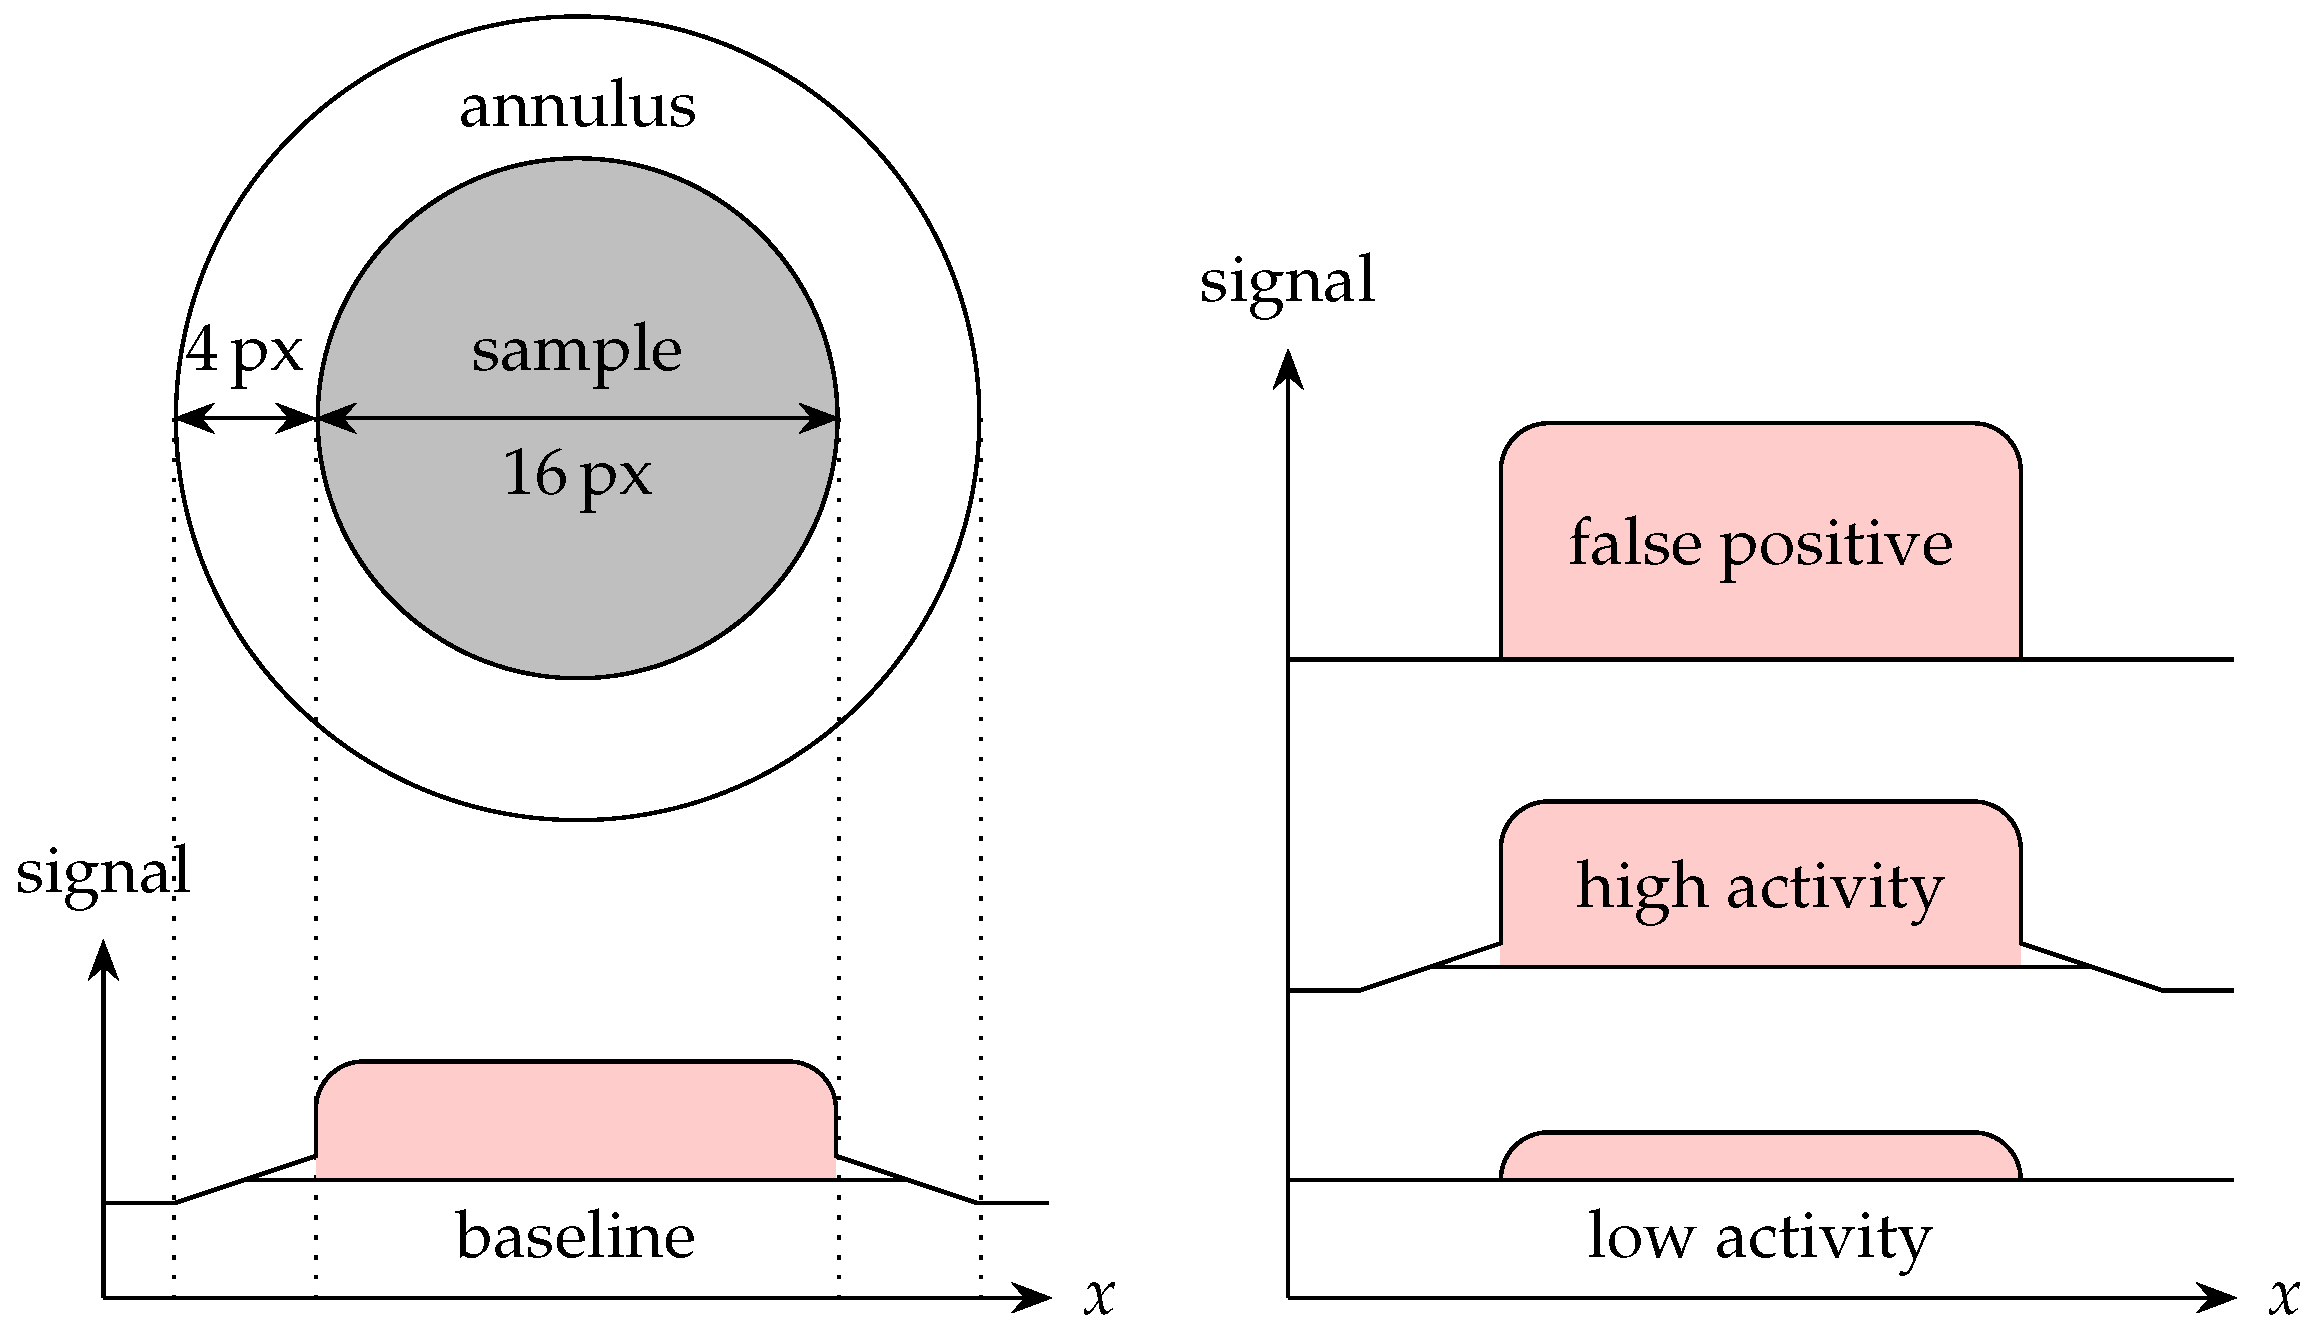
1.1. Principle of ecIRT Measurement

The principles of this method including advantages, disadvantages and possible errors, have been described in detail in previous publications [58,59,60,61]. Nevertheless, we will give a short overview here. Bodies in this study are assumed to be emitting radiation based on their temperature. This radiation can be described by Kirchhoff’s law of thermal radiation, Planck’s law and Stefan–Boltzmann law. The radiation of a real body can be described using a black body as a model system and a coefficient describing the “imperfection” of a real body. The factor connecting both is called emissivity ε . It is possible to correct for the different individual emissivities of each sample by calibration. To make the temperature differences under reaction conditions visible, typically, the difference between an image recorded under an inert atmosphere is subtracted from an image recorded under the reaction atmosphere. Combining this differential image with the temperature calibration mentioned previously resulted in an ecIRT image. A custom color scale can be applied to those images to differentiate between areas. The jet colormap as well as a cubehelix colormap have been used, each having different advantages and drawbacks [62,63].
Our catalysts oxidize methane, which is a highly exothermic reaction ( Δ R H = 802.3 k J / mol ). The heat created will heat up the catalyst and, due to heat transport, also the surrounding slate library plate. We were using an in-house developed software called IRTestRig to perform calculations from the recorded image files like subtraction or emissivity correction as well as Δ T computation [64]. The computation procedure for Δ T uses an annulus around each sample well to get a baseline for the integration, integrates the sample area and calculates an average value for temperature change Δ T for each sample. The resulting value and the obtained image are used to compare different samples and rank them to select samples that might be suitable for further investigations. This method is, therefore, a truly parallel HTS method, useful for primary screening of catalytic activities based on reaction heat. A scheme displaying this principle as well as three possibilities for classification of different samples is displayed in Figure 1. Low activity samples can be easily identified by a low Δ T value and no temperature increase in the surrounding area. Therefore, those samples will neither be highlighted in the obtained ecIRT image nor due to Δ T value. High activity samples have a high Δ T value and a temperature increase of the slate library plate surrounding the sample can also be observed in the ecIRT image. False positive samples have a high Δ T value, but no temperature increase around the sample can be observed in the ecIRT image. False negative samples in which thermal effects and emissivity change are of opposite sign or compensate each other, resulting in low or even negative Δ T values, are possible. Nevertheless, they should still be visible on ecIRT images due to temperature increase around the sample. Therefore, ranking samples based only on their Δ T value might be misleading, resulting in misleading conclusions.

2. Results

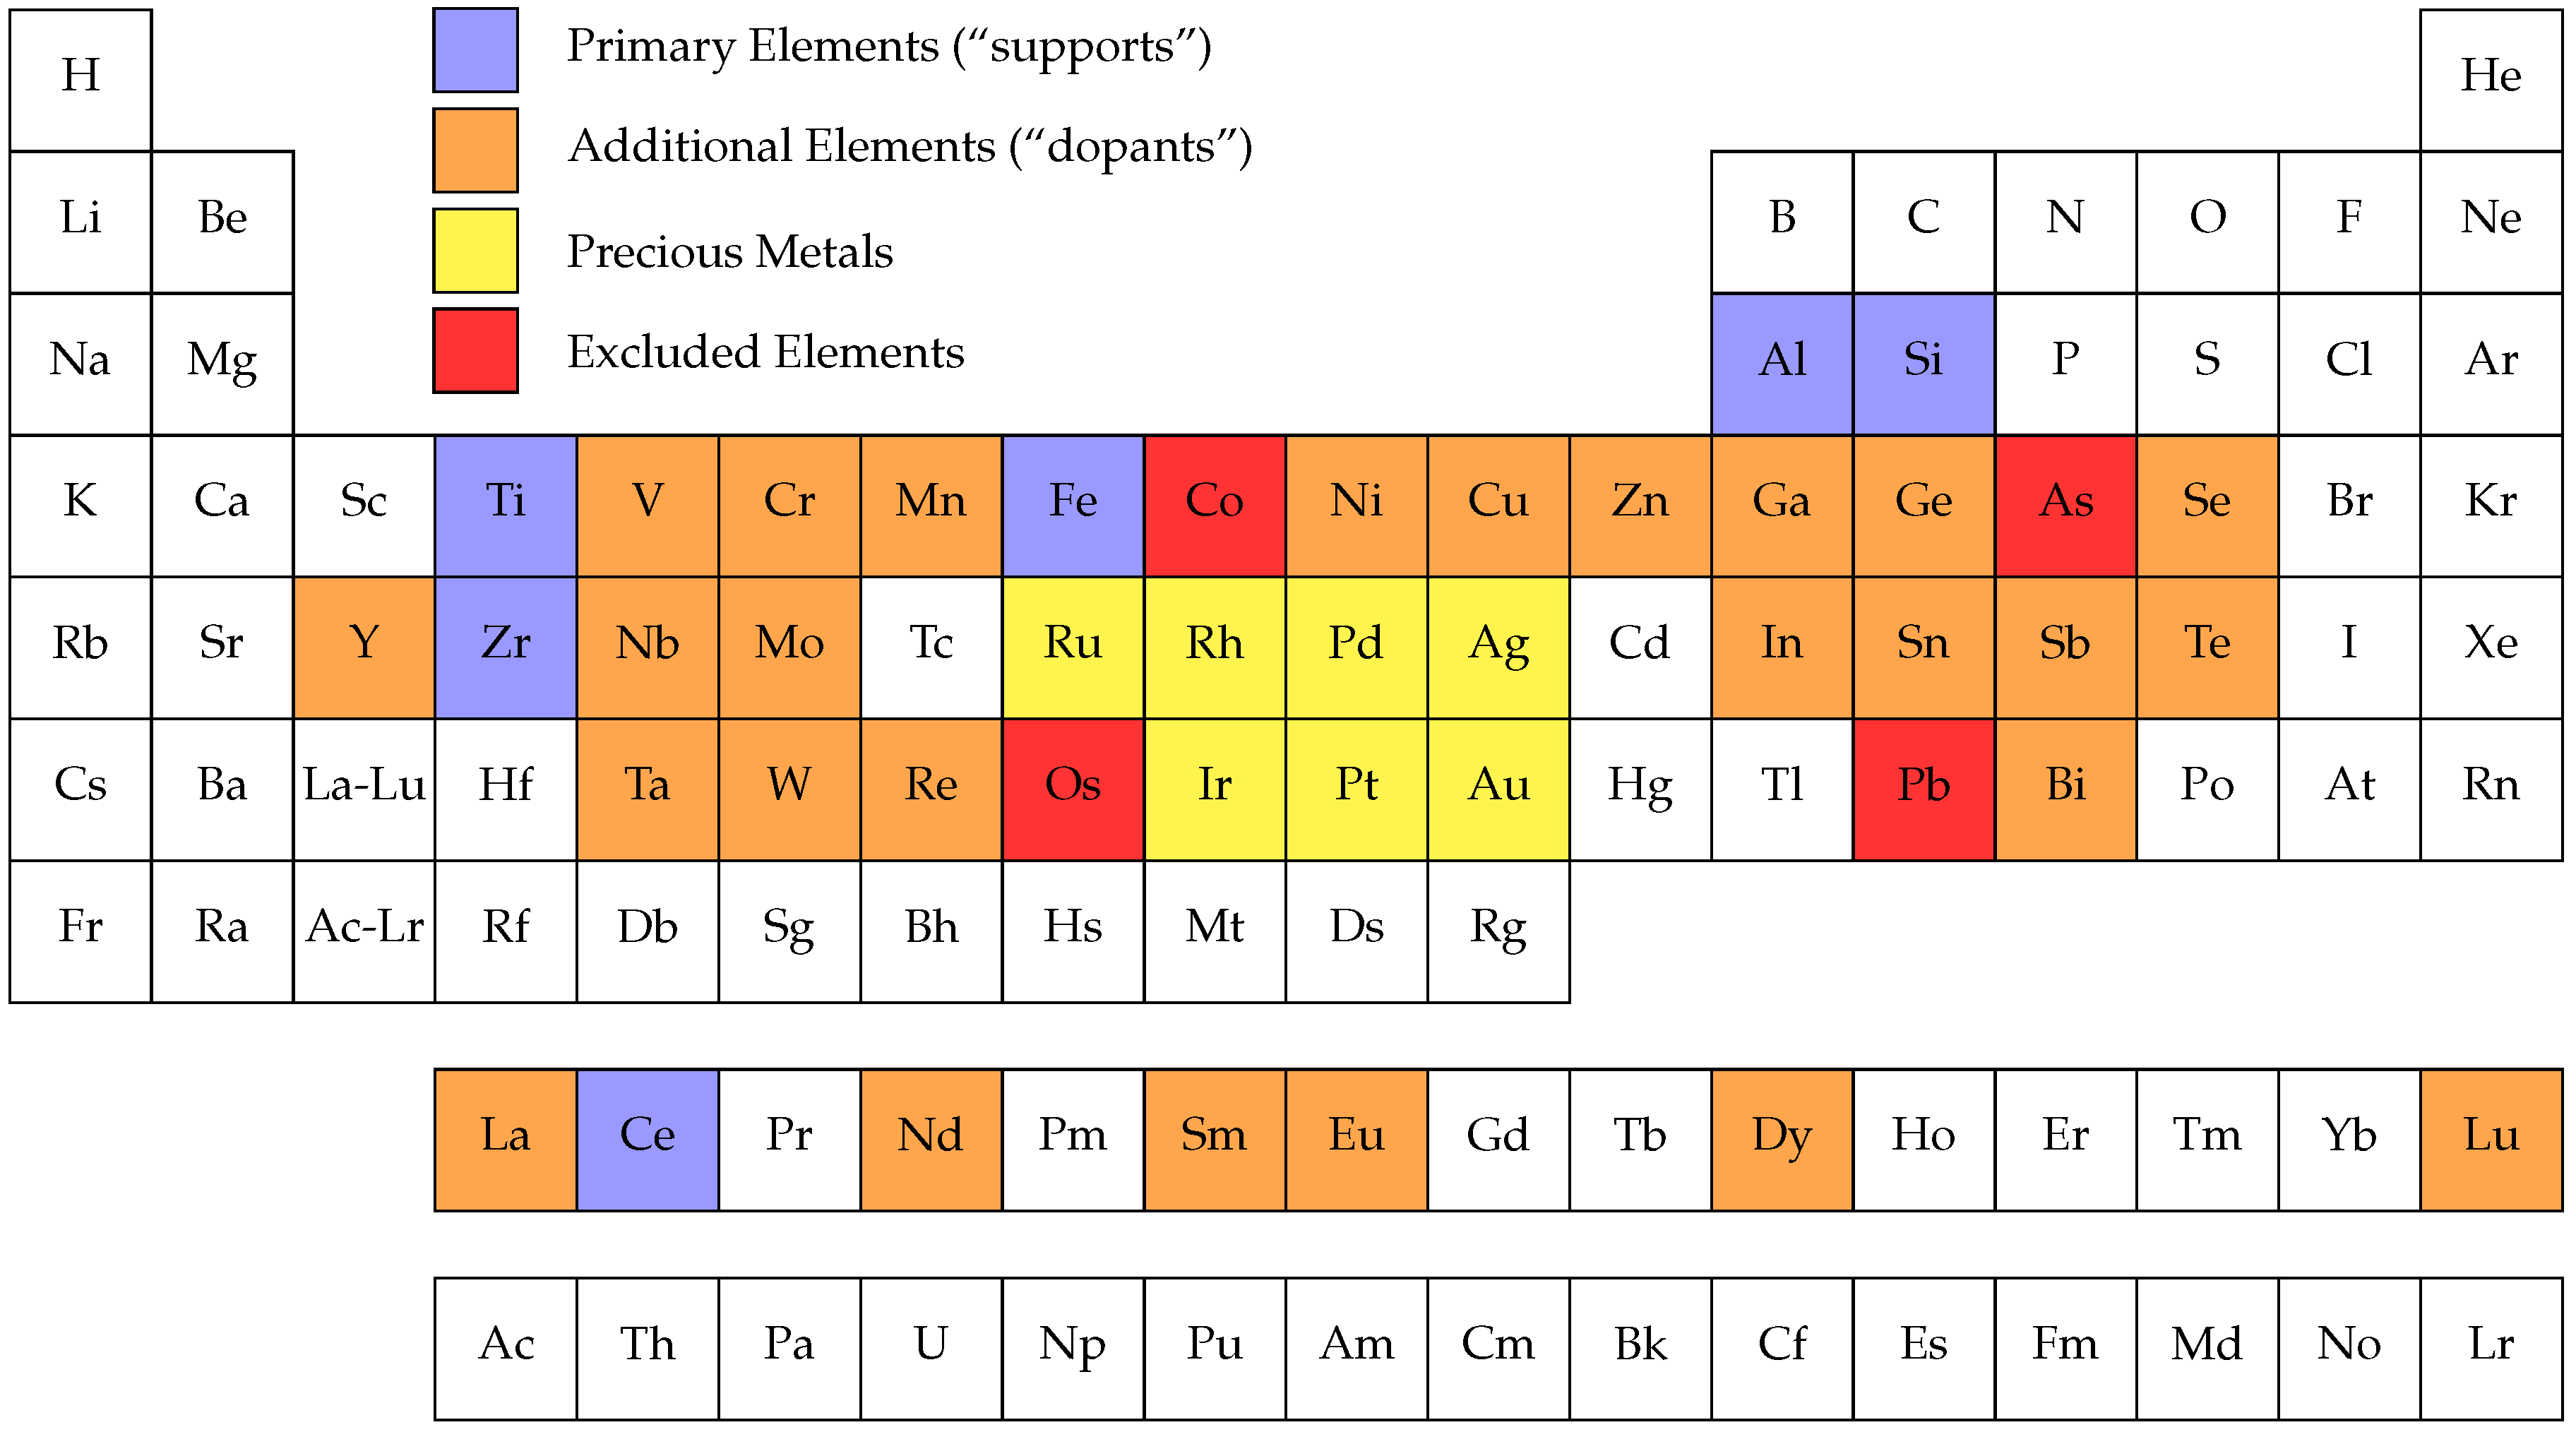
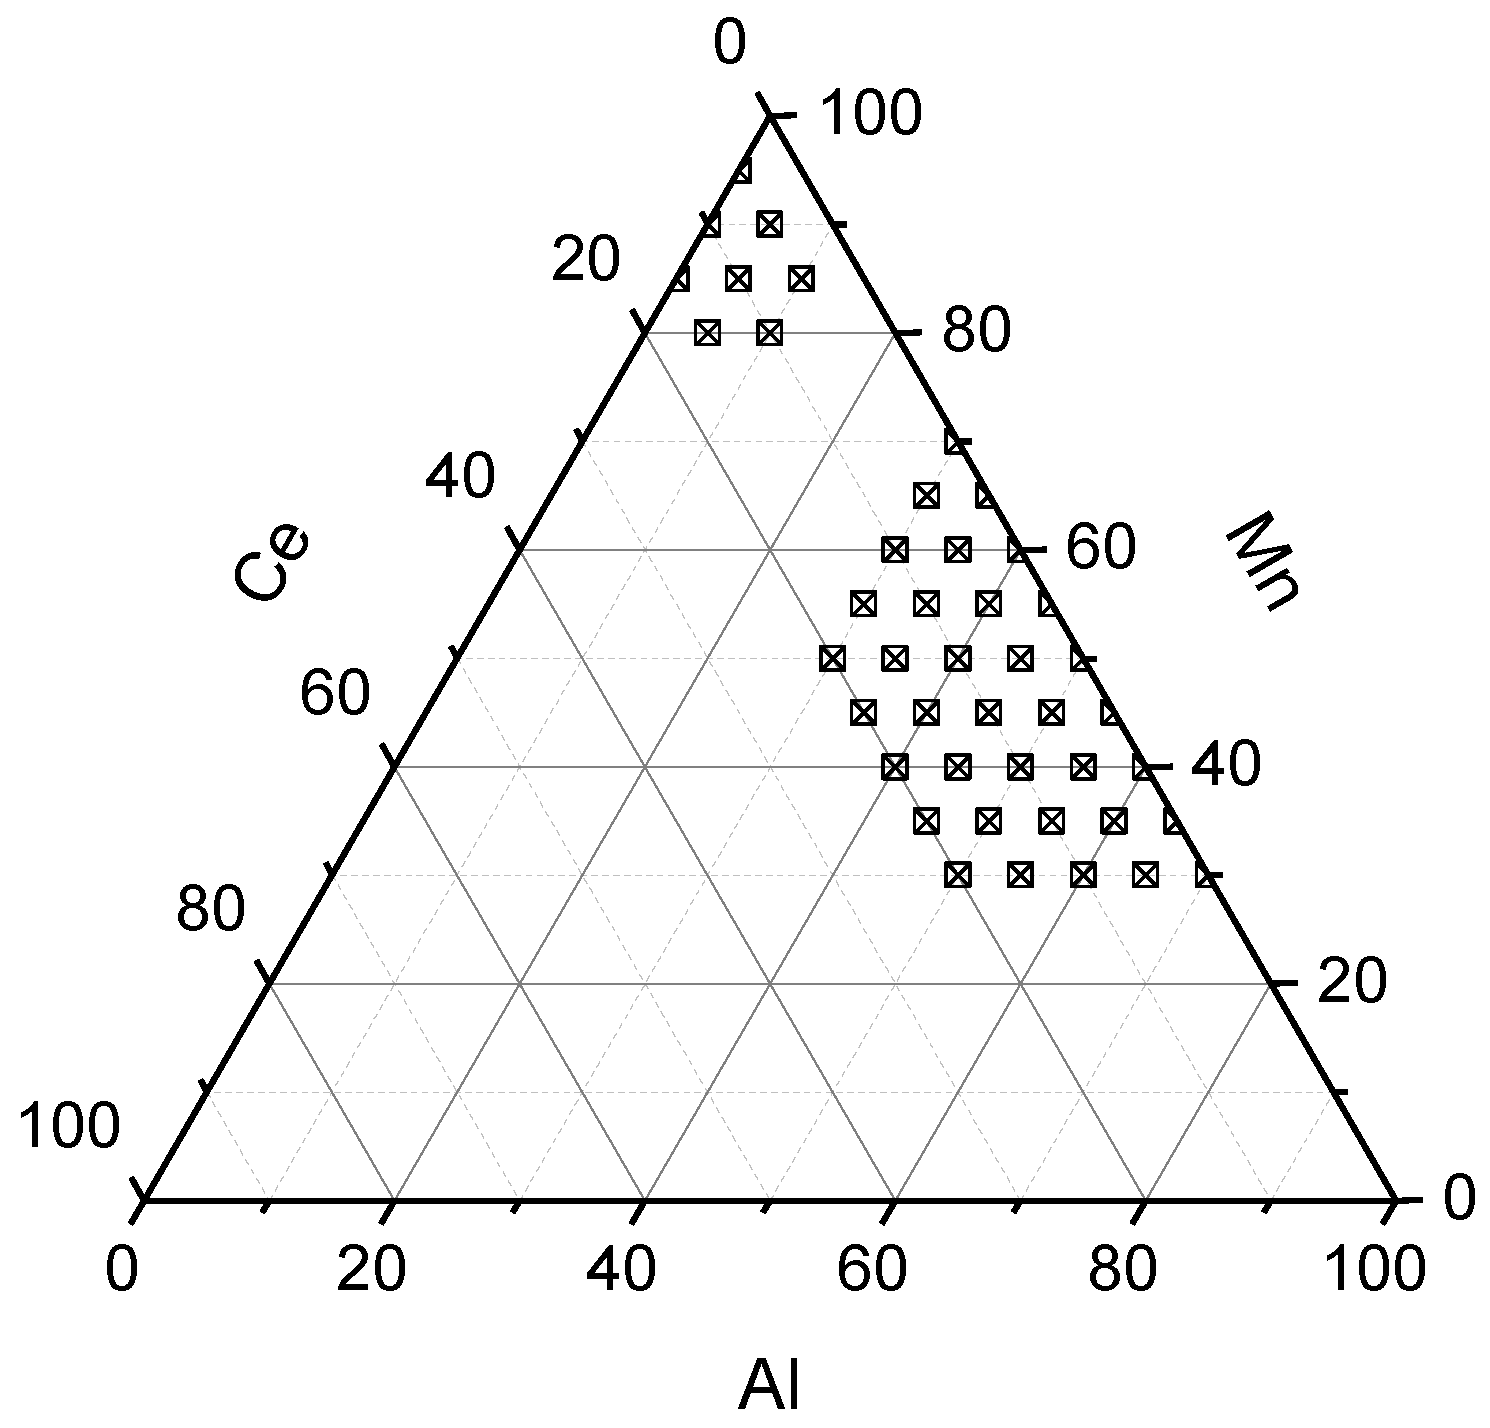
2.1. Design of Experiment

There are some promising material combinations known for total oxidation of methane, but most of them lack long-term stability or performance. Therefore, our approach was to perform a fundamental search for new catalysts based on HTS techniques. We decided to define our compositions based on the following observations:
  • Many industrial catalysts are based on a few substrates—e.g., Al2O3, TiO2 or SiO2.
  • Doping with additional elements often increases performance or stability.
  • PM or PM based species are the catalytic active species in many oxidation reactions.
Based on these criteria, we chose suitable primary elements, additional elements, and PMs as depicted in Figure 2. Co, As, Os, and Pb are excluded due to toxicity of these elements, e.g., Os forms volatile and hazardous OsO4.
In preliminary work reported previously, the first generation of samples has been described [42]. A total of 156 PM free compositions (one out of seven primary elements combined with one out of 26 additional elements with equal molar amounts; not all samples could be tested) were synthesized. Adding one out of seven PMs to the 156 combinations that have been successfully synthesized before resulted in 1092 PM containing samples [42]. These materials are referred to as generation one, containing of one precious metal (3 at.%), one primary element and one additional element (each 48.5 at.%). It is known from the literature that Pd-containing catalysts are more active than those containing Pt. Pd catalysts suffer from rapid deactivation from poisoning with sulfur-containing species, whereas Pt catalysts are more stable to sulfur [12]. Therefore, we selected one subsystem of all investigated compositions and lay the focus of this paper on finding a Pt containing catalyst that is more active than previously reported ones.
Some promising materials have been identified using our high-throughput approach and we decided to combine these materials in a second generation. Second generation materials contain one or two PM with total 3 at.%, and two or three elements from the list of primary and additional elements in variable amounts, totaling to 97 at.%. Some material combinations from the first generation, like Al and Mn containing samples, had promising results. Therefore, these materials were combined with Ce, that had also shown promising results and is known in the literature to improve catalytic performance [4,6,14,15,18,20,21,23,27,29,31,33,34,35,46,50,53]. A composition spread of all three elements has been synthesized to have the highest chance to find a local composition based catalytic performance maximum within the selected system. Therefore, samples selected for a more detailed screening had the general composition PM3AlaMnbCecOx with a , b , c 0 at.% to 97 at.%, 9.7 at.% steps. x depends on preparation conditions and thus cannot be specified. For this reason, samples will be denominated without oxygen in our work. To ease sample denomination further, the constant amount of PM of 3 at.% is not used for calculation of molar ratios for nomenclature, resulting in Pt3 Al10 Mn70 Ce20 for a material with a molar composition of Pt3 Al9.7 Mn67.9 Ce19.4 Ox. The numbers of Al, Mn and Ce in the short notation represent the ratio between the non-PM elements, the PM always was 3 at.%. The molar amount can be calculated by dividing the numbers from the short notation of the three non-PM elements by 100 and multiply by 97 at.%.
Some of our previous results also indicated that samples containing Pt1.5Rh1.5 might have higher catalytic performance compared to samples based on Pt3. Following these two guidelines, we synthesized three library plates, one containing samples for Pt3 Ala Mnb Cec, one with contains samples for Pt1.5Rh1.5 Ala Mnb Cec, and Pt3 Ala Mnb Cec, and one which contains samples for Pt1.5Rh1.5 Ala Mnb Cec.

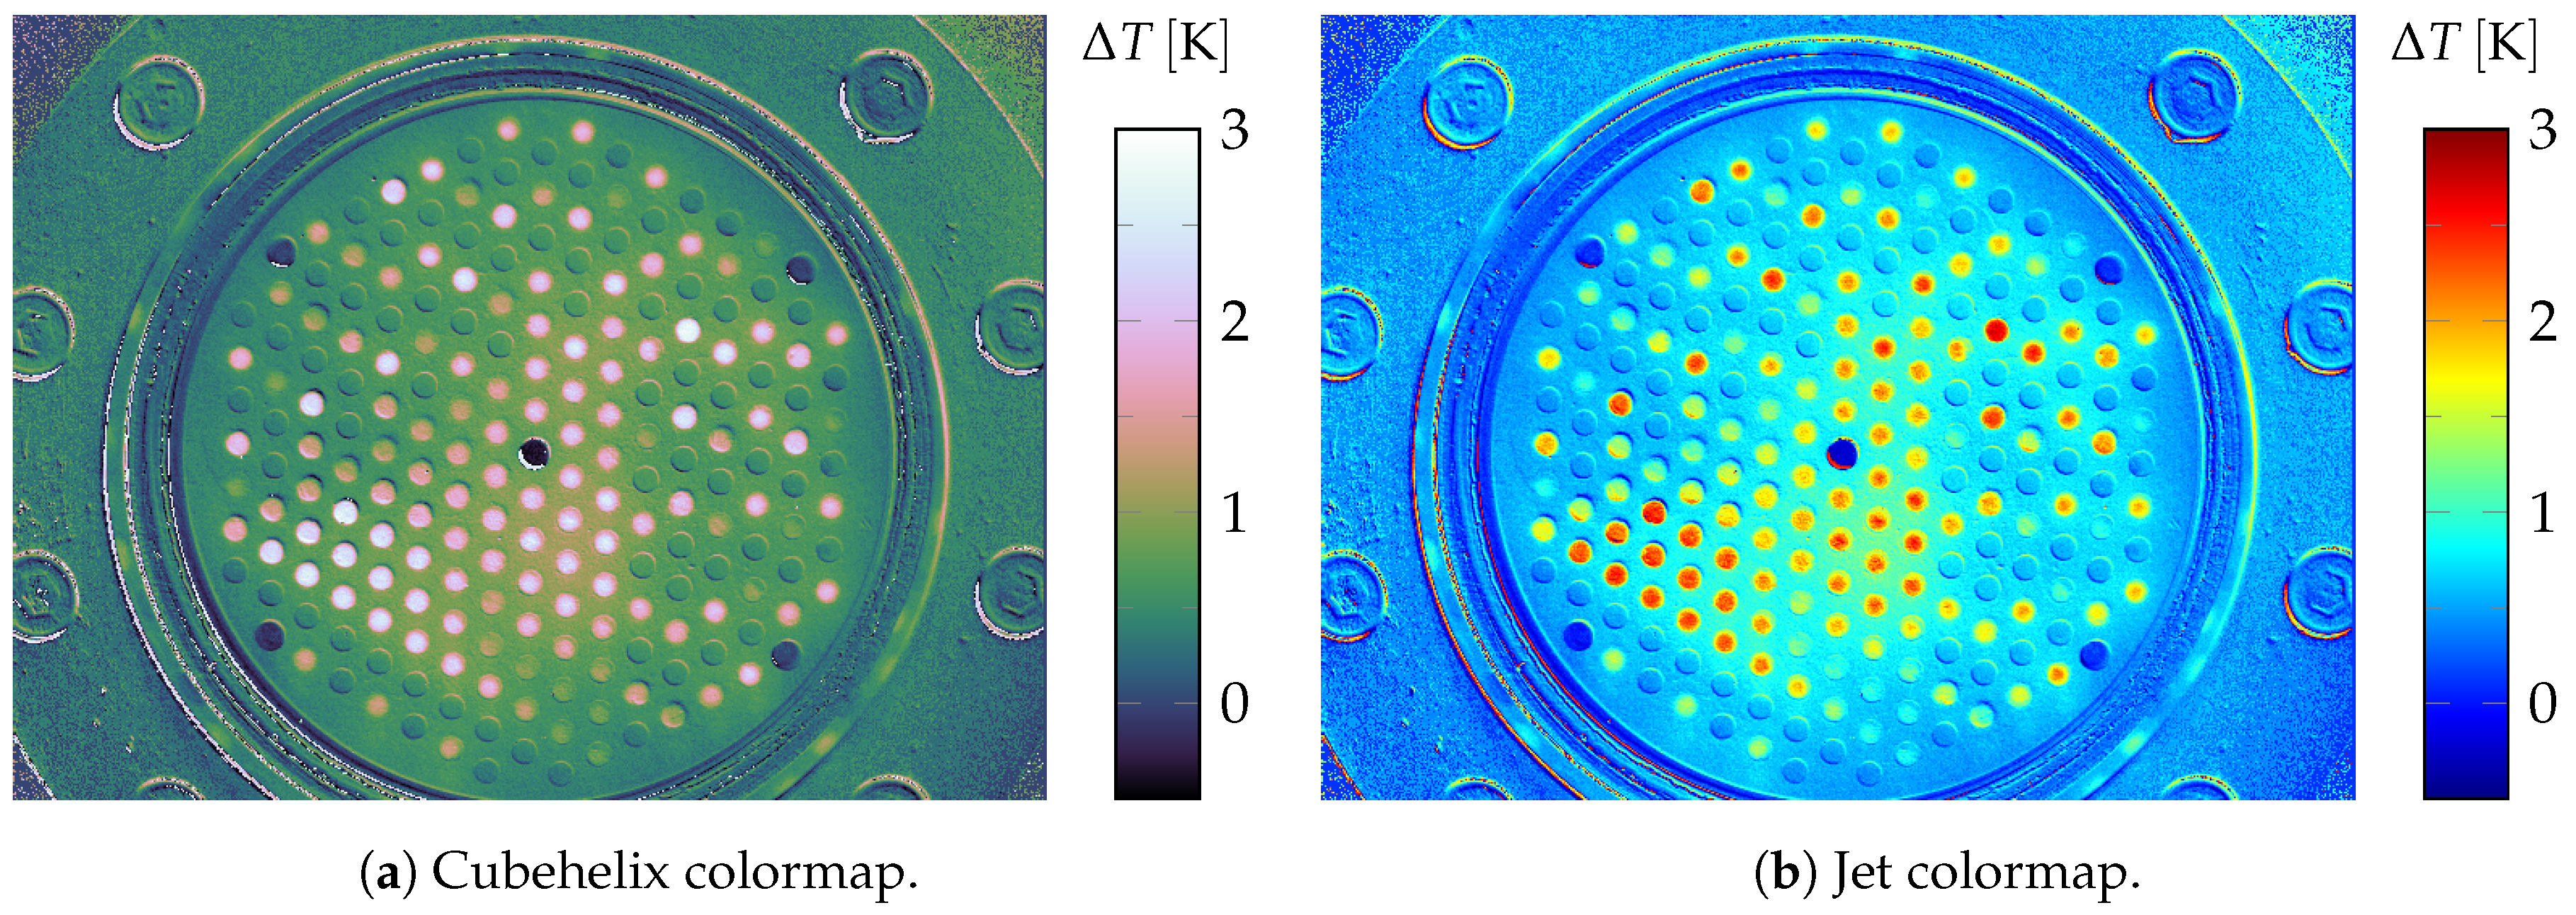
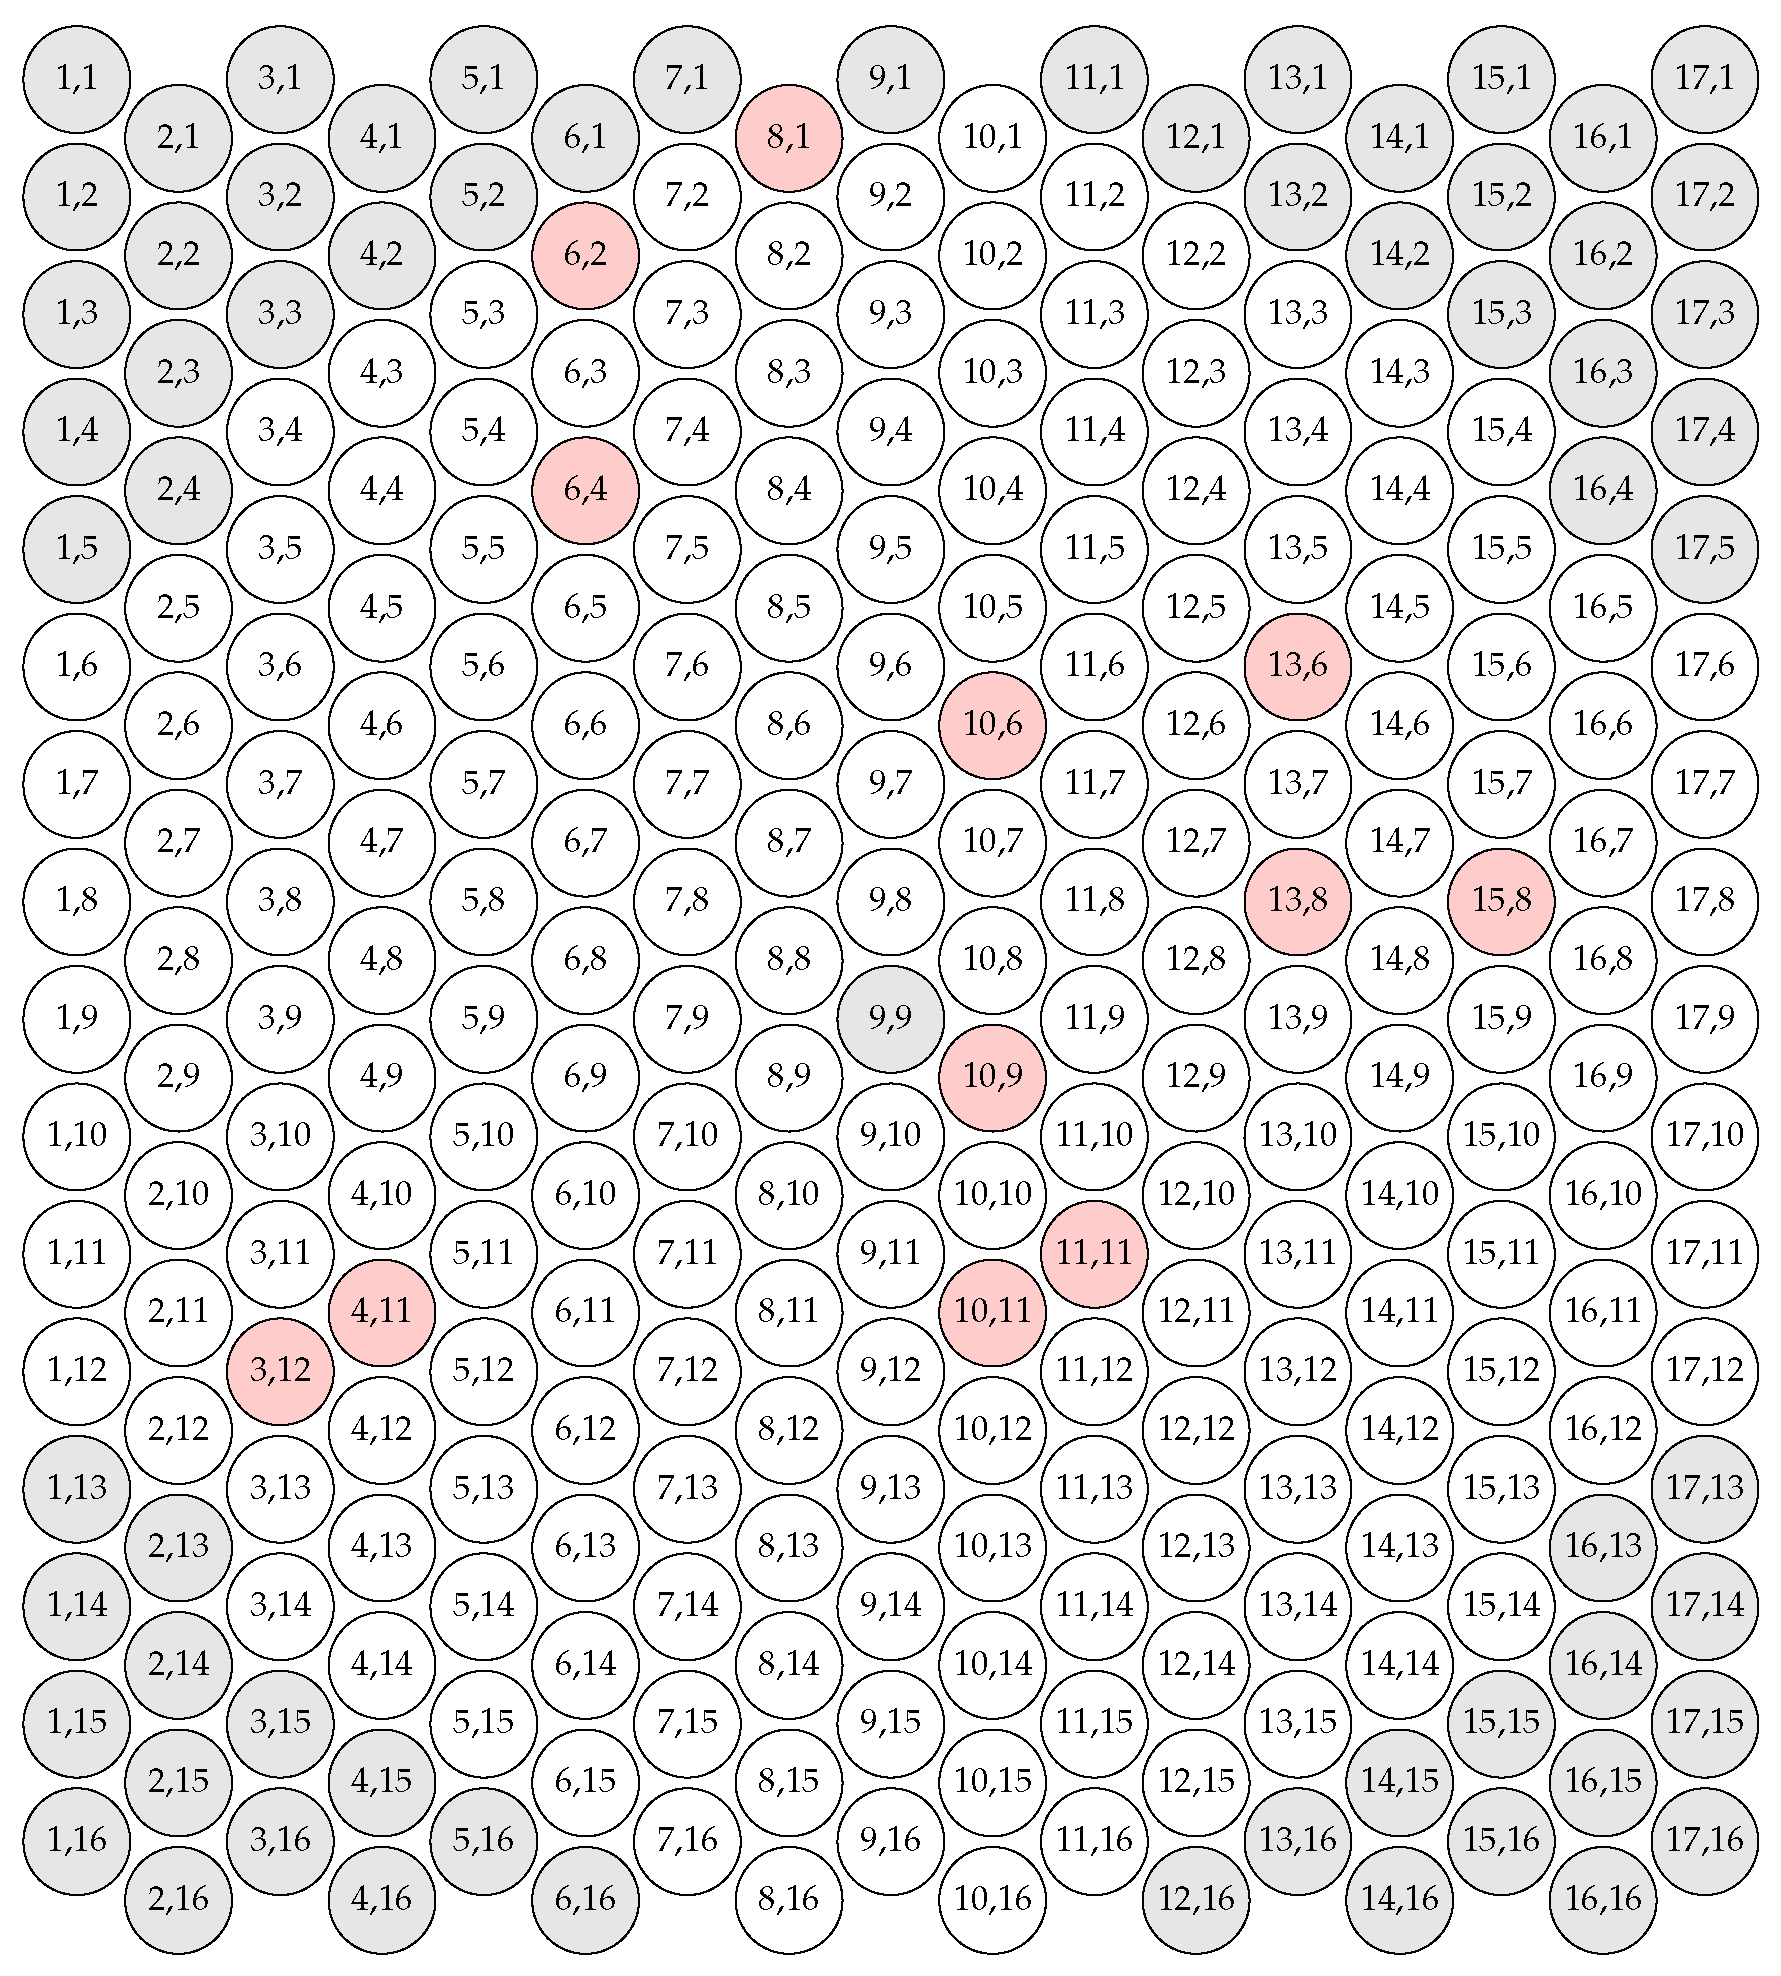
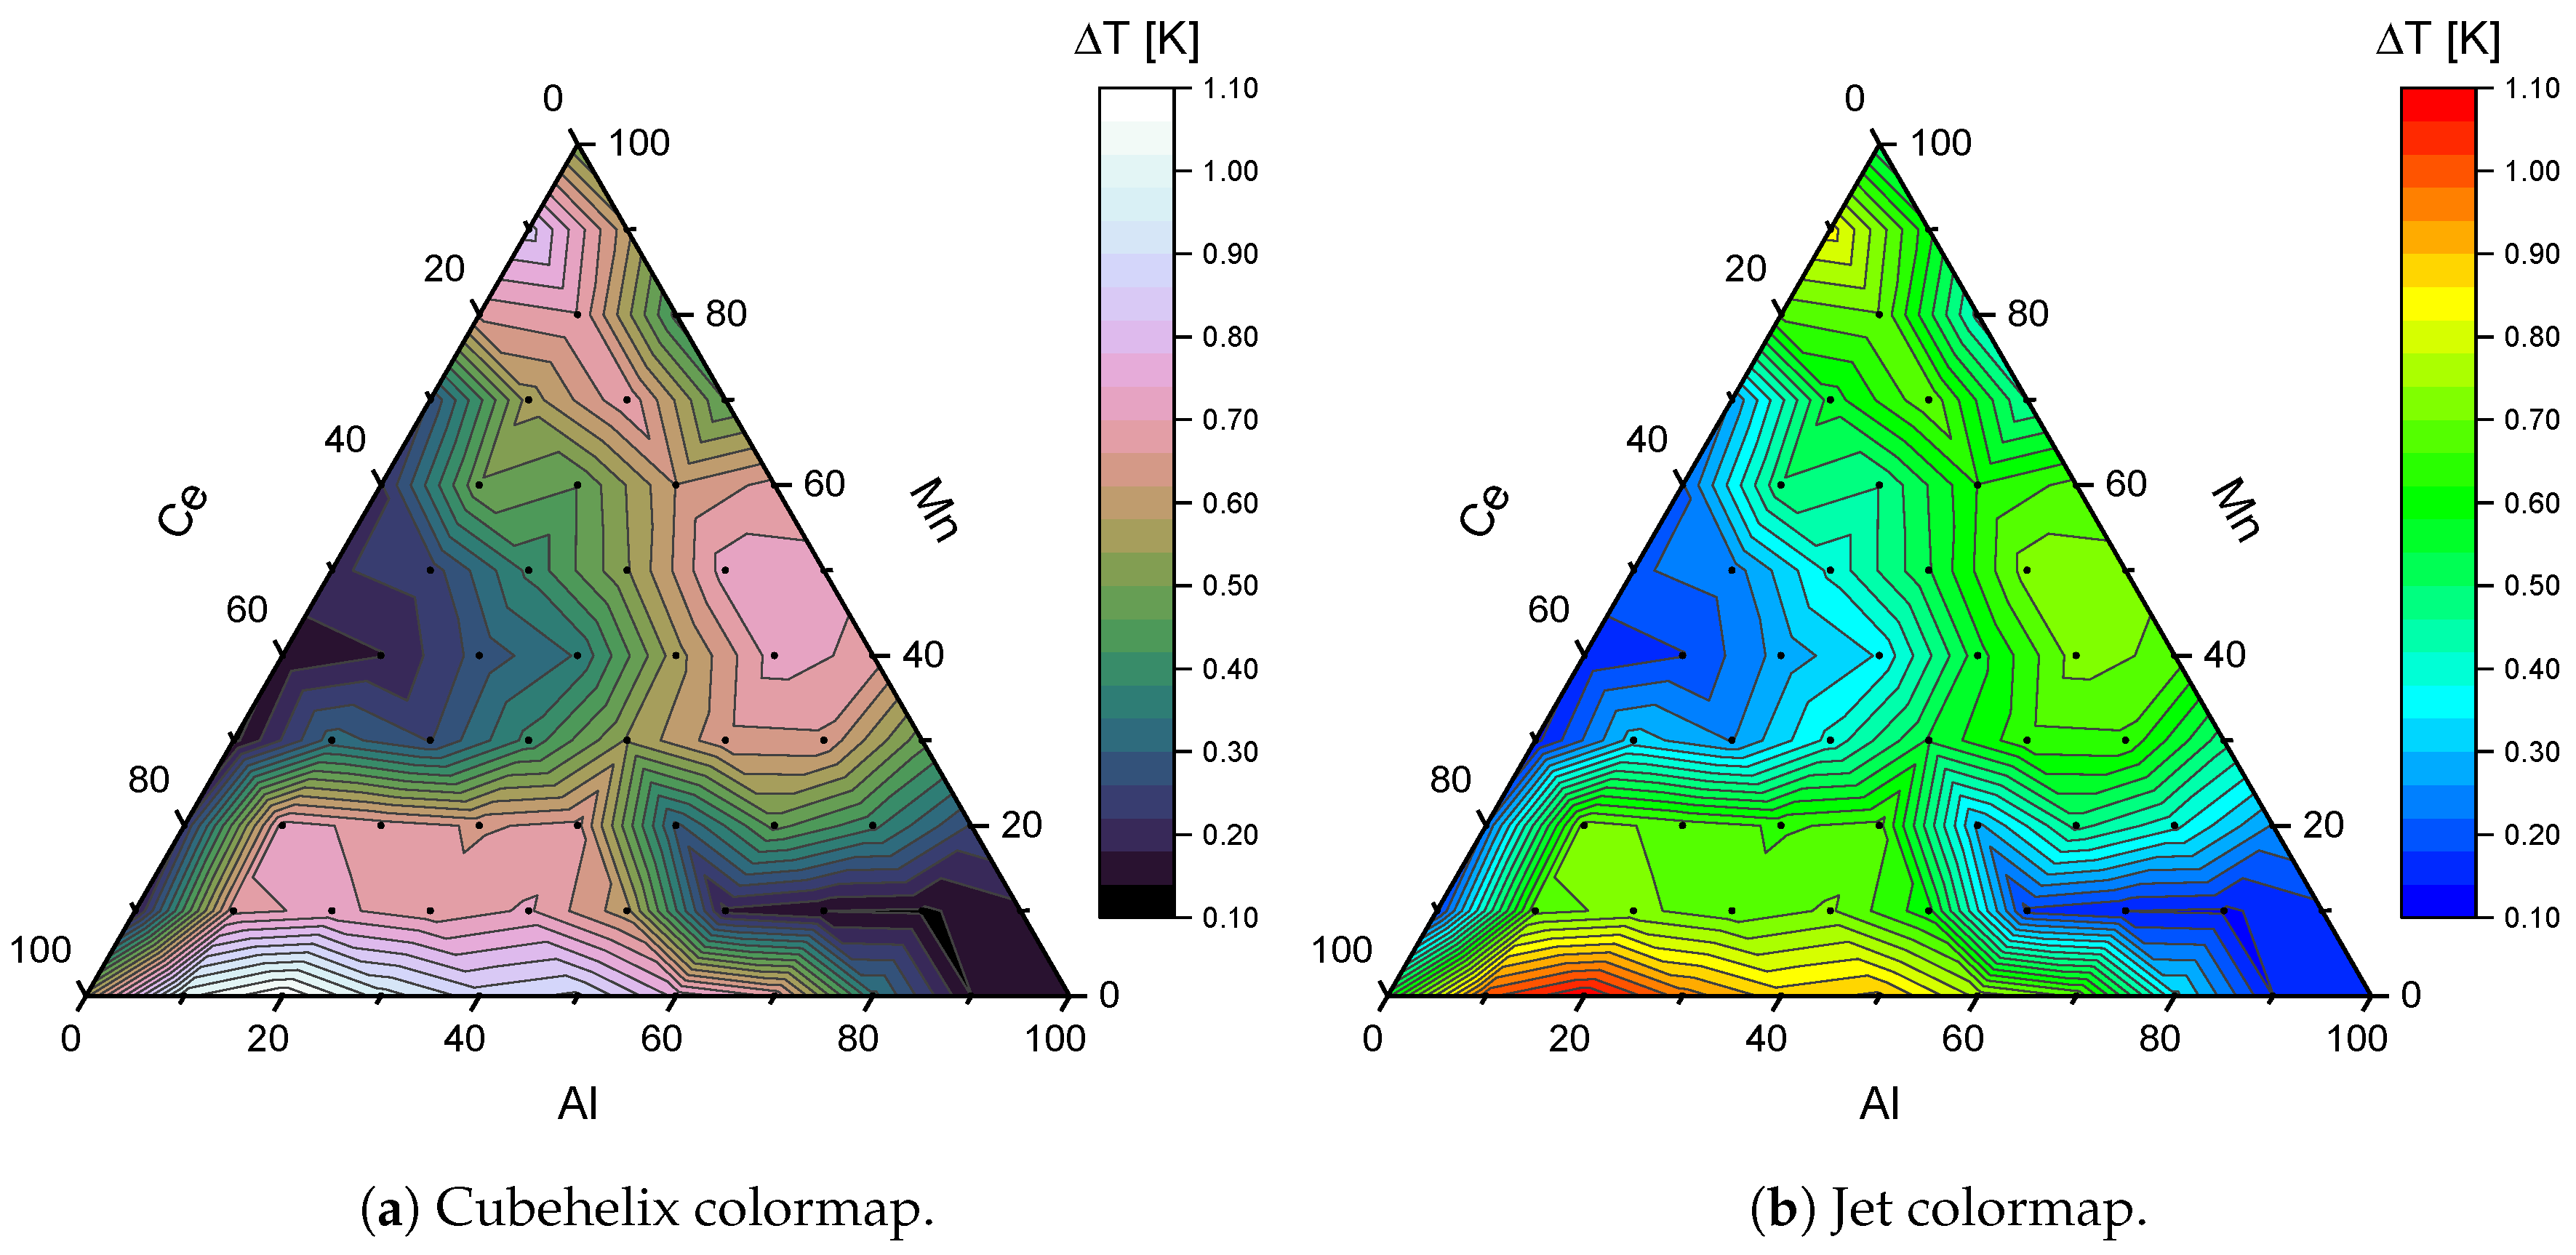
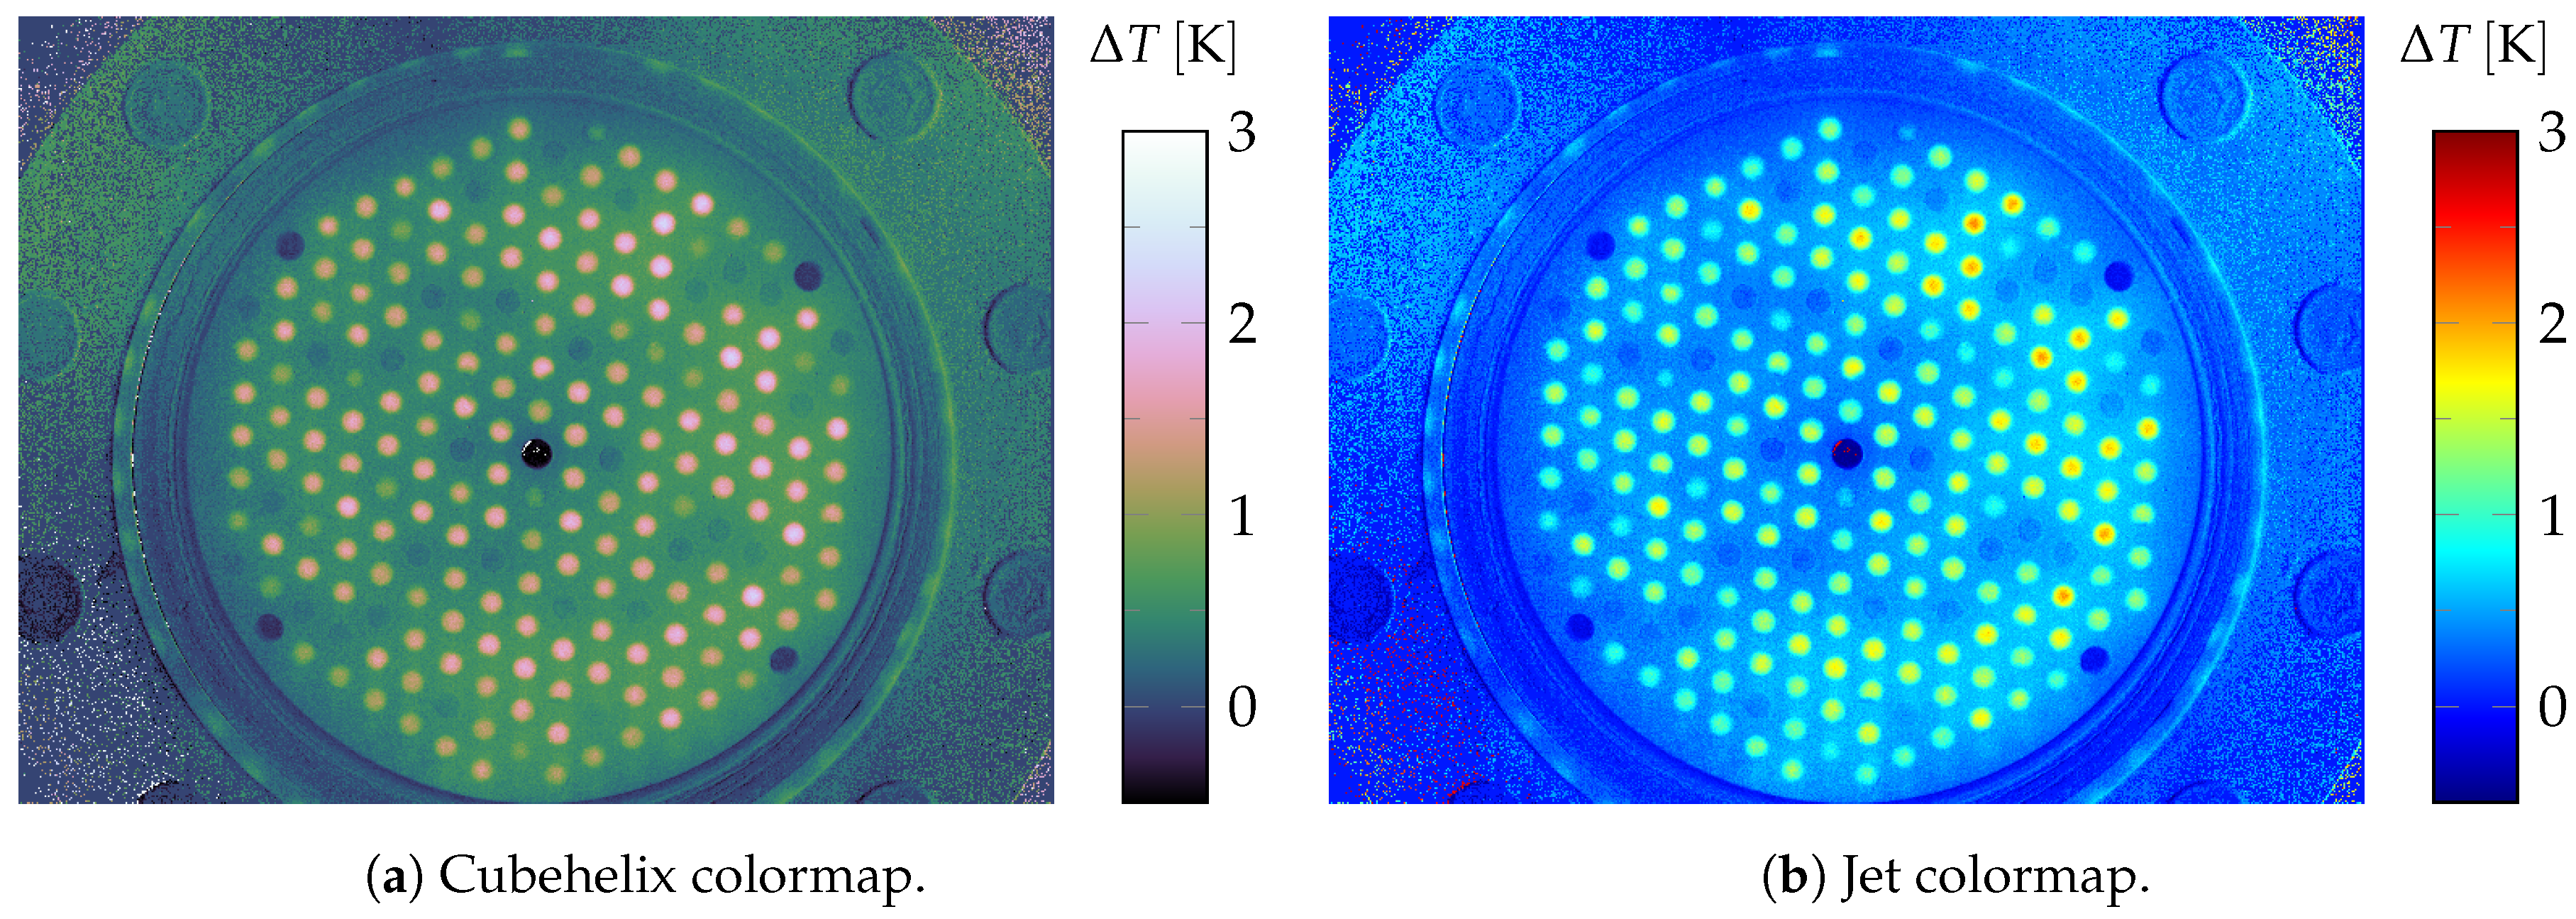
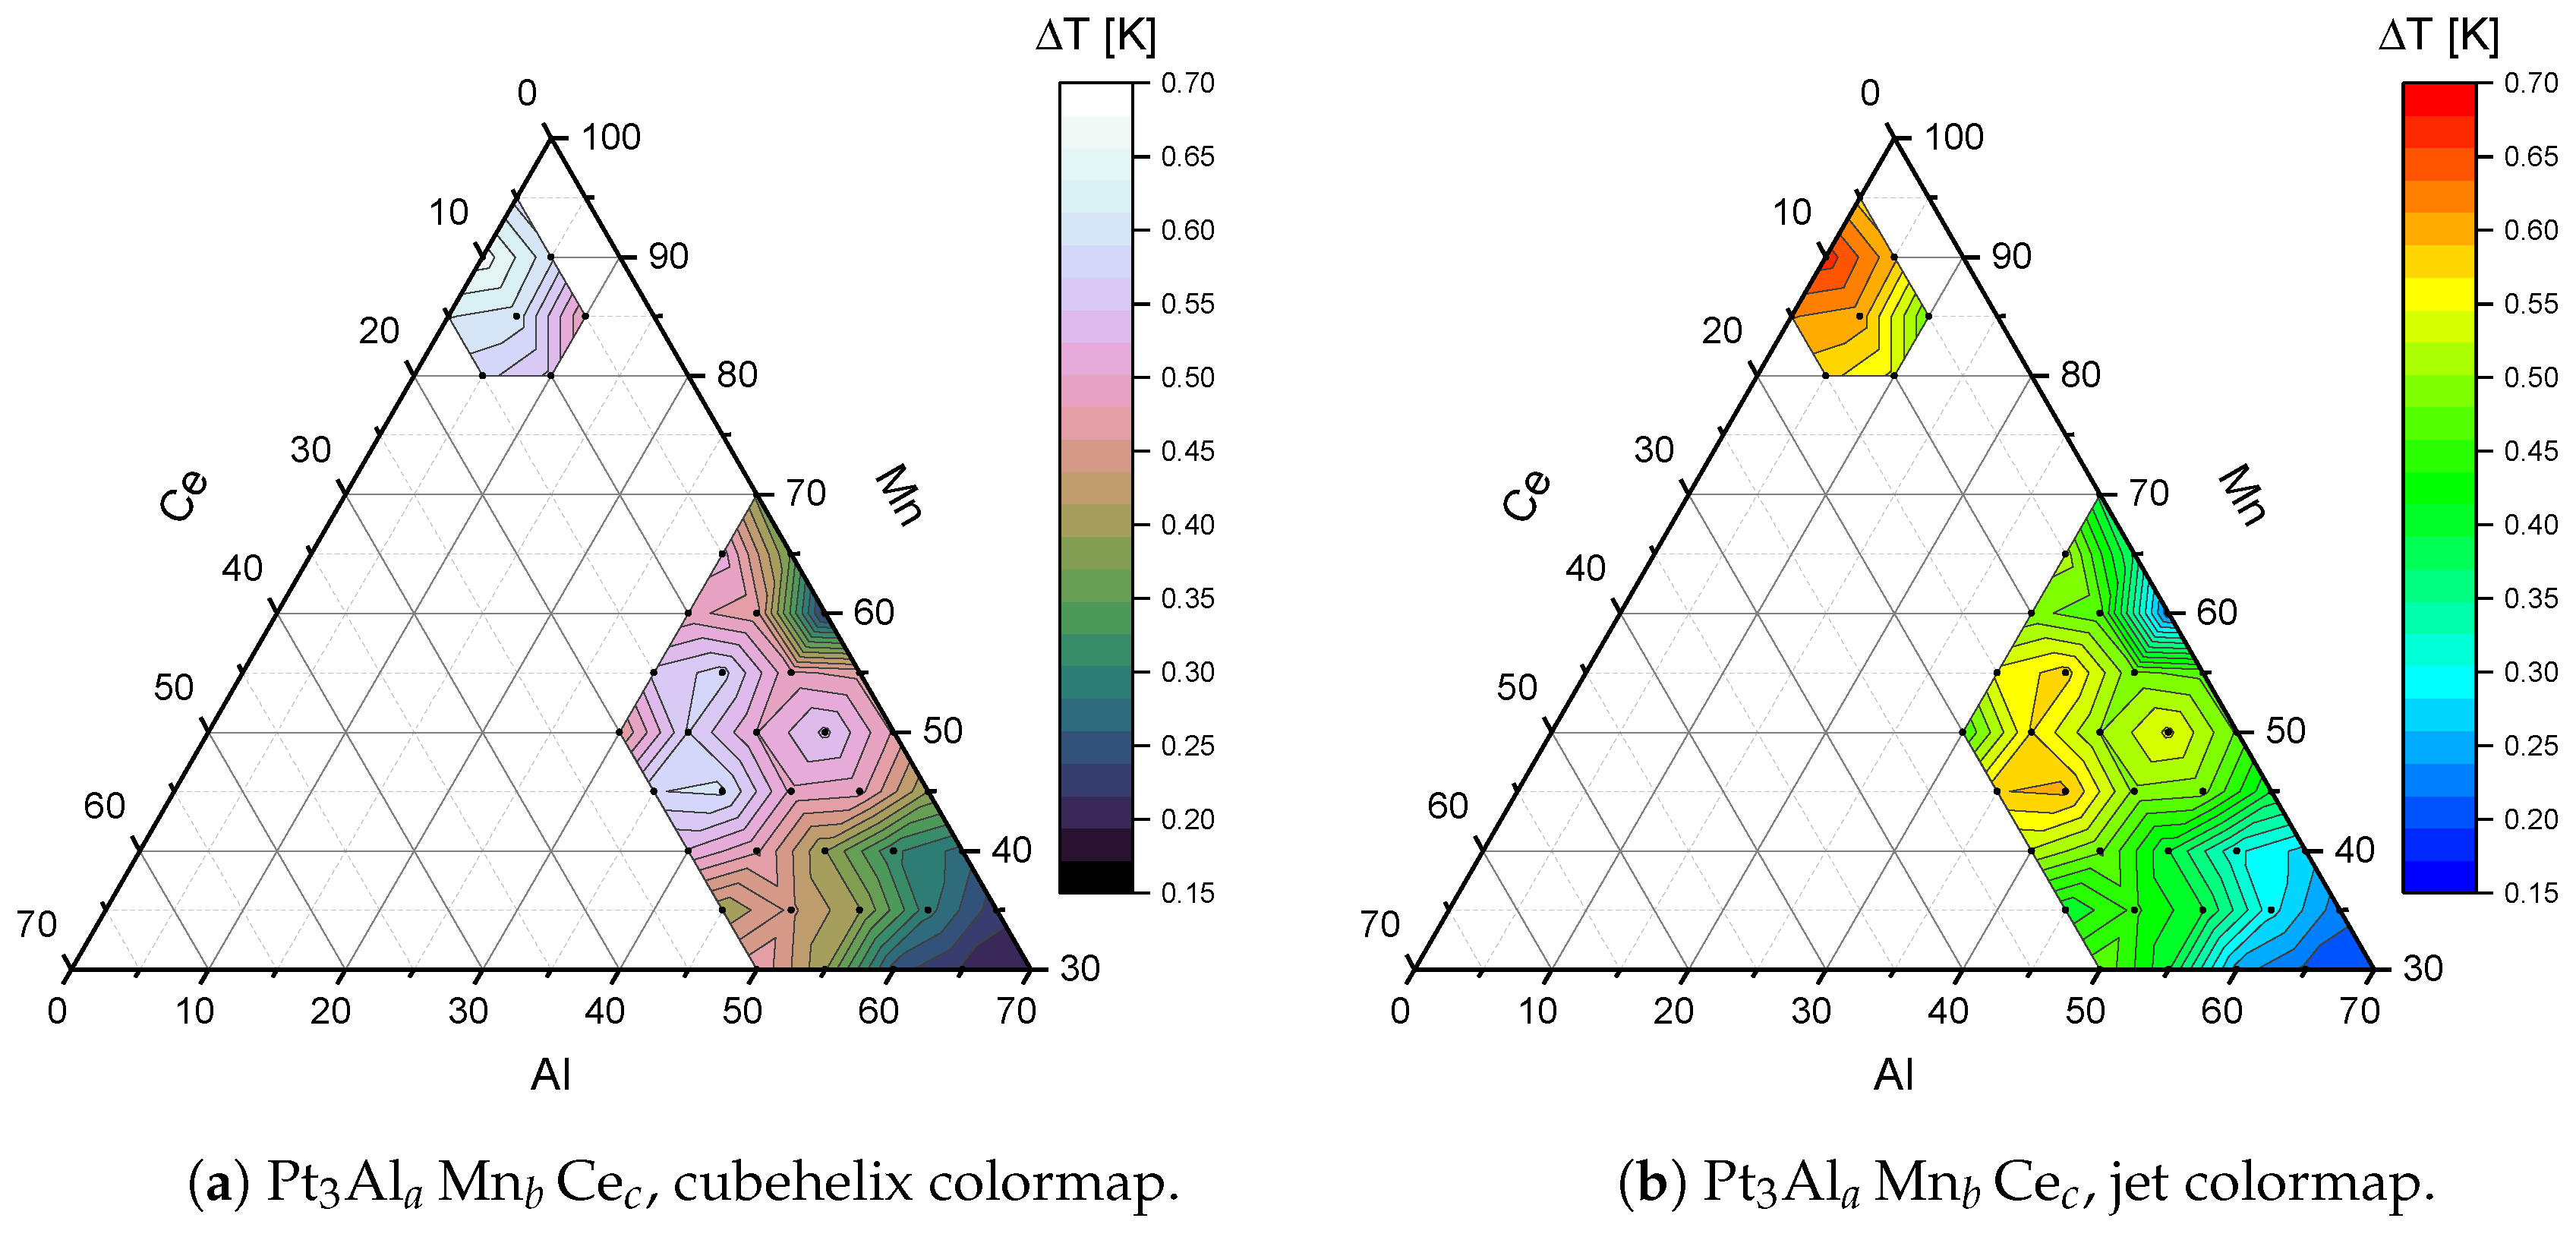
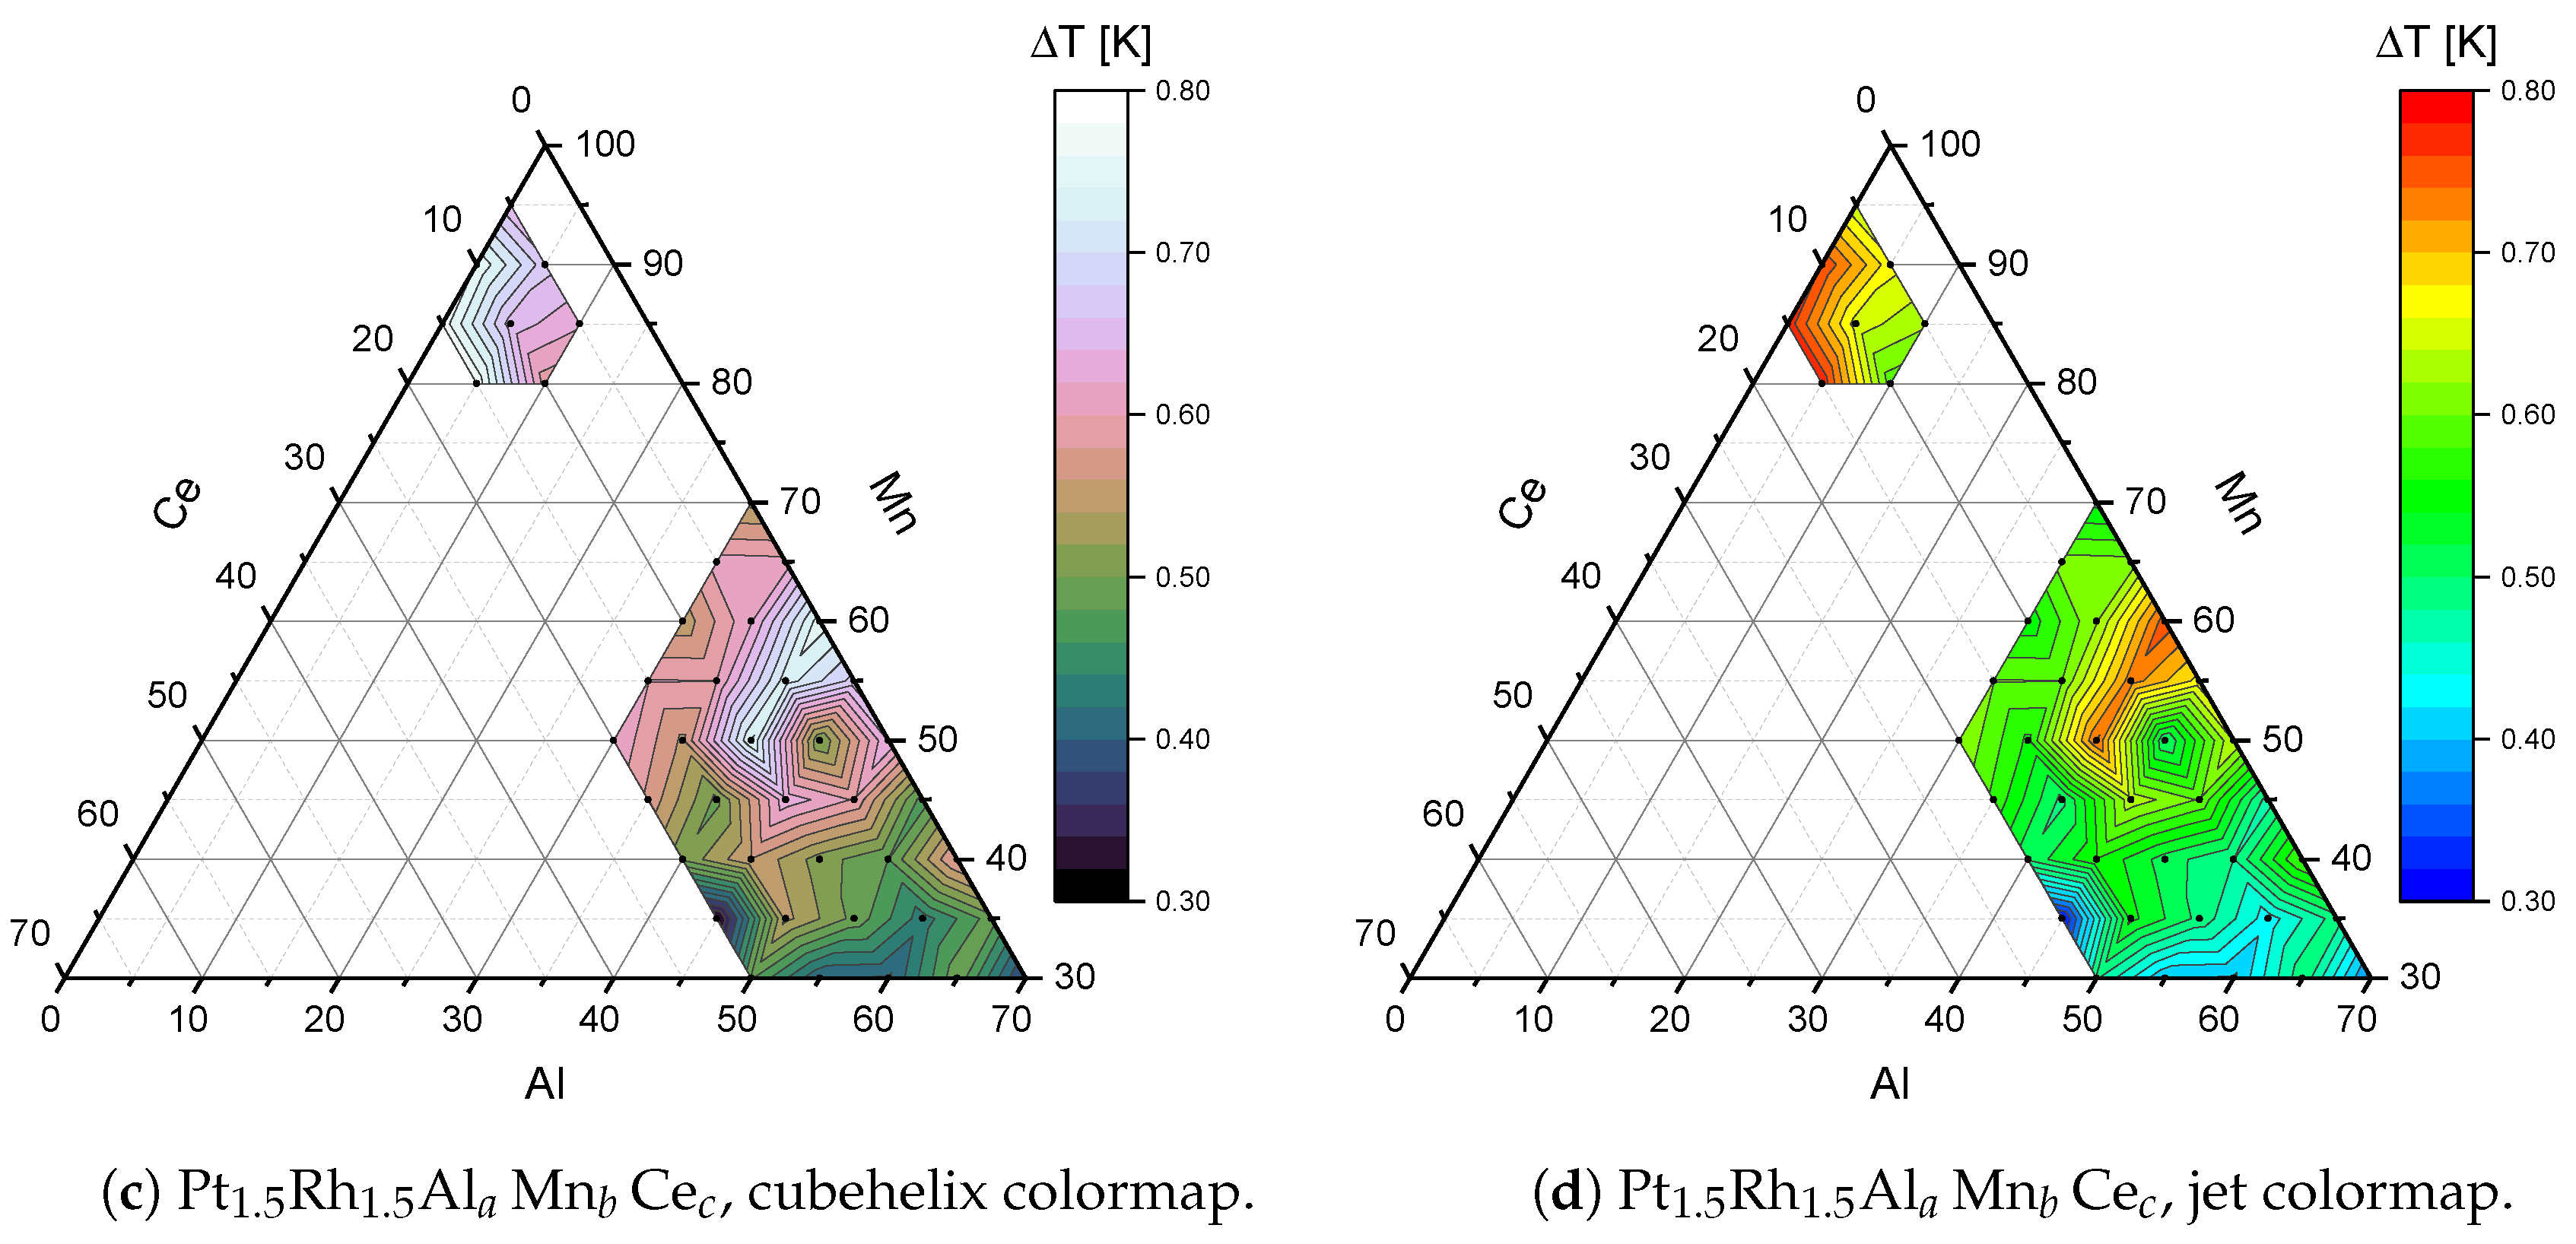
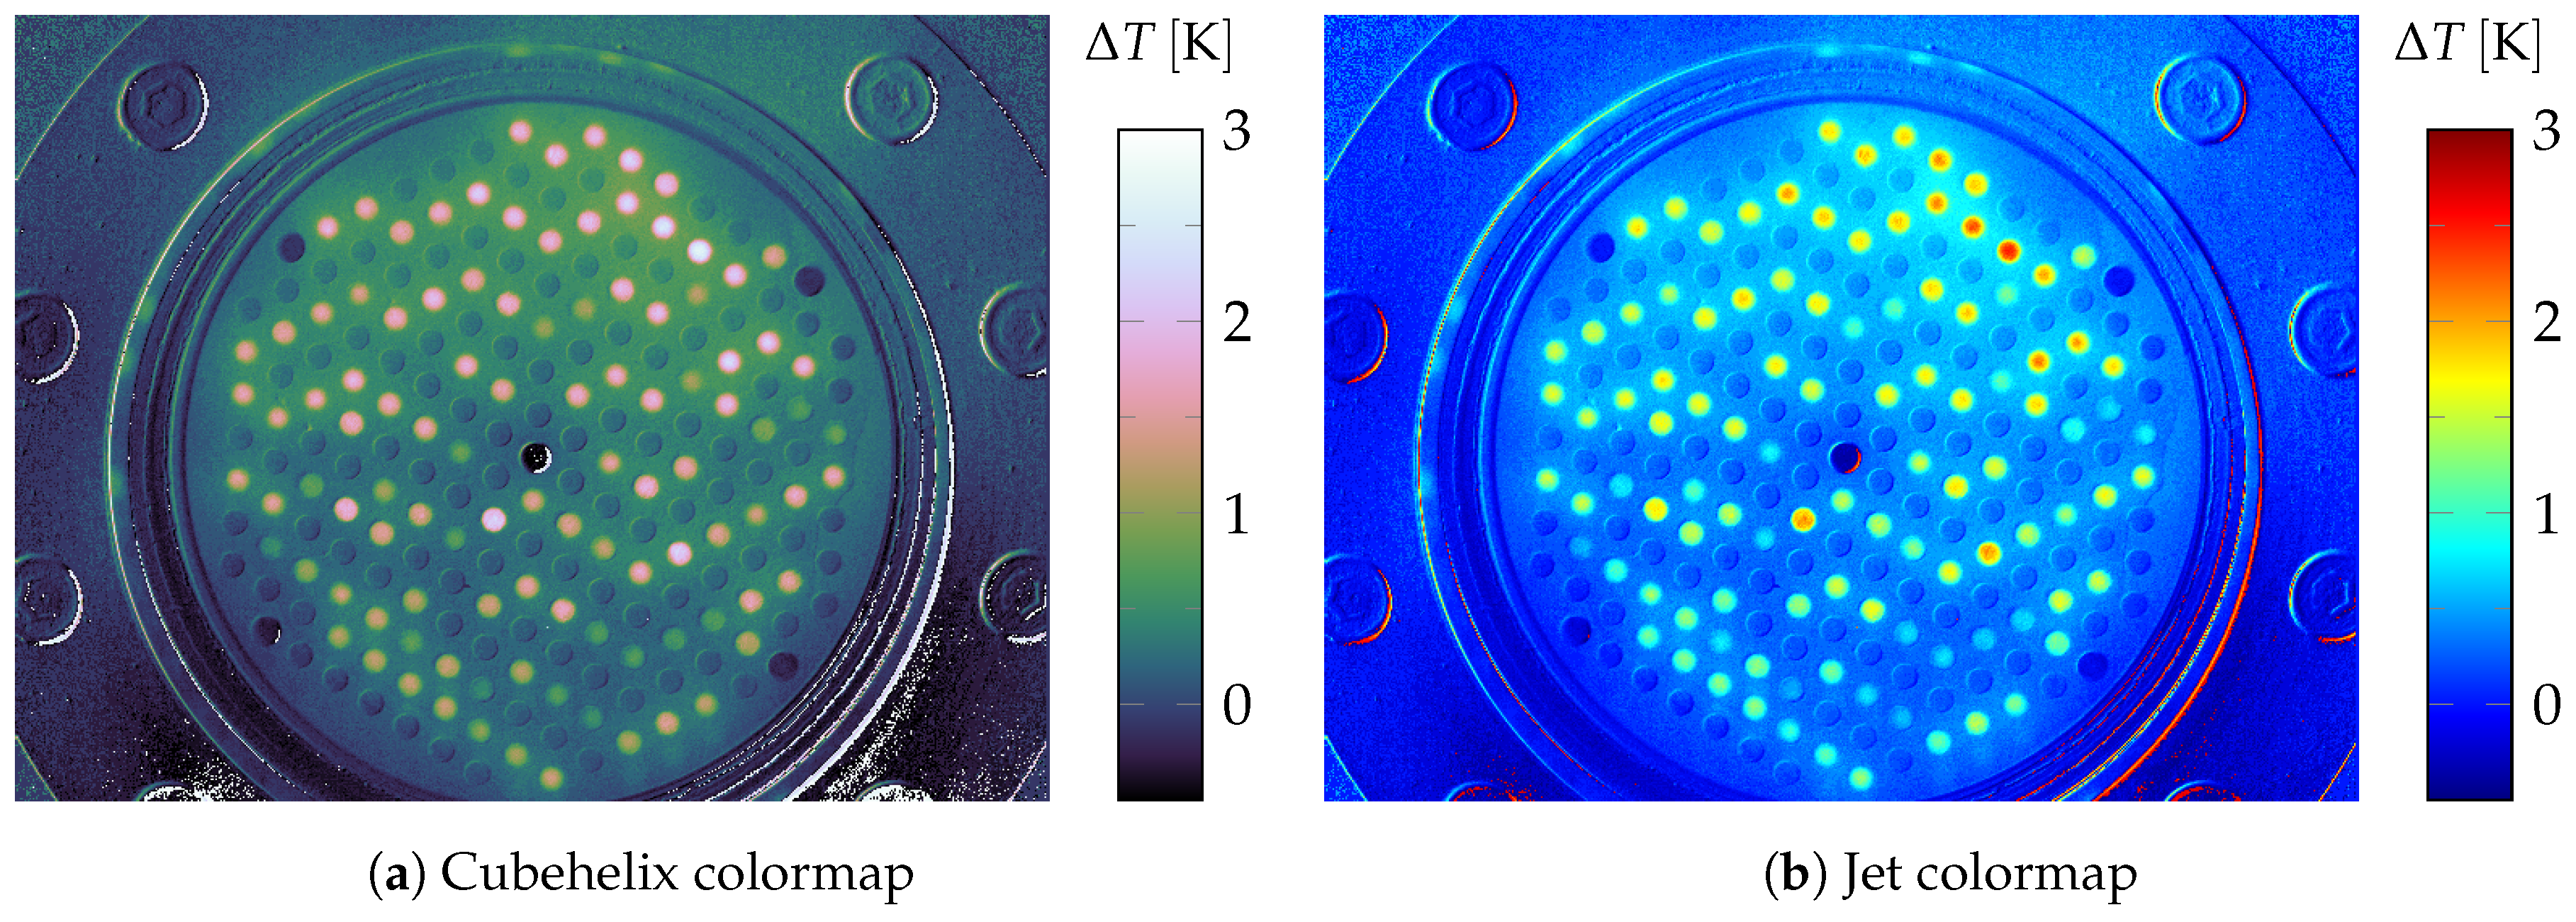
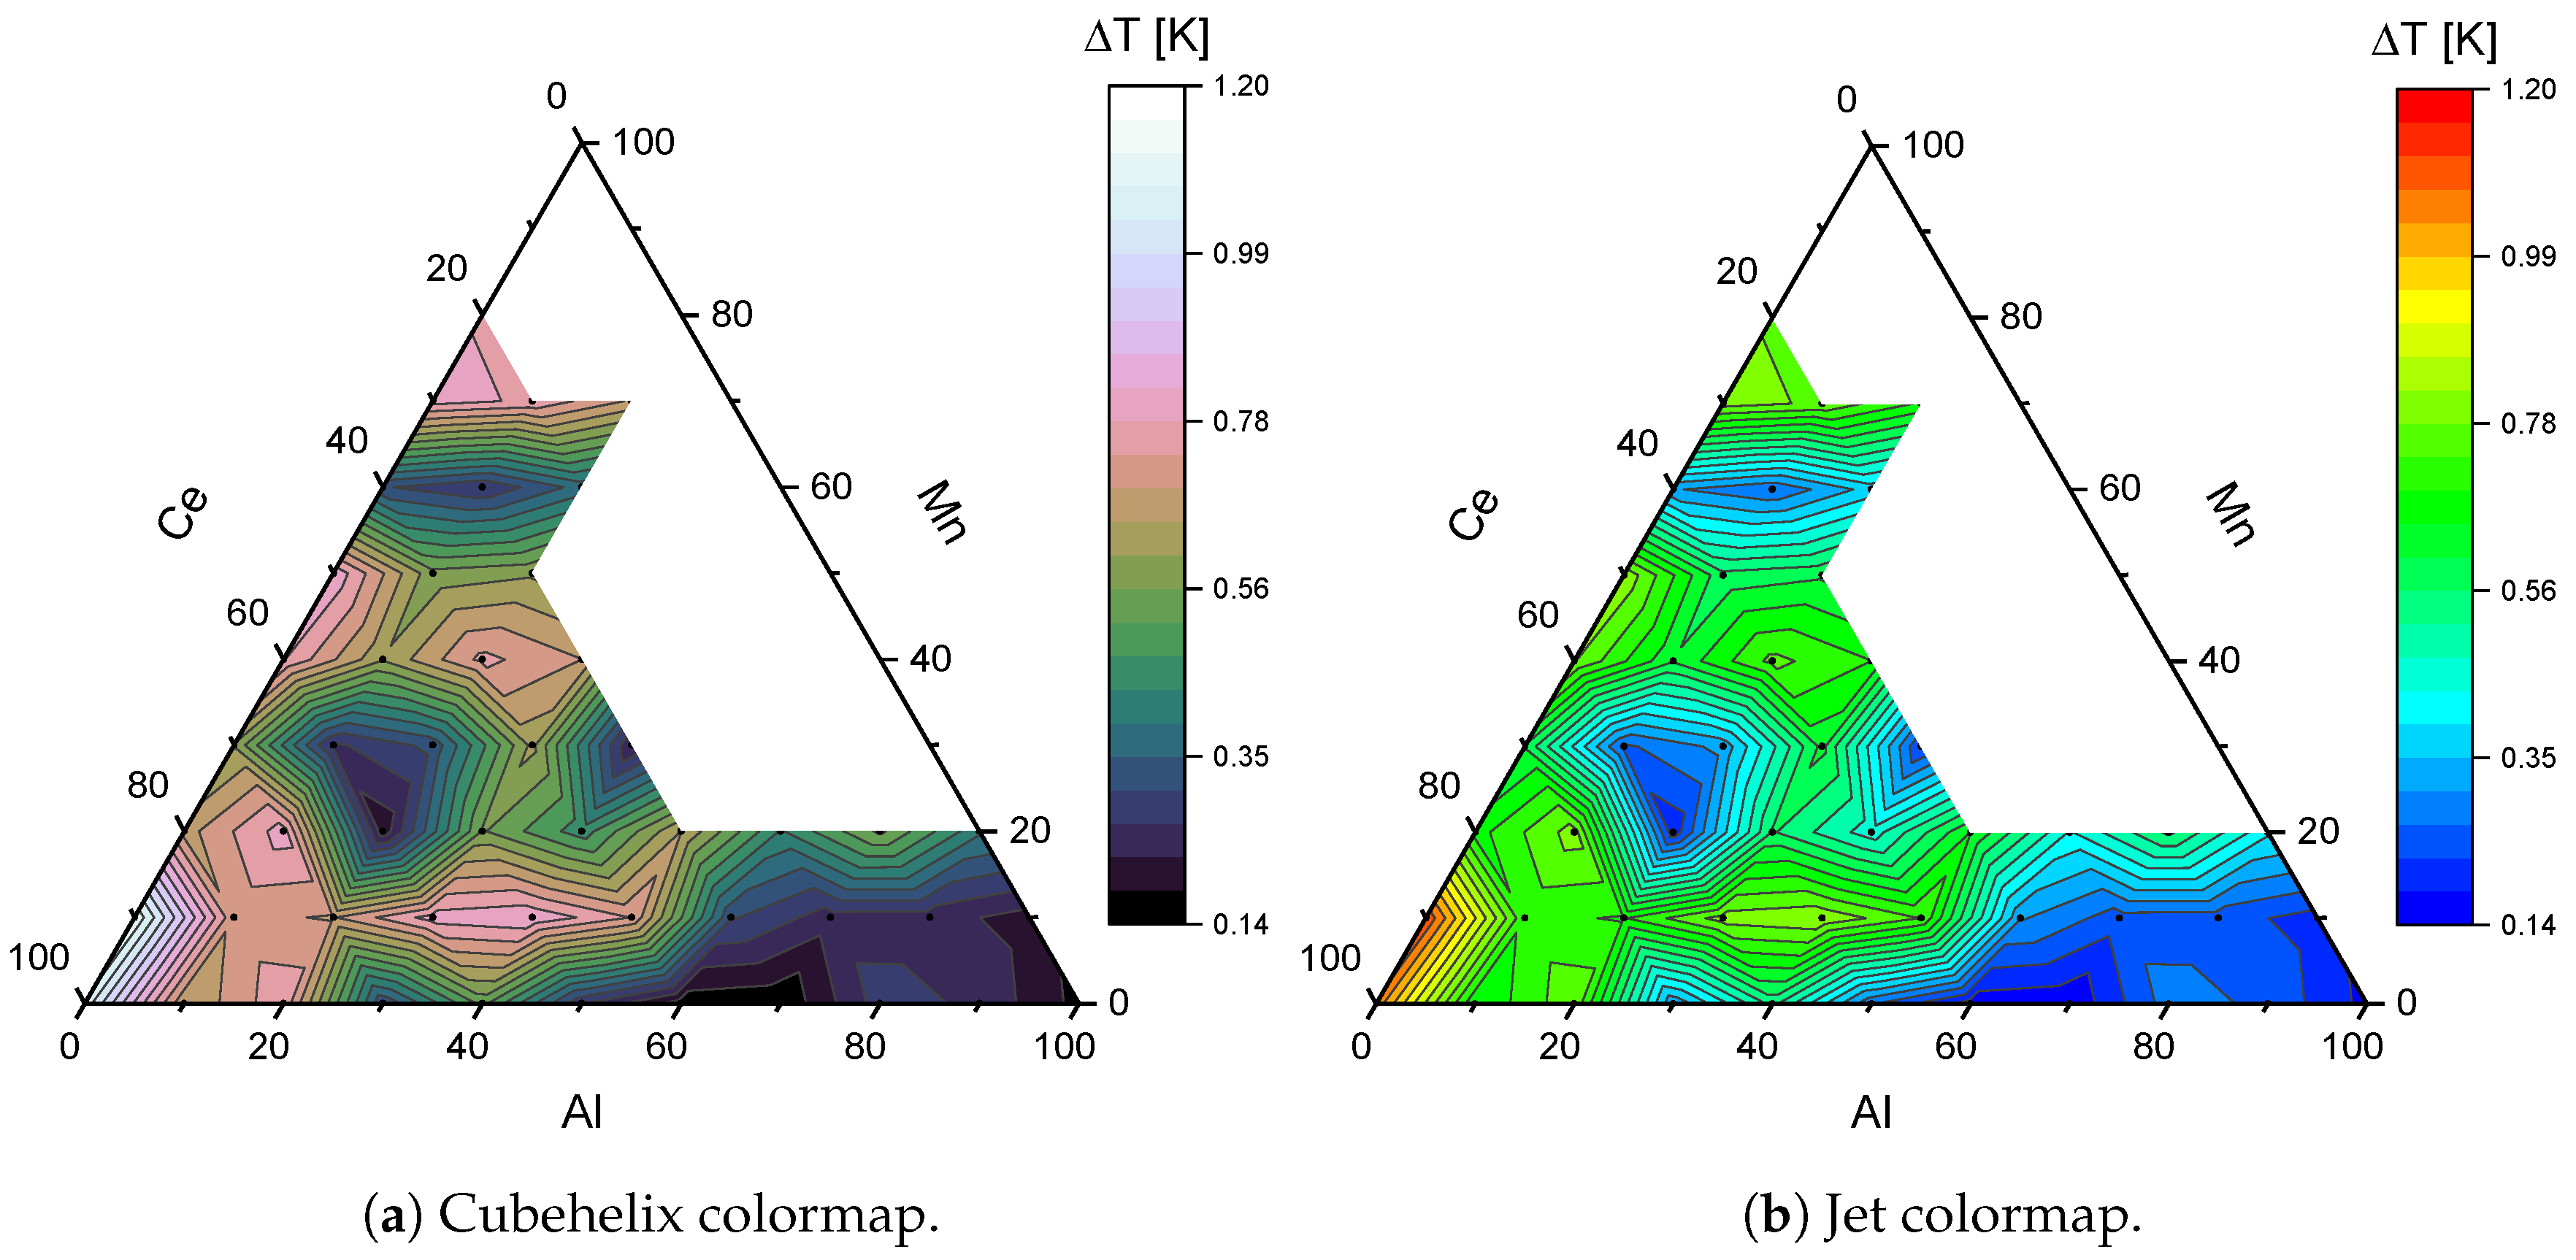
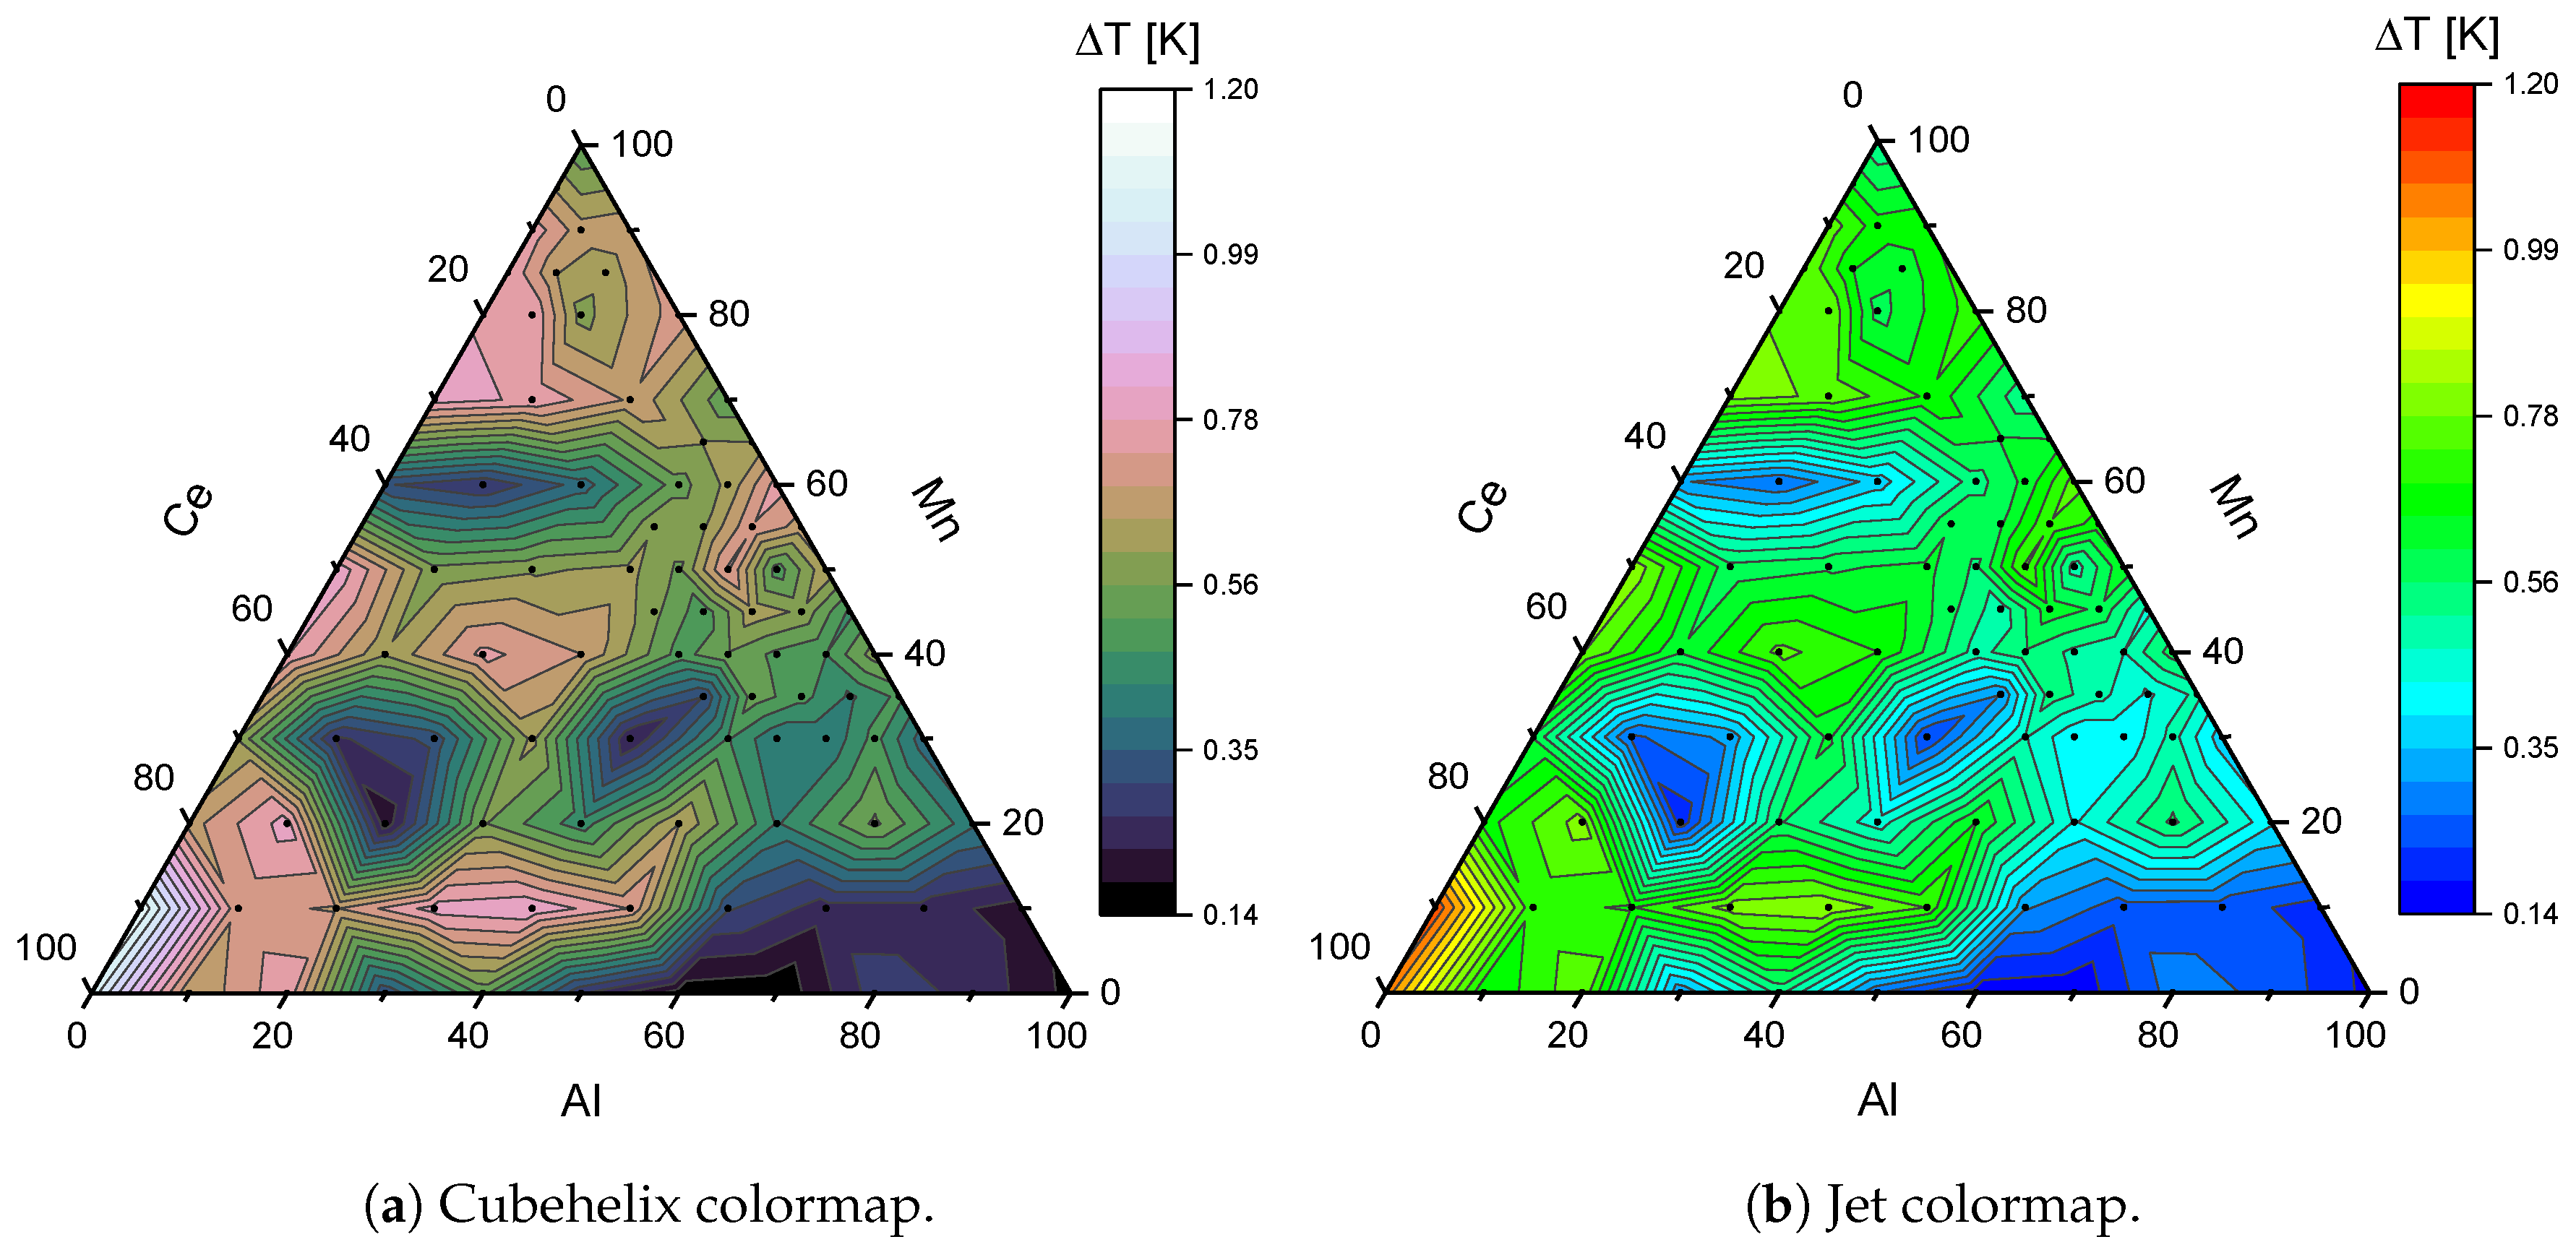
2.2. Emission Corrected Infrared Thermography Results

ecIRT has been used for high-throughput screening for over 20 years, brief details about working principles of this method can be found in Section 1.1. There are several effects that have to be considered before using ecIRT: adsorption effects, side reactions, high temperature effects, shadow effects, and emissivity changes [60].
Adsorption effects might lead to steep temperature changes (a high increase in temperature followed by a rapid temperature decrease), but occur only for a short period of time after the adsorbing component is added to the samples under test. Adsorption effects are repeatable and can, therefore, be differentiated from other effects like a steep temperature change due to high activity and a rapid temperature decrease due to fast ageing. To avoid this effect, we use the image taken after 120 min of reaction, therefore, any adsorption effects that might occur should not affect our data.
Parallel or side reactions might obscure the difference between catalysts, because only total change of temperature can be observed. An oxidation of other typical exhaust gas components like CO might give false positive results. Furthermore, side reactions between reaction components and sample material are known in literature, e.g., sulfur decomposition from mixed metal sulfides [60] or sulfatization of Cu with SO2 [65]. Images can be taken in different atmospheres to test for this behaviour. For primary screening, we used a simplified gas mixture containing only CH4, O2, H2O, and N2 to reduce the amount of possible side reactions.
At high temperatures, the IR sensors might overexpose, even with shortest available integration time. Neutral density filters can be used to reduce radiation, allowing ecIRT measurements to be carried out even at high temperatures. Another problem is an increased energy loss due to a high temperature difference between reactor and environment, resulting in temperature gradients in the reactor. This has been addressed with improved insulation of the reactor and temperature calibration prior to experiments.
Due to the radial design, gas velocity as well as gas composition can differ at different sample positions, resulting in different results for one composition depending on sample position on the slate library plate. Different gas velocities at different positions can be addressed by placing samples (more than once) at different places with different distances to the central gas outlet on the slate library plate. If there are several high active catalysts placed next to each other, other samples that are placed further downstream in the gas flow will have a different gas composition, since some or even all of the components are already converted. Our approach to limit the influence of both effects is to place each sample twice in two randomly selected positions (Available sample positions are determined using the number of samples that should be distributed on a library plate, to ensure an even distribution. If 103 samples have to be placed in the 206 available wells, every second well is empty. Samples are then placed randomly in the available sample positions.), and decrease the sample density leaving positions in the slate library plate blank.
When the sample changes under reaction conditions, e.g., due to a reaction or change of phase, a change of emissivtiy occurs. If the change in emissivity is not overcompensated by heat of reaction, it might lead to false positive or negative results.
To illustrate the measurement principle, we decided to use a non-completely randomized pattern, 66 samples are arranged in a triangular shape (no sample can be loaded in positon (9,9), so the corresponding sample has been placed at (3,14) instead. and the same 66 compositions are placed evenly distributed in random order around this triangle. The result of a ecIRT measurement are Δ T values, resulting from the temperature difference of the samples between the stated gas mixture (reaction condition) and the temperature in wetted nitrogen atmosphere (background condition). Results of ecIRT measurement are displayed in Figure 3.
Identifying promising samples is done using the Δ T values to rank the samples as well as using the images from Figure 3 to check for false positive or negative samples. Δ T values for both sample spots containing catalyst of the same composition are averaged and the result is displayed in the corresponding graphical composition spread representation. Due to the fact that only two samples have been used to obtain the average value, no standard deviation is given for Δ T values. Even this averaging can be disputed considering the differences in gas composition over the catalyst library as discussed above. We assume that these differences are so small that they can be neglected. The average value for each sample composition is then displayed in an ternary contour heat map using OriginLabs Origin Pro software suite. See Figure 4 for placement of promising samples on the library, Table 1 for a ranking using Δ T values and Figure 5 for average values of Δ T for all samples.
Areas with potential hits have been synthesized with a higher sample density. At the same time, samples with Pt1.5Rh1.5 instead of Pt3 have been added to test for possible higher activity. Sample compositions are defined in Figure 6. These samples have been placed in slate library plate 2, the results of ecIRT measurement for this library plate are displayed in Figure 7, Figure 8 and Table 2. Samples with a high amount of Ce are omitted in slate library 2, because these samples are false positive hits. They show a high Δ T value, the CH4 conversion is below 20% (see Figure 5).
Materials with the highest Δ T for both PM compositions are 30% to 45% Al, 40% to 55% Mn and 0% to 20% Ce. Materials with a high Mn content of 80% to 95% with 0% to 10% Al and 5% to 15% Ce also have a high Δ T value. Comparing the results from Table 1 and Table 2 also shows that our results for Pt3 Ala Mnb Cec are reproducible. Samples from both ecIRT measurements with the same composition (see second block of Table 2) show a high Δ T value in their respective measurement. Values for Δ T for samples that have been measured in both slate libraries are not necessarily the same within experimental accuracy. Possible reasons are difference in gas velocity at different positions and shadowing effects. The most promising samples from both slate libraries have been selected for testing in the gas phase plug-flow reactor setup, see Section 4.3 for results.
To test if there are more interesting compositions in the Pt1.5Rh1.5 system, we synthesized the remaining compositions with a resolution of 10 at.%. Results of ecIRT measurement are displayed in Figure 9, Figure 10 and Table 3. For the two samples with the highest Δ T values, no increase in temperature could be detected for the slate library surrounding these samples. For the other samples in Table 3, an increase in temperature of the surrounding slate library can be detected in many cases. Taking the low observed methane conversion for Ce rich samples from Pt3 Ala Mnb Cec system and the results of samples from Pt1.5Rh1.5 Ala Mnb Cec, see Section 4.3, into consideration, no samples from the composition range from slate library 3 have been selected for further testing.
Combining data from Figure 8 and Figure 10 results in Figure 11. There is no sudden change of Δ T visible on the edge of the merged areas. The Δ T scale on both measurements were overlapping, their lowest and highest value were in the same order of magnitude. Therefore, displaying data from both measurements in the same figure was possible. In general, data points from different measurements are difficult to compare, because each sample set is an unique ensemble of catalysts where activities of individual samples are depending on each other. Therefore, interpretation should be done with great care. ecIRT should be used preferably to compare samples obtained in one measurement. To increase comparability between different libraries, a standard material could be used.
Areas with promising samples are similar to those from Figure 5. Pt1.5 Rh1.5 Al40 Mn60 Ce0, Pt1.5 Rh1.5 Al0 Mn90 Ce10, Pt1.5 Rh1.5 Al30 Mn10 Ce60, and Pt1.5 Rh1.5 Al0 Mn0 Ce100 have a similar composition to the previously mentioned samples from the composition range Pt3 Ala Mnb Cec. In addition, promising samples could be identified as Pt1.5 Rh1.5 Al20 Mn40 Ce40 and Pt1.5 Rh1.5 Al0 Mn50 Ce50.
Comparing Figure 11 to Figure 5, the samples with the highest Δ T values have a composition with an amount of Ce of χ Ce = 80% to 100 %.

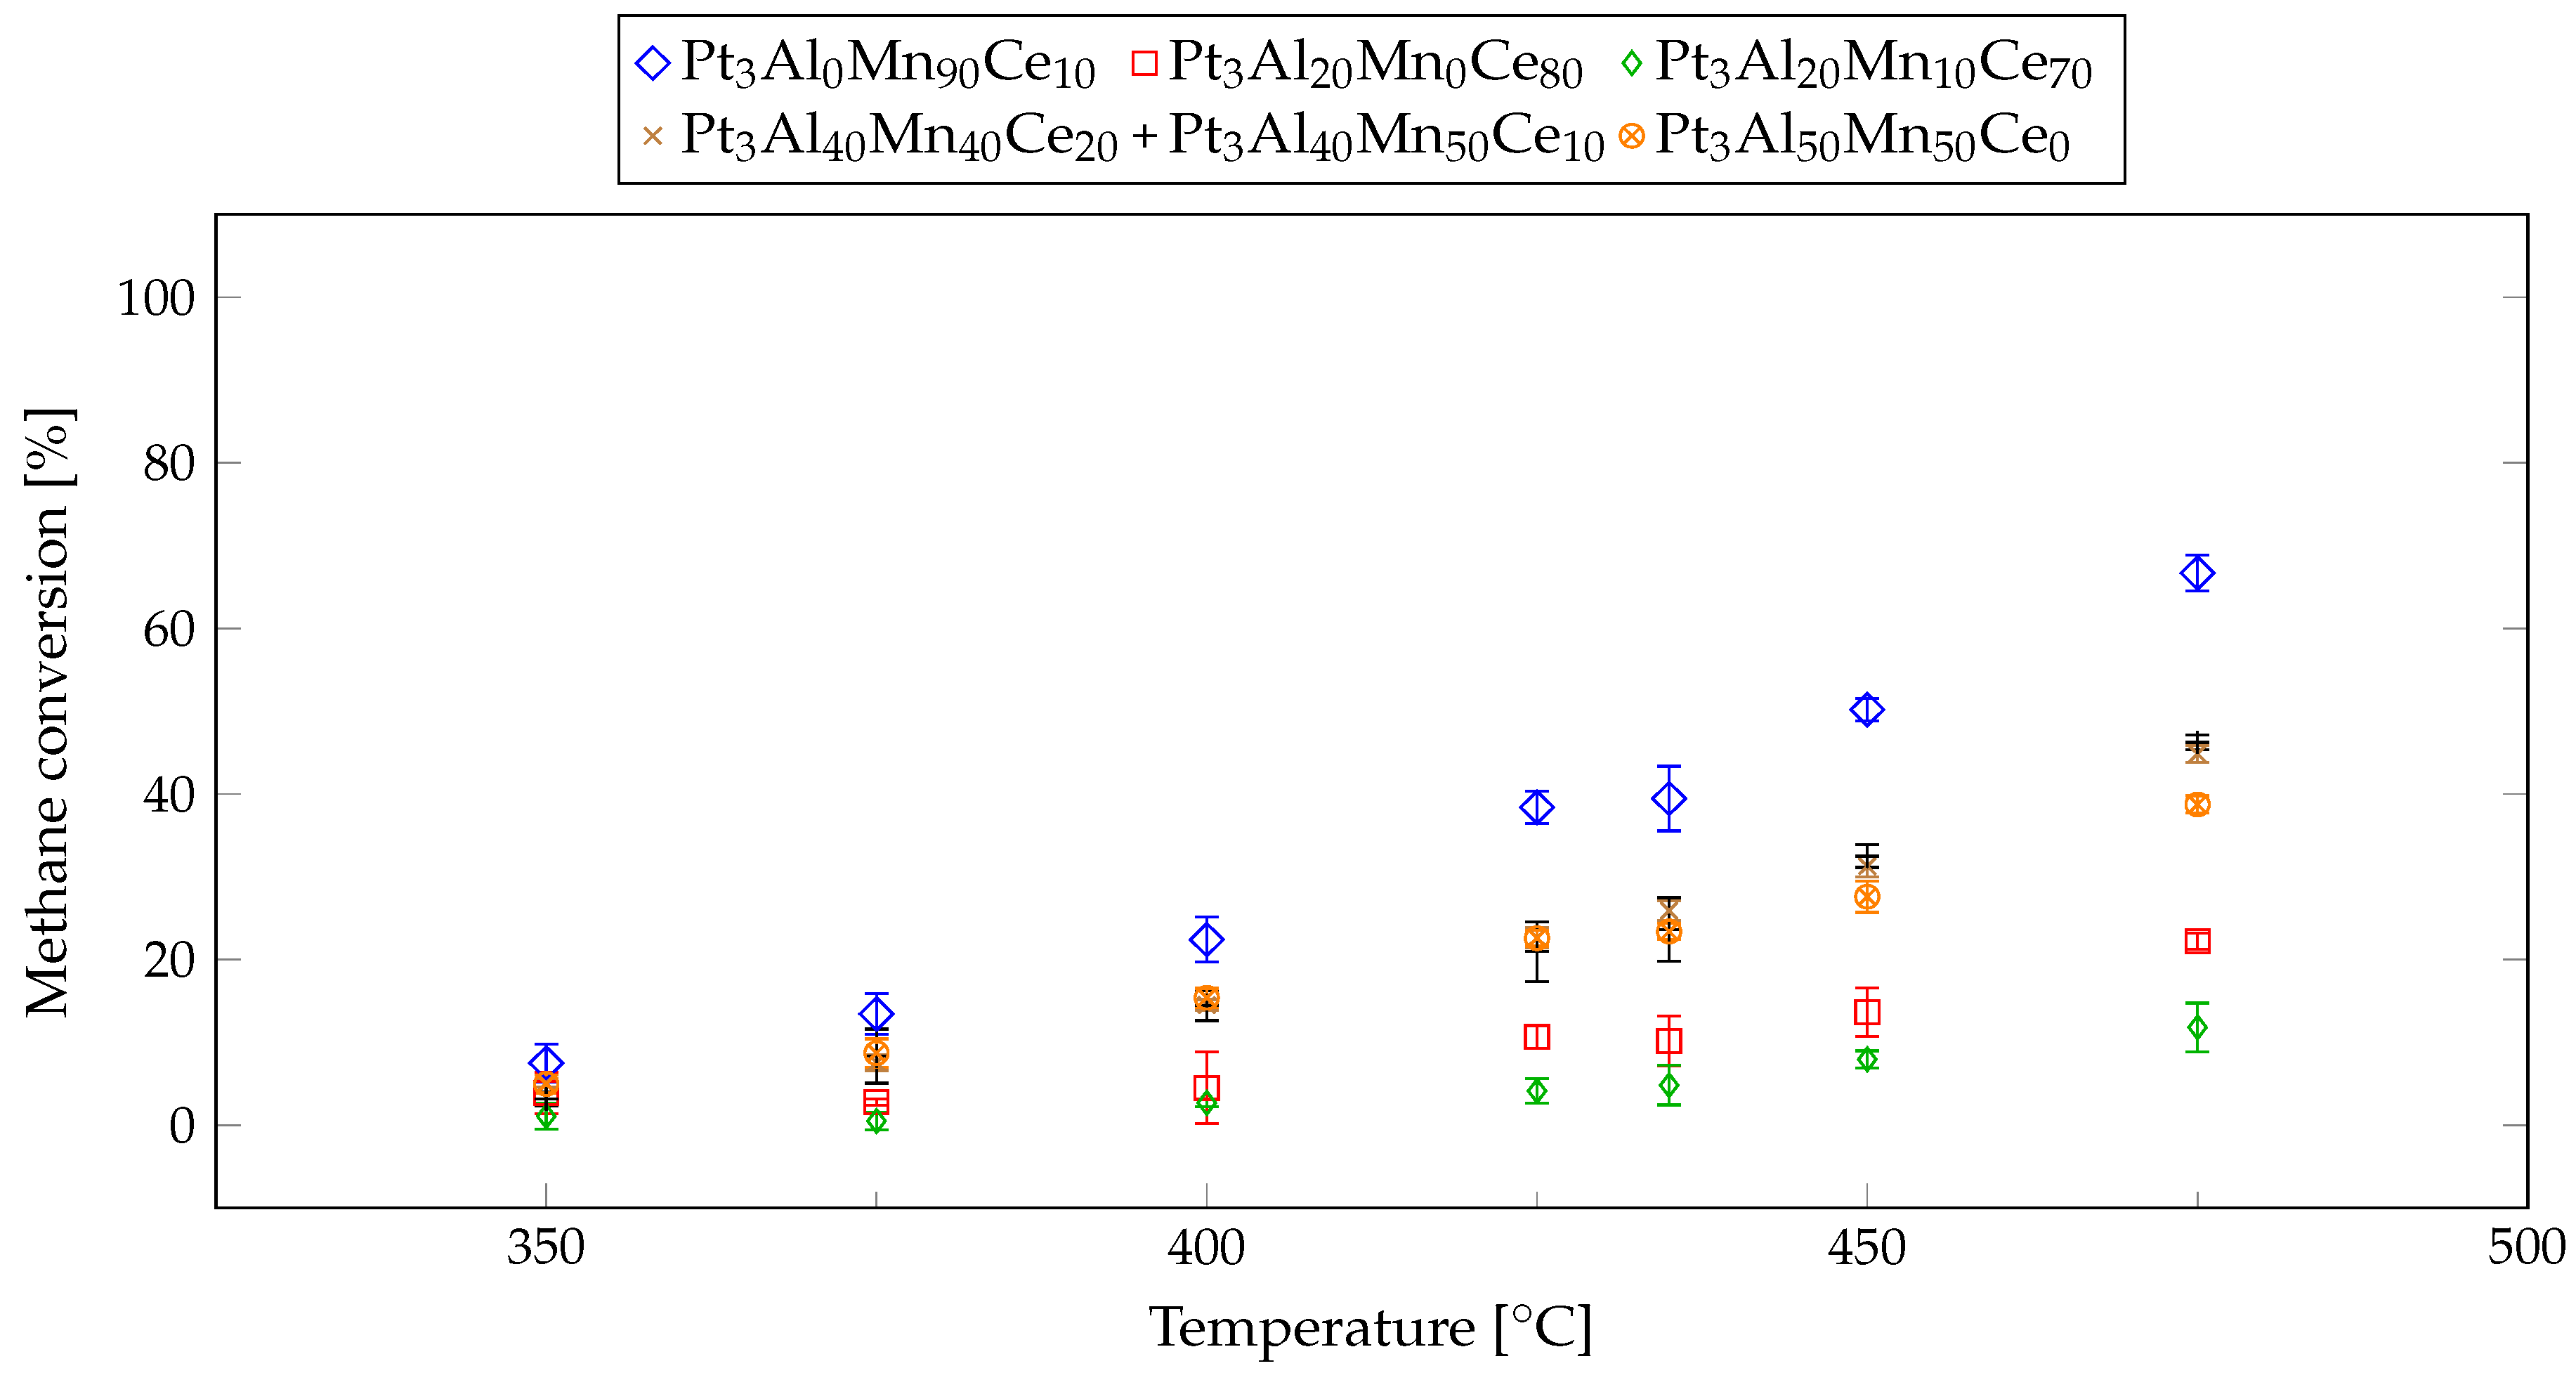
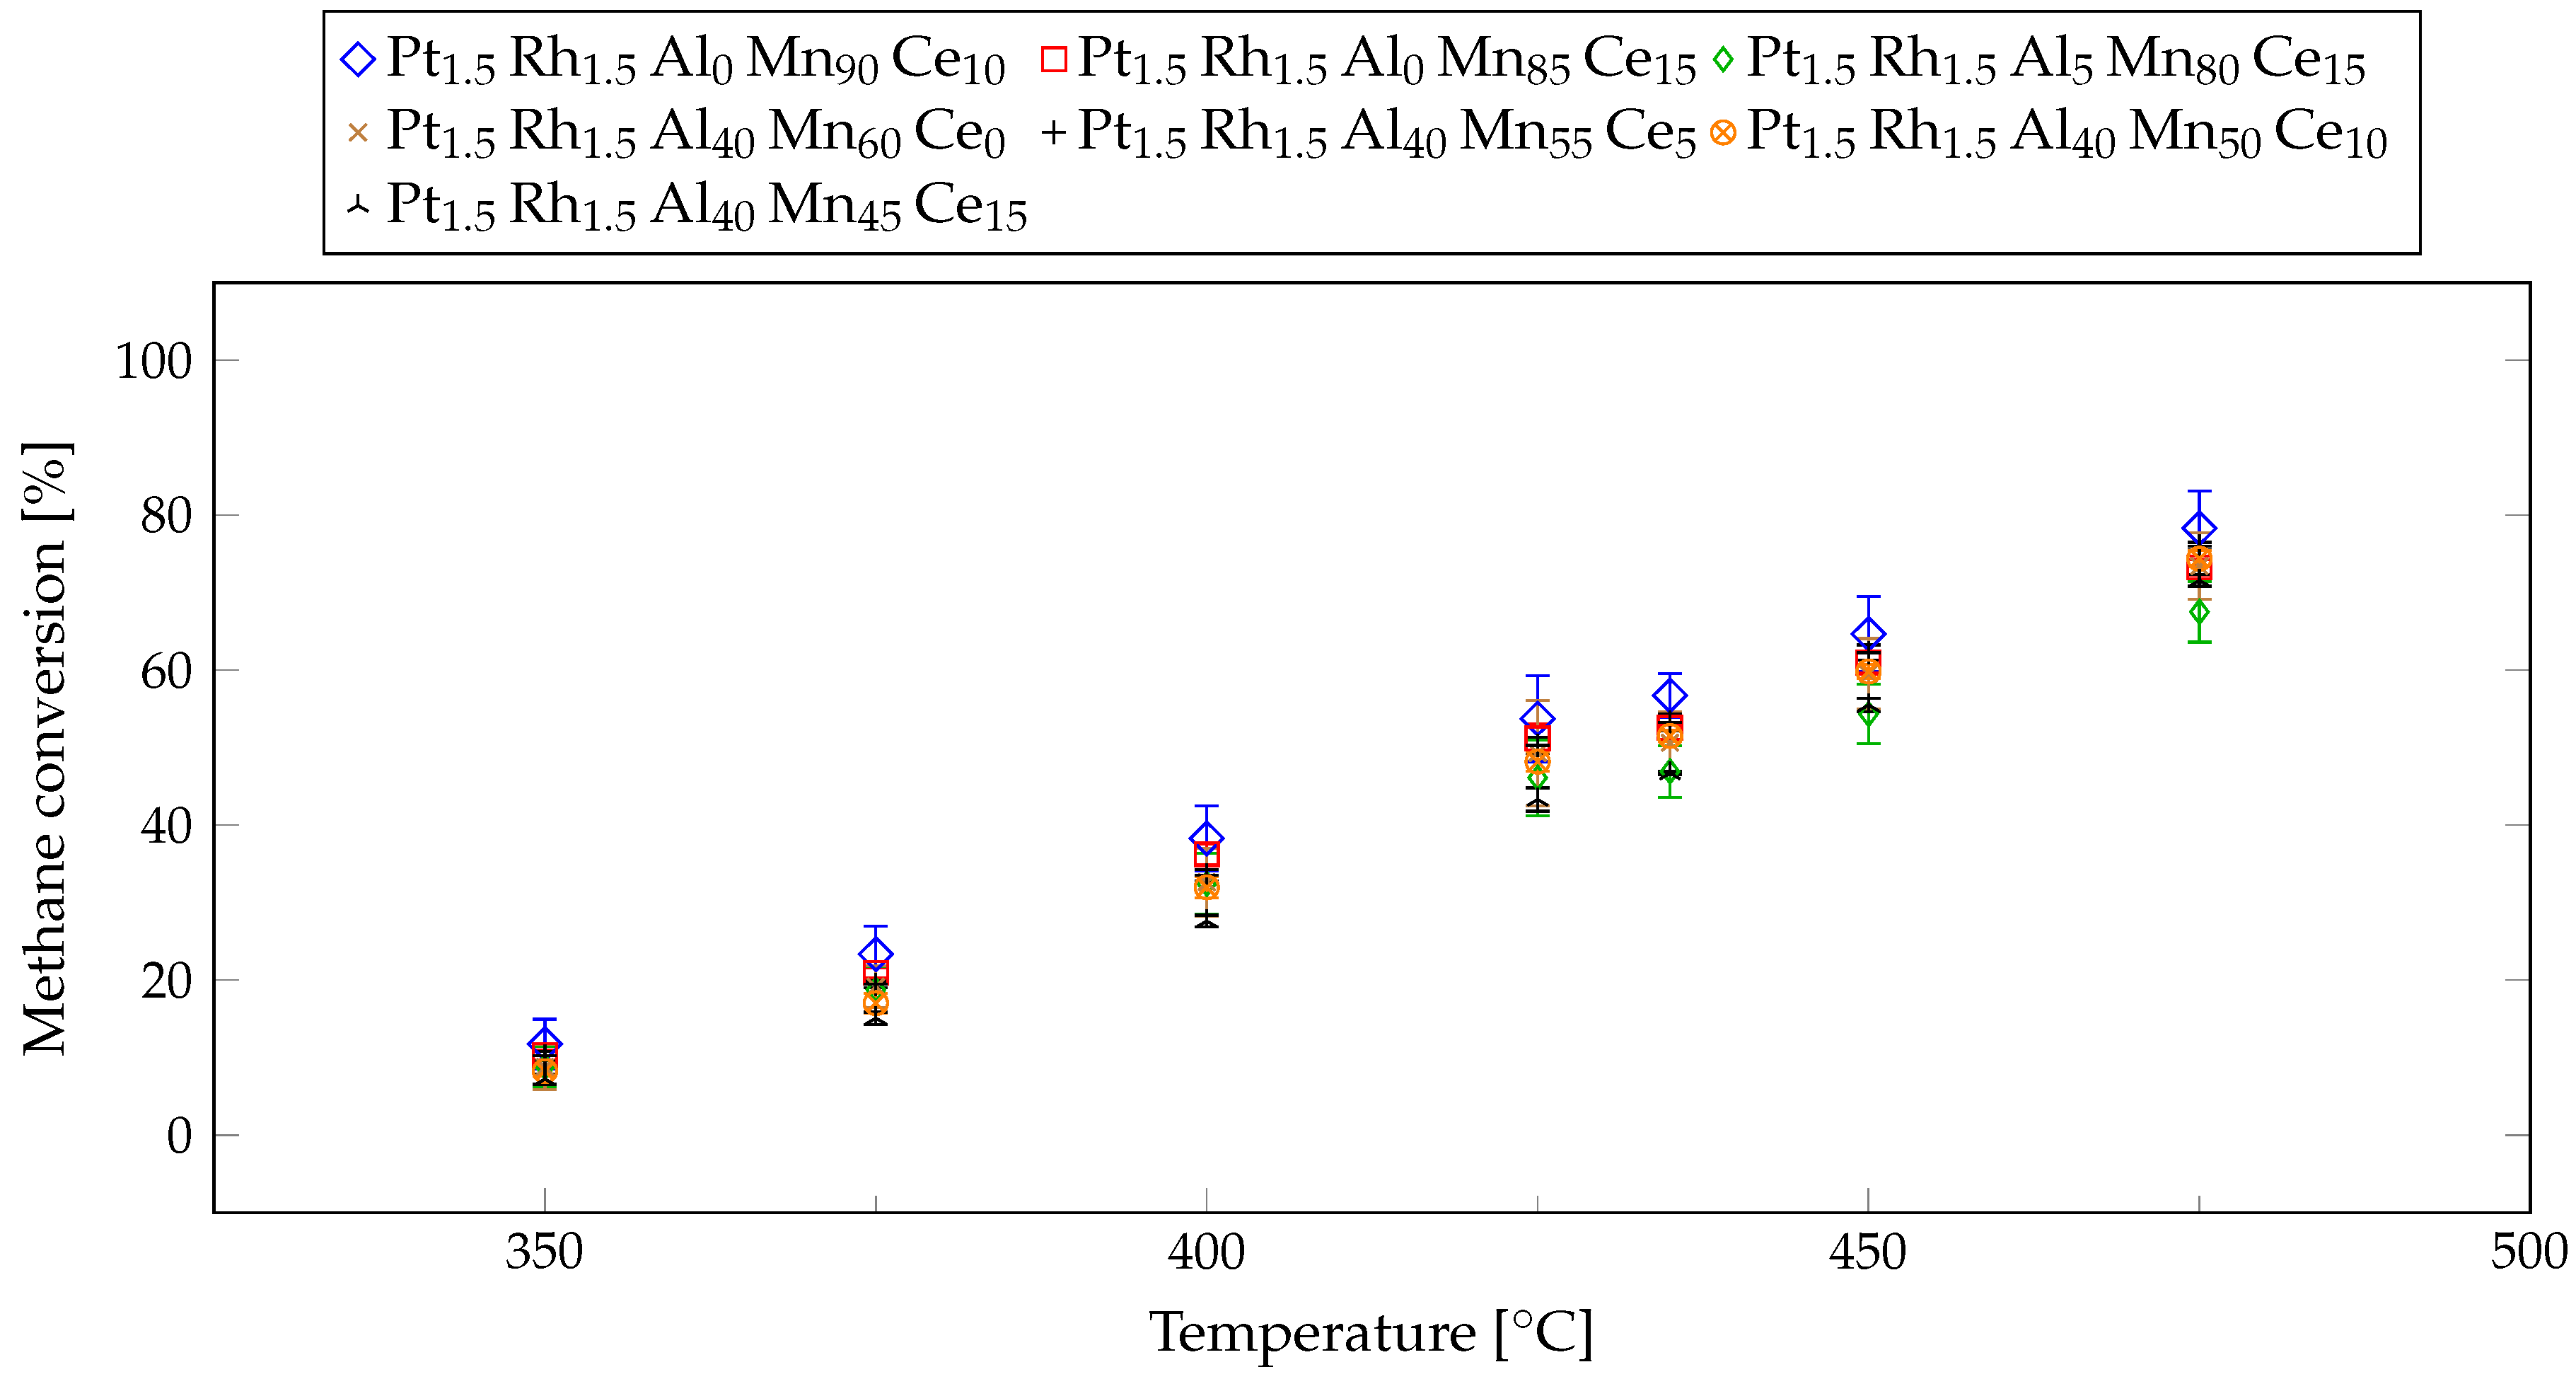
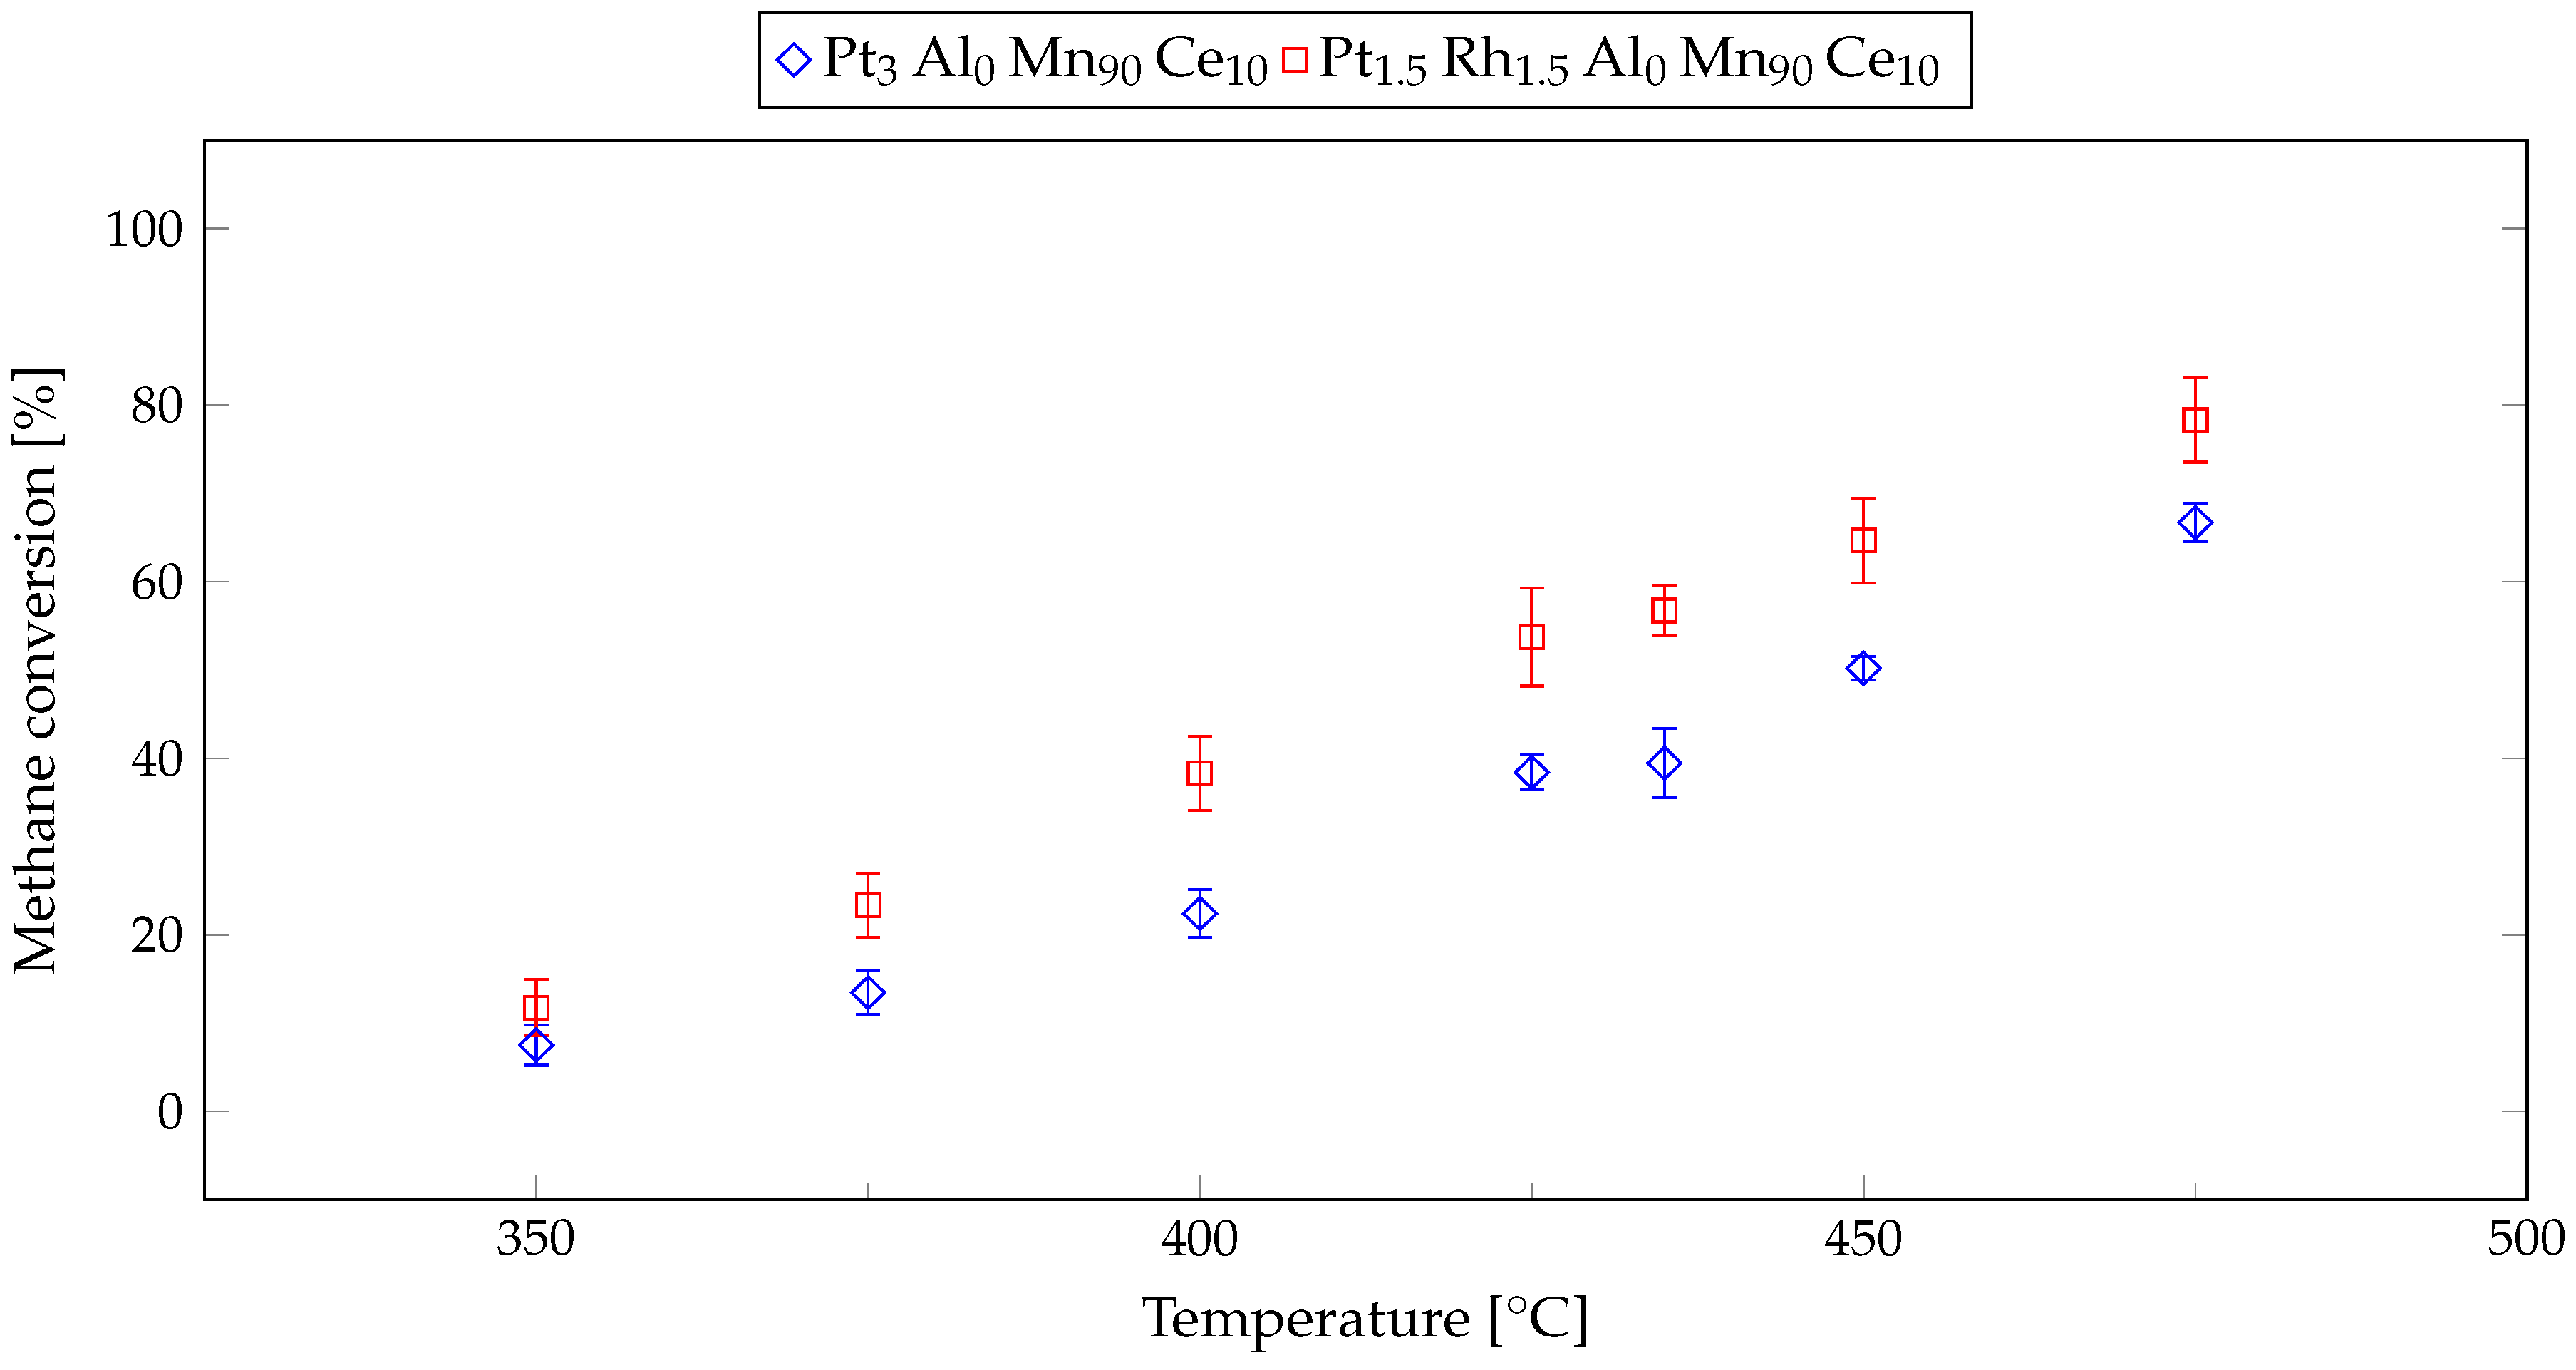
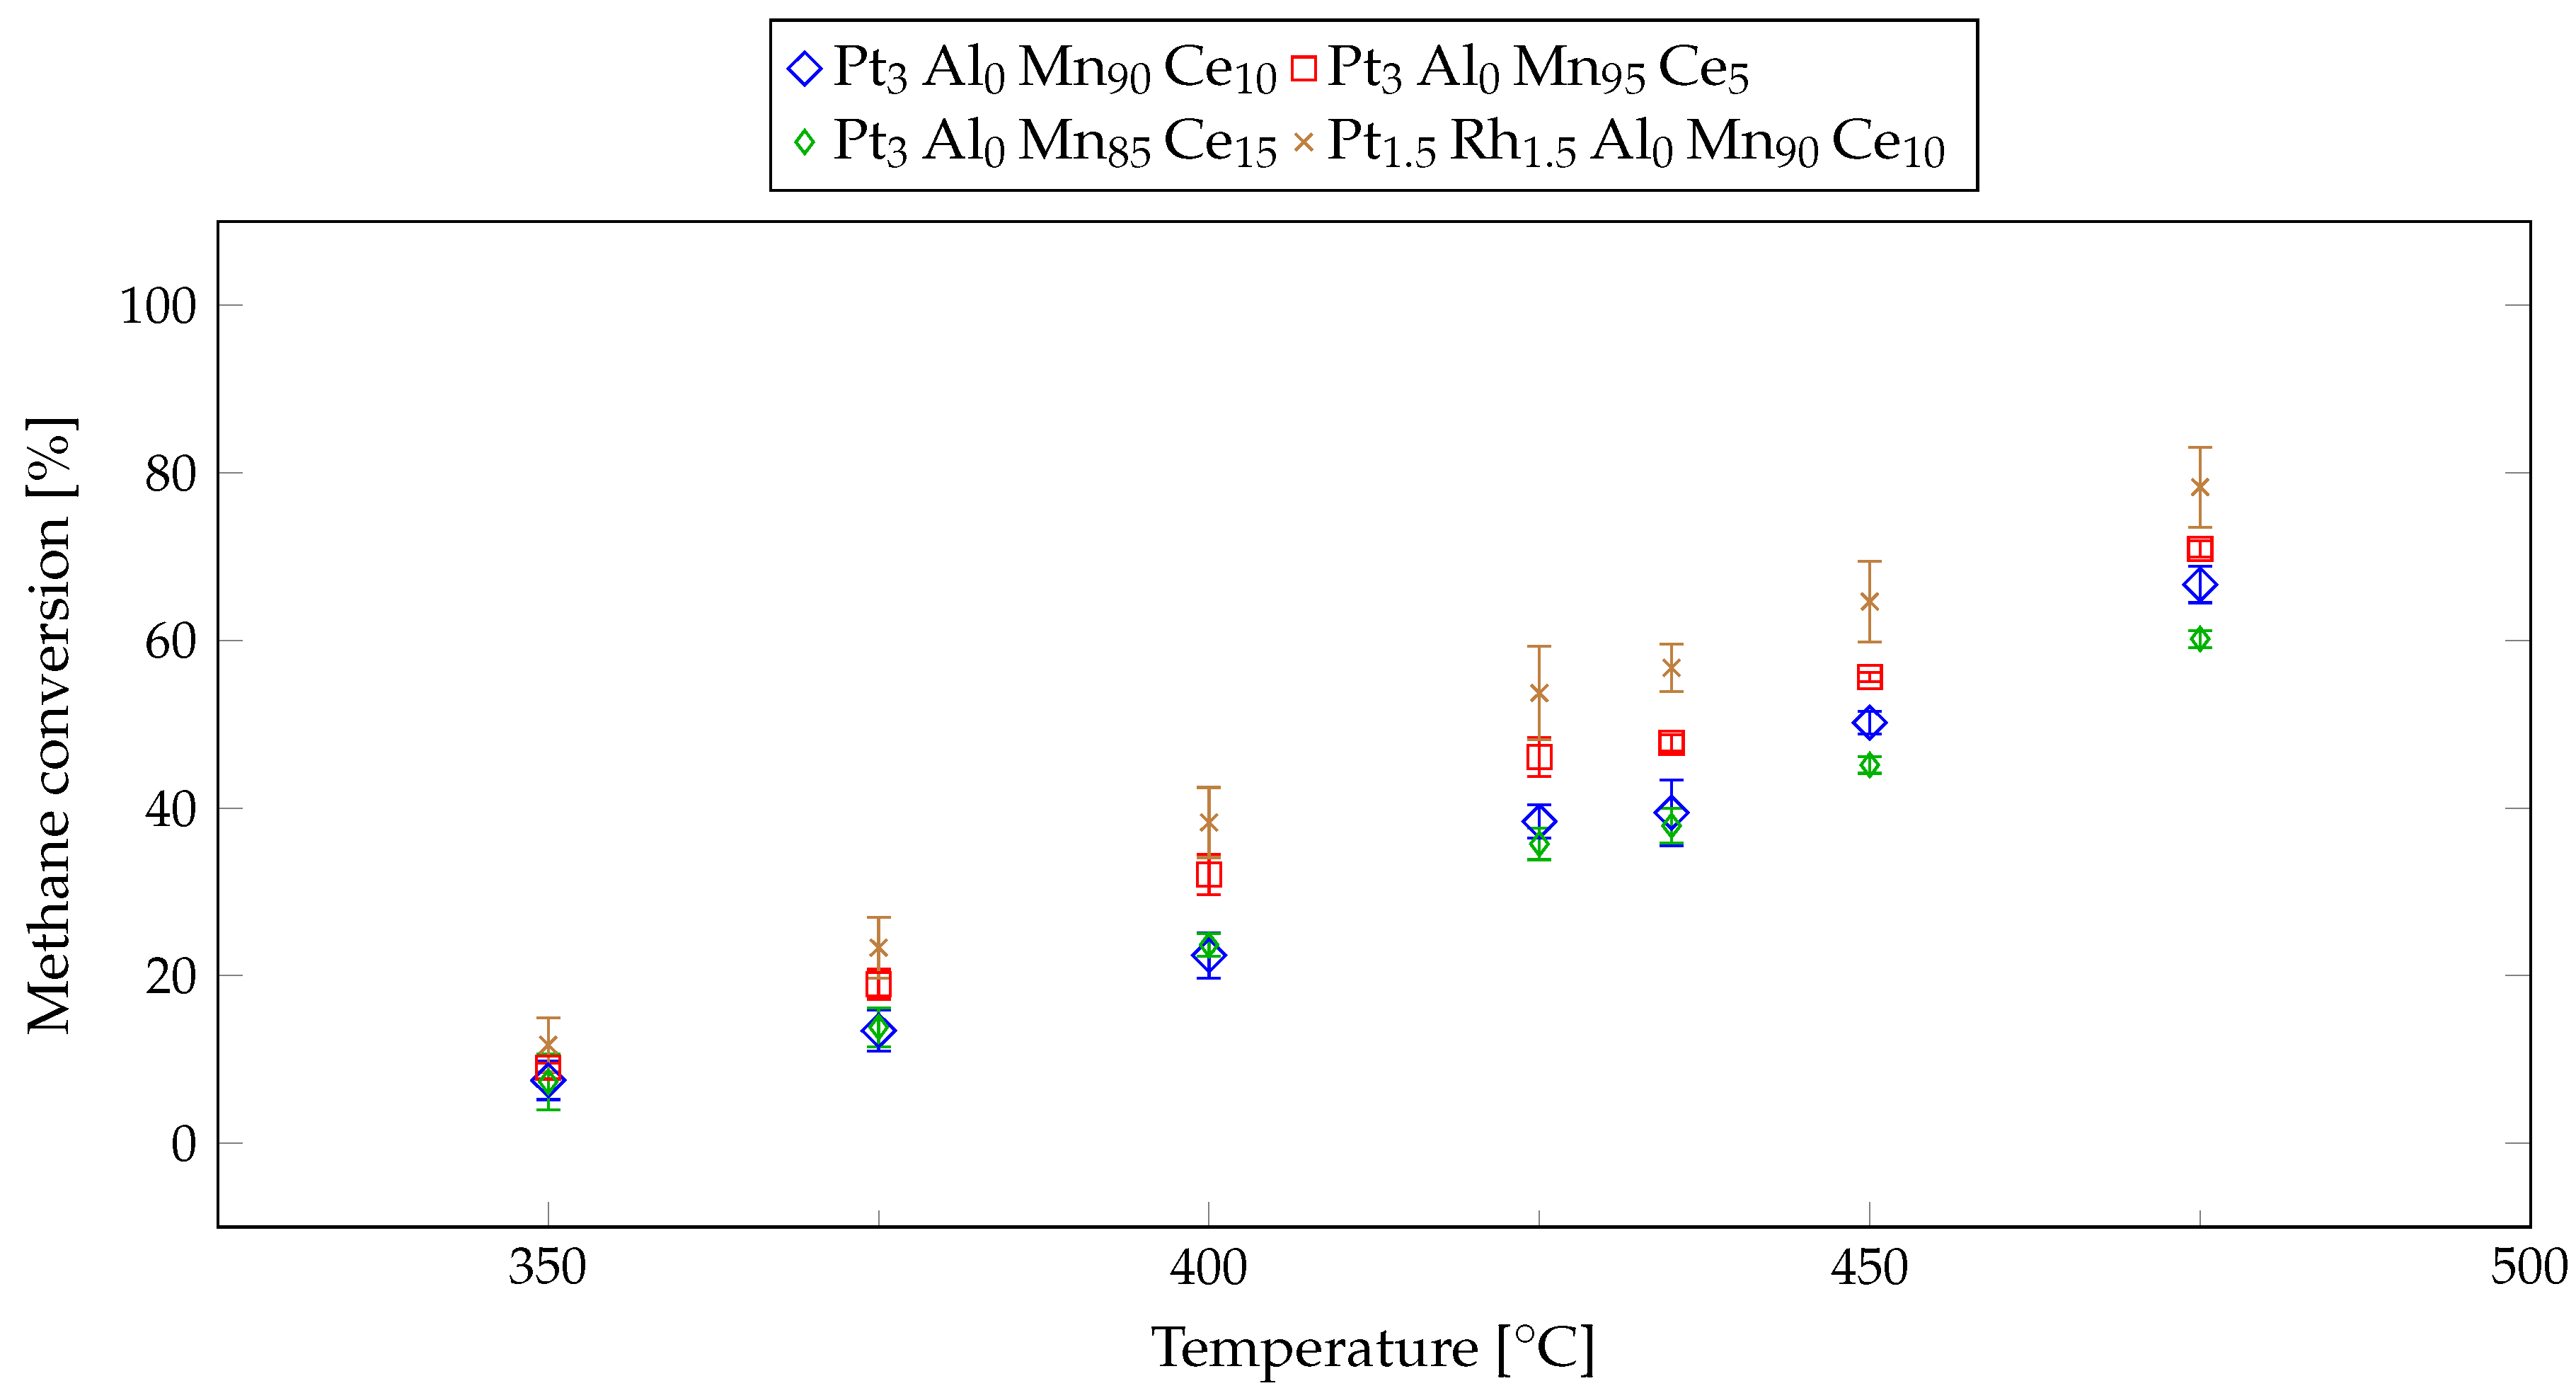
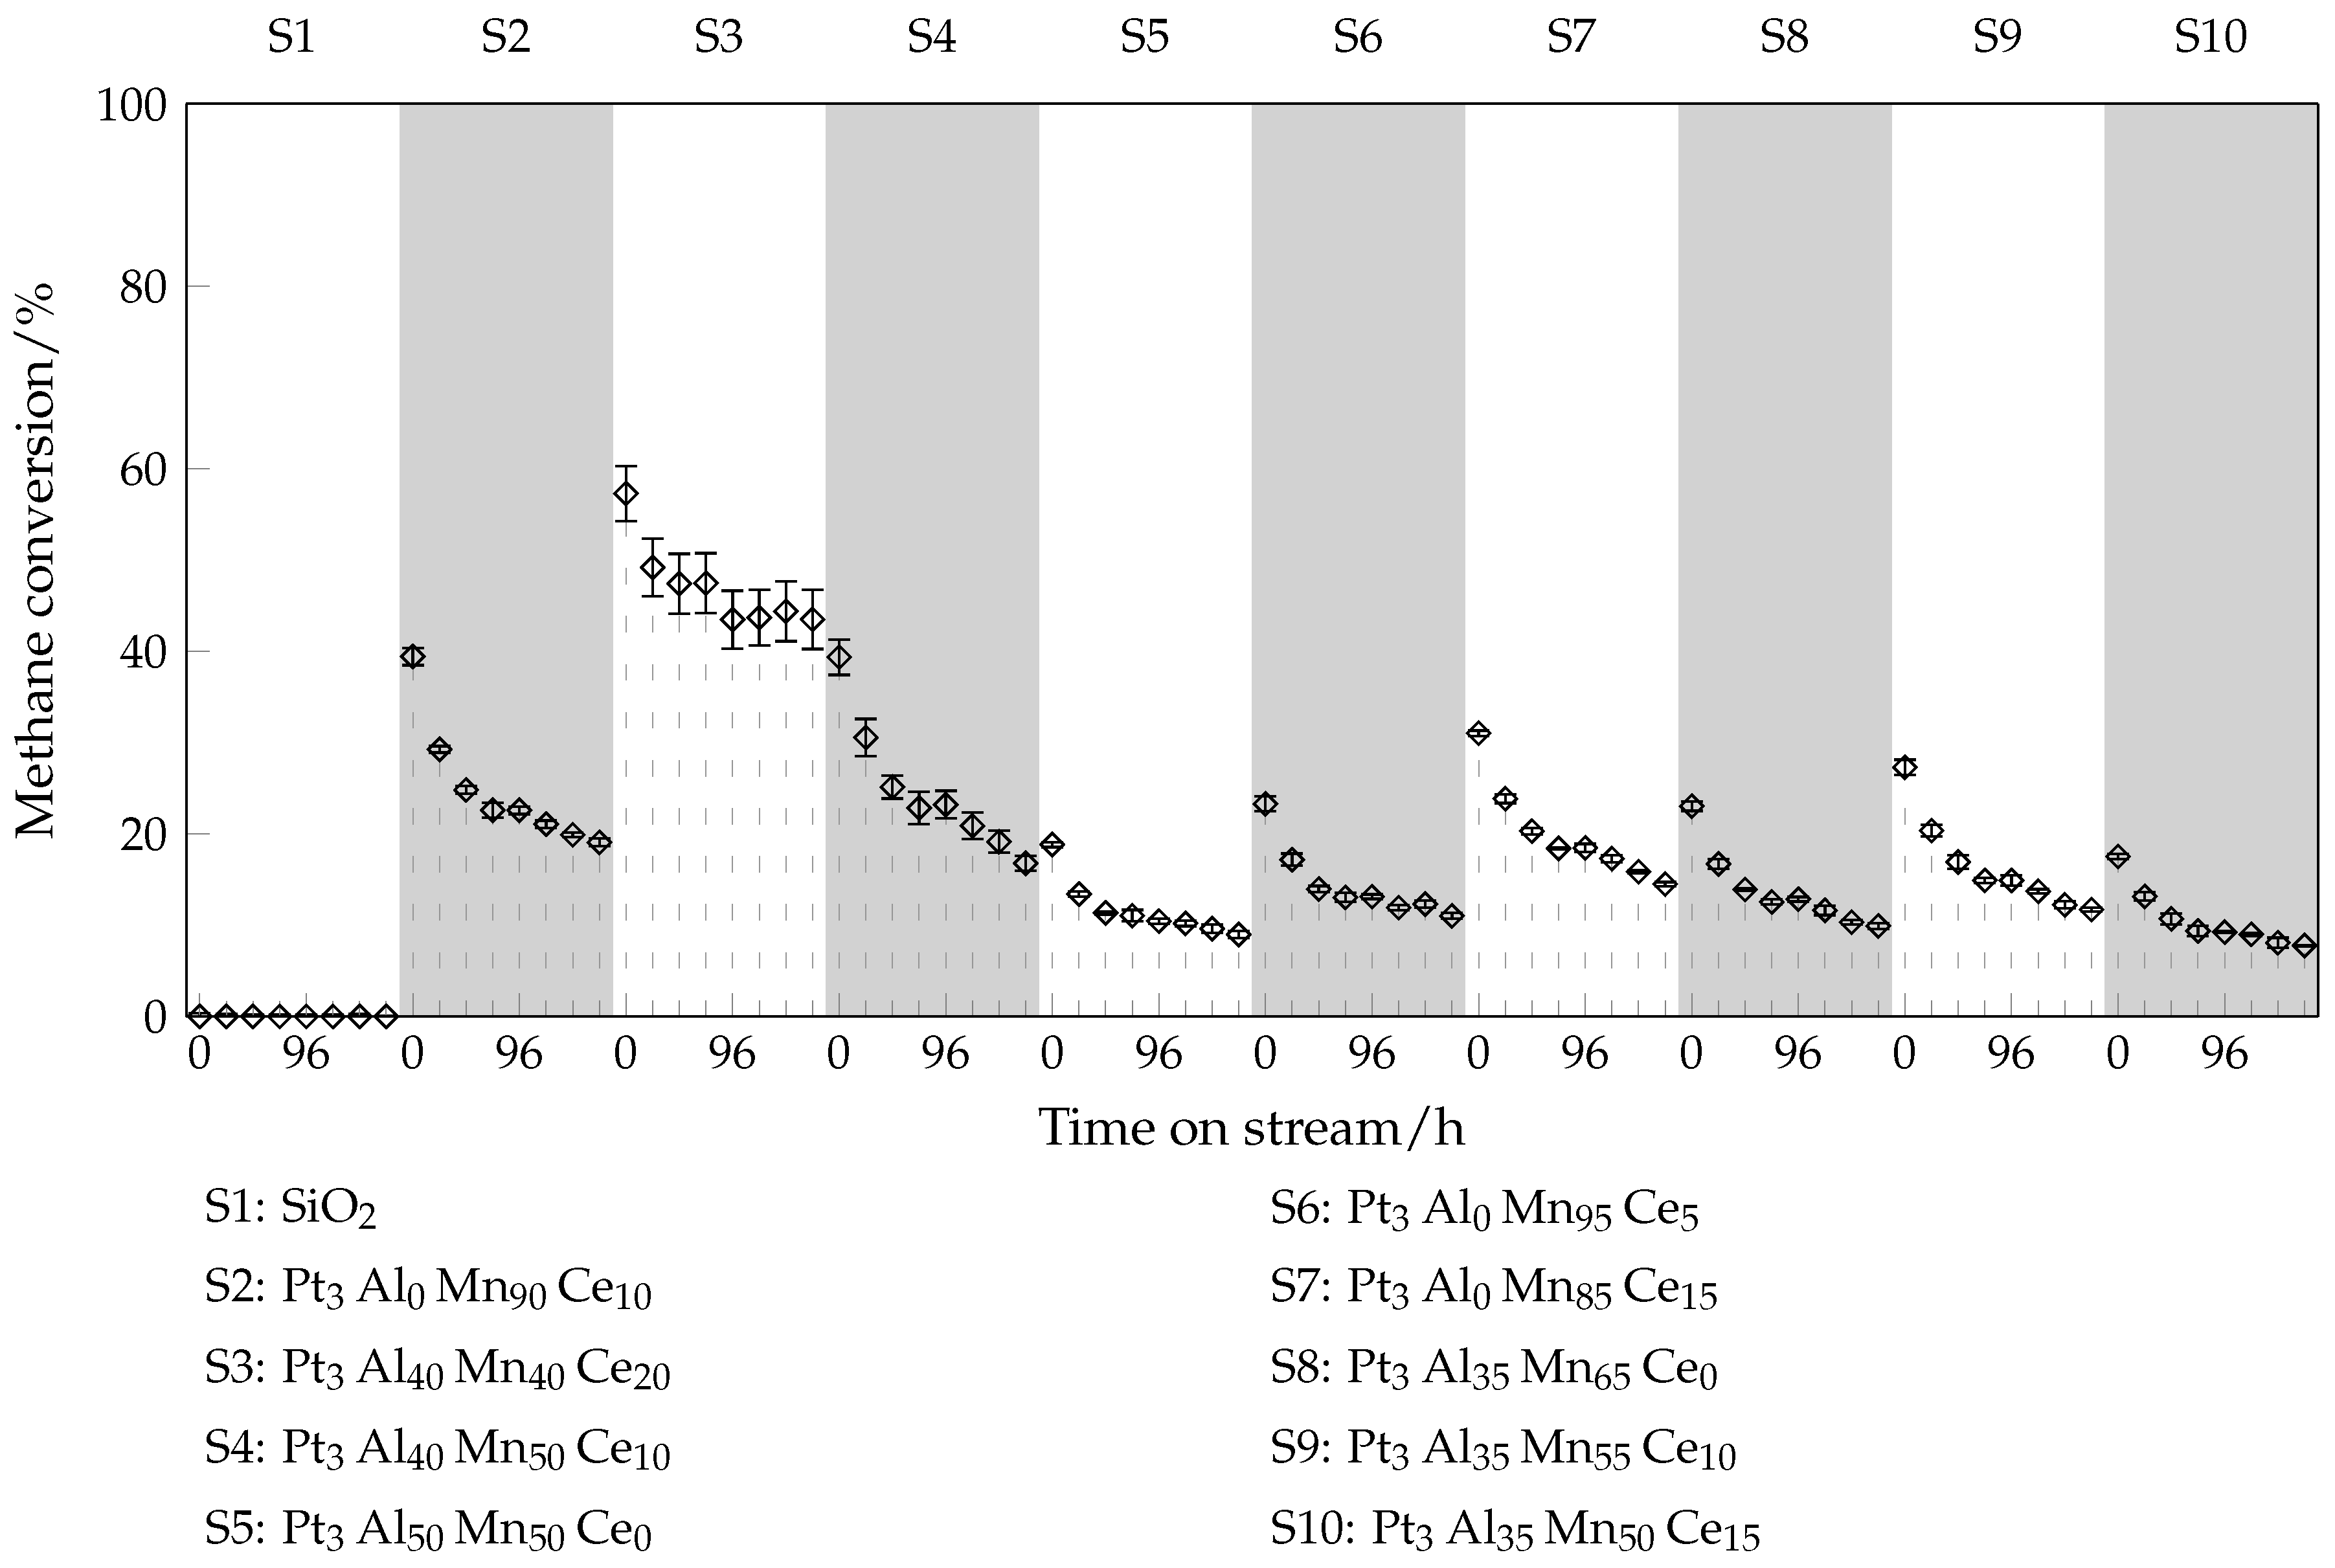
2.3. Methane Conversion from Gas Phase Plug-Flow Reactor

Samples displayed in Table 1 have been synthesized in larger quantities and have been characterized in our conventional validation setup, results are displayed in Figure 12. Details about the setup used are given in Section 4.3.
CO conversion for all samples presented in this work is 100% at all examined temperatures. This is in accordance to literature, since reactivity of CO with O2 is higher than that of CH4 with O2 [4].
Methane conversion for similiar compositions are in the same order of magnitude, compositions Pt3Al40Mn40Ce20, Pt3Al40Mn50Ce10, and Pt3Al50Mn50Ce (similar amounts of Al, Mn; small amount of Ce) show similar methane conversion. Methane conversion for Pt3Al20MnCe80 and Pt3Al20Mn10Ce70 (samples with high Ce content) is similar as well. Changing the composition within these subareas results only in a minor change in methane conversion.
Pt3Al50Mn50Ce has comparable methane conversion to Pt3Al50Mn50 from our first generation of catalysts, proofing a good reproducibility. Pt3AlMn90Ce10 has a methane conversion which is about 20 percentage points higher at 475 °C than the conversions of our first generation sample and of Pt3Al50Mn50Ce.
Samples with a high amount of Ce are to be considered false positive results in ecIRT, as they have a high value for Δ T but do not show high methane conversion in plug-flow reactor measurements. Indicator for the classification as false positive is the homogeneity of temperature distribution over the sample well in ecIRT-images, whereas active samples reveal a radial temperature profile over the well with a maximum in the middle of the sample position. Another indication of false positive results is the lack of temperature increase in the slate library surrounding the sample well. A possible explanation for this observation of a false positive result is a change in emissivity due to irreversible adsorption or reaction effects of the gas mixture components with the catalyst surface, a possible reaction might be: 8CeO2 + CH4 → 4Ce2O3 + CO2 + 2H2O.
CH4 and O2 have been removed from the gas mixture for emissivity correction and temperature calibration, which might lead to a oxygen evolution from some oxygen containing species (e.g., 2CeO2 → Ce2O3 + O2) or the addition of water to oxygen vacancies resulting in hydroxyl species like Ce3+−OH [20].
Usually only one component is removed from the gas mixture for emission correction and temperature calibration. Preliminary experiments showed fewer artifacts when the emission correction image is recorded in N2 after the reaction in comparison to an image recorded in a mixture of O2 and N2 prior to the reaction. Using wet O2/N2 mixture as background resulted in many samples showing high (apparent) temperature increases, but no change of temperature in the surrounding slate plate, i.e., frequently false positive results. These apparent temperature changes would disturb the measurement. Other examples of artifacts can be found in literature [59,60].
Therefore, results from a primary screening method that does not measure the target value directly (here: catalytic activity for methane oxidation) but using a secondary criterion (here: temperature increase using a method that relies on constant emissivity under measurement conditions) always have to be validated.
Results of conventional validation for slate libraries 2 and 3, with sample compositions selected from Table 2 and Table 3, are displayed in Figure 13 and Figure 14. Changing PM from Pt3 to Pt1.5 Rh1.5 improves performance. Comparing the best performing samples from Figure 12, Pt3 Al0 Mn90 Ce10, with the corresponding Pt1.5 Rh1.5 Al0 Mn90 Ce10, an increase in performance of up to 15 percentage points has been observed. See Figure 15 and Figure 16 for a side by side diagram of samples from both systems.
Methane conversion for samples selected from Table 2 with a composition Pt3 Ala Mnb Cec and a composition similar to samples from Figure 12/Table 1 are in the same order of magnitude, e.g., methane conversion at 475 °C for Al0 Mn90 Ce10 is ( 67 ± 2 )%, whereas methane conversion for Al0 Mn95 Ce5 is ( 71 ± 1 )%. From Figure 12 and Figure 13 it can be concluded that a major variation in composition Ala Mnb Cec has a large influence on performance. There is a difference in methane conversion at 475 °C of about 20 percentage points between the best and second best sample. For the samples containing Pt1.5 Rh1.5, the influence of composition Ala Mnb Cec on performance is far less, between best and worst performing sample the difference in methane conversion at 475 °C is about ten percentage points. This differences in performance is noteworthy, because sample compositions are similar in both cases, one region of interest is found at a small amount of aluminium (0 at.% to 5 at.%), high amount of manganese (80 at.% to 95 at.%), and low amount of cerium (5 at.% to 15 at.%); the other is found at about the same molar amounts of aluminium and manganese (40 at.% to 50 at.% with a small amount (0 at.% to 15 at.%) of cerium.
In Figure 15, the displayed error bars for the sample Pt1.5 Rh1.5 Al0 Mn90 Ce10 are larger than those for the sample Pt3 Al0 Mn90 Ce10, especially at temperatures higher than 400 °C. This larger error bars result from a decrease in methane conversion over time at the given temperature. The first of three GC measurements at a given temperature always revealed highest methane conversion, whereas the one recorded about 30 min later had already decreased in performance. The decrease of performance at constant temperature over 30 min is usually in the range of 6 to 11 percentage points. This behavior can be observed for six out of seven Pt1.5 Rh1.5 containing samples, but only for two out of five Pt3-containing samples. Gélin et al. reported a drop in conversion for Pt/Al2O3 samples when measured at constant temperature for 1 h [12], a similar phenomenon might be the reason for the observed behavior of some samples.
Due to vastly different conditions for analyzing CH4 conversion, comparing our results with the literature is challenging. Besides inherent differences in synthesis method and composition, and, therefore, a limited comparability, the most important differences are: GHSV, gas composition (amount of CH4, O2, presence of H2O, CO2, other exhaust gas components like SO2, NOx), temperature program (heating or cooling or both, temperature rate, stationary process at discrete temperatures or continuous process), pretreatment (with O2, H2, or none). Our aim is to test materials under conditions as close to reality as possible. Therefore, we test our catalysts starting at low temperatures going to higher temperatures (starting the engine), measuring at discrete temperatures after 15 min of equilibrating. We also test with a gas composition getting as close to a real-world exhaust gas as possible. Limitations in our setup are: He as balance instead of N2, no particulate matter/soot, and catalysts are tested as powder (not as a monolith/honeycomb structured catalyst).
For comparison between different catalytic systems, usually T 50 and in some cases T 10 and T 90 are used in the literature. T x represents the temperature T, at which a CH4 conversion of x is achieved. In Table 4 T 50 values from previously published materials as well as measuring conditions are given. The best performing material from Figure 5 is Pt3AlMn90Ce10 with T 50 = 450°C. Since our measurement conditions are closer to a real exhaust gas composition, it is hard to compare with other systems. Many T 50 values given in Table 4 are lower than that of our best catalyst, but many of them were recorded with simplified gas composition like CH4, O2, and a balance gas. Space velocity is also different for many cases. Therefore, differences in T 50 can be as high as some 200 K (5% Pd@ZrO2 from [66]), where gas composition lacks components that makes CH4 oxidation more difficult like H2O, SO2, and CO2. Additionally, space velocity in the referenced work is 50% of the space velocity we have used. Other catalysts have T 50 in the same order of magnitude (e.g., those from [67,68]), where they also used a gas mixture containing only CH4, O2 and N2, and the space velocity (GHSV) used is about four times higher than the space velocity used in this work. Other samples show a lower T 50 than our best performing sample, where gas composition is more complex than CH4, O2 and balance (e.g., [7,11,43]), and space velocity (GHSV) is in the same order of magnitude. The most likely reason for different performance is due to different synthesis methods (impregnation, commercial sample vs. sol-gel-approach), probably resulting in vastly different surface areas, porosity and dispersion of active components. Another reason for higher T 50 of our catalyst might be the additional components in our gas mixture (SO2, NOx, CO), which have a detrimental influence on performance. CO molecules are blocking active PM sites reversibly as a parallel reaction, whereas SO2 often leads to irreversible deactivation [12,23,43,44]. Our sample does not reach 100% CH4 conversion even at 475 °C, whereas many samples from literature reach 100% CH4 conversion at lower temperatures, but those conversions are almost always measured for exclusive methane combustion with oxygen excess and in many cases, without water and other active site blocking species present.

2.4. Ageing Behavior Results

Ageing tests have been done for samples selected by activity from library compositions previously tested by ecIRT and are displayed in Figure 17. Aiming towards a long-term stable catalyst, our ageing method was designed to age for at least one week with an option to age for up to several months.
None of the nine selected samples achieved a methane conversion that is stable for 168 h. Methane conversion dropped about 50 for all samples within the period of investigation. Samples Pt3 Al50 Mn50Ce and Pt3 Al50 Mn50 from our first generation showed comparable ageing behaviour, proofing again the reproducibility of our method. Pt3 Al0 Mn90 Ce10 performed 20 percentage points to 10 percentage points better than our first generation Pt3 Al50 Mn50 or Pt3 Al50 Mn50 Ce after 0 h and 168 h, respectively. Comparing samples that have similar composition supports the observation that the addition of Ce can improve the performance. Sample 4 (S4) performed better than Sample 5 (S5), exchanging 9.7 at.% of Al with Ce increased performance to roughly the same level as Sample 2 (S2) had. Samples 5, 8 and 6 (the samples with 0 at.% or 4.85 at.% of Ce) had the lowest methane conversion from all 9 investigated samples.
Sample 3 (S3) shows better performance compared to the other samples and initial CH4 conversion was even higher than measured before at the same temperature of 450 °C (see Figure 12). This increased performance and a larger error is due to problems with gas supply. We tested the gas flow through each sample prior to starting the experiment; the gas flow for S3 was about one third of the usual gas flow. Lower flow rate resulted in higher residence time and, therefore, a higher conversion. Larger error bars than usual (based on experience) indicate anomalies during the measurement, where some errors occur in addition to normal statistical spread (outlier). Ageing during the measurement as in the conventional validation could be possible in theory, but a single measurement takes about 2 min 30 s. It is unlikely to affect the results, because the ageing are observed in the range of several hours. Therefore, measurements of S3 are used to illustrate that for large sets of data, error bar size can be used to validate the consistency of obtained data.
Comparing ageing results with results from conventional validation shows initial methane conversions in the same order of magnitude. Differences are in the range of 6 to 23 percentage points. CH4 conversion measured in conventional validation setup is usually higher than that from ageing setup. The most likely reason for these differences is a WHSV of 72,000 mL/(g h) in ageing versus 36,000 mL/(g h) in conventional validation. One more reason are differences in gas composition, see Section 4.4 for details. Additionally, CH4 conversion is measured in the ageing setup at 350 °C prior to the first measurement at 450 °C, which takes about 3 h to 5 h. Conversion data for 350 °C are not shown in Figure 17. This might also decrease overall performance prior to the first displayed data at 450 °C.
In Table 5, conditions for ageing experiments from different previous publications are displayed. Comparing our results with data from different sources is even more challenging than before. Among these differences are ageing conditions and ageing time. Different conditions have been reported which are aiming for different situations, e.g., focusing on only one component like H2O or H2S or using a more complex approach to simulate an exhaust gas [12,43,44]. Ageing times are in the range of a couple of hours (there are publications with ageing times less than 12 h) to a couple of days. Gas compositions differ from using only CH4, O2, and a balance gas to a more complex approach using components like H2S, H2O, CO2, and NOx. Because of these differences in measurement conditions, a detailed comparison of results is omitted here.
As a conclusion from comparing the results from all the different groups working on methane abatement, it would be beneficial for the scientific community to agree on a set of testing conditions to increase the comparability between publications. We encourage to always test with a complex model exhaust gas containing the same amount of CH4, O2, CO2, and H2O, this would be closer to a real-world application. If possible, the addition of further gases (like SO2 and NOx in our work) should be considered, especially if a component is known to poison catalysts. We further suggest to record the methane conversion starting at low temperatures if the research is focused on a catalytic converter, especially if it might be used in cyclic operation. The increasing temperature while measuring conversion mimics the start up behaviour and tends to give more realistic results. If the conversion is measured starting at high temperatures, hysteresis effects might lead systematically to high methane conversion.
We also encourage to include ageing tests into standard procedure, particularly when there might be a real-world application for the catalyst.
We are aware that testing with a complex gas mixtures is a technically demanding task. It is also clear that different scenarios for real-world application (e.g., methane abatement from mine gas versus abatement from a gas-operated light-duty vehicle) demand for different test settings. A common basis for different applications would be testing with only methane in air, but this would be misleading. Resulting methane conversions would be higher than in any complex gas mixture.

3. Discussion

We developed a unique set of tools for high-throughput screening of catalysts. We are able to measure catalyst performance for methane oxidation under close to reality conditions except for particulate matter/soot.
We have selected one data set and presented the results of our high-throughput workflow for this set here. Some hundred samples have been tested with ecIRT, 18 samples have been tested in our conventional plug-flow reactor setup and nine samples have been tested for their ageing behavior. Our best performing catalysts are Pt3 Al0 Mn95 Ce5, Pt3 Al0 Mn90 Ce10 and Pt1.5 Rh1.5 Al0 Mn90 Ce10, but none of them reached 100 methane conversion in our plug-flow reactor at 475 °C or had a stable methane conversion in ageing tests for 168 h. Comparing the results with the literature is difficult, due to vastly different gas composition as well as different experimental conditions. We are, to the best of our knowledge, the only group that has tested ageing behavior of up to ten different methane abatement catalysts in parallel for 168 h. Our setup was designed to allow for even longer ageing measurements, which might be needed to test long-term stable catalysts and rate their performance.
The results presented here represent only a small section of the compositional parameter space investigated (see Figure 2). Other sol-gel-based samples that are under investigation have outstanding performance and stability.
We are aware that the catalytic systems we have presented are not applicable in an real-world application yet, due to expensive sol-gel synthesis as well as low performance and stability.
Our set of HTS tools can also be applied to other synthesis methods for catalysts, like incipient wetness or other industrial applicable methods. Additionally, the setup is flexible and could also be used to screen catalysts for other applications, for example, oxidation of other hydrocarbons like propane, propene, or to test for other gas phase reactions like selective catalytic reduction of NOx.

4. Materials and Methods

4.1. Synthesis

All chemicals were used as supplied.

4.1.1. List of Materials

  • Aluminium nitrate nonahydrate—CAS 7784-27-2—Alfa Aesar 12360—98%
  • Manganese(II) nitrate tetrahydrate—CAS 20694-39-7—Alfa Aesar A18521—98%
  • Cerium(III) nitrate hexahydrate—CAS 10294-41-4—Alfa Aesar 11329—REacton 99.5% (REO)
  • Platinum(II) nitrate—CAS 18496-40-7—Heraeus
  • Rhodium(III) acetylacetonate—CAS 14284-92-5—Heraeus
  • Propan-2-ol—Carl Roth—6752.2—Rotripuran ≥99.8% p.a. (IP)
  • Propanoic acid—Carl Roth 6026.3—≥99% zur Synthese (PA)
  • 4-Hydroxy-4-methylpentan-2-one—CAS 123-42-2—Alfa Aesar A16248— ≥98% (CA)
  • Methanol—CAS 67-56-1—Fischer Scientific M/4058/17—HPLC Gradient grade (MeOH)
  • Pentane-2,4-dione—CAS 123-54-6—Alfa Aesar A14117— 99% (Hacac)
Gases were supplied by Praxair and Air Liquide:
  • O2 99.5%
  • N2 99.999%
  • CO2 99.9995%
  • He 99.999%
  • 10 vol.% CH4/N2
  • 8500 ppm CH4/He
  • 250 ppm SO2/N2
  • 1600 ppm CO, 37.5 vol.% CO2, 30 ppm SO2, 360 ppm NO/He
  • 240 ppm NO2/He

4.1.2. General Procedure

Precursor solutions were prepared following standard laboratory practice. An equal volume mixture of propan-2-ol (IP) and propionic acid (PA) was used as solvent for Al, Mn, and Ce precursors, whereas the Pt precursor was dissolved in methanol (MeOH) and the Rh precursor in a equal volume mixture of MeOH and pentane-2,4-dione (Hacac). The calculated volume of 4-Hydroxy-4-methylpentan-2-one (CA), corresponding to three times the molar amount of precursor, was added to selected solutions. Hacac and CA were used as complexing agents to prevent precipitation of components from the solution. The mixture was stirred until a clear (and for Mn, Pt, and Rh a colored) solution was obtained. Solutions for the selected elements were prepared according to Table 6.

4.1.3. Samples for ecIRT

The molar amount of all samples prepared for ecIRT was 350 μmol, resulting in enough material to fill two sample wells in a slate library. After sample definition, in-house developed software Plattenbau [64,71] was used to prepare a pipetting list for one of our pipetting robots. For liquid dosing of precursor solutions a pipetting robot of type Lissy made by Zinsser Analytic, Germany, was used. For liquid handling 2 needles and one 500 μL syringe pump for each needle are available, the needles have a liquid level detection. Several racks machined from different steel materials with different well sizes for accommodation of reservoirs of various volumes were employed for storage of the precursor solutions during the pipetting steps. Precursor solutions were placed in one rack in 8 mL glass tubes (Macherey–Nagel, 702096), glass tubes for samples (1.5 mL GC vials, Macherey–Nagel, 702282) were placed in a second rack. After pipetting, the sample rack was placed on a vortexer (IKA KS 260 basic) and the solutions were mixed for 2 h at 300/min. Gelation was achieved in an oven for about two weeks at 40 °C. Calcining is done following the process displayed in Scheme 1.

4.1.4. Samples for Characterization in Conventional Plug-Flow Tube Reactor and Ageing Tests

The molar amount of all samples prepared was 5000 μmol. For each sample, the necessary volumes of each precursor solution was transferred in a 100 mL beaker using Eppendorf pipettes (Research plus, 20 μL to 200 μL, 100 μL to 1000 μL, 0.5 mL to 5 mL, 1 mL to 10 mL). The beaker was covered with Parafilm and stirred for 2 h. The solution was then transferred and split into three glass vials (volume 30 mL, VWR, 548-0624), to reduce the time needed for gelation. Gelation and calcining were done following the same procedures described in Section 4.1.3.

4.2. Emission Corrected Infrared Thermography

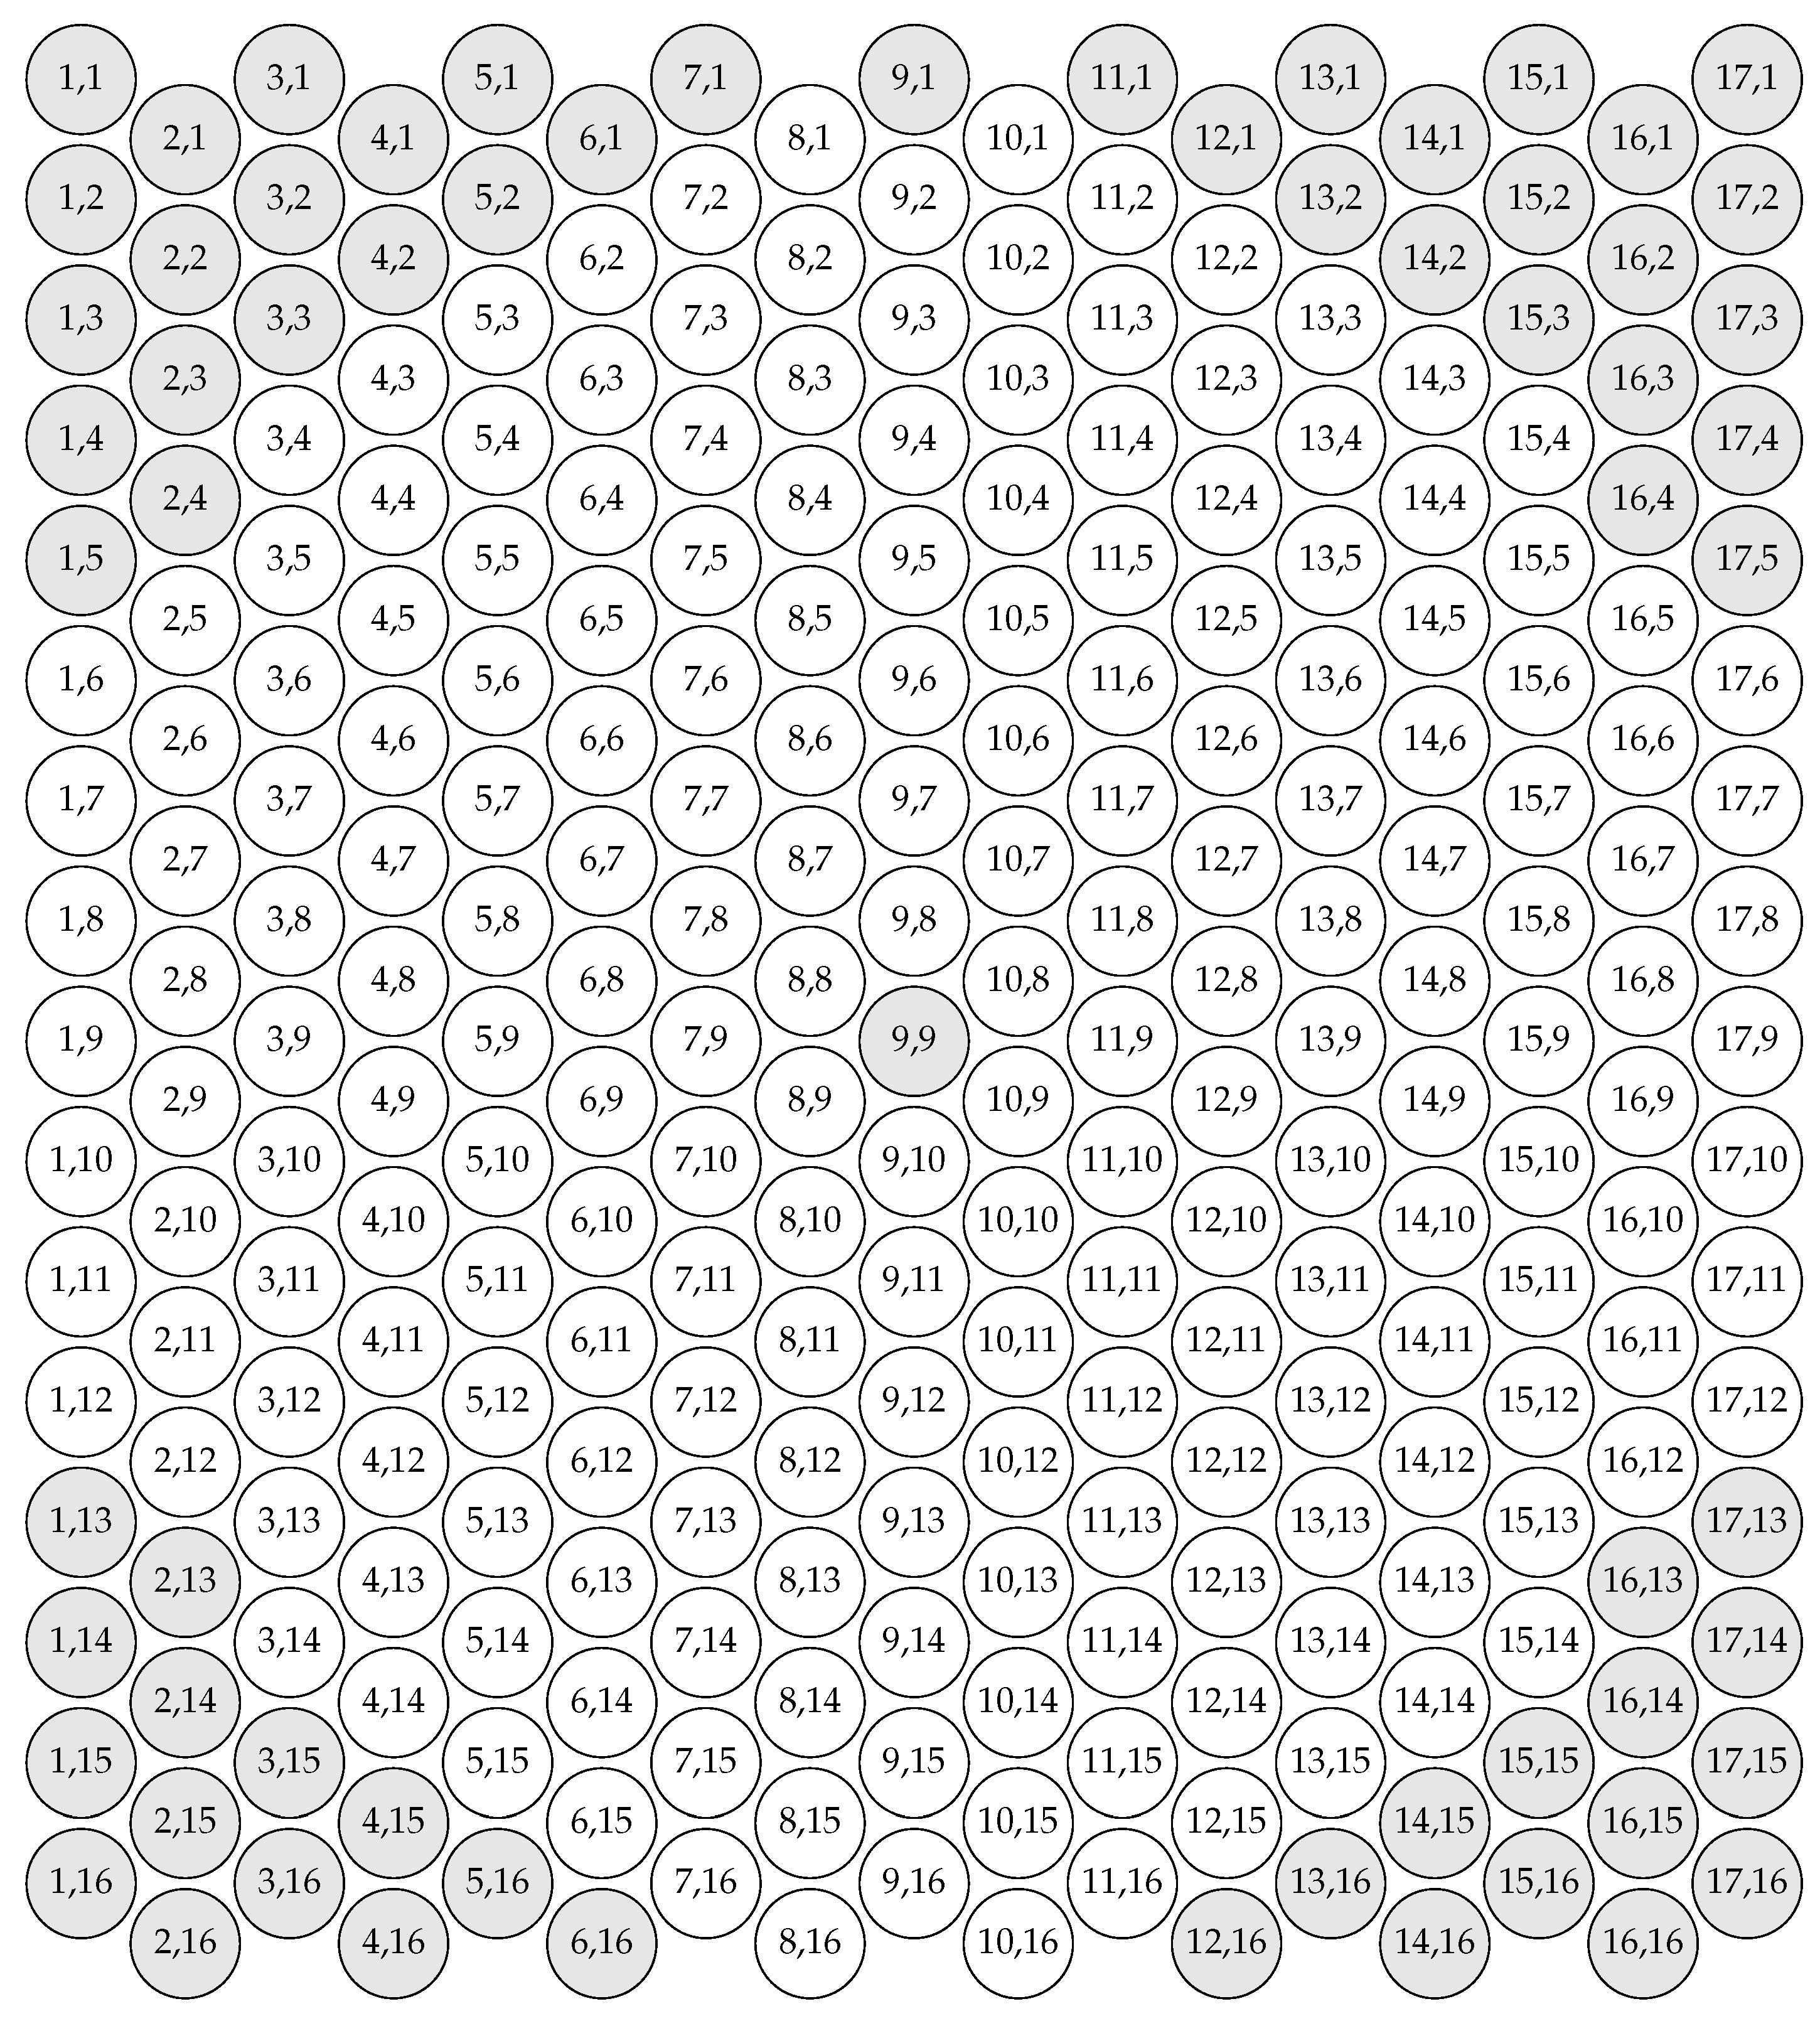
4.2.1. Library Preparation

The libraries for emission-corrected Infrared Thermography (ecIRT) were machined from natural slate. This material behaves nearly as an ideal black body emitter in ecIRT and shows no reflections of radiation. Other materials like steel have to be blackened before usage. The plates had a diameter of 100 mm and were 6 mm thick. A total of 206 wells were drilled into the surface as sample positions. Wells had a diameter of 3 mm and were 2 mm deep. They were arranged in a hexagonal pattern for best use of space and were named after their x and y position as can be seen in Figure 18. Slate libraries had a small mark over (9,2) to identify orientation. Position (9,9) was drilled through the library and operated as gas outlet, diameter 4 mm. Four additional holes (2,4), (2,13), (16,4) and (16,13) were drilled though the library to ease handling while assembly and disassembly of ecIRT setup, their diameter was 4 mm.
Prior to filling a slate library plate with samples, it was heated following the procedure displayed in Scheme 2.
Samples were filled in the wells manually. Samples were placed in random order in a pattern that allowed as much distance between individual samples as possible. To increase the accuracy of this method, samples were placed on the same library plate twice. Samples were ground lightly prior to filling using a glass rod (diameter 3 mm). Samples were filled in selected wells with a small spatula to at least 80 and were compressed with a glass rod (diameter 3 mm) to achieve a flat surface. Spilled material was removed carefully using a small vacuum cleaner setup, consisting of a vacuum pump, a gas wash bottle, and a tube connected to an Eppendorf tip. After filling the library plate, it was inserted into the measurement setup described below.

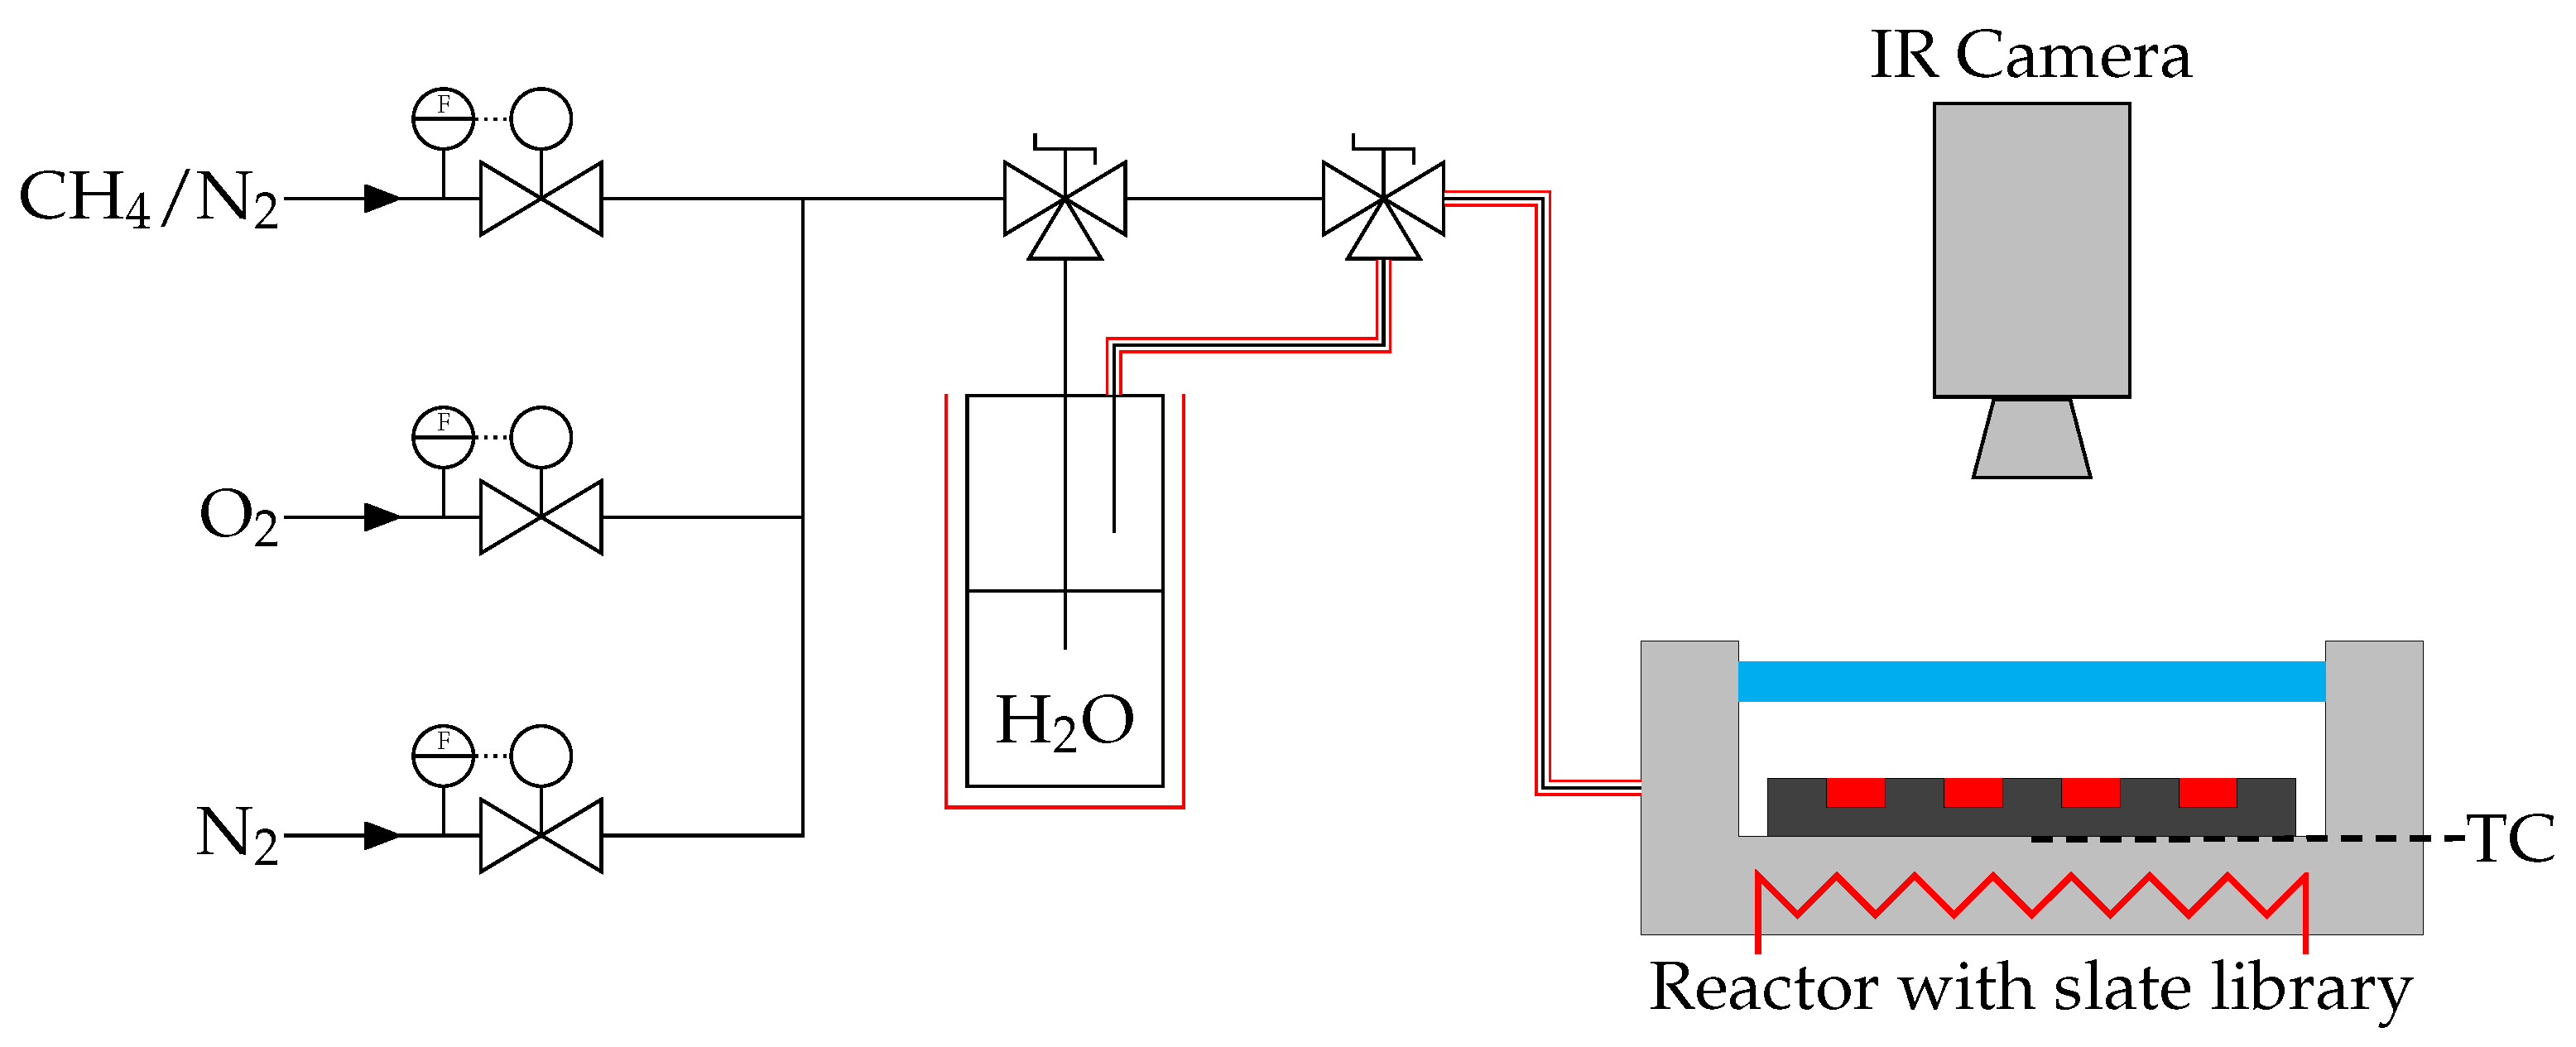
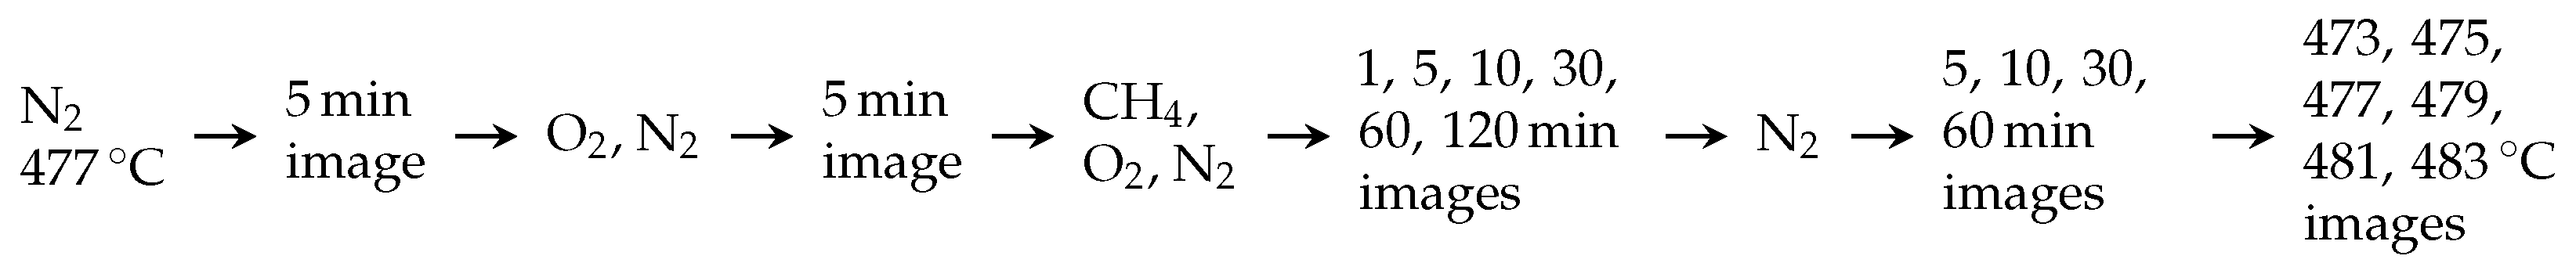
4.2.2. Experimental Setup for ecIRT

The ecIRT setup consisted of three mass flow controllers (CH4/N2, N2, O2), a heated gas washing bottle, a heated reactor setup with a sapphire glass plate covering the slate library, and a Thermosensorik IR camera with a 640 × 486 PtSi FPA detector. The camera was equipped with a set of neutral density filters made from germanium (Thermosensorik). The filter with a transmission of 1 was used for results shown in Figure 3, Figure 7 and Figure 9. 100, 10 and 0.1% transmission filters were also available. With manually operated valves, gasses from the mass flow controllers could bypass the heated gas washing bottle to turn humidification on or off. Humidification was turned on after heating was completed and was turned off prior to cool down, so H2O was present at all times during the experiment. A simplified scheme of the setup can be seen in Figure 19.
The gas composition for ecIRT experiments was 2 vol.% CH4, 8 vol.% O2, and 12 vol.% H2O. N2 was used for balance, the total gas flow was 50 mL/min. Prior to conducting experiments, our heating setup was calibrated using a metal cover with six holes, a slate library plate filled with sand, and thermocouples measuring the temperature at the SiO2 surface at six different positions. The metal cover was placed in three different positions to measure the temperature across the slate library. The average of these temperatures was used to calculate the necessary setpoints for heating to achieve desired temperatures.
To reduce thermal stress for the reactor, but especially for the sapphire window, heating and cooling was done with a slow heating rate with waiting steps in between to achieve thermal equilibrium. Heating procedure is shown in Scheme 3, measurement procedure is shown in Scheme 4, and cooling procedure is shown in Scheme 5. Temperatures were controlled to be in an interval of 1 K around the desired value for 10 min before proceeding with the next step (either set a new or stay at the current temperature) in each of those schemes.
For temperature calibration, each library plate was heated under inert conditions (N2) to 6 different temperatures (396, 398, 400, 402, 404 and 406 °C) near the measuring temperature (400 °C) and IR thermography images were recorded at each temperature.
To make the temperature differences under reaction conditions visible (emission correction), typically the difference between an image recorded under N2 atmosphere is subtracted from an image recorded under reaction atmosphere. We used the images recorded after purging with N2 for 10 min after the reaction and recorded after 120 min under reaction atmosphere.

4.3. Catalytic Testing by Conventional Validation in a Gas Phase Plug-Flow Reactor Setup

100 mg of sample sieved in the range from 100 μm to 200 μm were mixed with 100 mg SiO2 sieved in the range from 200 μm to 280 μm. The powder was placed inside a silica glass tube (inner diameter 6 mm) on silica glass wool. All samples were placed at the same height within the reactor tube, ensuring a placement in the middle of the temperature constant zone of the reactor. A thermocouple placed within the sample was used to record the sample temperature and control the reactor temperature. A sample made from 100 mg SiO2 sieved in the range from 100 μm to 200 μm mixed with 100 mg SiO2 sieved in the range from 200 μm to 280 μm was placed at the same height on silica glass wool constituted the bypass sample. Figure 20 shows a scheme of the setup. We automatized the measurement using an in-house developed LabView program. After a heating period to the first temperature (350 °C) with only He flow, all gases were turned on, resulting in a gas flow of 60.2 mL/min with a composition of: 12.5 vol.% H2O, 12.5 vol.% CO2, 9.0 vol.% O2, 0.25 vol.% CH4, 0.055 vol.% CO, 0.012 vol.% NO, 0.004 vol.% NO2, 0.001 vol.% SO2, balance He. This results in a GHSV of about 26,000/h assuming a sample height of 5 mm, or a WHSV of about 36,000 mL/h/g. Methane conversion was measured at 350, 375, 400, 425, 435, 450 and 475 °C, at each temperature three GC-TCD measurements were performed, starting after 15 min of equilibration at the set temperature. A gaschromatograph from Hewlett Packard, HP GC 6890, equipped with a TCD, and a micropacked column (ShinCarbon ST 19808, length: 2 m, inner diameter: 1 mm) from Restek Corp was used. At the beginning and the end of each measurement cycle three bypass measurements were performed. The average methane signal from these six measurements I CH 4 , bypass was used to calculate the methane conversion X CH 4 using the sample signal I CH 4 , sample according to Equation (1). I CH 4 , sample is the averaged methane signal from three measurements at a given temperature. A similar formula was be used to calculate CO conversion.
X CH 4 = I CH 4 , bypass I CH 4 , sample I CH 4 , bypass
Sample standard deviation s of conversion X CH 4 at each temperature was calculated using Equation (2) with n = 3
s X = 1 n 1 · i = 1 n X ¯ X i 2
This standard deviation is displayed as error bars in the corresponding figures.

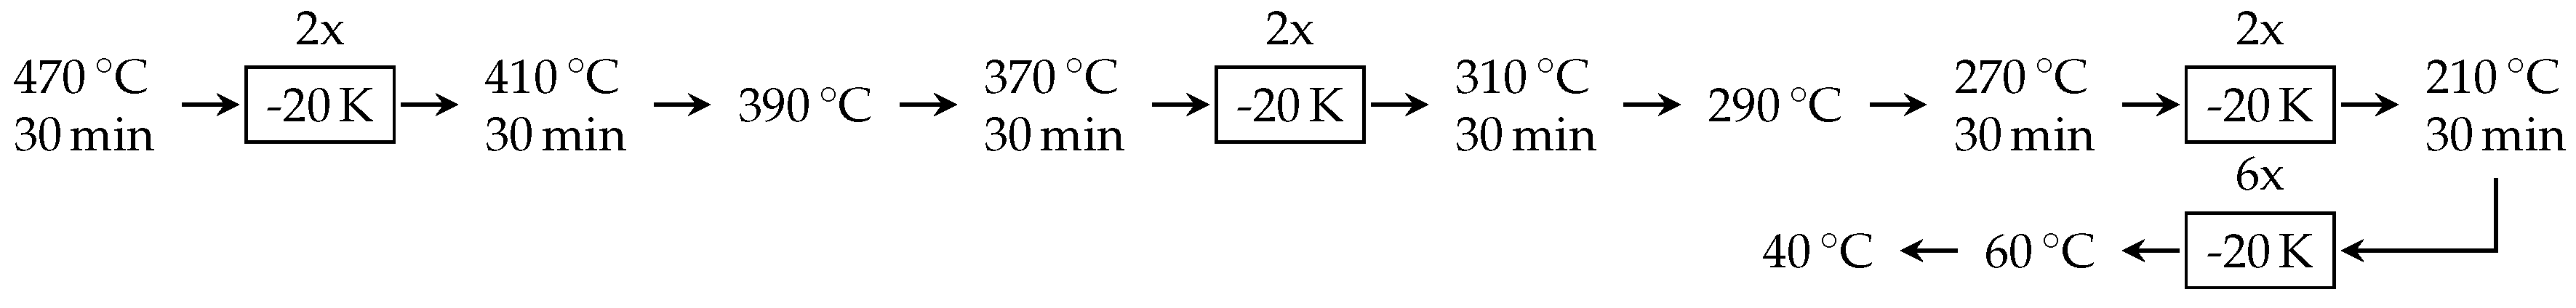
4.4. Parallel Catalytic Ageing Test in Gas-Phase Plug-Flow Reactors

Ageing tests were carried out using a 10-fold parallel tubular plug-flow reactor setup. A total of 20.7 mg of sample sieved in the range from 100 μm to 200 μm were mixed with 20.7 mg SiO2 sieved in the range from 200 μm to 280 μm and placed in a silica glass tube on silica glass wool. Each tubular glass reactor had a narrowing in the middle to hold both wool plug and catalyst as well as guarantee a reproducible sample position within the reactor. Flow restrictors made from PTFE tubes (inner diameter 0.2 mm, length of about 1.5 m and pressure drop of about 2% [72]) were carefully adjusted in length to ensure an equal gas flow through all reactors. They revealed a flow resistance significantly exceeding those of the catalyst beds and thus dominating the overall flow resistance of the reactor and were placed in front of each reactor. One reactor contained SiO2 sieved in the range of 100 μm to 200 μm as a blank sample. Using a 10/2 multiport valve, one tubular reactor could be selected and the corresponding gas composition was analyzed by GC-TCD, whereas the gas from the other nine tubes was combined in a common outlet. Conversion and standard deviation displayed as error bars were calculated according to Equations (1) and (2). A scheme of the setup is shown in Figure 21.
Gas flow for each sample was 25 mL/min, resulting in WHSV ≈ 72,000 mL/(g h). Gas composition was 0.5 vol.% CH4, 9.0 vol.% O2, 12.5 vol.% CO2, 12.5 vol.% H2O, 0.001 vol.% SO2, balanced with N2. Gas composition and flow rate/GHSV differ from the conventional validation to allow for faster ageing. We automatized the measurement using an in-house developed LabView program.
After heating the reactor to 350 °C in dry N2, all mass flow controllers except SO2 were set to their according value, and the valves were set to flow the gas through the heated washing bottle. For each sample, three GC-TCD measurements were performed at 350 °C. Afterwards, the temperature was increased to 450 °C and after 0, 24, 48, 72, 96, 120, 144 and 168 h for each sample, three GC-TCD measurements were performed. SO2 was turned on after the first measurement at 450 °C. A μ-GC from Varian, CP-4900, equipped with a module with 10 m PPQ column, a heated injector, and backflush (Partnumber 494001430, Agilent) was used. To protect the GC column from increased wear and tear, SO2 was substituted automatically with N2 30 min prior to measurements at 450 °C and turned back on afterwards.

5. Conclusions

In this contribution, we presented our high-throughput approach to identify new catalysts for the total oxidation of methane. We chose one subset of our second generation of catalysts, Pt3 Ala Mnb Cec and Pt1.5Rh1.5 Ala Mnb Cec, and showed the efficiency with which we can search a large parameter space for optimal material compositions. Synthesis was carried out using a sol-gel method for ecIRT in an automated way to be able to synthesize a large number of samples. Our best sample, Pt3 Al0 Mn90 Ce10, outperformed the corresponding sample Pt3 Al50 Mn50 from first generation by about 25 percentage points in conventional validation. Maximum methane conversion was ( 66.7 ± 2.2 )% at 475 °C, in comparison to ( 38.7 ± 1.1 )% for Pt3 Al50 Mn50 Ce, which performed similar to Pt3 Al50 Mn50 in conventional validation as well as ageing.
The sample Pt3 Al0 Mn90 Ce10 showed a methane conversion of ( 39.4 ± 1.0 )% and ( 19.1 ± 0.4 )% after 0 h and 168 h of ageing, respectively. This is about 20 percentage points more methane conversion than the sample Pt3 Al50 Mn50 Ce0, which achieved ( 18.8 ± 0.3 )% and ( 9.0 ± 0.4 ) after 0 h and 168 h of ageing, respectively. Indications that the addition of Ce increases catalytic performance were found as well, being in agreement with the literature.
Samples with Pt1.5 Rh1.5 Ala Mnb Cec performed better than the tested Pt3 Ala Mnb Cec samples, but methane conversion dropped at a given temperature by several percentage points in less than 1 h. Other samples that are still under investigation have outstanding performance and long-term stability.
We highlighted the advantages of our testing methods and challenges that arise when trying to compare our results with other publications.

Author Contributions

A.G. designed and build the experimental setups used, T.L. conducted experiments, analyzed data, and wrote this paper, K.S. supervised the work and reviewed the article, T.S. supervised the work, C.B., R.K. and S.C. provided samples, materials and funding. All authors have read and agree to the published version of the manuscript.

Funding

The publication of this article was funded by Chemnitz University of Technology, which is gratefully acknowledged.

Acknowledgments

We acknowledge our project partners from Deutsches Biomasseforschungszentrum gGmbH (DBFZ) and Caterpillar Energy Solutions GmbH for the cooperation and fruitful discussions.

Conflicts of Interest

The authors declare no conflict of interest.

Abbreviations

The following abbreviations are used in this manuscript:
CA4-Hydroxy-4-methylpentan-2-one
CHPcombined heat and power plant
ecIRTemission-corrected Infrared Thermography
GCgas chromatography/gas chromatogram
HTShigh-throughput screening
GHSVgas hourly space velocity, GHSV = V ˙ · V R 1 , where V ˙ is the volume flow at 0 °C and 101.325 kPa and V R the reaction volume (here: volume of catalyst)
WHSVweight hourly space velocity, WHSV = V ˙ · m cat 1 , where V ˙ is the volume flow and m cat the mass of catalyst
Hacacpentane-2,4-dione
IPpropan-2-ol
MeOHmethanol
PApropionic acid
PMprecious metal
TCDthermal conductivity detector

References

  1. World Bank: Agricultural Methane Emissions (% of Total). Available online: https://data.worldbank.org/indicator/EN.ATM.METH.AG.ZS/?end=2008&start=1970&view=chart (accessed on 11 January 2019).
  2. Rodhe, H. A Comparison of the Contriubution of Various Gases to the Greenhouse Effect. Science 1990, 248, 1217–1219. [Google Scholar] [CrossRef]
  3. Myhre, G.; Shindell, D.; Bréon, F.M.; Collins, W.; Fuglestvedt, J.; Huang, J.; Koch, D.; Lamarque, J.F.; Lee, D.; Mendoza, B.; et al. Climate Change 2013: The Physical Science Basis. Contribution of Working Group I to the Fifth Assessment Report of the Intergovernmental Panel on Climate Change; Cambridge University Press: Cambridge, UK; New York, NY, USA, 2013; Chapter Anthropogenic and Natural Radiative Forcing; pp. 659–740. [Google Scholar]
  4. Gélin, P.; Primet, M. Complete oxidation of methane at low temperature over noble metal based catalysts: A review. Appl. Catal. B: Environ. 2002, 39, 1–37. [Google Scholar] [CrossRef]
  5. Li, Z.; Hoflund, G.B. A Review on Complete Oxidation of Methane at Low Temperatures. J. Nat. Gas Chem. 2003, 12, 153–160. [Google Scholar]
  6. Ali, S.; Al-Marri, M.J.; Al-Jaber, A.S.; Abdelmoneim, A.G.; Khader, M.M. Synthesis, characterization and performance of Pd-based core-shell methane oxidation nano-catalysts. J. Nat. Gas Sci. Eng. 2018, 55, 625–633. [Google Scholar] [CrossRef]
  7. Auvray, X.; Lindholm, A.; Milh, M.; Olsson, L. The addition of alkali and alkaline earth metals to Pd/Al2O3 to promote methane combustion. Effect of Pd and Ca loading. Catal. Today 2018, 299, 212–218. [Google Scholar] [CrossRef]
  8. Banerjee, A.C.; McGuire, J.M.; Lawnick, O.; Bozack, M.J. Low-Temperature Activity and PdO-PdOx Transition in Methane Combustion by a PdO-PdOx/γ-Al2O3 Catalyst. Catalysts 2018, 8, 266. [Google Scholar] [CrossRef] [Green Version]
  9. Demoulin, O.; Navez, M.; Ruiz, P. The activation of a Pd/γ-alumina catalyst during methane combustion: Investigation of the phenomenon and of potential causes. Catal. Lett. 2005, 103, 149–153. [Google Scholar] [CrossRef]
  10. Doan, H.A.; Sharma, M.K.; Epling, W.S.; Grabow, L.C. From Active-Site Models to Real Catalysts: Importance of the Material Gap in the Design of Pd Catalysts for Methane Oxidation. ChemCatChem 2017, 9, 1594–1600. [Google Scholar] [CrossRef] [Green Version]
  11. Fridberg, I.; Sadokhina, N.; Olsson, L. Complete methane oxidation over Ba modified Pd/Al2O3: The effect of water vapor. Appl. Catal. B: Environ. 2018, 231, 242–250. [Google Scholar] [CrossRef]
  12. Gélin, P.; Urfels, L.; Primet, M.; Tena, E. Complete oxidation of methane at low temperature over Pt and Pd catalysts for the abatement of lean-burn natural gas fuelled vehicles emissions: Influence of water and sulphur containing compounds. Catal. Today 2003, 83, 45–57. [Google Scholar] [CrossRef]
  13. Zhu, G. Kinetics of Complete Methane Oxidation on Palladium Model Catalysts. Ph.D. Thesis, Worchester Polytechnic Institute, Worcester, MA, USA, 2004. [Google Scholar]
  14. Guo, T.; Du, J.; Wu, J.; Wang, S.; Li, J. Structure and kinetic investigations of surface-stepped CeO2-supported Pd catalysts for low-concentration methane oxidation. Chem. Eng. J. 2016, 306, 745–753. [Google Scholar] [CrossRef]
  15. Guo, T.; Du, J.; Li, J. The effects of ceria morphology on the properties of Pd/ceria catalyst for catalytic oxidation of low-concentration methane. J. Mater. Sci. 2016, 51, 10917–10925. [Google Scholar] [CrossRef]
  16. Huang, Q.; Li, W.; Lei, Y.; Guan, S.; Zheng, X.; Pan, Y.; Wen, W.; Zhu, J.; Zhang, H.; Lin, Q. Catalytic Performance of Novel Hierarchical Porous Flower-Like NiCo2O4 Supported Pd in Lean Methane Oxidation. Catal. Lett. 2018, 148, 2799–2811. [Google Scholar] [CrossRef]
  17. Imanaka, N.; Masui, T.; Yasuda, K. Environmental Catalysts for Complete Oxidation of Volatile Organic Compounds and Methane. Chem. Lett. 2011, 40, 780–785. [Google Scholar] [CrossRef]
  18. Khader, M.M.; Al-Marri, M.J.; Abdelmoneim, A.G. Active and Stable Methane Oxidation Nano-Catalyst with Highly-Ionized Palladium Species Prepared by Solution Combustion Synthesis. Catalysts 2018, 8, 66. [Google Scholar] [CrossRef] [Green Version]
  19. Lim, J.B.; Jo, D.; Hong, S.B. Palladium-exchanged small-pore zeolites with different cage systemsas methane combustion catalysts. Appl. Catal. B: Environ. 2017, 219, 155–162. [Google Scholar] [CrossRef]
  20. Monai, M.; Montini, T.; Chen, C.; Fonda, E.; Gorte, R.J.; Fornasiero, P. Methane Catalytic Combustion over Hierarchical Pd@CeO2/Si−Al2O3: Effect of the Presence of Water. ChemCatChem 2015, 7, 2038–2046. [Google Scholar] [CrossRef]
  21. Monai, M.; Montini, T.; Melchionna, M.; Duchon, T.; Kus, P.; Tsud, N.; Prince, K.C.; Matolin, V.; Gorte, R.J.; Fornasiero, P. Phosphorus poisoning during wet oxidation of methane overPd@CeO2/graphite model catalysts. Appl. Catal. B: Environ. 2016, 197, 271–279. [Google Scholar] [CrossRef] [Green Version]
  22. Monai, M.; Montini, T.; Gorte, R.J.; Fornasiero, P. Catalytic Oxidation of Methane: Pd and Beyond. Eur. J. Inorg. Chem. 2018, 2018, 2884–2893. [Google Scholar] [CrossRef]
  23. Peng, H.; Rao, C.; Zhang, N.; Wang, X.; Liu, W.; Mao, W.; Han, L.; Zhang, P.; Dai, S. Confined Ultrathin Pd-Ce Nanowires with Outstanding Moisture and SO2 Tolerance in Methane Combustion. Angew. Chem. Int. Ed. 2018, 57, 8953–8957. [Google Scholar] [CrossRef]
  24. Satsuma, A.; Tojo, T.; Okuda, K.; Yamamoto, Y.; Arai, S.; Oyama, J. Effect of preparation method of Co-promoted Pd/alumina for methane combustion. Catal. Today 2015, 242, 308–314. [Google Scholar] [CrossRef]
  25. Schwarz, S.; Friedrich, M.; Motz, G.; Kempe, R. Synthesis of Hierarchically Porous SiCN Materials and Pd Catalysts based on it for the Oxidation of Methane. Zeitschrift für anorganische und allgemeine Chemie 2015, 641, 2266–2271. [Google Scholar] [CrossRef]
  26. Senftle, T.P.; van Duin, A.C.T.; Janik, M.J. Methane Activation at the Pd/CeO2 Interface. ACS Catal. 2017, 7, 327–332. [Google Scholar] [CrossRef]
  27. Shi, C.; Yang, L.; Cai, J. Cerium promoted Pd/HZSM-5 catalyst for methane combustion. Fuel 2007, 86, 106–112. [Google Scholar] [CrossRef]
  28. Simpício, L.M.; Brandão, S.T.; Domingos, D.; Bozon-Verduraz, F.; Sales, E.A. Catalytic combustion of methane at high temperatures: Cerium effect on PdO/Al2O3 catalysts. Appl. Catal. A: Gen. 2009, 360, 2–7. [Google Scholar] [CrossRef]
  29. Toso, A.; Colussi, S.; Padigapaty, S.; de Leitenburg, C.; Trovarelli, A. High stability and activity of solution combustion synthesized Pd-based catalysts for methane combustion in presence of water. Appl. Catal. B: Environ. 2018, 230, 237–245. [Google Scholar] [CrossRef]
  30. Wenge, L.; Deyong, G.; Xin, X. Research Progress of Palladium Catalysts for Methane Combustion. China Pet. Process. Petrochem. Technol. 2012, 14, 1–9. [Google Scholar]
  31. Xie, S.; Liu, Y.; Deng, J.; Zhao, X.; Yang, J.; Zhang, K.; Han, Z.; Dia, H. Three-dimensionally ordered macroporous CeO2-supported Pd@Co nanoparticles: Highly active catalysts for methane oxidation. J. Catal. 2016, 342, 17–26. [Google Scholar] [CrossRef]
  32. Xiong, H.; Wiebenga, M.H.; Carrillo, C.; Gaudet, J.R.; Pham, H.N.; Kunwar, D.; Oh, S.H.; Qi, G.; Kim, C.H.; Datye, A.K. Design considerations for low-temperature hydrocarbon oxidation reactions on Pd based catalysts. Appl. Catal. B: Environ. 2018, 236, 436–444. [Google Scholar] [CrossRef]
  33. Yue, B.; Zhou, R.; Zheng, X.; Lu, W. Promotional effect of Ca on the Pd/Ce Zr/Al2O3 catalyst for low-temperature catalytic combustion of methane. Fuel Process. Technol. 2008, 89, 728–735. [Google Scholar] [CrossRef]
  34. Yue, B.; Zhou, R.; Zheng, X.; Lu, W. Remarkable improvement of yttrium on the activity and thermal stability of methane combustion over Pd/Ce-Zr/Al2O3 catalyst. Mater. Chem. Phys. 2009, 114, 722–727. [Google Scholar] [CrossRef]
  35. Zhou, R.; Zhao, B.; Yue, B. Effects of CeO2-ZrO2 present in Pd/Al2O3 catalysts on the redox behavior of PdOx and their combustion activity. Appl. Surf. Sci. 2008, 254, 4701–4707. [Google Scholar] [CrossRef]
  36. Zong, Y.; Li, S.; Niu, F.; Yao, Q. Direct synthesis of supported palladium catalysts for methane combustion by stagnation swirl flame. Proc. Combust. Inst. 2015, 35, 2249–2257. [Google Scholar] [CrossRef]
  37. Zou, X.; Rui, Z.; Song, S.; Ji, H. Enhanced methane combustion performance over NiAl2O4-interface promoted Pd/γ-Al2O3. J. Catal. 2016, 338, 192–201. [Google Scholar] [CrossRef]
  38. Zou, X.; Rui, Z.; Ji, H. Core-Shell NiO@PdO Nanoparticles Supported on Alumina as an Advanced Catalyst for Methane Oxidation. ACS Catal. 2017, 7, 1615–1625. [Google Scholar] [CrossRef]
  39. Bugosh, G.S.; Easterling, V.G.; Rusakova, I.A.; Harold, M.P. Anomalous steady-state and spatio-temporal features of methaneoxidation on Pt/Pd/Al2O3 monolith spanning lean and rich conditions. Appl. Catal. B: Environ. 2015, 165, 68–78. [Google Scholar] [CrossRef]
  40. Choudhary, V.R.; Patil, V.P.; Jana, P.; Uphade, B.S. Nano-gold supported on Fe2O3: A highly active catalyst for low temperature oxidative destruction of methane green house gas from exhaust/waste gases. Appl. Catal. A: Gen. 2008, 350, 186–190. [Google Scholar] [CrossRef]
  41. Fang, R.; Cui, Y.; Chen, S.; Shang, H.; Shi, Z.; Gong, M.; Chen, Y. A highly efficient Rh-modified Pd/Al2O3 close-coupled catalyst. Chin. J. Catal. 2015, 36, 229–236. [Google Scholar] [CrossRef]
  42. Gärtner, A.; Lenk, T.; Kiemel, R.; Casu, S.; Breuer, C.; Stöwe, K. High-Throughput Screening Approach to Identify New Catalysts for Total Oxidation of Methane from Gas Fueled Lean Burn Engines. Top. Catal. 2016, 59, 1071–1075. [Google Scholar] [CrossRef]
  43. Gremminger, A.T.; de Carvalho, H.W.P.; Popescu, R.; Grunwaldt, J.D.; Deutschmann, O. Influence of gas composition on activity and durability of bimetallic Pd-Pt/Al2O3 catalysts for total oxidation of methane. Catal. Today 2015, 258, 470–480. [Google Scholar] [CrossRef]
  44. Gremminger, A.; Lott, P.; Merts, M.; Casapu, M.; Grunwaldt, J.D.; Deutschmann, O. Sulfur poisoning and regeneration of bimetallic Pd-Pt methaneoxidation catalysts. Appl. Catal. B: Environ. 2017, 218, 833–843. [Google Scholar] [CrossRef]
  45. Rui, Z.; Wu, S.; Ji, H.; Liu, Z. Reactivation and Reuse of Platinum-Based Spent Catalysts for Combustion of Exhaust Organic Gases. Chem. Eng. Technol. 2015, 38, 409–415. [Google Scholar] [CrossRef]
  46. Dou, J.; Tang, Y.; Nie, L.; Andolina, C.M.; Zhang, X.; House, S.; Li, Y.; Yang, J.; Tao, F. Complete Oxidation of Methane on Co3O4/CeO2 Nanocomposite: A Synergic Effect. Catal. Today 2018, 311, 48–55. [Google Scholar] [CrossRef]
  47. Geng, H.; Yang, Z.; Ran, J.; Zhang, L.; Yan, Y.; Guo, M. Low-concentration methane combustion over a Cu/γ-Al2O3 catalyst: Effects of water. RSC Adv. 2015, 5, 18915–18921. [Google Scholar] [CrossRef]
  48. Isupova, L.A.; Kulikovskaya, N.A.; Saputina, N.F.; Gerasimov, E.Y. Catalytic Activity of La1−xCaxCoO3−δ Perovskites (x = 0 − 1) Prepared by the Pechini Method in the Reaction of Deep Methane Oxidation. Kinet. Catal. 2018, 59, 489–497. [Google Scholar] [CrossRef]
  49. Jia, Y.; Wang, S.; Lu, J.; Luo, M. Effect of structural properties of mesoporous Co3O4 catalysts on methane combustion. Chem. Res. Chin. Univ. 2016, 32, 808–811. [Google Scholar] [CrossRef]
  50. Li, Y.; Guo, Y.; Xue, B. Catalytic combustion of methane over M (Ni, Co, Cu) supported on ceria-magnesia. Fuel Process. Technol. 2009, 90, 652–656. [Google Scholar] [CrossRef]
  51. Okal, J.; Zawadzki, M.; Braranowska, K. Methane combustion over bimetallic Ru-Re/γ-Al2O3 catalysts: Effect of Re and pretreatments. Appl. Catal. B: Environ. 2016, 194, 22–31. [Google Scholar] [CrossRef]
  52. Wasalathanthri, N.D.; Poyraz, A.S.; Biswas, S.; Meng, Y.; Kuo, C.H.; Kriz, D.A.; Suib, S.L. High-Performance Catalytic CH4 Oxidation at Low Temperatures: Inverse Micelle Synthesis of Amorphous Mesoporous Manganese Oxides and Mild Transformation to K2−xMn8O16 and ϵ-MnO2. J. Phys. Chem. C 2015, 119, 1473–1482. [Google Scholar] [CrossRef]
  53. Wu, H.; Pantaleo, G.; Di Carlo, G.; Guo, S.; Marci, G.; Concepción, P.; Venezia, A.M.; Liotta, L.F. Co3O4 particles grown over nanocrystalline CeO2: influence of precipitation agents and calcination temperature on the catalytic activity for methane oxidation. Catal. Sci. Technol. 2015, 5, 1888–1901. [Google Scholar] [CrossRef] [Green Version]
  54. Zasada, F.; Janas, J.; Piskorz, W.; Gorczyńska, M.; Sojka, Z. Total Oxidation of Lean Methane over Cobalt Spinel Nanocubes Controlled by the Self-Adjusted Redox State of the Catalyst: Experimental and Theoretical Account for Interplay between the Langmuir—Hinshelwood and Mars—Van Krevelen Mechanisms. ACS Catal. 2017, 7, 2853–2867. [Google Scholar] [CrossRef]
  55. Zhang, Z.; Li, J.; Yi, T.; Sun, L.; Zhang, Y.; Hu, X.; Cui, W.; Yang, X. Surface density of synthetically tuned spinel oxides of Co3+ and Ni3+ with enhanced catalytic activity for methane oxidation. Chin. J. Catal. 2018, 39, 1228–1239. [Google Scholar] [CrossRef]
  56. German Biogas Association: Biogas market data in Germany 2017/2018. Available online: https://www.biogas.org/edcom/webfvb.nsf/id/DE_Branchenzahlen/file/18-07-05_Biogasindustryfigures-2017-2018_english.pdf (accessed on 11 January 2019).
  57. Hagemeyer, A.; Volpe, A.F. (Eds.) Modern Applications of High Throughput R&D in Heterogeneous Catalysis; Bentham Science Publishers: Sharjah, UAE, 2014. [Google Scholar]
  58. Hammes, M.; Stöwe, K.; Maier, W.F. Cobalt based emission control catalysts with high resistance towards halide poisoning. Appl. Catal. B: Environ. 2012, 117–118, 397–405. [Google Scholar] [CrossRef]
  59. Hammes, M.; Valtchev, M.; Roth, M.B.; Stöwe, K.; Maier, W.F. A search for alternative Deacon catalysts. Appl. Catal. B: Environ. 2013, 132–133, 389–400. [Google Scholar] [CrossRef]
  60. Loskyll, J.; Stöwe, K.; Maier, W.F. Infrared Thermography as a High-Throughput Tool in Catalysis Research. ACS Comb. Sci. 2012, 14, 295–303. [Google Scholar] [CrossRef] [PubMed]
  61. Maier, W.F.; Saalfrank, J.W. Discovery, combinatorial chemistry and a new selective CO-oxidation catalyst. Chem. Eng. Sci. 2004, 59, 4673–4678. [Google Scholar] [CrossRef]
  62. Borland, D.; Taylor, R.M. Rainbow Color Map (Still) Considered Harmful. IEEE Comput. Graph. Appl. 2007, 27, 14–17. [Google Scholar] [CrossRef]
  63. Green, D. A colour sheme for the display of astronomical intensity images. Bull. Astron. Soc. India 2011, 39, 289–295. [Google Scholar]
  64. Scheidtmann, J. Entwicklung und Anwendung kombinatorischer Methoden zur Entdeckung resistiver Gassensoren. Ph.D. Thesis, Universität des Saarlandes, Saarbrücken, Germany, 2003. [Google Scholar]
  65. Loskyll, J.; Stöwe, K.; Maier, W.F. High-throughput technology for novel SO2 oxidation catalysts. Sci. Technol. Adv. Mater. 2011, 12, 054101. [Google Scholar] [CrossRef] [Green Version]
  66. Epling, W.S.; Hoflund, G.B. Catalytic Oxidation of Methane over ZrO2-Supported Pd Catalysts. J. Catal. 1999, 182, 5–12. [Google Scholar] [CrossRef]
  67. Ishihara, T.; Shigematsu, H.; Abe, Y.; Takita, Y. Effects of Additives on the Activity of Palladium Catalysts for Methane Combustion. Chem. Lett. 1993, 22, 407–410. [Google Scholar] [CrossRef]
  68. Ishihara, T.; Sumi, H.; Takita, Y. Palladium Ion-exchanged SAPO-5 as a Catalyst for Low Temperature Combustion of Methane. Chem. Lett. 1994, 23, 1499–1502. [Google Scholar] [CrossRef]
  69. Hardiyanto, W.; Koshi, S.; Koichi, E. Low-Temperature Oxidation of Methane over Pd Supported on SnO2-Based Oxides. Bull. Chem. Soc. Jpn. 1999, 72, 313–320. [Google Scholar] [CrossRef]
  70. Yasuda, K.; Masui, T.; Miyamoto, T.; Imanaka, N. Catalytic combustion of methane over Pt and PdO-supported CeO2-ZrO2-Bi2O3-γ-Al2O3 catalysts. J. Mater. Sci. 2011, 46, 4046–4052. [Google Scholar] [CrossRef]
  71. Scheidtmann, J.; Saalfrank, J.W.; Maier, W.F. Plattenbau-automated synthesis of catalysts and materials libraries. In Science and Technology in Catalysis 2002; Anpo, M., Onaka, M., Yamashita, H., Eds.; Elsevier: Amsterdam, The Netherlands, 2003; Volume 145 Studies in Surface Science and Catalysis, pp. 13–20. [Google Scholar] [CrossRef]
  72. Valtchev, M.; Hammes, M.; Richter, R.; Höltzen, H.; Stöwe, K.; Maier, W.F. Corrosion-Resistant Parallel Fixed-Bed Reactors for High-Throughput Screening of New Deacon Reaction Catalysts. Chem. Eng. Technol. 2014, 37, 1251–1260. [Google Scholar] [CrossRef]
Figure 1. Scheme displaying the integration principle to obtain Δ T values in ecIRT (left). Signals for three different sample categories (right).
Catalysts 10 00159 g001
Figure 2. Design of Experiment. Highlighted primary elements (blue) have been combined with additional elements (orange) and PMs (yellow). In this paper, we report only on a selected subset of all possible combinations displayed.
Catalysts 10 00159 g002
Figure 3. Results of ecIRT measurement for slate library plate 1 containing 132 samples from composition range Pt3 Ala Mnb Cec, a, b, c ∈ (0, 10, …, 100) with a + b + c = 100, displayed using different colormaps. 2 vol.% CH4, 8 vol.% O2, 12 vol.% H2O, balance N2, 400 °C.
Catalysts 10 00159 g003
Figure 4. Position of promising samples due to high Δ T value (red background) from composition range Pt3 Ala Mnb Cec on slate library plate 1. Wells with gray background are not present on the plate.
Catalysts 10 00159 g004
Figure 5. Average ΔT values for composition spread library Pt3 Ala Mnb Cec from slate library plate 1 measured using ecIRT. Axis labels denoting the mole fraction c of given elements as percentage, χ of given elements as percentage, e.g., Al representing χ Al = n Al n Al + n Mn + n Ce , PM are excluded from this calculation. Sample compositions are displayed by a dot, values between dots are generated using linear interpolation.
Catalysts 10 00159 g005
Figure 6. Sample compositions in areas of potential hits after results of ecIRT measurement of slate library plate 1. Axis labels denoting the mole fraction χ of given element as percentage, PMs are excluded from calculation. Compositions: Pt3 Ala Mnb Cec, Pt1.5Rh1.5 Ala Mnb Cec.
Catalysts 10 00159 g006
Figure 7. Results of ecIRT measurement for slate library plate 2 containing 172 samples from composition ranges Pt3 Ala Mnb Cec and Pt1.5Rh1.5Ala Mnb Cec, compositions from Figure 6 displayed using different colormaps. Samples have been placed randomly on the slate library plate. 2 vol.% CH4, 8 vol.% O2, 12 vol.% H2O, balance N2, 400 °C.
Catalysts 10 00159 g007
Figure 8. Average Δ T values for samples from composition spread library 2 with given composition, measured using ecIRT. Axis labels denoting the mole fraction χ of given element as percentage, e.g., Al representing χ Al = n Al n Al + n Mn + n Ce , PM are excluded from this calculation. Sample compositions are displayed by a dot and values between dots are generated using linear interpolation.
Catalysts 10 00159 g008aCatalysts 10 00159 g008b
Figure 9. Results of ecIRT measurement for slate library plate 3 containing 104 samples from composition range Pt1.5Rh1.5 Ala Mnb Cec, displayed using different colormaps. 2 vol.% CH4, 8 vol.% O2, 12 vol.% H2O, balance N2, 400 °C.
Catalysts 10 00159 g009
Figure 10. Average Δ T for samples from slate library plate 3 Pt1.5Rh1.5 Ala Mnb Cec. Measured using ecIRT. Axis labels denoting the mole fraction χ of given element as percentage, e.g., Al representing χ Al = n Al n Al + n Mn + n Ce , PMs are excluded from this calculation. Sample compositions are displayed by a dot, values between dots are generated using linear interpolation.
Catalysts 10 00159 g010
Figure 11. Average Δ T data from two individual ecIRT measurements with slate libraries plates 2 and 3. Sample composition: Pt1.5Rh1.5 Ala Mnb Cec. Axis labels denoting the mole fraction χ of given element as percentage. Sample compositions are displayed by a dot, values between dots are generated using linear interpolation.
Catalysts 10 00159 g011
Figure 12. Methane conversion at different temperatures for selected samples from composition range Pt3 Ala Mnb Cec from Table 1. 12.5 vol.% H2O, 12.5 vol.% CO2, 9.0 vol.% O2, 0.25 vol.% CH4, 0.055 vol.% CO, 0.012 vol.% NO, 0.004 vol.% NO2, 0.001 vol.% SO2, balance He, WHSV = 36,000 mL/(g h). Error bars represent standard deviation ( n = 3 ) as given by Equation (2).
Catalysts 10 00159 g012
Figure 13. Methane conversion at different temperatures for samples from from composition range Pt3 Ala Mnb Cec from Table 2. 12.5 vol.% H2O, 12.5 vol.% CO2, 9.0 vol.% O2, 0.25 vol.% CH4, 0.055 vol.% CO, 0.012 vol.% NO, 0.004 vol.% NO2, 0.001 vol.% SO2, balance He, WHSV = 36,000 mL/(g h). Error bars represent standard deviation ( n = 3 ) as given by Equation (2).
Catalysts 10 00159 g013
Figure 14. Methane conversion at different temperatures for samples from from composition range Pt1.5 Rh1.5 Ala Mnb Cec from Table 3. 12.5 vol.% H2O, 12.5 vol.% CO2, 9.0 vol.% O2, 0.25 vol.% CH4, 0.055 vol.% CO, 0.012 vol.% NO, 0.004 vol.% NO2, 0.001 vol.% SO2, balance He, WHSV = 36,000 mL/(g h). Error bars represent standard deviation ( n = 3 ) as given by Equation (2).
Catalysts 10 00159 g014
Figure 15. Methane conversion at different temperatures for samples Pt3 and Pt1.5 Rh1.5 Al0 Mn90 Ce10. 12.5 vol.% H2O, 12.5 vol.% CO2, 9.0 vol.% O2, 0.25 vol.% CH4, 0.055 vol.% CO, 0.012 vol.% NO, 0.004 vol.% NO2, 0.001 vol.% SO2, balance He, WHSV = 36,000 mL/(g h). Error bars represent standard deviation ( n = 3 ) as given by Equation (2).
Catalysts 10 00159 g015
Figure 16. Methane conversion at different temperatures of samples containing Pt3 or Pt1.5 Rh1.5 with a composition in the area around Al0 Mn90 Ce10. 12.5 vol.% H2O, 12.5 vol.% CO2, 9.0 vol.% O2, 0.25 vol.% CH4, 0.055 vol.% CO, 0.012 vol.% NO, 0.004 vol.% NO2, 0.001 vol.% SO2, balance He, WHSV = 36,000 mL/(g h). Error bars represent standard deviation ( n = 3 ) as given by Equation (2).
Catalysts 10 00159 g016
Figure 17. Methane conversion as function of time on stream up to 168 h of selected samples from systems Pt3 Ala Mnb Cec. 0.5 vol.% CH4, 9.0 vol.% O2, 12.5 vol.% CO2, 0.001 vol.% SO2, 12.5 vol.% H2O, balance N2; 450 °C, WHSV = 72,000 mL/(g h). Error bars represent standard deviation ( n = 3 ) as given by Equation (2).
Catalysts 10 00159 g017
Scheme 1. Temperature program for calcining samples in air.
Catalysts 10 00159 sch001
Figure 18. Scheme of wells in a slate library used in ecIRT. Gray highlighted wells are not present due to circular shape or drilled through the library as gas outlet (9,9) or to ease handling (2,4), (2,13), (16,4) and (16,13).
Catalysts 10 00159 g018
Scheme 2. Temperature program for slate library treatment in air.
Catalysts 10 00159 sch002
Figure 19. Schematic process diagram for ecIRT setup.
Catalysts 10 00159 g019
Scheme 3. Procedure for heating up ecIRT setup. After reaching a temperature and being in an interval of 1 K around it for 10 min, the software will wait for the given time before proceeding with next step. Given temperatures are for controlling the heating setup and are measured below the slate library; therefore, those temperatures are not the sample temperature.
Catalysts 10 00159 sch003
Scheme 4. ecIRT measurement procedure. The periods specified are dwell times before 1000 frames are accumulated to create an image. The temperatures in the last step are for temperature calibration, after temperature is within 1 K intervall for 10 min, 1000 frames are accumulated to create an image.
Catalysts 10 00159 sch004
Scheme 5. ecIRT cooling procedure. Follows same principles as Scheme 3.
Catalysts 10 00159 sch005
Figure 20. Schematic process diagram of the plug-flow reactor setup used for validation of results from ecIRT.
Catalysts 10 00159 g020
Figure 21. Scheme of setup to determine ageing behavior of up to 10 different samples.
Catalysts 10 00159 g021
Table 1. Composition of most promising materials from composition spread library Pt3 Ala Mnb Cec on slate library plate 1, positions on slate library 1, and average Δ T .
PtAlMnCePositions x, yΔT [K]
30901010,66.20.83967
3200803,1213.61.09885
32010704,1113.80.71143
340402010,118.10.56334
340501010,915.80.71950
35050011, 116.40.71375
Table 2. Compositions of most promising materials from Figure 8, position on slate library 2, and average Δ T .
PtRhAlMnCePositions x, yΔT [K]
300851511,1215,120.6133384
3009554,115,80.58115795
303545202,514,80.5890790
303555104,910,90.5766768
304045153,128,20.5942384
300901011,413,80.6687942
304040201,97,160.52137075
304050101,77,130.50107035
305050013,614,70.476475
1.51.5090109,713,30.75932845
1.51.5580156,314,60.77588210
1.51.54060010,1012,40.75258380
Table 3. Compositions of most promising materials from Figure 10, position on slate library, and average Δ T .
PtRhAlMnCePositions x, yΔT [K]
1.51.50109013,413,111.1125125
1.51.5001004,108,101.0587054
1.51.54010503,412,30.81132665
1.51.5050506,510,70.80998375
1.51.510207011,212,90.79629585
1.51.50703012,1114,60.7935924
1.51.52040406,311,50.7457196
1.51.550104011,712,50.73195785
1.51.55020309,1011,30.64947885
Table 4. Previously published T 50 values from different sources. Catalyst and synthesis method as well as gas composition and space velocity are given. : Ce0.64Zr0.16Bi0.20O1.90; CS: commercial sample, IM: impregnation, IW: incipient wetness, IE: ion exchange, PR: precipitation, HT: hydrothermal, FS: flame synthesis; ≈ means T 50 values are estimated from the conversion-temperature-diagram, whereas all other values are given directly. Space velocities have been converted to WHSV from given data where possible.
Catalyst & SynthesisGas CompositionSpace VelocityT50 [°C]
ZrO2CS 0.8 % CH4, 9.6 % O2, N218,600 mL/(g h)350[66]
0.1 % Pd@ZrO2IM 0.8 % CH4, 9.6 % O2, N218,600 mL/(g h)338[66]
0.5 % Pd@ZrO2IM 0.8 % CH4, 9.6 % O2, N218,600 mL/(g h)284[66]
2 Pd@ZrO2IM 0.8 % CH4, 9.6 % O2, N218,600 mL/(g h)270[66]
5 Pd@ZrO2IM 0.8 % CH4, 9.6 % O2, N218,600 mL/(g h)253[66]
10 Pd@ZrO2IM 0.8 % CH4, 9.6 % O2, N218,600 mL/(g h)234[66]
20 Pd@ZrO2IM 0.8 % CH4, 9.6 % O2, N218,600 mL/(g h)233[66]
Pd/SnO2IW1% CH4, Air48,000/h370[69]
Pd/Al2O3CS1% CH4, Air100,000/h435[68]
Pd/HYIE1% CH4, Air100,000/h395[68]
Pd/H-SAPO-5IE1% CH4, Air100,000/h430[68]
Pd/Na-SAPO-5IE1% CH4, Air100,000/h410[68]
PdIM1% CH4, Air100,000/h533[67]
Pd/Mn3O4IM1% CH4, Air100,000/h450[67]
Pd/Cr2O3IM1% CH4, Air100,000/h445[67]
Pd/Fe2O3IM1% CH4, Air100,000/h460[67]
Pd/PbOIM1% CH4, Air100,000/h460[67]
Pd/CoOIM1% CH4, Air100,000/h435[67]
Pd/CeO2IM1% CH4, Air100,000/h430[67]
Pd/Ag2OIM1% CH4, Air100,000/h410[67]
Pd/PtOIM1% CH4, Air100,000/h425[67]
Pd/SnO2IM1% CH4, Air100,000/h430[67]
Pd/NiOIM1% CH4, Air100,000/h380[67]
Pd/CuOIM1% CH4, Air100,000/h465[67]
Pd/RhOIM1% CH4, Air100,000/h415[67]
Pd/Al2O3IM500 ppm CH4, 8% O2,
5% H2O, 5% CO2, Ar
28,000/h379[7]
Au/Fe2O3PR1% CH4, Air60,000 mL/(g h)387[40]
Co3O4/CeO2PR 6.7 % CH4, 33.3 % O2, Ar9000 mL/(g h)475[46]
Pd/Al2O3IM500 ppm CH4, 8% O2,
5% H2O, Ar
30,000/h400[11]
Pd/Al2O3IM2% CH4, 5% O2, He32,500 mL/(g h)320[12]
Pt/Al2O3IM2% CH4, 5% O2, He32,500 mL/(g h)425[12]
Cu/Al2O3IW3% CH4, 20% O2, N2no data given485[47]
Pd-Pt/Al2O3CS3230 ppm CH4, 10% O2,
12% H2O, N2
30,000/h400[43]
Pd-M@CeO2HT/IW1% CH4, 20% O2, N216,000 mL/(g h) to 110,000 mL/(g h)346[14]
Pd@NiCo2O4HT/PR1% CH4, Air30,000 mL/(g h)275[16]
PdO/CZB/Al2O3 IM1% CH4, Air20,100 mL/(g h)260[70]
Pd-ZeolitheIE1500 ppm CH4, 5% O2,
10% H2O, He
100,000/h357[19]
Pd@CeO2/Si-Al2O3IM0.5% CH4, 2.0% O2, Ar200,000 mL/(g h)350[20]
Pd@CeO2/Si-Al2O3IM0.5% CH4, 2.0% O2, 15 H2O, Ar200,000 mL/(g h)480[20]
Pd-Ce@SiO2PR1% CH4, 21% O2, N236,000 mL/(g h)290[23]
Pd-Ce/HZSM-5IM2% CH4, 8% O2, N248,000/h336[27]
Pd/TiO2FS2% CH4, 8% O2, N2no data given330[36]
Table 5. Ageing conditions (gas composition, last gas used for balance; temperature, space velocity as WHSV or GHSV) and time for CH4 abatement catalysts from literature. WHSV has been calculated from given data were applicable and possible.
ConditionsTimeSource
pretreatment: 10% H2O, 10% O2, N2; 600 °C; measurement: 2000 ppm CH4, 5 vol.% O2,
He; 32,500 mL/(g h)
24 h[12]
2000 ppm CH4, 5 vol.% O2, 10% H2O, He; 32,500 mL/(g h)20 h[12]
2000 ppm CH4, 5 vol.% O2, 100 ppm H2S, He; 32,500 mL/(g h)16 h[12]
3230 ppm CH4, 10% O2, 12% H2O, N2; 450 °C, 30,000/h100 h[43]
3230 ppm CH4, 10% O2, 12% H2O, 6% CO2, N2; 450 °C, 30,000/h100 h[43]
3230 ppm CH4, 10% O2, 12% H2O, 500 ppm CO, 120 ppm NO, 30 ppm NO2, N2; 450 °C, 30,000/h100 h[43]
3230 ppm CH4, 10% O2, 12% H2O, 500 ppm CO, 120 ppm NO, 30 ppm NO2, 5 ppm SO2, N2; 450 °C, 30,000/h100 h[43]
3200 ppm CH4, 10% O2, 12% H2O, 2.5 ppm SO2, N2; 400 °C, 30,000/h25 h[44]
3200 ppm CH4, 10% O2, 12% H2O, 5 ppm SO2, N2; 450 °C, 30,000/h25 h[44]
1% CH4, 20% O2, N2; 450 °C, 16,000 mL/(g h)20 h[14]
1% CH4, 10% H2O, air; 390 °C, 30,000 mL/(g h)35 h[16]
1% CH4, air; 320 mL/(g h), 20,100 mL/(g h)7day[70]
0,5% CH4, 3% O2, N2; 400 °C, 12,000 mL/(g h)12 h[49]
1500 ppm CH4, 5% O2, 10% H2O, He; 450 °C, 100,000/h50 h[19]
0.8% CH4, air; 500 °C, 60,000 mL/(g h)80 h[51]
1% CH4, 21% O2, N2; 310, 375, 445 and 800 °C, 36,000 mL/(g h)25, 50 h[23]
2% CH4, 8% O2, N2; 370 °C, 48,000/h36 h[27]
2% CH4, 8% O2, 4% H2O, N2; 370 °C, 48,000/h36 h[27]
0,5% CH4, 2% O2, 10% H2O, He; 450 °C, 90,000 mL/(g h)24 h[29]
1% CH4, 20% O2, N2; 400 °C to 450 °C, 30,000 mL/(g h)50 h[38]
1% CH4, 20% O2, 6% H2O, N2; 400 °C to 450 °C, 30,000 mL/(g h)12 h[38]
Table 6. Details about precursor solutions for sol-gel-synthesis.
ElementPrecursorSolventc [mol/L]CA
AlAl(NO3)3·9H2OIP/PA0.25Yes
CeCe(NO3)3·6H2OIP/PA0.25Yes
MnMn(NO3)2·4H2OIP/PA0.25Yes
PtPt(NO3)2MeOH0.05Yes
RhRh(acac)3MeOH/Hacac0.05No

