Abstract
Two Co/TiO2 catalysts with 7% CoO/g loading were prepared using equilibrium deposition filtration and the dry impregnation method. The two catalysts were characterized with various physicochemical techniques and tested for the degradation of sulfamethaxazole (SMX) using sodium persulfate (SPS) as the oxidant. It was found that the two catalysts exhibit different physicochemical characteristics. The equilibrium deposition filtration (EDF) catalyst had a higher dispersion of cobalt phase, more easily reduced Co(III) species, and a higher ratio of Co(III)/Co(II) species. The interactions between Co-deposited species and the titania surface were monitored with diffuse reflectance spectroscopy in all the preparation steps, and it was found that they increased during drying and calcination, while EDF favored the formation of surface species with strong interactions with the support. Finally, the EDF catalyst was more active for the degradation of sulfamethaxazole due to its better physicochemical characteristics.
1. Introduction
Cobalt-supported catalysts are quite promising for many reactions of environmental and industrial interest such as volatile organic compounds oxidation [1], CO2 hydrogenation [2], the Fischer–Tropsch process [3,4], and electrocatalysis [5].
In the last years, many studies dealt with the cobalt catalysts supported on titania [6,7,8,9]. In most of them, extensive physicochemical characterization was performed in order to combine the catalytic activity with the physicochemical characteristics. At this point, it should be stated that, generally and for Co catalysts specifically, the physicochemical characteristics and consequently the catalytic activity are strongly dependent on the preparation method and the precursor-supported species [10,11,12,13,14].
Thus, there are many studies dealing with the preparation of Co/TiO2 catalysts with different methods, although the most common method used for the preparation of supported Co catalysts is the dry impregnation (DI) method. This is because of its simplicity and low cost, as the other methods used are quite complicated and costly. Using DI, the speciation of Co-supported species is usually determined by the loading of the Co phase and the TiO2 properties such as the specific surface area, surface groups, and point-of-zero charge. The deposition mechanism is mainly the bulk precipitation during the drying step, while only a small portion of Co species adsorbs onto the titania surface. It is difficult to adjust the impregnation parameters during dry impregnation and consequently to control the mechanism of deposition of active species and the interactions of the supported phase.
One very attractive method for the preparation of catalysts is the equilibrium deposition filtration method (EDF) [15,16,17]. This method, compared to the other non-conventional preparation methods used, is simple and it does not need expensive reagents and infrastructure. Using this method, a quite large volume of dilute solution of the precursor compound is used. An amount of support is added to the solution. The suspension is allowed to reach equilibrium under well-defined and controlled impregnation parameters. During equilibrium, a quantity of the precursor ion is deposited onto the support surface. The ion deposition is finished when equilibrium is reached; then, filtration is applied for the collection of the solid and the removal of the non-deposited precursor species. The deposition of the active species can be controlled using proper conditions such as the pH, temperature, initial concentration, etc. There is a variety of different deposition modes such as adsorption, surface reaction, interfacial deposition, etc., depending on the impregnation parameters [11].
Compared to DI, EDF gives us the ability to adjust the impregnation parameters and the interactions of the supported phase with the support surface, and therefore to control the final speciation of the deposited species and the catalytic activity, as it was shown in many studies [1,11,15,16,18,19].
An extensive study about the preparation of Co/TiO2 catalysts using EDF was performed by Lycourghiotis et al. [20], where the interfacial chemistry of the impregnation step was fully monitored. In that study, it was found that the deposition mechanism involves the formation of mononuclear/oligonuclear inner sphere complexes upon deposition of the [Co(H2O)6]2+ ions at the “titania/electrolytic solution” interface. Depending on the Co(II) surface concentration, mononuclear complexes are formed, almost exclusively, at low and medium Co(II) surface concentrations. Binuclear and three-nuclear inner sphere complexes are formed, in addition to the aforementioned mononuclear ones, at relatively high Co(II) surface concentrations, while the deposition followed by H+ released from the solid to bulk solution lowered the pH solution. Finally, it was found that impregnation pH was the most important parameter for the deposition of Co(II) species. Higher pH resulted in a higher amount of Co(II) deposited onto the titania surface; however, pH higher than 8 should be avoided, as Co(II) precipitates either as Co(OH)2 or Co(OH)NO3 in bulk solution. That study focused on the impregnation step and deposition mechanism of Co(II) onto the titania surface. Co/TiO2 samples using EDF have not been prepared and applied to catalytic tests, which is due to the low Co content.
The limited loading of Co onto the TiO2 surface is the only disadvantage of the EDF method. The Co loading is low and less than 3% CoO/g of the catalyst, even under the most favorable conditions. This is probably due to the limited solubility of Co2+ ions in pH >8. In addition, the deposition mechanism for the Co(II) species onto the titania surface was exclusively through the formation of inner sphere complexes between monomeric or oligomeric Co species and surface–OH groups, and it did not involve surface precipitation. In the case of alumina, surface precipitation can be achieved in the interfacial region in lower pH values than the values required for bulk precipitation, which usually leads to higher deposited amounts of Co and more active catalysts [17,21].
The aim of the present work is the preparation of Co/TiO2 catalysts with higher loading with two different methods, EDF and DI, and the determination of how the preparation method alters the physicochemical characteristics and the catalytic activity for the degradation of sulfamethaxazole (SMX) with sodium persulfate (SPS) as the oxidant of the prepared catalysts.
In the present work, the EDF method was modified in order to increase the Co loading. Specifically, in the impregnation solution, the pH increased with the addition of a base to a value of 8.5, where extensive hydrolysis and polymerization between Co(II) ions and finally, the precipitation of Co(II) species occurred. The pH remained about 8.5 while Co(II) species precipitated. The amount of base added is about half of the amount required stoichiometrically for the complete precipitation of the Co(II) ions. Under these conditions, only a part of Co(II) precipitates and the rest of the Co(II) ions are dissolved in the suspension, with a higher degree of hydrolysis and polymerization. The pH is still 8.5, which is higher than the one used for the deposition of Co(II) ions in the previous study. This higher pH will be beneficial for the deposited loading of Co(II) species, probably resulting in higher deposited amounts of Co onto titania. In addition, under these conditions, the deposited Co(II) surface complexes onto the surface of titania are expected to have more than 3 Co atoms in contrast with the binuclear or three-nuclear inner sphere complexes formed at lower Co surface coverage.
2. Results
2.1. Preparation of the Catalyst
The solution of Co2+ with a concentration of 0.03 M was placed in a double-walled beaker at a constant temperature of 25 °C. The pH was increased to about 8.5 using 2 M of NH3 solution. The amount of NH3 was half of the stoichiometric required for the complete precipitation of Co ions. As a result of the limited solubility of Co ions in high pH, the hydroxide (Co(OH)NO3 or Co(OH)2) was precipitated according to equations:
The precipitation was followed by color changes from pink to blue–green. At that point, 1.0 g of TiO2 was added into the suspension. The surface of TiO2 was negatively charged in that pH and started to adsorb Co2+(aq) ions. The Co2+ ions concentration decreased due to the adsorption process, and Equations (1) and (2) shifted to the left. The positive charge in the interfacial region and the surface of TiO2 increased due to the accumulation of Co2+ ions. The surface reduced the increasingly positive charge by releasing H+ to the bulk solution. This process resulted in a decrease in pH, and this also shifted Equations (1) and (2) to the left. As a result, the precipitated Co phase acted as a reservoir of Co2+ ions to be deposited onto the TiO2 surface. This Co(II) deposition is usually pH dependable, and generally, it is higher in high pH values. After 5 days of impregnation, the pH is lower than 7.5, and the precipitate Co phase was dissolved. Then, the suspension was filtrated, and the Co/TiO2 was collected. The supernatant was pink, proving the dissolution of the precipitate Co phase, while the solid Co/TiO2 had a brown color. The adsorbed Co was measured spectophotometrically, and it was found to be 7% CoO/g of catalyst. On the other hand, the maximum Co content obtained using the standard EDF method was not exceeding 3% under optimal conditions. That was the result of the limited pH used (lower than 7). The preparation route can be seen in Figure 1.
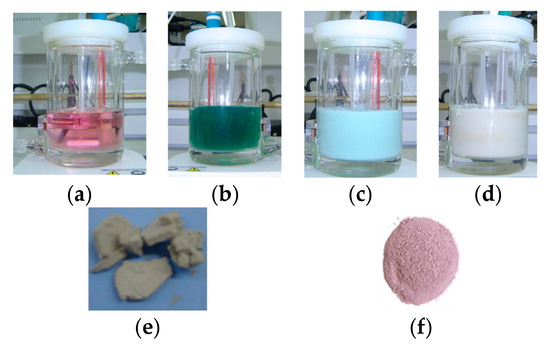
Figure 1.
(a) Impregnation solution of Co(H2O)62+, (b) after base addition and pH = 8.5, (c) after the addition of TiO2, (d) after deposition for 5 days, (e) image of equilibrium deposition filtration method (EDF) catalyst after filtration, and (f) image of dry impregnation (DI) catalyst after impregnation.
One other catalyst with the same Co loading was prepared using the DI method. Usually, DI is the most common method to prepare Co-supported catalysts, and the prepared catalysts exhibit high stability and activity.
After the preparation of the catalyst with dry impregnation, the two samples had significant differences, starting from the color of each sample. The DI sample was pink due to the octahedral Co(H2O)62+ complex, indicating that the Co phase is mainly the precipitate Co(H2O)6(NO3)2 phase with low interactions between Co and the surface, while the EDF sample had a brown color suggesting that the local environment of Co(II) was different than the Co(H2O)62+. The color change and the differences in the local environment of Co(II) species could be attributed to the partial substitution of water molecules ligands with either O–Ti or O–Co groups. Thus, strong interactions were present between Co ions and surface groups or among Co ions.
2.2. Physicochemical Characterization with Diffuse Reflectance Spectroscopy (DRS) before Calcination Step
For the elucidation of the interactions between the Co phase and TiO2 surface, the diffuse reflectance spectra of the two catalysts were collected after impregnation (wet samples, Figure 2a) and after drying (dry samples, Figure 2b). An inspection of Figure 2a clearly shows the significant differences between the two samples. This was expected, since the two samples had different colors after the impregnation step. Generally, there are three broad peaks in the spectrum. The first peak was centered at about 350 nm, the second was centered at about 500 nm, and a wide broad peak was centered at about 650 nm. In addition, the F(R), which was an analogue to the absorbance of the sample, was higher in the case of the EDF sample, especially in the first and third peaks. Taking into account that the two samples had the same Co loading, the differences in F(R) can be related to the dispersion of the Co phase. It provides evidence that the deposition of the Co phase resulted in higher dispersion in the case of the EDF sample. The first peak, which is located at about 350 nm, is due to the charge transfer between Ti–O–Co, and it can serve as a measurement of the interactions between the surface groups and the Co phase. This peak was absent in the DR spectrum of the Co(H2O)62+ (Co(H2O)6(NO3)2), pointing out that this was generated from the interactions between the surface –OH groups and Co ions.
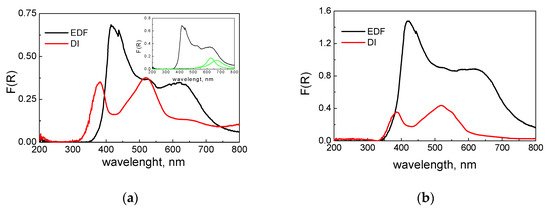
Figure 2.
Diffuse reflectance spectra of wet (a) and dried (b) samples.
Generally, this peak has been observed in many cases where a transition metal ion (either as oxyanion, MOxz–, or hydrated cation, M(H2O)xz+) deposited on the TiO2 surface and was attributed to the charge transfer between Ti–O–M bonds [18,19,20,22,23]. The intensity of the peaks denotes that the interactions were higher in the case of the EDF sample, while the shift observed in lower energy supports this finding. The peak centered at about 500 nm was due to the Co–(OH2) bonds, and it can be seen in the Co(H2O)6(NO3)2 spectrum. It is characteristic of the octahedral symmetry of Co aqua complexes. The third peak was very interesting, because it features the partial substitution of the H2O molecules in the [Co–(OH2)6]2+ complex. The peak can be deconvoluted in two other peaks (inset of Figure 2a), which are centered at about 625 and 680 nm. The first peak is assigned to Co–O–Ti, while the second peak is due to Co–O–Co polymerization in accordance with previous works for Co deposition on an Al2O3 surface [21,24].
The same three broad peaks can be seen after drying in Figure 2b. The main difference was the intensity of these peaks. Due to the heat provided during drying, the peaks were more intense, indicating that the interactions were increased as a result of the release of water molecules. A more pronounced increment is evident in the EDF sample. This can be attributed to the better dispersion of the Co phase in the EDF sample. In the EDF case, the main mechanism of the Co phase deposition is the adsorption/surface reaction of Co ions with the –OH surface groups. During drying and water evaporation, the Co phase and the surface groups can interact further, and the corresponding peak is more intense. On the other hand, in the DI case, the main mechanism is the bulk precipitation of the Co phase onto the surface of TiO2 resulting in agglomerates with higher dimensions. This means that a significant amount of Co phase precipitates onto the previously deposited Co phase, and it is not in contact with the surface –OH groups. The majority of this part was not connected with the surface groups, and during drying, it could not interact with the TiO2 surface. As a result, the increment of interactions and consequently the intensity of the peak at 400 nm was not significant.
2.3. Physicochemical Characterization of the Calcined Samples
2.3.1. Measurement of Specific Surface Area (SSA)
The deposition of 7% CoO on TiO2 did not significantly alter the SSA of the two samples. The SSA of TiO2 was found to be equal to 53 m2/g, while the EDF sample had an SSA equal to 50 m2/g, and the DI sample had an SSA equal to 45 m2/g.
The pore diameter distribution (Figure 3) showed small changes for the two samples. DI created a new group of mesoporous with a mean diameter of 28 nm. The EDF impregnation altered the porosity of TiO2. Specifically, the TiO2 pores shifted to a lower mean diameter, from 87 nm to 68 nm. This was probably a partial pore blocking due to the deposition of the Co phase onto the surface of TiO2, which also exhibited a significant increase of porosity, which was probably due to the generation of new pores after Co phase deposition.
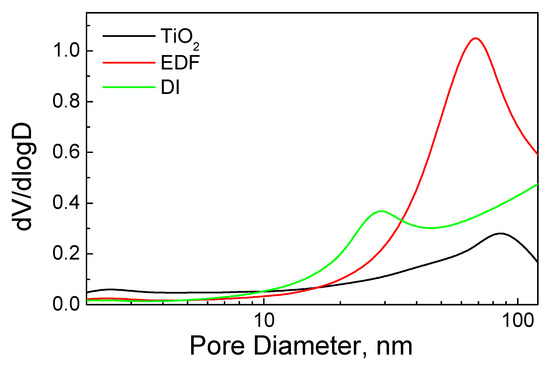
Figure 3.
Pore volume distribution of the calcined samples and pure TiO2.
2.3.2. Diffuse Reflectance Spectra
The samples were calcined at 400 °C. The supported Co phase was transformed to Co3O4, as it can be seen in Figure 4. According to the literature, the Co in the Co3O4 oxide can be found either in octahedral symmetry (peaks at 425 nm and 710 nm) or in tetrahedral symmetry (the triplet centered at about 600 nm) [1]. As it can be seen in Figure 4, the spectra of the two samples were similar to that of Co3O4 oxide. The higher intensity found for the DI sample suggested an increased formation of Co3O4 oxides for the DI sample compared to the EDF sample. In addition, the ratio of the peaks at 710 nm and 450 nm was different between the two samples. The DI sample had a very close value to unsupported Co3O4, while the value for the EDF sample was higher. These were the results of the different deposition mechanisms and the different speciation of the Co phase before the calcination step. Taking into account that the peak at 710 nm is due to Co(III) ions, it can be claimed that the EDF samples exhibited higher amounts of the Co(III) oxide phase.
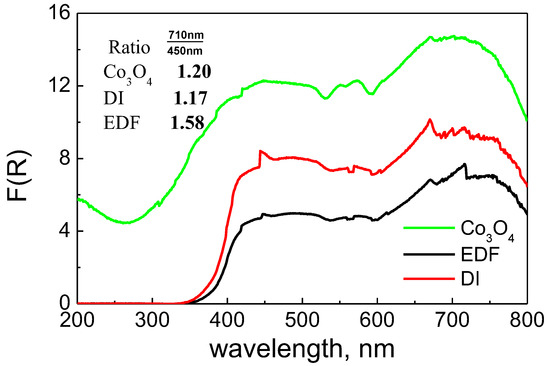
Figure 4.
Diffuse reflectance (DR) spectra of the calcined samples.
2.3.3. X-ray Diffraction, XRD
The XRD patterns of the two samples (Figure 5) exhibit only the characteristic XRD peaks of TiO2 P25. The peaks of the Co3O4 supported phase can hardly be observed. Only one corresponding to (311) can be seen at 37°. This indicates that the Co3O4-supported particles are either highly dispersed on TiO2 or the particles are too small to be detected with XRD. Similar results can be found in the literature for catalysts with 10% loading [25,26,27,28].
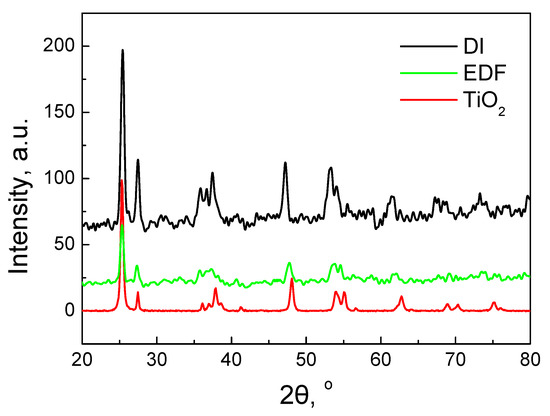
Figure 5.
XRD patterns of EDF and DI catalysts and TiO2 support.
2.3.4. X-ray Photoelectron Spectroscopy, XPS
The X-ray photoelectron spectra for Ti 2p, O 1s, and Co 2p are presented in Figure 6. The two spectra had significant differences as a result of the different deposition mechanism. The region of Ti2p for the DI catalyst showed two symmetrical peaks, which were centered at 459.4 and 465.0 eV. The shape, the position, and the peak separation (5.6 eV) were very close to the Ti(IV) species in TiO2 nanoparticles. The spectrum of the EDF catalysts was more complicated. The two peaks were broader. In addition, each peak had a shoulder in lower binding energy (BE). The deconvolution of those peaks clearly showed the contribution of other Ti species in the peaks. These Ti species were located in lower values of BE: 457.0 eV and 462.3 eV respectively. These lower values in BE were probably due to the interactions with Co–O species adsorbed onto the TiO2 surface groups and the electron charge transfer to Ti atoms in accordance with the DRS results.
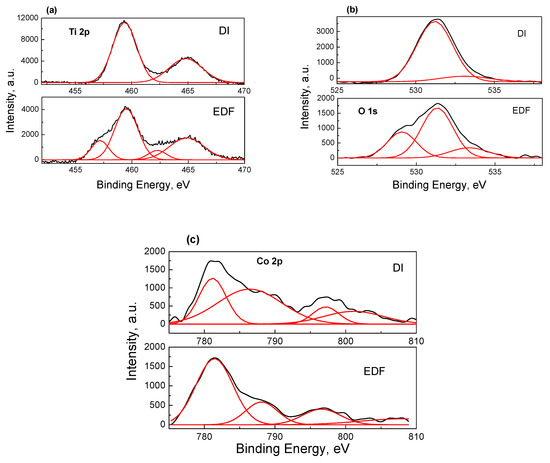
Figure 6.
XPS spectra of Ti 2p (a), O 1s (b), and Co 2p (c) photoelectrons for the samples prepared.
The O 1s photoelectron spectrum was also different for the two samples. The DI sample showed one well-formed symmetrical peak centered at 531.4 eV and a shoulder at 533.4 eV. The first peak was characteristic of O in TiO2, while the second peak was assigned to the surface –OH groups. The O 1s spectrum for the EDF catalyst exhibited one additional new peak centered at 529.1 eV. The lower ΒΕ value indicated the increasing of electron cloud density of the lattice oxygen because of the deposition of Co species.
Figure 6c shows the Co 2p spectra of the two samples. There were two main peaks centered at 781.3 and 797.5 eV for DI and 781.5 and 796.4 for the EDF sample and two satellite peaks centered at 786.4 and 801.4 for DI and 788.4 and 807.7 for EDF. The first peak assigned to Co 2p3/2 and the second peak was assigned to Co 2p1/2. It should be pointed out that it is rather difficult to determine the oxidation state of Co only by the peak position. Other parameters such as the shape of the satellites and the energy gap between the satellites and the main lines are used to discriminate between the different oxidation states of Co. Generally, the satellite peaks for Co(II) are located at BEs lower than 10 eV with respect to the main peak, while the satellite peaks for Co(III) are detected at BEs higher than 10 eV. For the two samples studied, the satellites peaks were located in higher BEs for the EDF sample, suggesting that higher amounts of Co(III) ions were present on the surface of the EDF sample. Additionally, peaks exhibiting a shoulder are characteristic of Co(II) species in a high spin state, while the diamagnetic low-spin Co(III) ion does not show shake-up structures [25]. In this study, the shoulders were relatively lower in the case of the EDF catalyst, meaning that the Co(III) surface concentration was higher.
On the other hand, higher values of BE for the EDF sample denoted that the Co species interact better with the TiO2 surface. This suggests that the Co dispersion was higher in the EDF catalyst. Indeed, the atomic ratio Co/Ti for the two samples was found to be 0.11 and 0.20 for DI and EDF respectively, which was almost twice that of the EDF catalyst, proving the better dispersion of the Co phase for the EDF catalyst.
2.3.5. Temperature Programmed Reduction (TPR) with H2
The TPR profiles of the DI and EDF catalysts are presented in Figure 7. The unsupported Co3O4 (inset of Figure 7) usually exhibits one intense peak centered at 454 °C and a shoulder at 369 °C, which is characteristic of the Co(III) species. These peaks were also present in the TPR profile of the DI sample, although the main peak of the DI sample was located at much higher temperature, at about 607 °C. This peak was due to Co(II) species interacting with the TiO2 surface. The TPR profile for the EDF sample presented three reduction peaks. The first one was located at 373 °C and denotes the Co(III) species of the EDF catalysts. The peak was well formed and of high intensity, suggesting that this catalyst had a significant higher amount of Co(III) species in accordance with the DRS and XPS results. The other two peaks were located at 450 °C and 553 °C, which were both very close to the temperatures of the peaks of the DI samples.
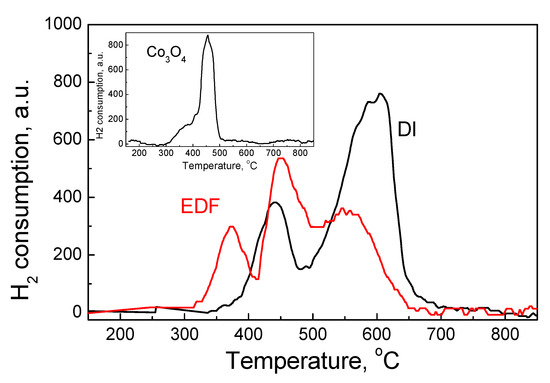
Figure 7.
Temperature-programmed reduction (TPR) profiles for the samples studied, inset: the TPR profile for Co3O4.
2.3.6. Acid Base Behavior of the Prepared Catalysts
The titration curves of TiO2 and two catalysts, EDF and DI, are presented in Figure 8. In this figure, there is also the titration curve of the blank solution. The section point of the curve of the blank solution with each of the suspension curves denotes the point of zero charge (pzc) of each solid according to the potentiometric mass titrations (PMT) method.
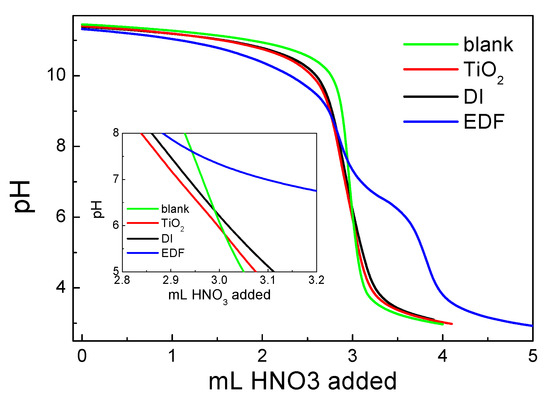
Figure 8.
Potentiometric mass titrations for the prepared catalysts, TiO2 and the blank solution. Inset: the section points of titration curves of each suspension with blank solution, corresponding to the point of zero charge (pzc) of each solid.
As it can be seen from the inset of Figure 8, the pzc for TiO2 was equal to 5.9. The pzc values for the two catalysts were higher: 6.4 for the DI sample and 7.6 for the EDF sample. As it can be seen from the EDF curve, there was a significant consumption of H+ at pH values lower than 6. This is evidence that the deposition of Co(II) species occurs through inner sphere complexes and there are significant interactions between the TiO2 surface and Co-supported phase. The Co(II) deposition process was not pH-independent, but the surface groups were involved. Thus, the acid–base behavior of the catalyst was changed, at least in an aqueous suspension.
The above can be seen more clearly in Figure 9, where the H+ consumptions as a function of pH suspension were presented for the two catalysts and TiO2 and Figure 10, where the differential curves of the H+ consumptions were presented, respectively.
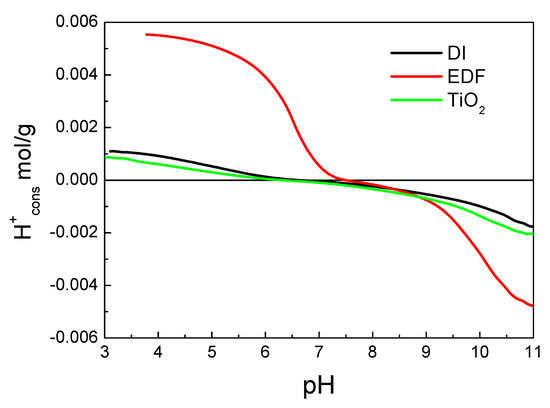
Figure 9.
H+ consumption curves for the three samples as a function of pH suspension.
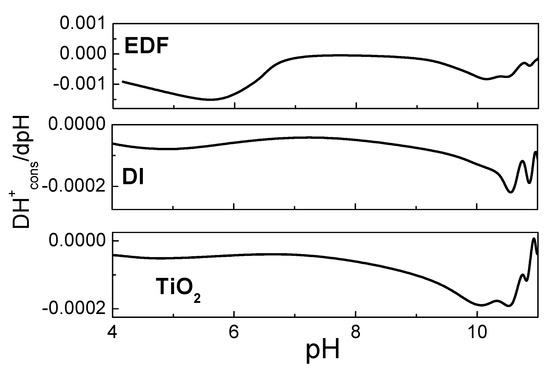
Figure 10.
Differential curves of the H+ consumption for each sample studied.
Indeed, for the EDF sample, a significant amount of H+ was consumed at a pH lower than 6. This was not expected for the TiO2, as it is known from the literature that the surface –OH groups do not appear in this pH [27]. Under realistic conditions, where the effect of a double layer is significant, there are two peaks for the TiO2 centered at about 10 and lower than 3.6, respectively [28]. The peak at a pH of about 10 can be seen in the differential curve for TiO2 in Figure 10. For the EDF sample, there is a new peak at about 5.5, which can be attributed either to the cobalt phase or to the shift in higher pH of the lower peak of the TiO2 surface groups. This peak was also present in the DI sample, although it was less intense.
2.4. Catalytic Activity
The prepared catalysts were tested for the degradation of SMX using SPS as the oxidant. This process is part of the advanced oxidation processes (AOPs), which are based on the oxidative power of specific chemicals. In this case, the catalyst activates the SPS to form SO4− radicals. These radicals exhibit high redox potential; they are more selective for oxidation by electron transfer reaction and exhibit higher activity in carbonates solution. The SO4− radicals could be generated by initiating SPS with a transition metal ion. The results showed that Co ions are the most efficient metal ions for the activation of KHSO5, and Co3O4 has been used for the degradation of various phenols and dyes [29].
The degradation of SMX with time is presented in Figure 11. Two different initial concentrations of SMX, 150 and 250 μg/L, were used. At the beginning of the process, the catalyst was immersed into the SMX solution. After a period of 15 min, 1000 mg/L SPS was added into the solution, and the monitoring of degradation was started (time = 0). The concentration of SPS was chosen to be 1000 mg/L, because higher concentrations had no significant positive effect on the degradation of SMX, while lower concentrations of SPS resulted in lower degradation. Although increased oxidant concentrations will expectedly generate more radicals, these radicals in excess may suffer from partial scavenging and be converted to less reactive species [30]. In addition, higher concentrations of SPS will increase the sulfate ions on the water matrix, which is not desirable.
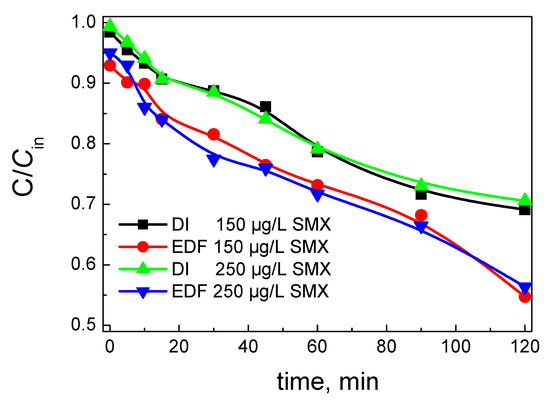
Figure 11.
Degradation of sulfamethaxazole (SMX) using 1000 mg/L sodium persulfate (SPS) as oxidant and 100 mg/L catalyst with time. The concentration of SMX is presented.
As it can be seen from Figure 11, the degradation was higher for the EDF catalyst. The influence of the initial concentration was almost negligible. This is evidence that the production of radicals and the amount of adsorbed SMX were not the limiting steps under these conditions. If the rate-determining step was the production of free radicals, then the degradation would have been higher for the low concentration of SMX.
In addition, if the adsorption step was the one that determines the rate, then higher concentrations will be in favor for the degradation. In this study, the adsorption of SMX onto the catalyst surface is low, and the process is not under mass transfer phenomena. The adsorption of SMX was higher in the case of EDF, although it was still low, and almost zero for the DI catalyst. The low adsorption of SMX on the catalyst surface is rather expectable. The pzc of the catalysts were found to be 6.4 for DI and 7.6 for EDF, while the degradation process occurred at ambient pH (around 6). Generally, SMX exists as a cation only in very low pH (<1.4), while at pH >6, SMX is negatively charged, so SMX can be considered as neutral at 1.4 < pH < 5.8 [31]. Under the pH of the degradation process, SMX and DI are almost neutral, while EDF has a slightly positive charge due to the surface sites with pH close to 5.5, making the adsorption of SMX easier; this also explains the small difference in the adsorption between the two catalysts.
The degradation data can be represented as a first-order reaction. The general kinetic model for a first order reaction rate is
where C is the concentration of SMX, and k is the rate constant.
Rate = −dC/dt = k C
The value of k can be calculated from the slope of the integrated form of Equation (3):
lnC = lnCo − k t.
The k value for the EDF samples was found to be equal to (4.0 ± 0.1) × 10−3 min−1 and for the DI catalyst (3.0 ± 0.1) × 10−3 min−1, indicating the higher activity of the EDF catalyst, and the linear regression of the data is presented in Figure 12.
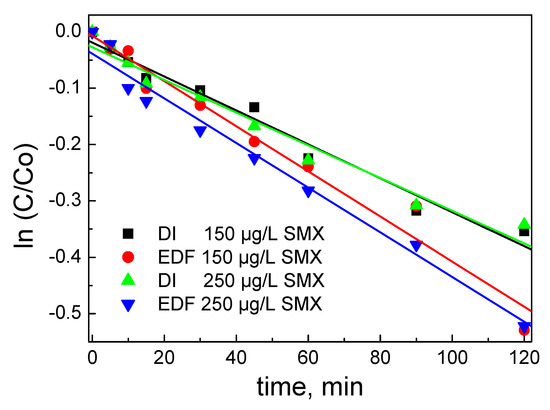
Figure 12.
Linear dependence of the logarithm of SMX concentration ratio for the catalysts studied. The concentration of SMX is presented.
Higher activity of the EDF catalyst was not expected, since the EDF catalyst exhibited higher amounts of Co(III) species. According to the proposed mechanism for the activation of persulfates with Co3O4, the Co(II) species are the most active [32,33]. They can activate S2O82− ions to SO4− radicals by the oxidation of Co(II) to Co(III), although after the reaction cycle, Co(II) regenerates. It has been shown that the surface speciation of Co3O4 after five reaction cycles for the Orange G degradation does not alter significantly [33]. The surface –OH are very important in the catalytic performance. According to the literature, the surface –OH groups are crucial for the catalytic performance [32]. They can help the transformation of Co(III) to Co(II). The enhanced activity of the EDF catalysts can be explained from the almost doubled surface concentration of Co species, as it was determined by XPS, and by the higher reducibility of the Co(III) species, as it was found by TPR experiments. Finally, the EDF catalyst exhibits higher interactions between the titania surface –OH groups and Co species.
3. Materials and Methods
3.1. Modification of the Typical EDF Procedure for The Preparation of Co(II)/TiO2 Catalysts
The titania used in this work was the P25 aeroxide from Degussa (Rellinghauser Strasse 1-11, Essen 45128, Germany), and all the other chemicals used in this study were analytical grade from Merck (Merck KGaA, Headquarters of the Merck Group Frankfurter Strasse 250, Darmstadt 64293, Germany) The modified EDF procedure followed for the deposition of Co2+ ions on the titania involved the preparation of an aqueous solution of 0.03 M Co(NO3)2, the addition of 2 M NH4OH solution for regulating the suspension pH of about 8.5, the impregnation by this solution of 1.0 g of TiO2 at 25 °C, and the equilibrium of the suspension for 5 days, under nitrogen atmosphere. This helped to complete the deposition of Co(II) species and the pH to reach 7.5. The deposition of Co(II) was followed by filtration, drying at 110 °C for 2 h, and calcination in air at 400 °C for 3 h. The Co(II) concentration before and after deposition was determined in the impregnation solution using the Nitroso R-salz procedure [34]. From the difference in the Co(II) concentration before and after deposition, the Co loading was determined. The Co loading was also confirmed with desorption of the Co from the uncalcined sample and with atomic adsorption spectroscopy for a dissolved part of the final catalyst.
3.2. Physicochemical Characterization
The diffuse reflectance spectra (DRS) of the samples studied were recorded in the range 200–800 nm at room temperature, using a UV-vis spectrophotometer (Varian Cary 3, Agilent 5301 Stevens Creek Blvd, Santa Clara, CA 95051, USA) equipped with an integration sphere. Titania was used as a reference in all the cases. The powder samples were mounted in a quartz cell, which provided a sample thickness greater than 3 mm and thus guaranteed “infinite” sample thickness. Nitrogen adsorption isotherms at liquid N2 temperature (Tristar 3000 porosimeter Micromeritics Instrument Corp. 4356 Communications Drive, Norcross, GA 30093-2901, USA) were used for the determination of specific surface area (SSA). X-ray diffraction (XRD) patterns were recorded in a Bruker D8 (Billerica, MA, USA) Advance diffractometer equipped with a nickel-filtered CuKa (1.5418 Å) radiation source. The XPS analysis of the oxidic specimens was performed at room temperature in a UHV chamber (base pressure 8 × 10⁻¹⁰ mbar), which consists of fast specimen entry assembly, preparation, and an analysis chamber with residual pressure below 10−8 mbar, equipped with a hemispherical electron energy analyzer (SPECS, LH10) and a twin-anode X-ray gun for XPS. The unmonochromatized Mg Kα line at 1253.6 eV and a constant pass energy mode for the analyzer were used in the experiments. The temperature-programmed reduction (TPR) experiments were performed in laboratory-constructed equipment. An amount of sample, 0.1 g, was placed in a quartz reactor, and the reducing gas mixture (H2/Ar: 5/95 v/v) was passed through it for 2 h with a flow rate of 40 mL·min−1 at room temperature. Then, the temperature was increased to 1000 °C with a constant rate of 10 °C·min−1, and the reducing gas mixture was monitoring with a thermal conductivity detector (TCD). The reducing gas mixture was dried in a cold trap (−95 °C) before reaching the TCD. To study the acid–base behavior of the Co/TiO2-prepared catalysts, potentiometric mass titrations were applied [35]. According to PMT, the point of zero charge value of the catalyst is the common intersection point of the titration curves of suspensions with different amounts of solid and the titration curve of a blank solution. The latter is a solution that contains exactly the same amounts of inert electrolyte and base solution without solid. Applying the mass balance equation for the H+ ions for each titration curve [36], the H+ consumption on the biochar surface was determined. Using the differential curves of the H+ consumption curves, valuable conclusions about the surface sites and the interfacial region can be made according to the literature [28].
3.3. Catalytic Activity
The prepared catalysts were tested for the degradation activity of sulfamethaxazole (SMX), which is an antibiotic using sodium persulfate (SPS) as the oxidant. Experiments were conducted in a cylindrical glass reaction vessel of 200 mL capacity, which was open to the atmosphere. An SMX solution was prepared (150 or 250 μg/L) in ultrapure water (UPW), and the appropriate amounts of SPS (1000 mg/L) and the Co/TiO2 catalyst (100 mg/L) were added to start the reaction under magnetic stirring and ambient temperature. Samples were periodically withdrawn from the vessel and analyzed by high-performance liquid chromatography (HPLC) using an Alliance HPLC system equipped with a photodiode array detector (Waters 2996), More details about the catalytic experiments and SMX analysis can be found in [37].
4. Conclusions
Two Co/TiO2 catalysts, with 7% CoO, were prepared using EDF and DI methods, which were characterized with various physicochemical techniques and tested in the SMX degradation. The EDF method was modified to increase the Co amount and achieved more than double Co loading. It was found that the Co loading was not the determinant factor for the activity of the catalysts. Furthermore, the production of radicals and the amount of adsorbed SMX were not the limiting steps of the reaction. The SMX degradation was found to be surface structure-sensitive, increasing with the Co surface concentration and the reducibility of the Co phase. The interactions between the Co phase and titania surface groups are important for the catalytic performance. During EDF, the Co species interact strongly with the titania surface groups, resulting in higher dispersion, a higher Co(III)/Co(II) ratio, more easily reducible Co species, and a different speciation of O surface groups, and therefore different acid–base behavior, pointing out the significance of the preparation method.
Acknowledgments
E. Siokou is gratefully acknowledged for the XPS spectra. P. Nanou is gratefully acknowledged for helping with the catalytic activity measurements.
Conflicts of Interest
The author declares no conflict of interest.
References
- Ataloglou, T.; Vakros, J.; Bourikas, K.; Fountzoula, C.; Kordulis, C.; Lycourghiotis, A. Influence of the preparation method on the structure—Activity of cobalt oxide catalysts supported on alumina for complete benzene oxidation. App. Catal. B Environ. 2005, 57, 299–312. [Google Scholar] [CrossRef]
- Jimenez, J.D.; Wen, C.; Lauterbach, J. Design of highly active cobalt catalysts for CO2 hydrogenation via the tailoring of surface orientation of nanostructures. Catal. Sci. Technol. 2019, 9, 1970–1978. [Google Scholar] [CrossRef]
- Shafer, W.D.; Gnanamani, M.K.; Graham, U.M.; Yang, J.; Masuku, C.M.; Jacobs, G.; Davis, B.H. Fischer-Tropsch: Product Selectivity–The Fingerprint of Synthetic Fuels. Catalysts 2019, 9, 259. [Google Scholar] [CrossRef]
- Petersen, A.P.; Claeys, M.; Kooyman, P.J.; van Steen, E. Cobalt-Based Fischer-Tropsch Synthesis: A Kinetic Evaluation of Metal–Support Interactions Using an Inverse Model System. Catalysts 2019, 9, 794. [Google Scholar] [CrossRef]
- Wang, M.; Ma, J.; Yang, H.; Lu, G.; Yang, S.; Chang, Z. Nitrogen and Cobalt Co-Coped Carbon Materials Derived from Biomass Chitin as High–Performance Electrocatalyst for Aluminu—Air Batteries Catalysts. Catalysts 2019, 9, 954. [Google Scholar] [CrossRef]
- Yung, M.M.; Holmgreen, E.M.; Ozkan, U.S. Cobalt-based catalysts supported on titania and zirconia for the oxidation of nitric oxide to nitrogen dioxide. J. Catal. 2009, 247, 356–367. [Google Scholar] [CrossRef]
- Brik, Y.; Kacimi, M.; Ziyad, M.; Bozon-Verduraz, F. Titania-Supported Cobalt and Cobalt-Phosphorus Catalysts: Characterization and Performances in Ethane Oxidative Dehydrogenation. J. Catal. 2001, 202, 118–128. [Google Scholar] [CrossRef]
- Yao, W.; Fang, H.; Ou, E.; Wang, J.; Yan, Z. Highly efficient catalytic oxidation of cyclohexane over cobalt-doped mesoporous titania with anatase crystalline structure. Catal. Comm. 2006, 7, 387–390. [Google Scholar] [CrossRef]
- Eschemann, T.O.; Bitter, J.H.; de Jong, K.P. Effects of loading and synthesis method of titania–supported cobalt catalysts for Fischer–Tropsch synthesis. Catal. Today 2014, 228, 89–95. [Google Scholar] [CrossRef]
- Bourikas, K.; Kordulis, C.; Lycourghiotis, A. The role of the liquid–solid interface in the preparation of supported catalysts. Catal. Rev. Sci. Eng. 2006, 48, 363. [Google Scholar] [CrossRef]
- Bourikas, K.; Vakros, J.; Fountzoula, C.; Kordulis, C.; Lycourghiotis, A. Interface science for optimizing the size of oxidic nanoparticles in supported catalysts. Catal. Today 2007, 128, 138–144. [Google Scholar] [CrossRef]
- Miller, J.T.; Schreier, M.; Kropf, A.J.; Regalbuto, J.R. A fundamental study of platinum tetraammine impregnation of silica: 2. The effect of method of preparation, loading, and calcination temperature on (reduced) particle size. J. Catal. 2004, 225, 203–212. [Google Scholar] [CrossRef]
- Bergwerff, J.A.; Jansen, M.; Leliveld, B.G.; Visser, T.; de Jong, K.P.; Weckhuysen, B.M. Influence of the preparation method on the hydrotreating activity of MoS2/Al2O3 extrudates: A Raman microspectroscopy study on the genesis of the active phase. J. Catal. 2006, 243, 292–302. [Google Scholar] [CrossRef]
- Dumond, F.; Marceau, E.; Che, M. A Study of Cobalt Speciation in Co/Al2O3 Catalysts Prepared from Solutions of Cobalt−Ethylenediamine Complexes. J. Phys. Chem. C 2007, 111, 4780–4789. [Google Scholar] [CrossRef]
- Vakros, J.; Bourikas, K.; Kordulis, C.; Lycourghiotis, A. The influence of the impregnation pH on the surface characteristics and the catalytic activity of the Mo/γ–Al2O3 and CoMo/γ–Al2O3 hydrodesulfurization catalysts prepared by Equilibrium Deposition Filtration (EDF). J. Phys. Chem. B 2003, 107, 1804–1813. [Google Scholar] [CrossRef]
- Heracleous, E.; Vakros, J.; Lemonidou, A.A.; Kordulis, C. Role of Preparation Parameters on the Structure–Selectivity Properties of MoO3/Al2O3 Catalysts for the oxidative Dehydrogenation of Ethane. Catal. Today 2004, 91–92, 289–292. [Google Scholar] [CrossRef]
- Vakros, J.; Kordulis, C.; Lycourghiotis, A. Cobalt oxide supported γ–alumina catalyst with high active surface area prepared by equilibrium deposition filtration. Langmuir 2002, 18, 417–422. [Google Scholar] [CrossRef]
- Petsi, T.; Panagiotou, G.D.; Garoufalis, C.S.; Kordulis, C.; Stathi, P.; Deligiannakis, Y.; Lycourghiotis, A.; Bourikas, K. Interfacial Impregnation Chemistry in the Synthesis of Cobalt Catalysts Supported on Titania. Chem. Eur. J. 2009, 15, 13090–13104. [Google Scholar] [CrossRef]
- Vakros, J.; Bourikas, K.; Perlepes, S.; Kordulis, C.; Lycourghiotis, A. The adsorption of the cobalt ions on the “electrolytic solution/γ–alumina” interface studied by Diffuse Reflectance Spectroscopy (DRS). Langmuir 2004, 20, 10542–10550. [Google Scholar] [CrossRef]
- Stamatis, N.; Goundani, K.; Vakros, J.; Bourikas, K.; Kordulis, C. Influence of composition and preparation method on the activity of MnOx/Al2O3 catalysts for the reduction of benzaldehyde with ethanol. Appl. Catal. A Gen. 2007, 325, 322–327. [Google Scholar] [CrossRef]
- Bourikas, K.; Fountzoula, C.; Kordulis, C. Monolayer transition metal supported on titania catalysts for the selective catalytic reduction of NO by NH3. Appl. Catal. B 2004, 52, 145–153. [Google Scholar] [CrossRef]
- Fountzoula, C.; Spanos, N.; Matralis, H.K.; Kordulis, C. Molybdenum-titanium oxide catalysts: The influence of the preparation conditions on their activity for the selective catalytic reduction of NO by NH3. Appl. Catal. B 2002, 35, 295–304. [Google Scholar] [CrossRef]
- Papavasiliou, J.; Rawski, M.; Vakros, J.; Avgouropoulos, G. A Novel Post-Synthesis Modification of CuO–CeO2 Catalysts: Effect on Their Activity for Selective CO Oxidation. ChemCatChem 2018, 10, 2096–2106. [Google Scholar] [CrossRef]
- Ataloglou, T.; Bourikas, K.; Vakros, J.; Kordulis, C.; Lycourghiotis, A. Kinetics of adsorption of the cobalt ions on the “electrolytic solution / γ-alumina” interface. J. Phys. Chem. B 2005, 109, 4599–4607. [Google Scholar] [CrossRef] [PubMed]
- Voß, M.; Borgmann, D.; Wedler, G. Characterization of Alumina, Silica, and Titania Supported Cobalt Catalysts. J. Catal. 2002, 212, 10–21. [Google Scholar] [CrossRef]
- Wei, W.F.; Chen, W.X.; Ivey, D.G. Rock Salt-Spinel Structural Transformation in Anodically Electrodeposited Mn−Co−O Nanocrystals. Chem. Mater. 2008, 20, 1941–1947. [Google Scholar] [CrossRef]
- Zhou, W.; Wu, J.; Ouyang, C.; Gao, Y.; Xu, X.; Huang, Z. Optical properties of Mn–Co–Ni–O thin films prepared by radio frequency sputtering deposition. J. Appl. Phys. 2014, 115, 093512. [Google Scholar] [CrossRef]
- Bourikas, K.; Kordulis, C.; Lycourghiotis, A. How metal (hydr)oxides are protonated in aqueous media: The (n + 1) rule and the role of the interfacial potential. J. Colloid Interface Sci. 2006, 296, 389–395. [Google Scholar] [CrossRef]
- Zhang, B.-T.; Zhang, Y.; Teng, Y.; Fan, M. Sulfate Radical and Its Application in Decontamination Technologies. Crit. Rev. Environ. Sci. Technol. 2015, 45, 1756–1800. [Google Scholar] [CrossRef]
- Fang, G.; Wu, W.; Liu, C.; Dionysiou, D.D.; Deng, Y.; Zhou, D. Activation of persulfate with vanadium species for PCBs degradation: A mechanistic study. Appl. Catal. B Environ. 2017, 202, 1–11. [Google Scholar] [CrossRef]
- Avisar, D.; Primor, O.; Gozlan, I.; Mamane, H. Sorption of Sulfonamides and Tetracyclines to Montmorillonite Clay. Water Air Soil Pollut. 2010, 209, 439–450. [Google Scholar] [CrossRef]
- Yang, Q.; Choi, H.; Dionysiou, D.D. Nanocrystalline cobalt oxide immobilized on titanium dioxide nanoparticles for the heterogeneous activation of peroxymonosulfate. Appl. Catal. B Environ. 2007, 74, 170–178. [Google Scholar] [CrossRef]
- Zhang, J.; Chen, M.; Zhu, L. Activation of persulfate by Co3O4 nanoparticles for orange G degradation. RSC Adv. 2016, 6, 758–768. [Google Scholar] [CrossRef]
- Samdell, E.B. Colorimetric Determination of Traces of Metals; Interscience: New York, NY, USA, 1950; p. 274. [Google Scholar]
- Bourikas, K.; Vakros, J.; Kordulis, C.; Lycourghiotis, A. Potentiometric mass titrations: Experimental and theoretical establishment of a new technique for determining the point of zero charge (PZC) of metal (hydr)oxides. J. Phys. Chem. B 2003, 107, 9441–9451. [Google Scholar] [CrossRef]
- Sfaelou, S.; Vakros, J.; Manariotis, I.D.; Karapanagioti, H.K. The use of Potentiometric Mass Titration (PMT) technique for determining the acid–base behavior of activated sludge. Glob. NEST J. 2015, 17, 397–405. [Google Scholar]
- Magioglou, E.; Frontistis, Z.; Vakros, J.; Manariotis, I.D.; Mantzavinos, D. Activation of Persulfate by Biochars from Valorized Olive Stones for the Degradation of Sulfamethoxazole. Catalysts 2019, 9, 419. [Google Scholar] [CrossRef]
© 2020 by the author. Licensee MDPI, Basel, Switzerland. This article is an open access article distributed under the terms and conditions of the Creative Commons Attribution (CC BY) license (http://creativecommons.org/licenses/by/4.0/).