Abstract
As an emerging trading market, the crude oil futures market has exhibited substantial uncertainty since its inception. Influenced by macroeconomic and geopolitical factors, its price movements are highly nonlinear and nonstationary, making accurate forecasting challenging. Therefore, it is vital to develop a powerful forecasting model for crude oil futures prices. However, conventional forecasting models rely solely on historical data and fail to capture the intrinsic patterns of complex sequences. This work presents a hybrid deep learning framework that incorporates multi-source features and a state-of-the-art attention mechanism. Specifically, search engine data were collected and integrated into the explanatory variables. By using lagged historical prices and search engine data to forecast future crude oil futures closing prices, the proposed framework effectively avoids lookahead bias. To reduce forecasting difficulty, the initial time series were then decomposed and reconstructed into several sub-sequences. Thereafter, traditional time series models (ARIMA) and attention-enhanced deep learning models were selected to forecast the reconstructed sub-sequences based on their distinct data features. The empirical study conducted on the INE crude oil futures price proves that the proposed model outperforms other benchmark models. The findings help fill the gap in the quantitative literature on crude oil futures price forecasting and offer valuable theoretical insights for affiliated policymakers, enterprises, and investors.
1. Introduction
Crude oil is a key component of the worldwide energy system, and its refined products—such as diesel, asphalt, and synthetic fibers—are widely used in transportation and chemical manufacturing. According to the Monthly Oil Market Report (MOMR) published by OPEC in September 2025, the global oil demand is expected to increase by approximately 1.3 million barrels per day, exerting significant influence on the world economy. Specifically, rising crude oil prices increase the fiscal burden on countries heavily dependent on oil imports, which may eventually lead to inflationary pressures. Conversely, declining oil prices may result in direct economic losses to crude oil-exporting countries, leading to considerable volatility in their economic systems. Therefore, accurate crude oil price forecasting is vital for the government to formulate sound macroeconomic policies and ensure the environmentally friendly development of the energy industry [1]. However, the complex interactions among multiple economic and geopolitical factors result in complex dynamics characteristic of crude oil prices [2], making forecasting extremely challenging. Amid the progressive promotion of a low-carbon economy and the rapid expansion of renewable energy sources, the outlook for the oil market remains very uncertain. Additionally, the global spread of the COVID-19 pandemic has resulted in notable market volatility and potential structural disruptions. Such extreme market conditions pose great challenges to the performance of price forecasting models. Nevertheless, research on crude oil futures price prediction under highly uncertain environments is still limited. In this context, developing a high-performance crude oil price forecasting model offers theoretical support for risk management and improves the operational efficiency of the crude oil futures markets.
Previous studies have demonstrated the existence of spillover effects between crude oil markets and financial markets. Consequently, many researchers have attempted to incorporate economic indicators into forecasting models. However, traditional economic statistics are typically released at fixed intervals, making the timely capture of short-term fluctuations and sudden price changes difficult [3]. With the explosive growth of digitization technology, online information has emerged as a valuable supplementary signal for investor decision making due to its real-time and high-frequency characteristics. Such information can amplify market volatility by influencing investor sentiment [4]. For example, when the media disseminates pessimistic views about the market, herd behavior may intensify negative sentiment and potentially trigger market downturns or crashes. These phenomena underscore that investor behavior has profoundly affected the volatility of the crude oil market.
Since traders often search for relevant information via a search engine, the corresponding search volume provides a feasible solution for quantifying investor behavior. In the past few years, some researches have realized that incorporating search engine data into models could considerably improve the forecasting accuracy. However, due to its large data size, the search volume always contains various types of noisy data, including missing values, outliers, etc. Nevertheless, current research shows a deficiency in noisy data identification and cleaning. To overcome this issue, this study attempts to introduce anomaly detection to assess the effectiveness of search engine data in short-term futures price forecasting.
Owing to the strong feature representation and generalization capabilities, machine learning models have been widely adopted for predictive tasks. Among these models, recurrent neural networks (RNNs) [5] and convolutional neural networks (CNNs) [6] represent two commonly used deep learning architectures. RNNs are frequently used to capture complex long-term dependencies, whereas CNNs exhibit excellent feature extraction capabilities due to the unique convolutional structure. Aiming at addressing the potential gradient vanishing and explosion issues of RNNs, researchers have further proposed the Long Short-Term Memory (LSTM) network. Moreover, since individual prediction models cannot handle complicated time series properly, researchers have proposed hybrid models. These models combine multiple single predictors together to compensate for their respective weaknesses. Furthermore, given the volatile nature of crude oil prices, fully exploiting nonlinear features is essential. The attention mechanism, a lightweight and plug-and-play module, originates from the human visual system with the purpose of highlighting the most relevant information from the entire input [7]. Numerous studies have shown that incorporating an attention mechanism enhances the feature extraction performance.
Previous studies have demonstrated that hyperparameters significantly influence the prediction performance. To mitigate bias resulting from subjective judgment and further improve the prediction accuracy, intelligent optimization algorithms have been increasingly employed to adaptively tune hyperparameters. Commonly used approaches include the Genetic Algorithm (GA) [8] and Particle Swarm Optimization (PSO) [9]. Although these algorithms can improve model performance to some extent, the potential problem of local optima remains.
In conclusion, this study presents a crude oil futures price prediction model utilizing multi-source features named CEE-ATT-CNN-BiLSTM-SSA-ARIMA-SED. This model integrates cutting-edge deep learning models and an attention mechanism, which are specifically designed to address the high volatility of crude oil futures markets. More specifically, the historical crude oil futures prices and corresponding search engine data (SED) are decomposed and reconstructed using the Complete Ensemble Empirical Mode Decomposition with Adaptive Noise (CEEMDAN) and K-shape clustering algorithms, respectively. The reconstructed sub-sequences are then divided into trend and fluctuation components based on the ADF test results and the fuzzy entropy (FE) value. Next, the ARIMA and CNN-BiLSTM-SSA fused attention mechanism are employed to forecast trends and fluctuations, respectively. The main contributions of this work are as follows:
- Traditional forecasting models rely solely on historical economic data. Such data are not time-sensitive and constrain short-term prediction performance. To overcome the time-lag issue, our study integrates historical crude oil futures prices with search engine data from different sources. Experimental analysis proves that the integration of search engine data helps reduce prediction bias.
- We construct a data feature-driven forecasting framework by introducing the ADF test and fuzzy entropy to ascertain the stationarity and complexity of sub-sequences. Based on the comprehensive characterization of the data, tailored forecasting models are assigned to each sub-sequence.
- Exceptional feature extraction capabilities for prediction models to deal with large-scale search engine data are demanded, which single models struggle to provide. Thus, our study proposes a hybrid deep learning model that contains CNNs and Bi-LSTM to learn high-dimensional and temporal features, while the attention mechanism is embedded to further enhance the feature extraction capability.
- To avoid subjective bias caused by manual hyperparameter tuning, the Sparrow Search Algorithm (SSA) is introduced for parameter optimization. Owing to its strong global search capability, this method effectively alleviates the local optima problem, thereby enhancing the computational performance of the proposed model.
The remainder of this paper is structured as follows: Section 2 provides a comprehensive overview of the available research. Section 3 outlines the research methodology and presents the overall forecasting framework. Section 4 details the experimental procedures. Section 5 analyzes and discusses the prediction results. Section 6 summarizes this study’s shortcomings and explores further research.
2. Literature Review
2.1. Big Data in Crude Oil Price Forecasting
In the digital age, search engines keep detailed track of users’ online search behavior. As a result, search engine data capture public attention and can promptly indicate short-term price fluctuations [10]. In recent years, researchers have incorporated search engine data into prediction models. As an illustration, Qin et al. [11] employed Google Trends data to forecast WTI prices. To reduce the interference of noisy data, they applied feature selection for Google Trends data and subsequently employed multiple-model methods for prediction. Their findings imply that integrating online data can effectively decrease prediction errors. Tang et al. [12] combined the price of Brent crude oil contracts and Google Trends data. Specifically, they first used multivariate empirical mode decomposition (MEMD) to identify matching modes at similar time scales within the initial time series. Then, the decomposed sub-sequences were input separately into the statistical or machine learning tools. The final prediction results demonstrate that incorporating search engine data can significantly enhance the forecasting accuracy. Wu et al. [13] collected news headlines from Oilprice.com and employed a CNN to exploit textual features. The data were decomposed via Variational Mode Decomposition (VMD) and analyzed with multiple classical forecasting models. The empirical results suggest that combining news information and online data can produce satisfactory forecasts.
2.2. Crude Oil Price Forecasting Models
In general, crude oil price forecasting models can be broadly classified into statistical models, machine learning models, and hybrid models.
2.2.1. Statistical Models
Early research usually used traditional statistical models due to their simple principles and convenient parameter settings. Commonly used models include the autoregressive integrated moving average (ARIMA) and generalized autoregressive conditional heteroskedasticity (GARCH) [14]. Chen et al. [15] integrated the gray waveform model with the ARMA and Random Walk (RW). This hybrid model was utilized to forecast multi-step crude oil prices. Kertlly et al. [16] incorporated mixed-frequency financial variables and the textual sentiment index to build a mixed-frequency model (MIDAS). The experimental findings suggest that the MIDAS model with the textual sentiment index outperforms those employing single-frequency or low-frequency data. Nevertheless, most statistical models assume data to be stationary and often fail to achieve satisfactory prediction results when dealing with complex data.
2.2.2. Machine Learning Models
Recently, machine learning models have emerged as the dominant forecasting models. Depending on the complexity of the neural network, machine learning models can be further categorized as shallow and deep learning models [17]. Although shallow learning models perform well in practice, they are highly likely to suffer from slow convergence and overfitting problems because of their high computational demands and numerous parameters. Lately, researchers have presented deep learning models through multi-layer nonlinear transformations. RNNs, a typical class of deep learning models, can preserve historical information and handle sequential data. Xu et al. [18] combined Bi-LSTM and an attention mechanism. The experimental outcomes show that the hybrid model can precisely forecast crude oil futures prices, even during extreme event shocks. CNNs, another widely used deep learning architecture, excel at processing grid-like data. CNNs perform well in feature extraction. Guo et al. [19] compared several single machine learning models for China’s crude oil futures, including the CNN, RNN, LSTM, SVR, MLP, BP, and GRU models. Researchers discovered that the Gate Recurrent Unit (GRU) did the best among all these prediction models.
2.2.3. Hybrid Models
Inspired by the divide-and-conquer strategy, hybrid models can integrate the advantages of sub-models. Among the hybrid models, the decomposition–reconstruction model is a prevailing forecasting framework. The modeling idea for the decomposition–reconstruction model can be summed up as follows: Firstly, the original sequence is decomposed into multiple sub-sequences, and suitable prediction models are selected based on specific data features. Lastly, the individual predictions are integrated linearly or nonlinearly. Commonly used decomposition techniques include Singular Spectrum Analysis (SSA) [20], Empirical Mode Decomposition (EMD), and EMD-like approaches [21]. Zhang et al. [22] implemented secondary decomposition using the EEMD method, which can successfully reduce the prediction difficulty. Next, a kernel-based extreme learning machine optimized by the particle swarm algorithm (PSO-KELM) was applied to predict the Brent and WTI prices. The research findings indicate that the decomposition–integration strategy can apparently refine the prediction performance.
3. Methodology
3.1. CEEMDAN
CEEMDAN is an enhanced version of EMD. EMD is capable of decomposing the original signal into numerous intrinsic mode functions (IMFs) and one residual component [23]. To address the mode-mixing problem and end effects that occur during EMD, researchers introduced Gaussian white noise (GWN). Nonetheless, because the added white noise cannot be fully eliminated, it may lead to reconstruction errors. CEEMDAN overcomes this issue by adaptively adding white noise throughout the decomposition process, thereby ensuring accurate signal reconstruction [24]. The implementation steps of CEEMDAN are outlined below:
- Suppose represents the original signal. Through adding n times the Gaussian white noise that is normally distributed to , the new signal, , is obtained:where denotes the signal-to-noise ratio (SNR), and denotes the Gaussian white noise.
- Apply EMD to decompose . Then, obtain the first IMF component by averaging all the first decomposed components:
- Calculate the residual signal after eliminating first IMF component by (3):
- Add adaptive noise components to the residual signal to construct a new sequence, . Then, apply the EMD technique to the new sequence. The second IMF component can be calculated as (4):where presents the first IMF component obtained by the EMD technique.
- The residual signal is calculated by removing the second IMF component:
- The (k + 1)th IMF component and residual signal can be calculated in the same way:
- Repeat the steps above until the residual component has no more than two extremum points, which denotes the end of the CEEMDAN algorithm.
3.2. Attention Mechanism
The attention mechanism is essentially a weighted-sum method. Various input features are assigned different weights according to their influence on prediction results. Hence, prediction models can automatically highlight key feature information while suppressing irrelevant information [25]. The attention mechanism is extensively used in natural language processing and picture recognition. Figure 1 illustrates the attention mechanism’s basic architecture, followed by the corresponding computational steps:
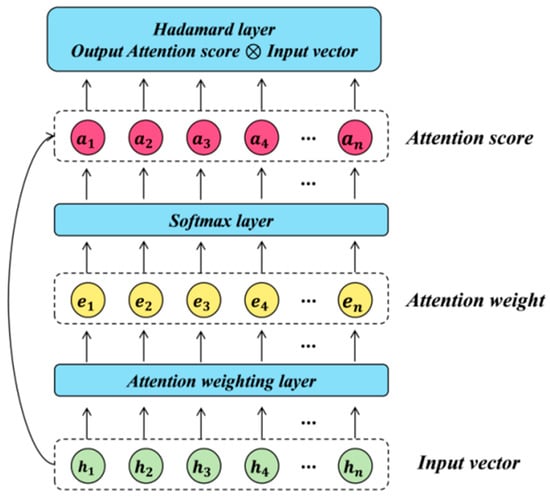
Figure 1.
The basic structure of the attention mechanism.
- Given the hidden state () at time (t) and the previous output (), calculate the attention weight (), which represents the importance of different elements in the input sequence to the current output:where represents a mathematical function. Commonly used functions include the dot product and the weight mapping function.
- The attention weights are then passed into the softmax layer to obtain the attention score ():
- The weighted sum of the attention score and input features at different time stamps is computed, as expressed in (10):
3.3. CNNs
CNNs are a variant of multi-layer perceptron (MLP), made up of input, convolutional, pooling, fully connected, and output layers. Figure 2 depicts the detailed structure of a CNN.
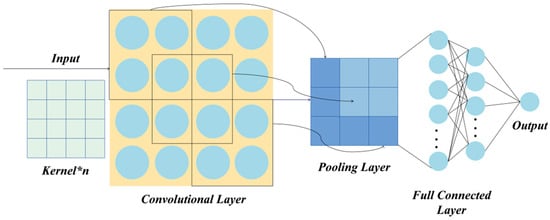
Figure 2.
The basic structure of the convolutional neural network.
The convolutional layer extracts important features by executing convolutional operations, which involve the dot product of the convolution kernel with corresponding positions of the input matrix. Convolution kernels are initially randomly assigned matrices, and their parameters are updated via the back-propagation algorithm. Each kernel represents a distinct feature map. As the depth of the neural network increases, the features extracted by the convolutional layer gradually transition from shallow to deep. Next, all extracted data features are then transferred to the pooling layer for downsampling operations, which effectively reduces the size of the feature vectors. The fully connected layer integrates and maps these extracted data features to the labeled sample space. Different from standard neural networks, the characteristics of local connectivity, weight sharing, and spatial pooling enable the CNN to precisely capture the data features. The calculation formula of the CNN is as follows:
where represents the convolutional operation, represents the learnable weight matrix, and is the bias term.
3.4. Bi-LSTM
LSTM introduces a special gating mechanism to the traditional chain structure, which contains input, forget, and output gates. These gates manage information transfer and state updates. In particular, the input gate determines whether new information should be preserved, while the forget gate determines whether historical information is redundant and needs to be removed [26]. LSTM exhibits an outstanding performance when dealing with long-term dependencies in time series forecasting. The mathematical formulas are as follows:
However, information flows in one direction in LSTM networks. In other words, the LSTM model can only learn historical information. Given the intricate interaction between input sequences, our study chose the Bi-LSTM network as the prediction model to enhance the forecasting performance. The Bi-LSTM is made up of two LSTM layers in opposite directions and can process both historical and future data. The specific structure of the Bi-LSTM is depicted in Figure 3. Specifically, arrows show the direction of information flow. And the core Bi-LSTM unit is illustrated in the dashed frame.
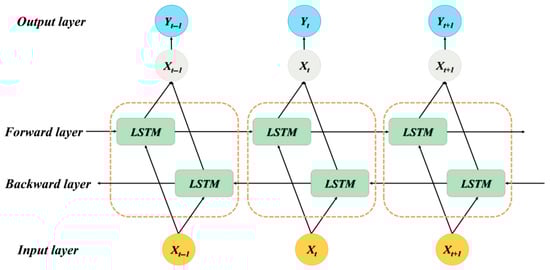
Figure 3.
The structure of the Bi-LSTM model.
3.5. SSA
The Sparrow Search Algorithm was proposed by Xue and Shen in 2020 [27]. This intelligent optimization algorithm simulates the foraging and anti-predation behaviors of sparrow populations. It categorizes the sparrow population into three distinct behavioral roles: producers, scroungers, and scouts. Producers are responsible for locating food sources and sharing this information with the group, scroungers exploit food sources by tracking the activity areas of producers, while scouts monitor the environment and alert the group to potential predators. The algorithm iteratively updates the spatial positions of the sparrow populations to achieve optimal solutions. Due to its rapid convergence, the SSA exhibits strong global search capabilities and has been extensively applied to various global optimization problems.
The location of producers is updated as shown in Equation (18):
where denotes the value of the i-th sparrow in the j-th dimension during the t-th iteration; is a random number uniformly distributed in [0, 1]; denotes the maximum number of iterations. and represent the alert value and safety threshold, respectively.
The location of scroungers is updated as shown in Equation (19):
where denotes the optimal position of producers at the t + 1-th iteration; denotes the worst position in the current iteration. is a random vector with elements taking values of either 1 or −1 with equal probability.
The location of scouts is updated as shown in Equation (20):
where denotes the global optimal position in the current iteration; follows a standard normal distribution; is uniformly distributed between 0 and 1; is a small constant to avoid the case of a zero denominator. and represent the current best and worst fitness values, respectively.
3.6. Architecture of the Proposed Model
We present a unique crude oil futures price forecasting model that combines deep learning models and an attention mechanism. Figure 4 displays the overall forecasting architecture. The proposed model comprises three main modules: data collection, data preprocessing, and predictive modeling. The specific operations are as follows:
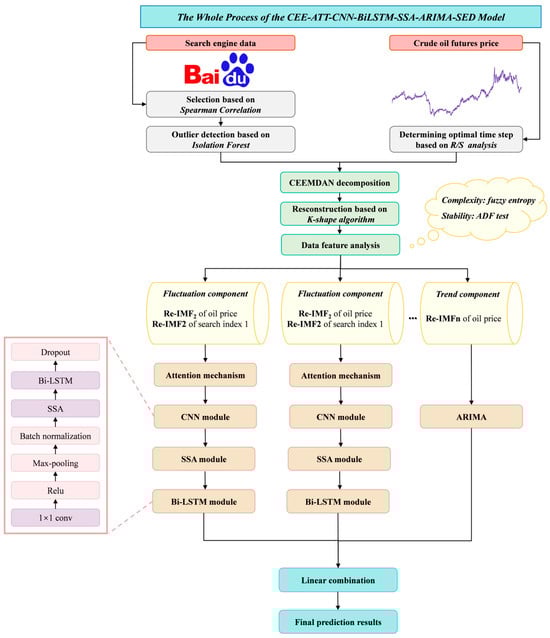
Figure 4.
Architecture of the proposed model, CEE-ATT-CNN-BiLSTM-SSA-ARIMA-SED.
- Data collection: We collected historical prices of crude oil futures and search volumes of corresponding keywords. Concretely, for the search engine data, we selected seed keywords from five sectors closely related to crude oil futures: crude oil market, relevant futures contracts, financial market index, monetary policy, and macroeconomic indicators. To expand the keyword set, we used Baidu’s association word function to find relevant keywords and the keyword mining function of the Aizhan website (https://www.aizhan.com/) to obtain long-tailed keywords. The above steps were repeated until no new keywords appeared. The final keywords were generated after eliminating duplicate values and keywords not included in the Baidu Index.
- Data preprocessing: To achieve dimensionality reduction, keywords with strong correlation were retained by calculating the Spearman coefficients between prices and keywords. To eliminate the influence of noisy data, we employed the isolation forest to identify and remove outliers. Missing values were filled using linear interpolation. After that, the data were decomposed and reconstructed using the CEEMDAN approach and K-shape clustering algorithms, respectively. The reconstructed sequences are denoted as Re-IMF1, Re-IMF2, and so forth. Specifically, the optimal number of clusters (K) was determined via the elbow method. The cluster number was then applied to both crude oil futures prices and remaining search engine data to ensure the consistency in the number of reconstructed sequences.
- Predictive modeling: The reconstructed sub-sequences were sequentially divided into trend and fluctuation components based on the ADF test results and the fuzzy entropy value. Next, the attention mechanism, CNN, and Bi-LSTM-SSA modules were combined to predict the fluctuating component. The reconstructed sub-sequences of historical crude oil futures prices and corresponding search engine data served as input variables. By identifying the relevance of the input features to the target variables, the attention mechanism assigns different weights based on their importance. The CNN and Bi-LSTM modules extract the depth and temporal features of the time series. And the SSA is employed to optimize the hyperparameters of Bi-LSTM, including the number of hidden units and batch size. Since the trend component fluctuates more regularly, it is less difficult to predict. Accordingly, the traditional time series model the ARIMA was applied to fit the trend component. The final forecasting results were generated through linear summation.
4. Empirical Study
4.1. Data Collection
China is the largest importer and second-largest consumer of crude oil in the world [28]. Because of its limited domestic reserves, the country has maintained a high level of oil dependence. The Chinese crude oil futures market started relatively late and did not officially launch its first contracts until 26 March 2018. Hence, the market is still immature and quite sensitive to external forces, including global oil price fluctuations [29]. The INE crude oil futures is the first commodity futures contract available to foreign investors in mainland China and is critical to the expansion of the crude oil market. Thus, this study selected the daily closing price of the INE futures as the forecasting target and collected data from the WIND database. The sample period spans from 2 January 2019 to 3 January 2023 and includes 972 trading-day observations. This period encompasses several extreme and representative events, including the COVID-19 pandemic and the subsequent recovery phase. The high volatility and structural disruptions induced by these black swan events can be used to effectively assess the robustness and stability of the proposed model under conditions of uncertainty. Figure 5 depicts the closing price chart. It is obvious that the price movement is nonlinear, nonstationary, and highly volatile. As a consequence of the COVID-19 epidemic, prices declined sharply around the start of 2020. The original dataset was divided into training and test sets, with the first 70%, 80%, and 90% of INE crude oil futures prices used for model learning and training and the rest of the data reserved as test sets, as portrayed in Figure 5. The training sets are depicted in green, while test sets are represented in red. This design avoids information leakage and allows for robustness evaluation across different out-of-sample periods.
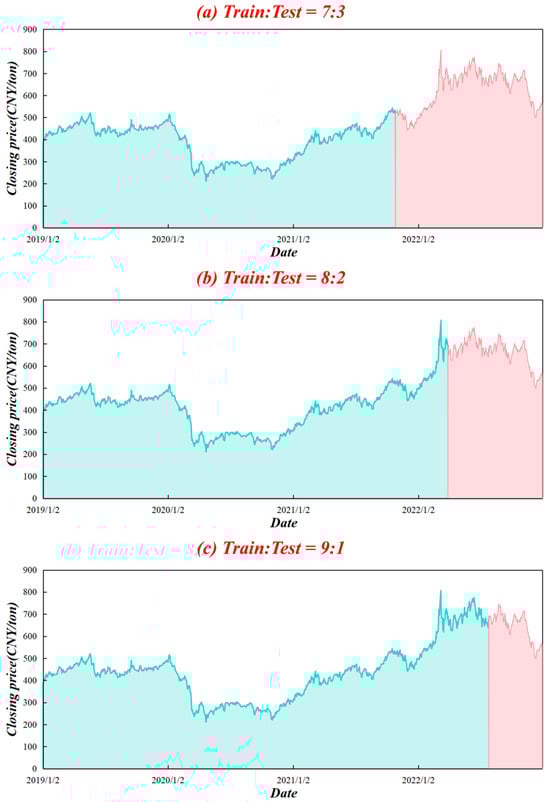
Figure 5.
Closing price chart from 2 January 2019 to 3 January 2023 along with the split of the training and test datasets.
It is widely acknowledged that online platforms respond more rapidly than economic markets. Thus, search engine data can be used to forecast crude oil futures prices. According to data released by Statcounter in March 2024, Baidu holds more than 60% of China’s search engine market, making it the dominant search engine in China today. Thus, we utilized search query data from the Baidu Index to measure public attention.
Firstly, we selected ‘crude oil price’ and ‘crude oil futures’ as seed keywords. As suggested by previous studies, ‘Dow Jones Industrial Average,’ ‘Dollar Index,’ and ‘GDP’ were also included as seed keywords. The keywords were then expanded using tools such as the Baidu Keyword Recommendation. After eliminating duplicates, default values, and keywords that have not yet been included in the Baidu Index, we finally obtained 14 keywords. All the keywords were then categorized, and the classification results are listed in Table 1. We wrote a Python 3.10.2 crawler to collect search volume data for each keyword from the Baidu Index, and we excluded the data on holidays and non-trading days.

Table 1.
Final web search keyword list.
4.2. Data Preprocessing
To avoid the interference of redundant or irrelevant information, we took 7 days as an independent time period and calculated the Spearman coefficients between the current INE crude oil futures prices and search volumes of Baidu keywords within the preceding 0–7 days. Variables with negative or insignificant correlations were eliminated. To reflect the predictive nature of the search engine data, keywords with a lag of 0 were excluded. The maximum correlation coefficients were retained. Table 2 presents the calculation results. Considering the massive scale of search engine data, we set the threshold of the Spearman coefficient at 0.6. Consequently, ‘natural gas futures’ was selected as the final keyword. The final input multi-source features included historical prices and one lagged search engine index, all of which are continuous numerical variables.
Table 2.
Maximum Spearman rank correlation coefficients of Baidu search keywords.
To better capture the data characteristics, we conducted descriptive statistics analysis, and the results are presented in Table 3. It is evident that the standard deviation (SD) of the search engine data is notably large, indicating a high level of volatility. To mitigate the potential impact of data uncertainty, data cleaning is desperately needed.
Table 3.
Results of descriptive statistical analysis.
Due to the influence of unforeseen events, the web search volume for certain keywords often surges or plummets over short periods. Although extreme spikes can reflect public attention to some extent, such data are also full of noise and invalid information. To eliminate the interference of noisy data, we employed the isolation forest method, an efficient tree-based machine learning algorithm, to identify and remove outliers. Specifically, the algorithm constructs multiple decision trees based on randomly selected features to partition data [30]. We then applied the linear interpolation method to fill in the missing data. As shown in Figure 6, it is clear that the search volume for ‘natural gas futures’ peaks around September 2021. After reviewing relevant information, we believe that the abnormal volatility is caused by the global natural gas shortage and is less related to the crude oil market. It is obvious that the temporal patterns of crude oil futures prices and search engine data exhibit a high degree of consistency after anomaly detection, underscoring the necessity of data cleaning. Table 4 provides several data samples, including original crude oil futures prices and corresponding search engine data before and after anomaly detection.
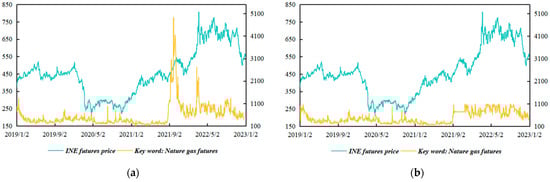
Figure 6.
Temporal pattern chart: (a) before outlier detection and removal; (b) after outlier detection and removal.
Table 4.
Samples of the input features.
4.3. CEEMDAN Decomposition and Reconstruction Results
After data preprocessing, we applied the CEEMDAN algorithm to decompose historical INE prices and search engine data sequentially. It is evident from Figure 7 that there are six IMF components as well as one residual component. Moreover, each IMF component is arranged from high to low frequency. IMF1, the highest-frequency component, fluctuates violently and represents noisy data contained in the initial signal. As the frequency gradually decreases, the sequence fluctuation tends to be regular, reflecting the periodic trends of the original data. The residual term, in contrast, illustrates an approximate linear upward trend, consistent with the long-term trend. The results of the CEEMDAN decomposition are presented in Figure 7. The original dataset is depicted in red, whereas the decomposed IMF components are displayed in green.
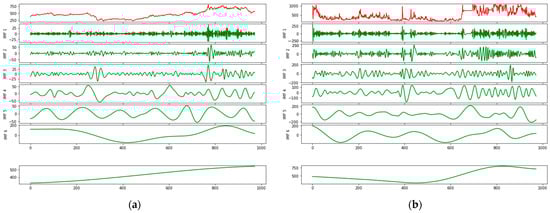
Figure 7.
Decomposition results of (a) INE crude oil price; (b) corresponding search engine data.
To minimize the computational load and alleviate the overfitting problem, we utilized the K-shape algorithm to reconstruct each IMF component. In other words, the number of sub-sequences can be appropriately reduced. The reconstructed sequences are denoted as Re-IMF1, Re-IMF2, … Re-IMFn, where n represents the number of reconstructed sequences. The K-shape clustering algorithm is a novel cluster analysis technique. Different from traditional clustering methods that use the Euclidean distance as the distance measure function, this method leverages the Normalized Cross-Correlation Coefficient (NCC) [31]. The K-shape algorithm is performed by quantifying the waveform similarity between input variables, which greatly improves the computational efficiency. The ideal number of clusters was set to three via the elbow method. Figure 8 depicts the reconstruction results.
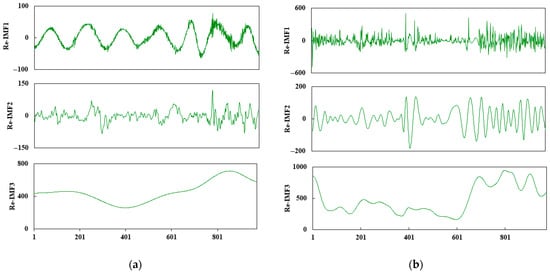
Figure 8.
Reconstruction results of (a) INE crude oil price; (b) corresponding search engine data.
The reconstructed sub-sequences are normalized by Min-Max Normalization, which is the most commonly used data normalization method in the current research. The final predicted values are inversely transformed back to the original price scale to ensure economic interpretability and comparability:
where and are the minimum and maximum values of the sample data, respectively.
4.4. Model Selection Based on Data Feature Engineering
Inspired by the ‘data feature-driven’ idea, our study conducted data feature engineering. Concretely speaking, we selected suitable forecasting models for each reconstructed sub-sequence of INE crude oil futures prices and corresponding search engine data based on their distinct characteristics. The ADF test and fuzzy entropy were utilized to examine the stationarity and complexity of the reconstructed sub-sequences, respectively [32]. Table 5 shows the data feature analysis results. The reconstructed sub-sequences Re-IMF1 and Re-IMF2 both reject the unit root hypothesis at the 10% significance level, indicating that these sequences are stationary. Furthermore, the fuzzy entropy of Re-IMF1 and Re-IMF2 ranges from 1 to 3, which demonstrates the complexity of the sequences. The T-value of Re-IMF3 exceeds the critical value, which suggests that it is a nonstationary series. The fuzzy entropy of Re-IMF3 is less than 0.3, indicating low-level complexity. According to the stationarity and complexity of the sequences, Re-IMF1 and Re-IMF2 are considered to represent the fluctuating component of the initial sequences, whereas Re-IMF3 represents the trend component. Therefore, we developed an innovative hybrid deep learning model named ATT-CNN-BiLSTM-SSA for the fluctuating components. The corresponding sub-sequences of search engine data are also included as complementary information. The trend component was predicted directly using the traditional time series model the ARIMA, without incorporating the search engine data.
Table 5.
Data feature analysis results.
4.5. Parameter Setting
In this study, we utilized the trial-and-error method to determine the optimal parameter combinations, and the final parameter settings are summarized in Table 6. The optimal time step is 10 by applying rescaling range analysis (R/S analysis). The sliding window approach was employed to transform continuous time series data into fixed-length segments. In the CNN module, the number of filters is set to 128, and the convolutional kernel size is fixed at 1 × 1. The sparrow population size is set to 20, the number of iterations is set to 50, and the producer ratio is set to 20%. The Bi-LSTM parameter search space is defined as follows: the number of training epochs ranges from 10 to 500, and the number of hidden units ranges from 1 to 100. The optimal parameters are obtained via the SSA. Specifically, the training epochs and number of units are determined as 170 and 68, respectively. The batch size is 64, suggesting that the training sample size used in one epoch is 64. In addition, the Adam is utilized during the training process, with a learning rate of 0.01.
Table 6.
Model parameter setting.
4.6. Forecast Evaluation
This paper adopts the mean absolute error (MAE), mean absolute percentage error (MAPE), root-mean-square error (RMSE), mean directional accuracy (MDA), and R-squared (R2) as evaluation indices; the corresponding calculation formulas are as follows:
where and denote the predicted and actual values, respectively. The MAE, MAPE, and RMSE measure the deviation between the predicted and actual values, while the MDA and R2 represent the degree of alignment between the predicted and true values.
In addition, we conducted the Diebold–Mariano (DM) test to justify how statistically superior the suggested model is to baseline models. The null hypothesis of the DM test states that there is no significant difference between the proposed and baseline models [33]. The DM statistic is calculated as follows:
where ; and represent the predicted values of models A and B at time i, respectively. The DM statistic follows the standard normal distribution.
5. Result Analysis
To examine the effectiveness of the presented model, our study established several benchmark models, including both single and hybrid forecasting models. What is more, the superiority of the presented model was further confirmed through an ablation study and the DM test.
5.1. Experiment 1: Compared with Single Forecasting Models
We compared the proposed model with several common single models, which encompass the ARIMA, Temporal Convolutional Network (TCN), GRU, LSTM, Bi-LSTM, and Transformer models. The hyperparameters of the ARIMA (p, d, q) model comprise the autoregressive order (p), moving average order (q), and difference order (d). Specifically, d, p, and q are all set to 1. TCN is an improved type of classical CNN model, which usually consists of multiple residual units. Each residual unit mainly encompasses dilated and causal convolution layers. GRU simplifies the architecture of LSTM by merging the input and forget gates into one single update gate. Prior research confirm that although LSTM outperforms GRU in terms of forecasting accuracy, GRU requires less training time [34]. Bi-LSTM consists of forward and backward LSTM layers and can learn both historical and future information. Transformer was proposed by the Google team in 2017 [35]. Owing to its outstanding performance in processing sequential data, recent studies have investigated its application in time series forecasting. Table 7 displays the final prediction results, while Figure 9 uses bar and line graphs to visualize the prediction results under the train–test split ratio of 7:3.
Table 7.
Performance comparison between proposed model and five single models.
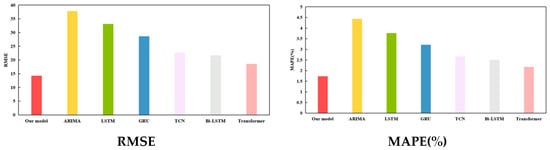
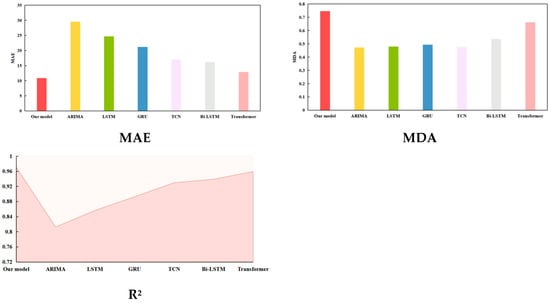
Figure 9.
Visualization of prediction results for experiment 1 under train–test split ratio of 7:3.
Table 7 corroborates that the recommended model noticeably exceeds the five single baseline models. In Figure 9, bar charts visualize the value of RMSE, MAPE, MAE, and MDA for each model, respectively. Specifically, the proposed model is highlighted in red. The shaded area at the bottom of the line chart represents the R2 value of each model. Among these benchmark models, the ARIMA performs the poorest. We believe that this is due to the fact that statistical models can only capture the linear relationship between quantitative variables. Transformer performs the best. This is because of its sophisticated multi-head self-attention mechanism. By way of illustration, when the training–test dataset ratio was set to 7:3, the evaluation values of the proposed model for the RMSE, MAPE, MAE, MDA, and R2 were 14.3208, 1.7385%, 10.8522, 0.7460, and 0.9762, while the values for the five metrics of Transformer were 18.5942, 2.1701%, 12.9487, 0.6626, and 0.9589, respectively. Compared to Transformer, the proposed model improved the RMSE, MAPE, MAE, MDA, and R2 by 22.98%, 19.89%, 16.19%, 12.59%, and 1.80%, respectively. These findings fully corroborate that the hybrid model takes the advantages of each sub-model and overcomes the limitations of individual models.
5.2. Experiment 2: Compared with Hybrid Forecasting Models
In view of the limited representation ability, it is difficult for single forecasting models to fully capture the inherent data features. Our study further selected several hybrid models as baseline models, namely, CNN-LSTM, CNN-BiLSTM, and LSTM embedded with an attention mechanism (ATT-LSTM), and Bi-LSTM embedded with an attention mechanism (ATT-BiLSTM). The aforementioned four models add a convolutional layer or attention mechanism to the corresponding single models to enhance the feature extraction capability. Table 8 presents the final prediction results. It is evident from Table 8 that all the hybrid models outperformed the corresponding single models in Table 6, thereby verifying the superiority of the CNN and Attention Mechanism modules in feature extraction and sequence modeling. In addition, the hybrid model with Bi-LSTM performed much better than its LSTM counterpart in the same position. This finding reinforces the superiority of Bi-LSTM.
Table 8.
Performance comparison between proposed model and four hybrid models.
To visually compare the prediction performances, the prediction results under the train–test split ratio of 9:1 are represented on radar charts in Figure 10. The visualization results illustrate that the proposed model surpasses the four hybrid models across all five evaluation metrics. Although the hybrid models can fully utilize each sub-model, it is still difficult to achieve satisfactory prediction results if the initial sequences are not decomposed into simpler sub-sequences. The proposed model adopts the decomposition–reconstruction strategy and matches prediction models based on data features, which can considerably lower the forecasting difficulty. The improvement rates for each evaluation index are calculated based on the prediction results. In particular, when the split ratio of the training and test sets was 9:1, the RMSE value of the proposed model decreased by 51.00%, 37.45%, 41.47%, and 38.69% compared to those of CNN-LSTM, CNN-BiLSTM, ATT-LSTM, and ATT-BiLSTM, while the MAE value decreased by 50.73%, 38.19%, 40.12%, and 39.75%. The R2 statistic increased by 8.75%, 4.11%, 5.13%, and 4.40% and the MDA values climbed by 49.67%, 48.20%, 48.34%, and 48.09% in comparison with the other four benchmark models. The findings indicate that the prediction accuracy of the recommended framework was significantly improved, confirming the effectiveness of the decomposition–reconstruction–integration prediction framework.
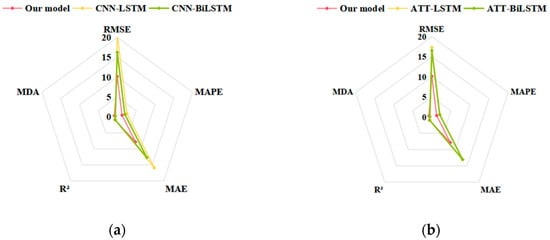
Figure 10.
Visualization of prediction results for experiment 2 under train–test split ratio of 9:1: (a) CNN-LSTM and CNN-BiLSTM; (b) ATT-LSTM and ATT-BiLSTM.
5.3. Experiment 3: Ablation Study
Our study conducted several ablation studies to confirm the contribution of each model component. The ablation study involves removing specific components from the model and comparing the resulting prediction performance with that of the original one. If the prediction performance of the modified model deteriorates, the effectiveness of the deleted module is verified. We performed ablation experiments on the attention mechanism, CNN, Bi-LSTM, SSA, and search engine data in turn. It is worth noting that Bi-LSTM was replaced by LSTM to verify the superiority of the bidirectional structure. The ablation experiment results are listed in Table 9 and visualized in Figure 11.
Table 9.
Performance comparison between proposed model and five hybrid models.
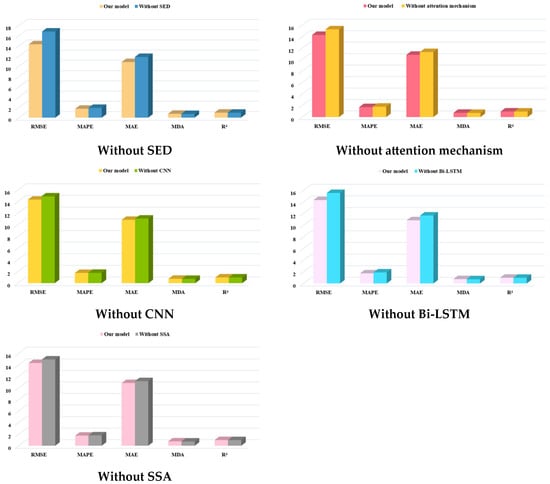
Figure 11.
Visualization of ablation experiments under train–test split ratio of 7:3.
Based on these results, we draw conclusions from three perspectives: (1) The model without search engine data performs far worse than the original model, confirming that integrating such data can considerably enhance the prediction accuracy. We believe the result is because search engine data can promptly capture short-term fluctuations of crude oil futures prices. (2) The attention mechanism improves the model’s prediction efficacy greatly. However, when the train–test split ratio is 8:2, the proposed model suffers from performance degradation. One possible explanation is that the addition of the attention layer increases the model complexity, which may result in overfitting. As a result, further study should concentrate on improving the model robustness and alleviating overfitting. (3) The removal of both the CNN and Bi-LSTM modules increases prediction errors. As an illustration, when the train–test split ratio was 7:3, the RMSE, MAPE, and MAE values of the model without the CNN module increased by 3.87%, 1.40%, and 1.96%, whereas the corresponding values of the model without the Bi-LSTM module climbed by 8.56%, 4.19%, and 3.07%, respectively. (4) The introduction of the SSA significantly improves the prediction performance. Specifically, when the train–test split ratio was set to 7:3, the proposed model achieved reductions of 4.15%, 3.07%, and 2.98% for the RMSE, MAPE, and MAE values, respectively.
5.4. Experiment 4: DM Test
To statistically corroborate the dominance of the proposed framework, we performed the DM test, as shown in Table 10. The results indicate that the proposed framework clearly outperformed the vast majority of the baseline models at the 10% significance level, implying a statistically meaningful difference between the proposed and baseline models.
Table 10.
DM test results.
6. Conclusions
Crude oil futures, one of the most actively traded commodity derivatives globally, serve essential functions in price discovery and risk management. Dramatic fluctuations in crude oil futures prices can have a negative impact on the whole oil and gas sector. Especially under the impact of numerous external factors, such as COVID-19 and geopolitical conflicts, the turbulence of the crude oil futures market has been further exacerbated. Under these conditions, the precise forecasting of crude oil futures price is of great significance for developing effective risk avoidance strategies.
Building upon the decomposition–reconstruction–integration framework, we propose a hybrid model that incorporates the advanced attention mechanism and deep learning models. By extracting multi-source features, this study reveals the intrinsic connection between search engine data and China’s crude oil futures. We prove that search engine data, as one of the influencing factors of crude oil futures prices, does have an improving effect on the prediction performance. Additionally, this study not only provides theoretical guidance for promoting the development of the crude oil futures market but also has significant practical implications. From the investor‘s perspective, the scientific judgment of futures price trends is an important reference for assessing market risk and adjusting investment portfolios, which can help investors achieve risk prevention and improve individual rates of return (RoRs). Furthermore, based on crude oil futures price fluctuations, enterprises in the upstream and downstream supply chains can judge the market demand and formulate rational business strategies to promote resource efficiency and maximize profits.
Although this study acquired desirable predictive results under extreme market conditions, certain limitations still exist. Firstly, this study primarily focuses on the price movement of the INE during the COVID-19 pandemic. Future research could extend the application of the proposed model to more recent datasets and other major energy markets, such as WTI and Brent futures, to further validate its cross-market robustness. Moreover, the proposed model generates point forecasts only and does not explicitly quantify prediction uncertainty. To better characterize uncertainty, future studies may extend the model to interval or density forecasting.
Author Contributions
Conceptualization, X.-Y.L., M.-G.Y., X.-Z.L. and J.Z.; methodology, X.-Y.L.; software, X.-Y.L.; validation, M.-G.Y. and X.-Y.L.; formal analysis, X.-Z.L. and J.Z.; investigation, M.-G.Y.; data curation, X.-Y.L.; writing—original draft preparation, X.-Y.L.; writing—review and editing, M.-G.Y. and X.-Z.L.; visualization, X.-Y.L.; supervision, M.-G.Y., X.-Z.L. and J.Z.; project administration, X.-Z.L. and J.Z. All authors have read and agreed to the published version of the manuscript.
Funding
This research received no external funding.
Data Availability Statement
The original contributions presented in this study are included in the article. Further inquiries can be directed to the corresponding author.
Conflicts of Interest
The authors declare no conflicts of interest.
References
- Wen, D.; Liu, L.; Wang, Y.; Zhang, Y. Forecasting Crude Oil Market Returns: Enhanced Moving Average Technical Indicators. Resour. Policy 2022, 76, 102570. [Google Scholar] [CrossRef]
- Wu, C.; Wang, J.; Hao, Y. Deterministic and Uncertainty Crude Oil Price Forecasting Based on Outlier Detection and Modified Multi-Objective Optimization Algorithm. Resour. Policy 2022, 77, 102780. [Google Scholar] [CrossRef]
- Li, X.; Shang, W.; Wang, S. Text-Based Crude Oil Price Forecasting: A Deep Learning Approach. Int. J. Forecast. 2019, 35, 1548–1560. [Google Scholar] [CrossRef]
- Li, J.; Tang, L.; Wang, S. Forecasting Crude Oil Price with Multilingual Search Engine Data. Physica A 2020, 551, 124178. [Google Scholar] [CrossRef]
- Rithani, M.; Kumar, R.P.; Doss, S. A Review on Big Data Based on Deep Neural Network Approaches. Artif. Intell. Rev. 2023, 56, 14765–14801. [Google Scholar] [CrossRef]
- Shen, L.; Bao, Y.; Hasan, N.; Huang, Y.; Zhou, X.; Deng, C. Intelligent Crude Oil Price Probability Forecasting: Deep Learning Models and Industry Applications. Comput. Ind. 2024, 163, 104150. [Google Scholar] [CrossRef]
- Zhang, X.; Cheng, S.; Zhang, Y.; Wang, J.; Wang, S. An Attention-PCA Based Forecast Combination Approach to Crude Oil Price. Expert Syst. Appl. 2024, 240, 122463. [Google Scholar] [CrossRef]
- Pradeepkumar, D.; Ravi, V. Forecasting Financial Time Series Volatility Using Particle Swarm Optimization Trained Quantile Regression Neural Network. Appl. Soft. Comput. 2017, 58, 35–52. [Google Scholar] [CrossRef]
- Abd Elaziz, M.; Ewees, A.A.; Alameer, Z. Improving Adaptive Neuro-Fuzzy Inference System Based on a Modified Salp Swarm Algorithm Using Genetic Algorithm to Forecast Crude Oil Price. Nat. Resour. Res. 2020, 29, 2671–2686. [Google Scholar] [CrossRef]
- Qu, H.; Li, G. Multi-Perspective Investor Attention and Oil Futures Volatility Forecasting. Energy Econ. 2023, 119, 106531. [Google Scholar] [CrossRef]
- Qin, Q.; Huang, Z.; Zhou, Z.; Chen, C.; Liu, R. Crude Oil Price Forecasting with Machine Learning and Google Search Data: An Accuracy Comparison of Single-Model versus Multiple-Model. Eng. Appl. Artif. Intell. 2023, 123, 106266. [Google Scholar] [CrossRef]
- Tang, L.; Zhang, C.; Li, L.; Wang, S. A Multi-Scale Method for Forecasting Oil Price with Multi-Factor Search Engine Data. Appl. Energy 2020, 257, 114033. [Google Scholar] [CrossRef]
- Wu, B.; Wang, L.; Lv, S.-X.; Zeng, Y.-R. Effective Crude Oil Price Forecasting Using New Text-Based and Big-Data-Driven Model. Measurement 2021, 168, 108468. [Google Scholar] [CrossRef]
- Hou, A.; Suardi, S. A Nonparametric GARCH Model of Crude Oil Price Return Volatility. Energy Econ. 2012, 34, 618–626. [Google Scholar] [CrossRef]
- Chen, Y.; Zhang, C.; He, K.; Zheng, A. Multi-Step-Ahead Crude Oil Price Forecasting Using a Hybrid Grey Wave Model. Physica A 2018, 501, 98–110. [Google Scholar] [CrossRef]
- de Medeiros, R.K.; da Nóbrega Besarria, C.; de Jesus, D.P.; de Albuquerquemello, V.P. Forecasting Oil Prices: New Approaches. Energy 2022, 238, 121968. [Google Scholar] [CrossRef]
- Zhao, Y.; Li, J.; Yu, L. A Deep Learning Ensemble Approach for Crude Oil Price Forecasting. Energy Econ. 2017, 66, 9–16. [Google Scholar] [CrossRef]
- Xu, Y.; Liu, T.; Du, P. Volatility Forecasting of Crude Oil Futures Based on Bi-LSTM-Attention Model: The Dynamic Role of the COVID-19 Pandemic and the Russian-Ukrainian Conflict. Resour. Policy 2024, 88, 104319. [Google Scholar] [CrossRef]
- Guo, L.; Huang, X.; Li, Y.; Li, H. Forecasting Crude Oil Futures Price Using Machine Learning Methods: Evidence from China. Energy Econ. 2023, 127, 107089. [Google Scholar] [CrossRef]
- Tang, W.; Bu, H.; Ji, Y.; Li, Z. Market Uncertainty and Information Content in Complex Seasonality of Prices. Pac.-Basin Financ. J. 2024, 86, 102430. [Google Scholar] [CrossRef]
- Zhou, Y.; Li, T.; Shi, J.; Qian, Z. A CEEMDAN and XGBOOST-Based Approach to Forecast Crude Oil Prices. Complexity 2019, 2019, 4392785. [Google Scholar] [CrossRef]
- Zhang, T.; Tang, Z.; Wu, J.; Du, X.; Chen, K. Multi-Step-Ahead Crude Oil Price Forecasting Based on Two-Layer Decomposition Technique and Extreme Learning Machine Optimized by the Particle Swarm Optimization Algorithm. Energy 2021, 229, 120797. [Google Scholar] [CrossRef]
- Huang, N.E.; Shen, Z.; Long, S.R.; Wu, M.C.; Shih, H.H.; Zheng, Q.; Yen, N.-C.; Tung, C.C.; Liu, H.H. The Empirical Mode Decomposition and the Hilbert Spectrum for Nonlinear and Non-Stationary Time Series Analysis. Proc. R. Soc. Lond. A 1998, 454, 903–995. [Google Scholar] [CrossRef]
- Lin, Y.; Yan, Y.; Xu, J.; Liao, Y.; Ma, F. Forecasting Stock Index Price Using the CEEMDAN-LSTM Model. N. Am. Econ. Financ. 2021, 57, 101421. [Google Scholar] [CrossRef]
- Fang, Y.; Wang, W.; Wu, P.; Zhao, Y. A Sentiment-Enhanced Hybrid Model for Crude Oil Price Forecasting. Expert Syst. Appl. 2023, 215, 119329. [Google Scholar] [CrossRef]
- Wu, J.; Dong, J.; Wang, Z.; Hu, Y.; Dou, W. A Novel Hybrid Model Based on Deep Learning and Error Correction for Crude Oil Futures Prices Forecast. Resour. Policy 2023, 83, 103602. [Google Scholar] [CrossRef]
- Xue, J.; Shen, B. A Novel Swarm Intelligence Optimization Approach: Sparrow Search Algorithm. Syst. Sci. Control Eng. 2020, 8, 22–34. [Google Scholar] [CrossRef]
- Yi, A.; Yang, M.; Li, Y. Macroeconomic Uncertainty and Crude Oil Futures Volatility–Evidence from China Crude Oil Futures Market. Front. Environ. Sci. 2021, 9, 636903. [Google Scholar] [CrossRef]
- Yang, K.; Wei, Y.; Li, S.; Liu, L.; Wang, L. Global Financial Uncertainties and China’s Crude Oil Futures Market: Evidence from Interday and Intraday Price Dynamics. Energy Econ. 2021, 96, 105149. [Google Scholar] [CrossRef]
- Zhang, W.; Lin, Z.; Liu, X. Short-Term Offshore Wind Power Forecasting—A Hybrid Model Based on Discrete Wavelet Transform (DWT), Seasonal Autoregressive Integrated Moving Average (SARIMA), and Deep-Learning-Based Long Short-Term Memory (LSTM). Renew. Energy 2022, 185, 611–628. [Google Scholar] [CrossRef]
- Paparrizos, J.; Gravano, L. K-Shape: Efficient and Accurate Clustering of Time Series. Sigmod Rec. 2016, 45, 69–76. [Google Scholar] [CrossRef]
- Guo, J.; Zhao, Z.; Sun, J.; Sun, S. Multi-Perspective Crude Oil Price Forecasting with a New Decomposition-Ensemble Framework. Resour. Policy 2022, 77, 102737. [Google Scholar] [CrossRef]
- Diebold, F.X.; Mariano, R.S. Comparing Predictive Accuracy. J. Bus. Econ. Stat. 2002, 20, 134–144. [Google Scholar] [CrossRef]
- Liu, M.-D.; Ding, L.; Bai, Y.-L. Application of Hybrid Model Based on Empirical Mode Decomposition, Novel Recurrent Neural Networks and the ARIMA to Wind Speed Prediction. Energy Conv. Manag. 2021, 233, 113917. [Google Scholar] [CrossRef]
- Su, L.; Zuo, X.; Li, R.; Wang, X.; Zhao, H.; Huang, B. A Systematic Review for Transformer-Based Long-Term Series Forecasting. Artif. Intell. Rev. 2025, 58, 80. [Google Scholar] [CrossRef]


Disclaimer/Publisher’s Note: The statements, opinions and data contained in all publications are solely those of the individual author(s) and contributor(s) and not of MDPI and/or the editor(s). MDPI and/or the editor(s) disclaim responsibility for any injury to people or property resulting from any ideas, methods, instructions or products referred to in the content. |
© 2026 by the authors. Licensee MDPI, Basel, Switzerland. This article is an open access article distributed under the terms and conditions of the Creative Commons Attribution (CC BY) license.