Abstract
The design of an accurate cross-domain model for Alzheimer disease AD classification from MRI scans faces critical challenges, including domain shifts caused by acquisition protocol variations. To address this issue, we propose a novel unsupervised two-level adapting model for Alzheimer’s disease classification using 3D MRI scans. In the first level, we introduce an extended mean inter- and intra-class discrepancy metric, which statistically aligns both inter-class and inter-domain discrepancies, enabling pseudo-labeling of the unlabeled samples. The second level integrates labeled source and pseudo-labeled target features into an adversarial learning, encouraging the feature extractor to generate domain-invariant representations, thereby improving model generalizability. The proposed model uses standard Alzheimer’s disease benchmarks, including ADNI and AIBL databases. Experimental results demonstrate UTLAM’s superior transfer learning capability compared to the existing baselines in identifying cognitive normal CN, AD, and mild cognitive impairment in MCI subjects. Notably, UTLAM achieves classification accuracies of (92.02%, 77.72%, and 83.04%), (92.60%, 71.45%, and 62.50%), and (93.22%, 84.80%, and 72.19%) on (CN vs. AD, MCI vs. AD, and CN vs. MCI) classifications via ADNI-1 to AIBL, ADNI-1 to ADNI-2, and AIBL to ADNI-3 transfer learnings, respectively. Without relying on a labeled target, UTLAM offers a highly practical solution for Alzheimer’s disease classification.
1. Introduction
In the last decade, biomedical imaging has become an important tool in modern healthcare, enabling non-invasive visual insights into anatomical structures. It facilitates early diagnosis and treatment for a wide range of diseases, including brain disorders. The Magnetic Resonance Imaging (MRI) technique gained increasing attention in medical imaging due to its ability to capture high-resolution structural information of the brain. One of many brain disorders, Alzheimer’ disease (AD) represents major health challenge, affecting millions of people worldwide [1,2,3]. Although AD is still a non-curable disease, early identification of AD allows for timely intervention that mitigates the symptoms and improves patient outcomes.
While domain adaptation techniques are extensively explored in natural image analysis, their application in medical MRI scans remains unexplored. Medical images have unique characteristics, including variations in imaging modalities (MRI, computed tomography (CT), and ultrasound), patient demographic variations on the basis of race and geographic region, and differences in anatomy and tissue composition [1,2,3,4,5,6]. Moreover, deep learning models often require large and high-quality labeled datasets for effective model training that are not available in the medical field because of strict patient privacy regulations and the sensitive nature of medical data.
One of the main challenges in deep learning-based brain imaging is domain shift, which arises from variations in the density distributions of scans derived from clinical institutes with different imaging modalities and different imaging protocols. For example, differences in scanner resolution or the settings used to capture images can result in variations in image quality and contrast. A model that is pre-trained on a set of labeled data samples cannot perform well when applied to unseen data samples from different domains. This gap between labeled (source) and unlabeled (target) distributions imposes erroneous transfer learning across domains. The process of aligning the feature distributions of the source and target domains is referred to as domain adaptation [5,6,7,8,9,10]. In this context, unsupervised domain adaptation (UDA) approaches are proposed to smooth transfer learning from a labeled source domain (where labeled data are available) to a target domain (where no labeled data are available).
Many UDA approaches have been proposed to bridge the gap between the source and target domains in the feature space for brain imaging [11,12,13,14,15,16,17,18,19,20,21,22,23,24,25,26,27,28,29,30,31,32,33,34]. The existing UDA approaches mainly focus on deploying refined learning techniques, which require the model to learn domain-invariant features from both the source and the target for better model generalization. For example, domain-adversarial neural networks (DANNs) are widely utilized as UDA neural networks for brain image classification [35]. In the DANN, a domain classifier is trained to distinguish between the source and target domains, whereas the feature extractor is trained to generate domain-invariant features to adversely confuse the domain classifier. On the other hand, the existing statistical approaches depend on minimizing a defined inter-domain metric measuring the distance between features of the source and target within each class. One of the existing statistical UDA approaches is correlation alignment, in which the covariance of the source and target distributions is aligned to reduce the domain shift, resulting in cross-institutional medical imaging. The existing UDA methods often concentrate on aligning intra-class feature distributions between the source and target domains without considering the inter-class variations that can significantly affect the classification performance of the learned model [11,12,13,14,15]. Brain image classification tasks require the model to effectively distinguish between critical inter-class variations, an issue that is not well addressed by existing UDA techniques.
Specifically, a limited number of studies have directly addressed the cross-domain challenges in AD classification using MRI data. Among the most recent state-of-the-art approaches, DyMix [25] introduced a dynamic frequency mix-up scheduler for domain adaptation in AD classification. This method integrates low-level statistical alignment with adversarial learning and fast Fourier transformation (FFT) to augment data due to an adaptive amplitude manipulation mechanism. In [33], a frequency mix-up manipulation model has been proposed for AD classification. This employs self-adversarial disentangling through frequency manipulation, enabling the model to learn intensity-invariant features. However, while these approaches improve robustness to cross-domain variations, they primarily rely on frequency transformations and adversarial learning, which may not fully capture the complex inter-class relationships inherent in AD progression (i.e., CN → MCI → AD). Consequently, their fine-grained class discrimination ability remains limited.
Despite remarkable advances in deep learning-based medical image analysis, several critical limitations persist in current AD classification studies, particularly in cross-domain transfer learning settings: 1—limited inter-class awareness: current domain adaptation methods primarily focus on reducing global domain discrepancies while neglecting class-level feature separability between AD, MCI, and CN categories, which is essential for accurate diagnosis; 2—lack of iterative adaptation mechanisms: few methods incorporate iterative pseudo-label refinement or multi-level alignment strategies to progressively enhance feature invariance during training.
To address these limitations, this study introduces a novel Unsupervised Two-Level Adapting Model (UTLAM) specifically designed for cross-domain AD identification. The proposed framework employs a dual-alignment mechanism that enhances both intra-domain consistency and inter-class separability across domains. At its core, UTLAM leverages a new mean inter- and intra-class discrepancy (MIID) metric to simultaneously minimize domain-level misalignment within each class and maximize discriminative distances between the AD, MCI, and CN categories. This design ensures that subtle neuroanatomical variations critical to AD diagnosis are preserved during feature adaptation.
In addition, UTLAM incorporates an iterative pseudo-labeling and adversarial learning strategy, where unlabeled target samples are progressively assigned pseudo-labels and integrated into the training process. This iterative procedure encourages the CNN-based feature extractor to generate increasingly domain-invariant and class-discriminative representations without requiring labeled target data. Such a mechanism is particularly important for AD classification, where disease stages exhibit overlapping imaging characteristics and fine-grained feature distinctions are clinically meaningful. By unifying statistical alignment and adversarial adaptation, the proposed UTLAM effectively bridges the domain gap while maintaining class-specific separability, thereby achieving robust, transferable, and clinically relevant AD classification across diverse MRI datasets.
The main contributions of this study are summarized as follows: 1—dual-level alignment framework: a two-level adaptation strategy is developed—combining statistical feature alignment and adversarial learning—to effectively handle cross-domain discrepancies in MRI-based AD classification; 2—novel discrepancy metric (MIID): a new mean inter- and intra-class discrepancy metric is formulated to align intra-class (domain-level) features and maximize inter-class (category-level) separability, ensuring clearer distinctions among AD, MCI, and CN subjects; 3—iterative pseudo-labeling and adversarial learning: the model employs an iterative pseudo-labeling strategy to progressively refine target sample labels and enhance domain adaptation through adversarial feature learning.
2. Literature Review
Unsupervised domain adaptation (UDA) has emerged as a pivotal strategy to address domain shifts in medical imaging, particularly for brain MRI analysis in Alzheimer’s disease (AD) identification. Domain shifts, caused by variations in imaging protocols, scanner types (e.g., 1.5 T vs. 3 T), and patient demographics, significantly degrade deep learning model performance on unseen target domains [1,2,18,20,21]. In AD, where early and accurate diagnosis is critical for timely intervention due to progressive neurodegeneration affecting regions such as the hippocampus, UDA methods are essential to bridge the gap between labeled source domains (e.g., the ADNI) and unlabeled target domains (e.g., clinical scans from diverse institutions). This section reviews the recent baseline UDA approaches for medical imaging, focusing on their application in AD classification, and identifies key limitations that motivated the development of the proposed unsupervised two-level adapting model (UTLAM). Existing UDA methods are categorized into learning-based and statistical-based approaches, with each addressing domain shifts through distinct mechanisms.
2.1. Learning-Based Unsupervised Domain Adaptation
Learning-based UDA methods leverage advanced neural network architectures, such as adversarial learning, to align source and target domain feature distributions without requiring labeled target data. A prominent approach is the Domain-Adversarial Neural Network (DANN) [34], which integrates a feature extractor (e.g., a convolutional neural network, CNN) with two parallel classifiers: a label predictor for task-specific classification and a domain discriminator to distinguish between source and target domains. The feature extractor is trained to generate domain-invariant features by adversarially confusing the domain discriminator, ensuring that the label predictor generalizes across domains. The DANN has been widely applied in medical imaging, including cross-modality tasks such as MRI-to-CT adaptation [36] and AD classification [32]. For example, Guan et al. [32] employed a DANN with an attention-guided mechanism to harmonize multisite MRI scans, improving AD identification by focusing on dementia-related brain regions such as the hippocampus and ventricles.
Another key method is Conditional Generative Adversarial Networks (CGANs) [23,37]. CGANs generate synthetic target domain data conditioned on source domain samples, incorporating random noise to align distributions. The generator produces data that are indistinguishable from the target domain, whereas the discriminator distinguishes real from synthetic samples. In medical imaging, CGANs are effective for cross-institutional adaptation, addressing significant domain shifts due to scanner settings [23]. For AD classification, CGANs augment limited target data, enhancing model robustness [38]. However, learning-based methods such as the DANN and CGANs often prioritize global feature alignment, neglecting the subtle inter-class variations that are critical for distinguishing between closely related conditions, such as mild cognitive impairment (MCI) and AD. Additionally, their sensitivity to hyper-parameter tuning and high computational requirements limit their practicality in resource-constrained clinical settings [39].
2.2. Statistically Based Unsupervised Domain Adaptation
Statistical-based UDA approaches minimize discrepancies between the source and target domains by aligning the statistical properties of their feature distributions. A widely used method is the maximum mean discrepancy (MMD), which measures the Euclidean distance between the mean feature vectors of the source and target domains in a reproducing kernel Hilbert space [16,17,40,41]. MMD has been applied to medical imaging tasks, such as brain lesion segmentation and AD classification, by aligning intra-class feature distributions [40]. For example, Zhu [17] combined MMD with CNNs to reduce domain gaps in cross-modal brain disease diagnosis, achieving robust performance across MRI datasets. However, MMD focuses on intra-class alignment and does not explicitly address inter-class discrepancies, which are crucial for distinguishing cognitive normal (CN), MCI, and AD patients because of subtle biomarker differences [42].
Another statistical method is correlation alignment (CORAL), which minimizes the domain shift by aligning the second-order statistics (covariance) of the source and target feature distributions [24,41]. CORAL is effective in cross-institutional medical image analysis, where imaging protocol variations lead to differing feature distributions [41]. In AD, CORAL has aligned MRI features across the ADNI and AIBL datasets, improving model generalizability [30]. Recently, Shin et al. [25] proposed DyMix, a dynamic frequency mix-up scheduler that integrates low-level statistical alignment with adversarial learning. DyMix uses fast Fourier transformation (FFT) and amplitude-phase recombination to adapt to intensity variations, achieving state-of-the-art performance in AD classification [25]. Despite these advances, statistical-based methods often fail to capture the fine-grained inter-class variations that are necessary for accurate AD diagnosis, particularly for MCI vs. CN or AD, where subtle pathological differences dominate [42,43].
2.3. State-of-the-Art AD Classification Methods
Another recent state-of-the-art methods for AD classification was proposed by the authors of [44]: a CNN-based model with an attention mechanism for MRI-based AD diagnosis. Their framework introduces an MRI Segmentation Block (MSB) during preprocessing to enhance the model’s ability to learn from complex structural patterns. In addition, a connection-wise attention mechanism is employed to highlight clinically relevant features while suppressing less informative regions. In [45], a contrastive self-supervised learning approach was introduced, where a ConvNeXt-based feature extractor is trained using contrastive objectives and paired with a supervised classification head. This method demonstrated strong performance on both the ADNI and AIBL datasets. In [46], a multimodal and multiscale deep learning model was presented, leveraging interactions across multiple neuroimaging modalities and scales to capture global and local patterns associated with AD. Evaluated on the ADNI dataset, this method improved diagnostic accuracy and robustness.
2.4. Research Gap
While learning-based and statistical-based UDA methods have advanced brain-imaging analyses, they have limitations that hinder their effectiveness for AD classification [22]. Learning-based approaches such as the DANN and CGANs excel at generating domain-invariant features but often overlook inter-class separability, reducing discriminative power in tasks requiring fine-grained classification (e.g., MCI vs. AD) [47]. Statistical-based methods such as MMD and CORAL focus on intra-class alignment but neglect inter-class discrepancies, which are critical for distinguishing subtle pathological differences in neurodegenerative diseases [42]. Moreover, many UDA methods rely on simplistic assumptions about feature distributions, limiting their ability to handle the complex, high-dimensional nature of brain MRI data [43]. The proposed UTLAM addresses these gaps by introducing a two-level adaptation framework that simultaneously aligns inter-domain and inter-class discrepancies via a novel mean inter-class discrepancy (MIID) metric and iterative pseudo-labeling with adversarial learning. This dual approach ensures robust feature alignment while preserving discriminative characteristics, making UTLAM particularly suitable for AD classification in real-world clinical scenarios.
3. Materials and Methods
3.1. Datasets
The proposed UTLAM was conducted on two widely used neuroimaging cohorts: Alzheimer’s Disease Neuroimaging Initiative [26] (ADNI), and Australian Imaging, Biomarker & Lifestyle Flagship Study of Ageing [27] (AIBL). These datasets provide structural MRI scans of three classes: cognitively normal (CN), mild cognitive impairment (MCI), and Alzheimer’s disease (AD). All the volumetric scans were subjected to a standardized preprocessing pipeline in which non-brain tissues were removed using FSL BET [26]. Intensity normalization (zero-mean, unit-variance scaling) and spatial resampling to 1 mm3 isotropic resolution (tri-linear interpolation) were then applied. For model input, scans were center-cropped to 160 × 192 × 160 voxels. During training, data augmentation was performed through random rotations (±10°), axial flips (p = 0.5), and intensity shifts (±20% global scaling).
To evaluate domain adaptation performance, we designed four transfer learning scenarios covering clinically relevant domain shifts:
- Scanner heterogeneity: ADNI-1 (1.5 T) → ADNI-2 (3 T).
- Cross-institutional variation: ADNI-1 → AIBL and AIBL → ADNI-3.
- Longitudinal protocol differences: ADNI-1 → ADNI-3.
These tasks systematically assess the model’s robustness to variations in magnetic field strength (1.5 T vs. 3 T), image quality (signal-noise ratio [SNR] and resolution), and acquisition protocols across clinical sites. Figure 1 provides representative examples, highlighting the domain-specific characteristics of the CN, MCI, and AD scans from both datasets.
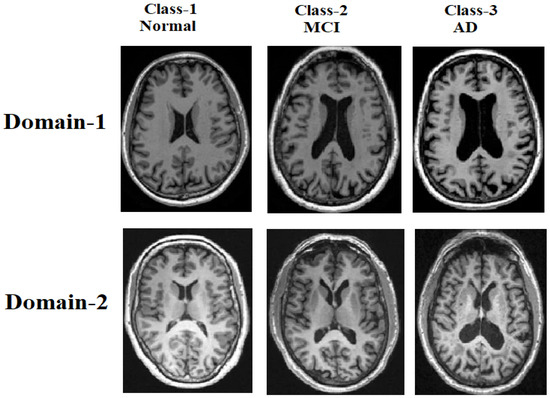
Figure 1.
Samples of MRI brain scans from the ADNI and AIBL datasets, illustrating domain shifts across the cognitive normal (CN), mild cognitive impairment (MCI), and Alzheimer’s disease (AD) classes.
For each transfer-learning task, the data split was performed at the subject level, ensuring that scans from the same individual were never included in both the training (source) and testing (target) sets. This procedure guarantees that the model does not encounter the same subject’s data during both the adaptation and evaluation stages. Within each source domain, 80% of the labeled scans were used for model training and 20% for validation to monitor convergence. The target domain data consisted entirely of unlabeled scans, which were only used during adaptation and pseudo-labeling.
3.2. Methodology
In this subsection, we detail the operational framework of the proposed unsupervised two-level adapting model (UTLAM) for Alzheimer’s disease identification via 3D MR images. As illustrated in Figure 2, UTLAM comprises a feature extraction phase followed by a two-level domain adaptation mechanism that integrates statistical alignment and adversarial learning. The first level employs a novel mean inter-class discrepancy (MIID) metric to align features across domains while enhancing class separability. The second level leverages pseudo-labeled target samples in an adversarial learning framework to generate domain-invariant features, ensuring robust generalization across domains. This dual approach addresses both intra-class domain discrepancies and inter-class separability, which are critical for accurate Alzheimer’s disease classification. The following subsections elaborate on each component, with detailed descriptions of preprocessing, feature alignment, and adversarial learning.
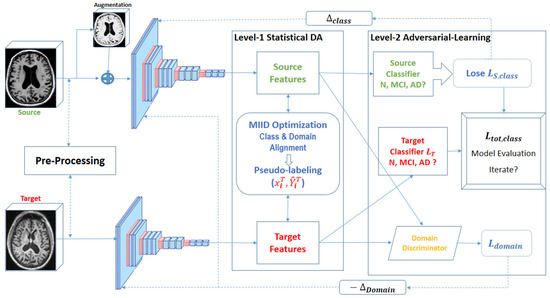
Figure 2.
Overview of the UTLAM showing two levels of adaptation: statistical DA and adversarial learning.
3.3. Preprocessing and Feature Extraction
A three-dimensional convolutional neural network (3D CNN) is employed to extract meaningful features from 3D MRI scans due to its ability to capture both semantic and spatial information from volumetric data. MRI scans undergo a standardized preprocessing pipeline, including normalization (zero-mean, unit-variance scaling), spatial resampling to 1 mm3 isotropic resolution via tri-linear interpolation, and data augmentation. The augmentation includes random rotations (±10°), axial flips (p = 0.5), and intensity shifts (±20% global scaling) to simulate realistic variations in MRI acquisition while preserving anatomical integrity.
The 3D CNN architecture consists of five blocks with a total of 13 convolutional layers, which are selected on the basis of empirical evaluations to balance computational efficiency with the ability to capture complex spatial features from MR images. Each convolutional block employs 3 × 3 kernels to extract fine-grained spatial features, followed by ReLU activation. Down-sampling is performed via max pooling and average pooling layers with 2 × 2 × 2 kernels. The convolutional layers are followed by fully connected layers with ReLU activation and dropout (rate = 0.5) to mitigate over-fitting. Owing to significant distribution shifts between the source and target domains, the extracted features exhibit large discrepancies, making them unsuitable for direct model learning. To address this, UTLAM employs a robust feature alignment strategy through minimizing domain-level discrepancies within each class, maximizing class-level separability between classes, and generating domain-invariant features through adversarial learning, as detailed in Section 3.4 and Section 3.5.
3.4. Feature Alignment Using the Proposed MIID Metric
Features are extracted from source and target domains via 3D CNN, and then mean inter-class discrepancy (MIID) metric is computed to align these features, enabling domain-invariant model learning. The existing maximum mean discrepancy (MMD) metric focuses solely on intra-class alignment. We extended MMD to MIID to address both inter-class and intra-class discrepancies, ensuring both domain alignment and class separability as follows.
represents labeled source domain samples with features and labels . denotes the unlabeled target domain samples. For each class (), and are the mean feature vectors for class () in the source and target domains, respectively. and represent the mean feature vectors of all classes except (c) in the source and target domains, respectively. The MIID metric is defined in Equation (1):
In (1), the term aligns target samples with the corresponding source class mean , whereas the term maximizes the distance between target samples and the means of other source classes , enhancing class separability. Similarly, aligns source samples with the corresponding target class mean , and maximizes the distance to other target class means . The target class means are initially estimated via pseudo-labels generated by the source-trained CNN, as described in Section 4.1.
Hyper-parameter controls the trade-off between intra-class alignment and inter-class separability and was empirically set to 0.5 on the basis of validation performance to balance these objectives. While MIID introduces additional computational overhead compared with MMD due to inter-class discrepancy calculations, this is mitigated by efficient batch processing during training. By addressing both intra-class and inter-class discrepancies, MIID ensures that samples from different domains are closely aligned within their respective classes while maintaining distinct separation between classes, enhancing cross-domain learning for Alzheimer’s disease classification.
3.5. Pseudo-Labeling and Adversarial Learning
In this step, UTLAM assigns pseudo-labels to unlabeled target domain samples and integrates them with labeled source samples for adversarial training to enhance feature alignment. For each target sample , an initial pseudo-label is predicted via a CNN trained on the source domain. A confidence threshold is applied to select reliable pseudo-labels , balancing accuracy and sample coverage on the basis of empirical tuning. The pseudo-labeled target samples are then combined with labeled source samples to train the model adversarially.
To achieve domain-invariant feature representations, UTLAM employs an adversarial learning framework with a domain discriminator (D). The discriminator is trained to distinguish between source and target domain features, whereas the feature extractor (CNN) is trained to confuse the discriminator, aligning feature distributions across domains. The discriminator’s loss function is defined according to Equation (2).
Here, represents the feature representation extracted by the CNN with parameters , including the convolutional kernels, biases, and batch normalization parameters. Conversely, adversarial loss is computed according to Equation (3).
The adversarial learning process involves two opposing optimization objectives. The domain discriminator D, parameterized by is trained to distinguish between source and target domain features by minimizing the domain classification loss (Equation (2)). Conversely, the feature extractor (CNN), parameterized by , is trained to generate domain-invariant representations by minimizing the adversarial loss (Equation (3)). This alternating optimization between and encourages the model to align the feature distributions across domains while preserving class-discriminative characteristics.
The total classification loss combines contributions from both domains, as formulated in Equation (4):
The adversarial learning and pseudo-labeling process is iterated until convergence, with early stopping applied if the validation accuracy plateaus for 10 consecutive epochs. The domain adaptation loss weight was tuned to ensure balanced optimization between the classification and domain alignment objectives. Algorithm 1 outlines the pseudo-labeling and adversarial learning process.
| Algorithm 1. Pseudo-labeling and adversarial learning phase |
| Initialize: domain discriminator , pseudo-label set , Confidence threshold , domain adaptation. |
| 1: from 1 to max_epochs do //Pseudo-Labeling 2: for each do 3: Predict an initial pseudo-label: 4: Compute confidence score: 5: if > then 6: Add pseudo-labeled sample to ) 7: end if 8: end for //Adversarial Domain Adaptation 9: Compute discriminator loss : 10: Optimize to minimize 11: Compute adversarial loss : 12: Optimize to minimize //Evaluate the Model 13: Compute validation accuracy on target domain 14: if validation accuracy > best validation accuracy then 15: Best validation accuracy ← current accuracy 16: end if 17: end for |
UTLAM’s hybrid approach combines statistics-based alignment (via MIID) and learning-based adversarial training, significantly improving classification accuracy by addressing both global distributional discrepancies and local class-specific characteristics. The iterative pseudo-labeling process relies on the source-trained CNN, which may introduce errors if the initial model fails to generalize. This limitation is discussed further in Section 6.
4. Results
4.1. Implementation Setup
We evaluated the UTLAM on the ADNI and AIBL datasets, as described in Section 3.1, to classify three categories: NC, MCI, and AD. The model was tested across three transfer learning tasks: ADNI1 to AIBL, AIBL to ADNI1, and ADNI2 to ADNI3. To assess the model’s domain adaptation capability, we trained it via source domain scans from ADNI1, AIBL, and ADNI2 and then evaluated its performance on the target unlabeled data samples from AIBL, ADNI1, and ADNI3, respectively. The UTLAM framework was implemented using PyTorch 2.0, and the network was trained for 100 epochs on each transfer-learning task. The CNN feature extractor consists of five convolutional blocks, each comprising 3 × 3 × 3 kernels, ReLU activations, and both max-pooling and average-pooling layers (2 × 2 × 2) for down-sampling. The extracted features were passed through two fully connected layers with ReLU activations and dropout (0.5) for regularization.
Training was conducted using the Adam optimizer with a learning rate of 1 × 10⁻⁴, epsilon of 1 × 10⁻⁸, and a batch size of 32. The cross-entropy loss function was employed for classification, while the adversarial and MIID losses were jointly optimized for domain alignment. The learning rate decayed by a factor of 0.1 every 30 epochs, and early stopping was applied based on validation loss stability to prevent overfitting. Data augmentation included intensity normalization, random rotations (±10°), and spatial flipping to increase sample diversity. All experiments were implemented in PyTorch 2.0 and executed on Google Colab, utilizing an NVIDIA Tesla T4 GPU (16 GB memory) and 12 GB RAM.
4.2. Grad-CAM Visualization
Gradient-weighted class activation mapping (Grad-CAM) [28] is a widely used visualization technique for identifying salient regions in medical images. It localizes and generates heatmaps that reveal which brain areas the model focuses on during classification. To evaluate the proposed UTLAM, we applied Grad-CAM to target-domain MRI scans. Figure 3 presents the Grad-CAM visualizations of the proposed UTLAM, illustrating the attention regions on MRI scans from the target domain. The highlighted areas correspond to brain regions that are clinically recognized as being affected during the progression of AD. Specifically, the hippocampus, entorhinal cortex, and ventricular regions exhibit strong activations in the heatmaps. These regions are consistent with neuropathological findings in AD, where hippocampal atrophy and ventricular enlargement are among the earliest and most reliable structural biomarkers of neurodegeneration. The consistent focus of UTLAM on these areas suggests that the model successfully identifies meaningful anatomical regions related to memory and cognitive decline, rather than relying on irrelevant or artifact features.
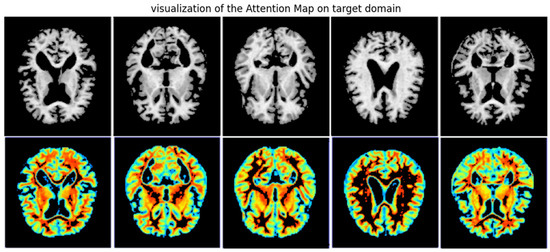
Figure 3.
UTLAM Grad-CAM visualization of target domains, the red (greater) and purple colors (lower) denote the impact on the model decisions.
A visual comparison between the UTLAM results presented in Figure 3 and the Grad-CAM outputs from the PMDA model [30] shown in Figure 4 reveals distinct differences in both the localization and consistency of model attention across AD samples. The UTLAM heatmaps are relatively concentrated and consistently emphasize medial temporal and periventricular regions—areas that are clinically implicated in Alzheimer’s pathology (hippocampal atrophy and ventricular enlargement). By contrast, the PMDA Grad-CAM outputs show heterogeneous activations across samples.
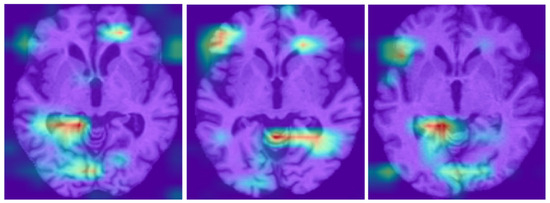
Figure 4.
PMDA Grad-CAM visualization of target domains, the red (greater) and purple colors (lower) denote the impact on the model decisions [30].
4.3. Evaluation Metrics
In this study, we evaluate the performance of the UTLAM for Alzheimer’s disease identification via four key criteria: classification accuracy (ACC), sensitivity (SEN), specificity (SPE), and the area under the receiver operating characteristic curve (AUC). The following parameters were used: TP (true positive)—the number of correctly predicted positive samples; TN (true negative)—the number of correctly predicted negative samples; FP (false positive)—the number of incorrectly predicted positive samples; FN (false negative)—the number of incorrectly predicted negative samples. The evaluation metrics were defined as follows:
The AUC represents the probability that the model ranks a randomly chosen positive sample higher than a randomly chosen negative sample. For all four metrics, higher values indicate better classification performance.
4.4. Per-Class Performance Evaluation
To validate the effectiveness of the proposed UTLAM, a per-class performance evaluation was conducted for the binary classification tasks (AD vs. CN) across different transfer-learning scenarios. Table 1 presents the confusion matrices and per-class performance metrics, including precision, recall, and F1-score. Each confusion matrix includes a balanced dataset of 100 test samples (50 from each class), ensuring a consistent basis for comparison.

Table 1.
Confusion matrix and per-class performance of the UTLAM.
4.5. Comparisons of the 3-T → 1.5-T Classification Accuracy
To evaluate the effectiveness of the UTLAM for MRI domain adaptation, we conducted extensive experiments on benchmark datasets exhibiting varying degrees of domain shift. For a fair and consistent comparison, all baseline methods reported in Table 2 were re-implemented by the authors using the same ADNI and AIBL datasets, following the experimental settings described in their respective studies. As an initial experiment, we performed transfer learning from ADNI 3 T to ADNI 1.5 T, where the model was trained on labeled 3 T MR images and tested on unlabeled 1.5 T images. As shown in Table 2, UTLAM outperforms existing methods in terms of classification accuracy. Notably, the model achieves high accuracy in distinguishing AD cases from CN cases. However, performance is comparatively lower for the MCI vs. CN and MCI vs. AD classifications.
Table 2.
3 T to 1.5 T transfer learning classification accuracy comparisons.
These findings are consistent with the Grad-CAM visualizations in Figure 3, where MCI samples exhibit less distinct salient regions. This suggests that structural differences in MCI are more subtle, making distinguishing MCI from both the CN and AD classes inherently more difficult.
4.6. Comprehensive Analysis and Classification Comparisons
To ensure a comprehensive and fair evaluation of the proposed model, we conducted additional experimental sessions across various transfer-learning scenarios, including ADNI to AIBL, AIBL to ADNI, and cross-domain transfers within ADNIs. The obtained results were compared against those of baseline UDA studies that implemented the same transfer-learning configurations. Importantly, no labeled target data were used in any of the domain adaptation experiments. The model was trained solely on labeled source domain scans while learning from unlabeled target domain scans, adhering to the principles of UDA.
To maintain consistency, all the experiments involving the proposed UTLAM framework followed the same preprocessing pipeline and model setup as outlined in the previous sections. This subsection presents a comparative analysis of the performance of the UTLAM against that of the baseline models, using the ACC, AUC, SEN, and SPE as evaluation metrics. These metrics provide a comprehensive assessment of the model’s effectiveness and validate the superiority of the UDA approach employed in the proposed framework.
As shown in Table 3, the UTLAM outperformed the baseline methods across almost all the transfer-learning methods for the four performance metrics (ACC, SEN, SPE, and AUC). Although the compared studies used varying numbers of MRI scans from the ADNI and AIBL, we standardized our evaluation by considering the minimum number of training and testing samples, ensuring a fair comparison. Specifically, we included 80 AD, 100 MCI, and 350 CN subjects from AIBL and 120 AD, 150 MCI, and 150 CN subjects from the ADNI. Among the classification tasks, AD vs. MCI posed the greatest challenge for UTLAM, where its performance occasionally fell slightly below that of DyMix. However, the dual adaptation mechanism in UTLAM ensures robust domain transferability while maintaining high model generalizability. By addressing both global distributional discrepancies and local target-specific characteristics, UTLAM offers a more holistic and effective UDA framework than existing approaches, leading to significant performance improvements. In the next subsection, we further analyze the methodologies employed in the compared models, with a particular focus on the DyMix method.
Table 3.
Performance comparisons of the proposed UTLAM with those in the most recent literature for various types of transfer learning.
5. Discussion
5.1. Compared Approaches Discussion
In this subsection, we discuss the various approaches listed in Table 3 compared with UTLAM, and how UTLAM could achieve better results. In [32], a multisite MRI harmonization method was proposed using an attention-guided deep domain adaptation framework. This identifies discriminative regions in whole-brain MR images, which are essential for effective brain disorder identification. The model incorporates an attention discovery module to localize dementia-related regions within MRI scans and then applies adversarial learning to facilitate knowledge transfer between the source and target domains.
FFM [33] introduces a frequency mix-up manipulation UDA model for brain disease identification. It employs self-adversarial disentangling through frequency manipulation, enabling the model to learn intensity-invariant features. FFM overcomes the limitations of existing frequency-based methods, which often lose semantic information in the low-frequency spectrum. By aligning the feature distributions of the source and target domains through mixed-frequency domains, FFM effectively preserves semantic integrity for improved adaptation. PMDA [30] proposes a prototype-guided multiscale domain adaptation model for Alzheimer’s disease detection. After extracting features via CNNs, PMDA incorporates a Pro-MDD, which introduces prototype learning on maximum density divergence to impose stronger constraints on outlier samples, enhancing feature alignment and improving the model’s generalization ability.
DyMix [25] dynamically adjusts the frequency regions of the source and target domains via fast Fourier transform (FFT). After FFT processing, DyMix applies amplitude-phase recombination to ensure resilience to intensity variations and employs adversarial learning to derive domain-invariant feature representations. While DyMix focuses primarily on frequency-based transformations and amplitude-phase recombination to adjust source-target discrepancies, it heavily relies on intensity variations and domain-invariant representations through adversarial learning. In contrast, UTLAM adopts a more comprehensive approach by integrating both statistical and adversarial learning techniques to simultaneously align inter-class and interdomain feature distributions, leading to superior domain adaptation performance.
5.2. t-SNE Visualization of Feature Distribution
To further justify the observed improvements in classification accuracy, we visualize the impact of the UTLAM on aligning feature distributions. To achieve this goal, we analyzed 120 MRI scans from ADNI2 and 140 scans from AIBL via t-SNE visualization to compare feature distributions before and after UTLAM adaptation. As illustrated in Figure 5, Figure 5a represents the feature distributions of the source domain (ADNI-2) and the target domain (AIBL), where all the samples belong to the AD class. Similarly, Figure 5b shows the distributions of the source domain (AIBL) and the target domain (ADNI-2), both from the AD class. Despite belonging to the same class, a clear divergence is evident between the source and target distributions before adaptation. In contrast, Figure 5c,d demonstrate the effect of UTLAM adaptation, where the source and target features become well aligned. The learned feature representations are indistinguishable between domains, indicating successful domain adaptation. This improved alignment significantly enhances the classification process, effectively bridging the domain gap in the feature space.
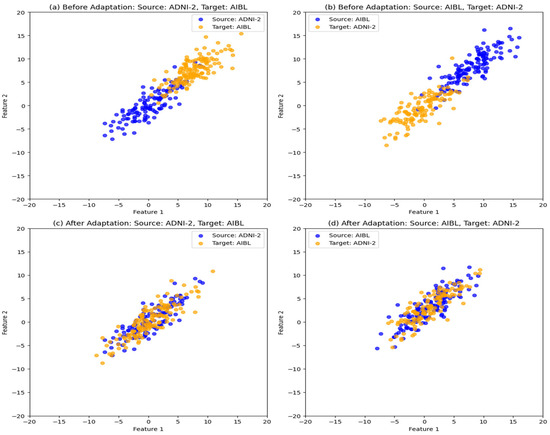
Figure 5.
t-SNE visualization of the feature distribution from the source and target domains of class AD. (a) Before adaptation: source ADNI-2 and target AIBL; (b) Before adaptation: source AIBL and target ADNI-2, (c) After UTLAM adaptation: source ADNI-2 target AIBL; (d) After UTLAM adaptation: source AIBL target ADNI-2.
5.3. Complexity DISCUSSION
The implementation of the model was performed via Google Colab, a cloud-based notebook service that requires no setup and provides free access to computing resources. To implement the UTLAM, PyTorch 2.0, NVIDIA Tesla T4 GPU (16 GB memory), and 12 GB RAM are deployed using Python programming language. Since the model training process is conducted offline, we focus on evaluating the computational efficiency of the online testing phase. The model achieves an average classification time of 0.07 s per MRI scan, demonstrating real-time inference capability.
Among the compared models in Table 3, only AD2A [32] reports computational cost, with an average processing time of 0.08 s per MRI scan. In addition to achieving a lower computational delay, the proposed UTLAM outperforms AD2A in classification accuracy, achieving an 8.3% improvement in CN vs. AD, an 11.2% improvement in AD vs. MCI, and a 10% improvement in MCI vs. CN classifications.
5.4. Ablation Study
Table 4 presents the results of ablation study in which we showed each component’s contribution to the overall classification performance of the UTLAM. We conducted the ablation study by progressively removing each component (MIID metric, adversarial learning, and pseudo-labeling) while keeping all other settings unchanged. The experiments were performed on two representative transfer-learning tasks: ADNI1 → AIBL and AIBL → ADNI3 for AD vs. CN classification. The ablation results demonstrate that each component contributes meaningfully to the domain adaptation of the UTLAM to AD classification performance.
Table 4.
Ablation study results of UTLAM components on cross-domain AD classification.
5.5. Pseudo-Label Confidence Evolution During Training
The evolution of pseudo-label confidence across training epochs provides valuable insight into how the UTLAM contributes to model stability and adaptation quality. During full training, pseudo-label confidence—defined as the model’s probability assigned to the predicted class—gradually increases as domain alignment improves. As illustrated in Figure 6, the pseudo-label accuracy exhibits a smooth, non-linear improvement throughout the UTLAM training process. During the early epochs, the pseudo-label accuracy remains relatively low reflecting the initial misalignment between the source and target domains. Between epochs 20 and 60, accuracy rapidly increases as the MIID metric progressively minimizes inter-domain discrepancies, allowing the model to generate more reliable pseudo-labels. Beyond epoch 70, the curve begins to plateau, indicating convergence toward stable domain-invariant representations, with pseudo-label accuracy reaching approximately 90–93% by epoch 100. This evolution demonstrates the effectiveness of UTLAM’s iterative learning strategy, where pseudo-label refinement and adversarial feature alignment jointly contribute to improved target-domain reliability. The observed trend is consistent with the ablation study results, confirming that pseudo-labeling is a critical component for achieving high classification accuracy and robust domain generalization.
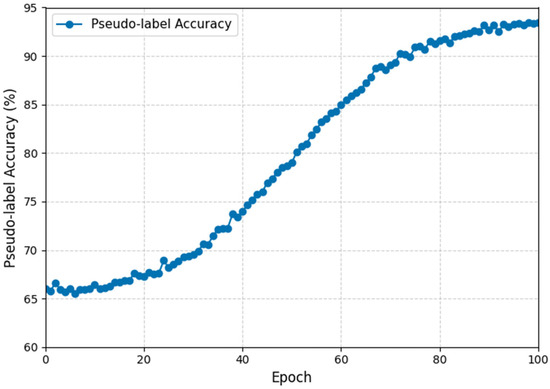
Figure 6.
Evolution of pseudo-label accuracy during UTLAM training for AIBL → ADNI3 (AD vs. CN).
5.6. Comparisons with the State-of-the-Art AD Classification Methods
To further validate the classification ability of the proposed UTLAM beyond cross-domain adaptation (trained and validated on the same domain), we evaluated its performance on (CN vs. AD) under a within-domain learning setup and compared it with several state-of-the-art AD classification frameworks on both the ADNI and AIBL benchmarks. To ensure a fair comparison, UTLAM was trained on 80% of each dataset and tested on the remaining 20%. As presented in Table 5, UTLAM achieved superior performance compared to existing within-domain approaches, attaining 97.30% accuracy, 98.75% sensitivity, and 99.80% specificity on the ADNI dataset—surpassing the previously best-performing MMSDL [46] and MSB [44] models. On the AIBL dataset, UTLAM maintained competitive results, with 85.26% accuracy, 70.10% sensitivity, and 95.56% specificity, outperforming the contrastive learning model [45] across all metrics. These results demonstrate that UTLAM not only excels in cross-domain transfer scenarios but also provides highly robust and discriminative feature representations within individual datasets, highlighting its generalization strength and clinical reliability for Alzheimer’s disease identification.
Table 5.
Comparison of UTLAM with state-of-the-art AD classification methods on (CN vs. AD) using ADNI and AIBL datasets.
Note: The results of the compared methods are reported as presented in their original publications. Some works only included evaluations of the ADNI dataset and did not provide AIBL results.
6. Conclusions
In this paper, we propose UTLAM, a novel unsupervised two-level alignment model for Alzheimer’s disease identification. UTLAM addresses the domain shift challenge between training-source and test-target brain MRI scans, ensuring a robust model for practical clinical applications. Unlike existing methods, UTLAM employs a comprehensive alignment approach by introducing the mean inter-class discrepancy (MIID) metric, which simultaneously measures interdomain and inter-class discrepancies in the feature space. The model leverages these aligned features to generate pseudo-labels for the unlabeled target scans. In the second adaptation level, UTLAM incorporates pseudo-labeled scans into an adversarial learning framework, encouraging the feature extractor to produce domain-invariant features. This iterative process of feature alignment, pseudo-labeling, and adversarial learning continues until interdomain feature convergence and inter-class feature separation are achieved. We conducted comprehensive experimental evaluations of the ADNI and AIBL databases, comparing the classification performance of the UTLAM against that of the baseline models. The results demonstrate significant improvements in terms of accuracy (ACC), specificity (SPE), sensitivity (SEN), and area under the curve (AUC) compared with state-of-the-art approaches.
To further justify the performance improvements, we employed Grad-CAM and t-SNE visualizations. Grad-CAM highlights the salient brain regions detected by the model, whereas t-SNE illustrates feature alignment, confirming the model’s ability to adapt across domains. Importantly, to reduce computational complexity, we utilized a minimal number of MRI scans for training. Despite this constraint, the UTLAM outperforms the baseline models. We believe that utilizing more powerful hardware and incorporating additional scans with larger domain shifts could further enhance model performance. Although the iterative training process requires a high level of computational power, the inference phase for any unseen MRI scan is computationally efficient and can be completed in a comparable time to existing models.
Author Contributions
Conceptualization, R.F. and J.A.; methodology, R.F. and J.A.; software, R.F. and J.A.; validation, R.F. and J.A.; formal analysis, R.F. and J.A.; investigation, R.F. and J.A.; resources, R.F. and J.A.; data curation, R.F. and J.A.; writing—original draft preparation, R.F. and J.A.; writing—review and editing, R.F. and J.A.; visualization, R.F. and J.A.; supervision, R.F.; project administration, R.F. and J.A.; funding acquisition, R.F. and J.A. All authors have read and agreed to the published version of the manuscript.
Funding
This research received no external funding.
Data Availability Statement
The data that support the findings of this study are available from [Australian Imaging, Biomarkers and Lifestyle (AIBL)] but restrictions apply to the availability of these data, which have been used under license for the current study, and so are not publicly available.
Acknowledgments
The authors have reviewed and edited the output and take full responsibility for the content of this publication.
Conflicts of Interest
The authors declare no conflicts of interest.
Abbreviations
The following abbreviations are used in this manuscript:
| UTLAM | Unsupervised two-level adapting model |
| MIID | Mean inter and intra class discrepancy |
| MRI | Magnetic resonance imaging |
| ADNI | Alzheimer’s disease neuroimaging initiative |
| AIBL | Australian imaging, biomarker and lifestyle |
| AD | Alzheimer’s disease |
| MCI | Mild cognitive impairment |
| CN | Cognitive normal |
| UDA | Unsupervised domain adaptation |
| MMD | Maximum mean discrepancy |
| GPU | Graphics processing unit |
| CPU | Central processing unit |
| FFT | Fast Fourier transform |
| Grad-CAM | Gradient-weighted class activation mapping |
References
- Kumari, S.; Singh, P. Deep learning for unsupervised domain adaptation in medical imaging: Recent advancements and future perspectives. Comput. Biol. Med. 2023, 167, 107912. [Google Scholar] [CrossRef] [PubMed]
- Guan, H.; Liu, M. Domain adaptation for medical image analysis: A survey. IEEE Trans. Biomed. Eng. 2021, 69, 1173–1185. [Google Scholar] [CrossRef] [PubMed]
- Xu, Z.; Gong, H.; Wan, X.; Li, H. ASC: Appearance and Structure Consistency for Unsupervised Domain Adaptation in Fetal Brain MRI Segmentation. In Proceedings of the International Conference on Medical Image Computing and Computer-Assisted Intervention, Vancouver, BC, Canada, 8–12 October 2023; Springer: Cham, Switzerland, 2023; pp. 325–335. [Google Scholar] [CrossRef]
- Munk, A.; Nielsen, M. MDD-UNet: Domain Adaptation for Medical Image Segmentation with Theoretical Guarantees, a Proof of Concept. In Proceedings of the Northern Lights Deep Learning Conference, Tromsø, Norway, 9–11 January 2024; PMLR: New York, NY, USA, 2024; pp. 174–180. [Google Scholar]
- Sarafraz, G.; Behnamnia, A.; Hosseinzadeh, M.; Balapour, A.; Meghrazi, A.; Rabiee, H.R. Domain adaptation and generalization on functional medical images: A systematic survey. arXiv 2022, arXiv:2212.03176. [Google Scholar] [CrossRef]
- Feng, W.; Ju, L.; Wang, L.; Song, K.; Zhao, X.; Ge, Z. Unsupervised domain adaptation for medical image segmentation by selective entropy constraints and adaptive semantic alignment. Proc. AAAI Conf. Artif. Intell. 2023, 37, 623–631. [Google Scholar] [CrossRef]
- Wang, Y.; Cheng, J.; Chen, Y.; Shao, S.; Zhu, L.; Wu, Z.; Zhu, H. FVP: Fourier visual prompting for source-free unsupervised domain adaptation of medical image segmentation. IEEE Trans. Med. Imaging 2023, 42, 3738–3751. [Google Scholar] [CrossRef]
- Shin, H.; Kim, H.; Kim, S.; Jun, Y.; Eo, T.; Hwang, D. SDC-UDA: Volumetric Unsupervised Domain Adaptation Framework for Slice-Direction Continuous Cross-Modality Medical Image Segmentation. In Proceedings of the IEEE/CVF Conference on Computer Vision and Pattern Recognition (CVPR), Vancouver, BC, Canada, 17–24 June 2023; IEEE: New York, NY, USA, 2023; pp. 7412–7421. [Google Scholar] [CrossRef]
- En, Q.; Guo, Y. Unsupervised Domain Adaptation for Medical Image Segmentation with Dynamic Prototype-Based Contrastive Learning. In Proceedings of the Conference Health, Inference, Learning; PMLR: New York, NY, USA, 2024; pp. 312–325. [Google Scholar]
- Guan, H.; Liu, M. DomainATM: Domain adaptation toolbox for medical data analysis. NeuroImage 2023, 268, 119863. [Google Scholar] [CrossRef]
- Li, M.; Wang, J.; Chen, Y.; Tang, Y.; Wu, Z.; Qi, Y.; Tsui, B.M. Low-dose CT image synthesis for domain adaptation imaging using a generative adversarial network with noise encoding transfer learning. IEEE Trans. Med. Imaging 2023, 42, 2616–2630. [Google Scholar] [CrossRef]
- Feng, Y.; Wang, Z.; Xu, X.; Wang, Y.; Fu, H.; Li, S.; Tan, C.H. Contrastive domain adaptation with consistency match for automated pneumonia diagnosis. Med. Image Anal. 2023, 83, 102664. [Google Scholar] [CrossRef]
- Li, S.; Wu, H.; Tang, C.; Chen, D.; Chen, Y.; Mei, L.; Lv, J. Self-supervised domain adaptation with significance-oriented masking for pelvic organ prolapse detection. Pattern Recognit. Lett. 2024, 185, 94–100. [Google Scholar] [CrossRef]
- Zhang, Y.; Wei, Y.; Wu, Q.; Zhao, P.; Niu, S.; Huang, J.; Tan, M. Collaborative unsupervised domain adaptation for medical image diagnosis. IEEE Trans. Image Process. 2020, 29, 7834–7844. [Google Scholar] [CrossRef]
- Xia, Y.; Yang, D.; Yu, Z.; Liu, F.; Cai, J.; Yu, L.; Roth, H. Uncertainty-aware multiview cotraining for semisupervised medical image segmentation and domain adaptation. Med. Image Anal. 2020, 65, 101766. [Google Scholar] [CrossRef]
- Zam, A.; Bohlooli, A.; Jamshidi, K. Unsupervised deep domain adaptation algorithm for video-based human activity recognition via recurrent neural networks. Eng. Appl. Artif. Intell. 2024, 136, 108922. [Google Scholar] [CrossRef]
- Zhu, X. Cross-modal domain adaptation in brain disease diagnosis: Maximum mean discrepancy-based convolutional neural networks. arXiv 2024, arXiv:2405.03235. [Google Scholar] [CrossRef]
- Yang, C.; Guo, X.; Chen, Z.; Yuan, Y. Source free domain adaptation for medical image segmentation with Fourier style mining. Med. Image Anal. 2022, 79, 102457. [Google Scholar] [CrossRef]
- Song, R.; Cao, P.; Wen, G.; Zhao, P.; Huang, Z.; Zhang, X.; Zaiane, O.R. BrainDAS: Structure-aware domain adaptation network for multisite brain network analysis. Med. Image Anal. 2024, 96, 103211. [Google Scholar] [CrossRef] [PubMed]
- Bateson, M.; Kervadec, H.; Dolz, J.; Lombaert, H.; Ayed, I.B. Source-free domain adaptation for image segmentation. Med. Image Anal. 2022, 82, 102617. [Google Scholar] [CrossRef]
- Liu, X.; Yoo, C.; Xing, F.; Oh, H.; El Fakhri, G.; Kang, J.W.; Woo, J. Deep unsupervised domain adaptation: A review of recent advances and perspectives. APSIPA Trans. Signal Inf. Process. 2022, 11, e14. [Google Scholar] [CrossRef]
- He, Y.; Carass, A.; Zuo, L.; Dewey, B.E.; Prince, J.L. Autoencoder-based self-supervised test-time adaptation for medical image analysis. Med. Image Anal. 2021, 72, 102136. [Google Scholar] [CrossRef] [PubMed]
- Yang, H.; Hu, Y.; He, S.; Xu, T.; Yuan, J.; Gu, X. Applying conditional generative adversarial networks for imaging diagnosis. arXiv 2024, arXiv:2408.02074. [Google Scholar] [CrossRef]
- Wu, L.; Lu, M.; Fang, L. Deep covariance alignment for domain-adaptive remote sensing image segmentation. IEEE Trans. Geosci. Remote Sens. 2022, 60, 1–11. [Google Scholar] [CrossRef]
- Shin, Y.; Oh, K.; Suk, H.I. DyMix: Dynamic frequency mixup scheduler-based unsupervised domain adaptation for enhancing Alzheimer’s disease identification. arXiv 2024, arXiv:2410.12827. [Google Scholar] [CrossRef]
- Mueller, S.G.; Weiner, M.W.; Thal, L.J.; Petersen, R.C.; Jack, C.; Jagust, W.; Trojanowski, J.Q.; Toga, A.W.; Beckett, L. The Alzheimer’s Disease Neuroimaging Initiative. Neuroimaging Clin. N. Am. 2005, 15, 869–877. [Google Scholar] [CrossRef]
- Rowe, C.C.; Ellis, K.A.; Rimajova, M.; Bourgeat, P.; Pike, K.E.; Jones, G.; Fripp, J.; Tochon-Danguy, H.; Morandeau, L.; O’Keefe, G.; et al. Amyloid imaging results from the Australian Imaging, Biomarkers and Lifestyle (AIBL) study of aging. Neurobiol. Aging 2010, 31, 1275–1283. [Google Scholar] [CrossRef]
- Selvaraju, R.R.; Cogswell, M.; Das, A.; Vedantam, R.; Parikh, D.; Batra, D. Grad-CAM: Visual Explanations from Deep Networks via gradient-based localization. In Proceedings of the IEEE International Conference on Computer Vision (ICCV), Venice, Italy, 22–29 October 2017; IEEE: New York, NY, USA, 2017; pp. 618–626. [Google Scholar] [CrossRef]
- Prajapati, R.; Kwon, G.R. A binary classifier using a fully connected neural network for Alzheimer’s disease classification. J. Multimed. Inf. Syst. 2022, 9, 21–32. [Google Scholar] [CrossRef]
- Cai, H.; Zhang, Q.; Long, Y. Prototype-guided multiscale domain adaptation for Alzheimer’s disease detection. Comput. Biol. Med. 2023, 154, 106570. [Google Scholar] [CrossRef]
- Oh, K.; Chung, Y.C.; Kim, K.W.; Kim, W.S.; Oh, I.S. Classification and visualization of Alzheimer’s disease using volumetric convolutional neural network and transfer learning. Sci. Rep. 2019, 9, 18150. [Google Scholar] [CrossRef]
- Guan, H.; Liu, Y.; Yang, E.; Yap, P.T.; Shen, D.; Liu, M. Multisite MRI harmonization via attention-guided deep domain adaptation for brain disorder identification. Med. Image Anal. 2021, 71, 102076. [Google Scholar] [CrossRef]
- Shin, Y.; Maeng, J.; Oh, K.; Suk, H.I. Frequency Mixup Manipulation-Based Unsupervised Domain Adaptation for Brain Disease Identification. In Proceedings of the Asian Conference Pattern Recognition, Kitakyushu, Japan, 5–8 November; Springer: Cham, Switzerland, 2023; pp. 123–135. [Google Scholar] [CrossRef]
- Ganin, Y.; Ustinova, E.; Ajakan, H.; Germain, P.; Larochelle, H.; Laviolette, F.; Lempitsky, V. Domain-adversarial training of neural networks. J. Mach. Learn. Res. 2016, 17, 2096–2130. [Google Scholar]
- Tzeng, E.; Hoffman, J.; Saenko, K.; Darrell, T. Adversarial Discriminative Domain Adaptation. In Proceedings of the IEEE Conference on Computer Vision and Pattern Recognition (CVPR), Honolulu, HI, USA, 21–26 July 2017; IEEE: New York, NY, USA, 2017; pp. 7167–7176. [Google Scholar] [CrossRef]
- Chen, C.; Dou, Q.; Chen, H.; Qin, J.; Heng, P.A. Synergistic image and feature adaptation: Toward cross-modality domain adaptation for medical image segmentation. Proc. AAAI Conf. Artif. Intell. 2019, 33, 865–872. [Google Scholar] [CrossRef]
- Goodfellow, I.; Pouget-Abadie, J.; Mirza, M.; Xu, B.; Warde-Farley, D.; Ozair, S.; Bengio, Y. Generative adversarial nets. Adv. Neural Inf. Process. Syst. 2014, 27, 2672–2680. [Google Scholar]
- Armanious, K.; Jiang, C.; Fischer, M.; Küstner, T.; Hepp, T.; Nikolaou, K.; Yang, B. MedGAN: Medical image translation using GANs. Comput. Med. Imaging Graph. 2020, 79, 101684. [Google Scholar] [CrossRef]
- Wang, M.; Deng, W. Deep visual domain adaptation: A survey. Neurocomputing 2021, 438, 219–234. [Google Scholar] [CrossRef]
- Gretton, A.; Borgwardt, K.M.; Rasch, M.J.; Schölkopf, B.; Smola, A. A kernel two-sample test. J. Mach. Learn. Res. 2012, 13, 723–773. [Google Scholar]
- Sun, B.; Saenko, K. Deep CORAL: Correlation Alignment for Deep Domain Adaptation. In Proceedings of the European Conference on Computer Vision, Amsterdam, The Netherlands, 8–16 October 2016; Springer: Cham, Switzerland, 2016; pp. 443–450. [Google Scholar] [CrossRef]
- Frisoni, G.B.; Fox, N.C.; Jack, C.R., Jr.; Scheltens, P.; Thompson, P.M. The clinical use of structural MRI in Alzheimer disease. Nat. Rev. Neurol. 2010, 6, 67–77. [Google Scholar] [CrossRef]
- Farahani, F.V.; Karwowski, W.; Lighthall, N.R. Application of artificial intelligence in neurodegenerative disease diagnosis: A systematic review. Front. Neurol. 2019, 10, 1003. [Google Scholar] [CrossRef]
- Muksimova, S.; Umirzakova, S.; Iskhakova, N.; Khaitov, A.; Cho, Y.I. Advanced convolutional neural network with attention mechanism for Alzheimer’s disease classification using MRI. Comput. Biol. Med. 2025, 190, 110095. [Google Scholar] [CrossRef] [PubMed]
- Gryshchuk, V.; Singh, D.; Teipel, S.; Dyrba, M.; ADNI, AIBL, FTLDNI Study Groups. Contrastive self-supervised learning for neurodegenerative disorder classification. Front. Neuroinform. 2025, 19, 1527582. [Google Scholar] [CrossRef] [PubMed]
- Abdelaziz, M.; Wang, T.; Anwaar, W.; Elazab, A. Multi-scale multimodal deep learning framework for Alzheimer’s disease diagnosis. Comput. Biol. Med. 2025, 184, 109438. [Google Scholar] [CrossRef] [PubMed]
- Long, M.; Cao, Z.; Wang, J.; Jordan, M.I. Conditional adversarial domain adaptation. Adv. Neural Inf. Process. Syst. 2018, 31, 1640–1650. [Google Scholar]
Disclaimer/Publisher’s Note: The statements, opinions and data contained in all publications are solely those of the individual author(s) and contributor(s) and not of MDPI and/or the editor(s). MDPI and/or the editor(s) disclaim responsibility for any injury to people or property resulting from any ideas, methods, instructions or products referred to in the content. |
© 2025 by the authors. Licensee MDPI, Basel, Switzerland. This article is an open access article distributed under the terms and conditions of the Creative Commons Attribution (CC BY) license (https://creativecommons.org/licenses/by/4.0/).