Abstract
A surge in global connectivity has led to an increase in cyberattacks, creating a need for improved security. A promising area of research is using machine learning to detect these attacks. Traditional two-class machine learning models can be ineffective for real-time detection, as attacks often represent a minority of traffic (anomaly) and fluctuate with time. This comparative study uses an ensemble of one-class classification models. First, we employed an ensemble of autoencoders with randomly generated architectures to enhance the dynamic detection of attacks, enabling each model to learn distinct aspects of the data distribution. The term ‘dynamic’ reflects the ensemble’s superior responsiveness to different attack rates without the need for retraining, offering enhanced performance compared to a static average of individual models, which we refer to as the baseline approach. Second, for comparison with the ensemble of autoencoders, we employ an ensemble of isolation forests, which also improves dynamic attack detection. We evaluated our ensemble models using the NSL-KDD dataset, testing them without the need for retraining with varying attack ratios, and comparing the results with the baseline method. Then, we investigated the impact of training data overlap among ensemble components and its effect on the detection of extremely low attack rates. The objective is to train each model within the ensemble with the minimal amount of data necessary to detect malicious traffic across varying attack rates effectively. Based on the conclusions drawn from our initial study using the NSL-KDD dataset, we re-evaluated our strategy with a modern dataset, CIC_IoT-2023, which also achieved good performance in detecting various attack rates using an ensemble of simple autoencoder models. Finally, we have observed that when distributing normal traffic data among ensemble components with a small overlap, the results show enhanced overall performance.
1. Introduction
The evolution of the Internet in recent years has altered the study and developed research to examine the exposure of networks and observe advanced security threats. For example, by one estimation, it is predicted that in 2025, the cost of cybercrime will be USD 10.5 trillion []. Moreover, the need for a network intrusion detection system (NIDS) that can adapt to changes in network traffic over time is crucial for two reasons. Firstly, the evolving threat requires a dynamic approach that adapts to network security breaches. Secondly, zero-day attacks highlight the need for an adaptive NIDS that uses dynamic network traffic analysis to identify suspicious patterns without relying only on signatures, such as detecting abnormal traffic spikes or unexpected protocol usage. The use of communication systems is increasing rapidly, and due to this, we have a tremendous amount of network traffic that makes it hard for human eyes to detect attack patterns. Broadly speaking, network traffic can be divided into two categories: normal and malicious. Attacks often constitute only a small fraction of network traffic in the real world, so they can be considered anomalies.
In a real-world network, traffic attacks fluctuate over time, but they usually represent a minority of the traffic flow and change their representation over time. Machine learning algorithms that use two-class classification to predict attacks depend on predefined labels of normal and attack categories. This makes it difficult for these algorithms to adapt to evolving threats and handle imbalanced data, making them less effective for real-time detection. Additionally, the machine learning-based detection system is significantly impacted by highly imbalanced classes [], making it unreliable for detecting dynamically changing attack ratios in real-world scenarios. Due to the variability in the attack ratios, an interesting approach that can be used is a one-class classification (OCC) model trained with only normal instances. Many techniques of OCC can be used to tackle the problem. This article uses two of the most widely used OCC models in the literature: Autoencoders (AEs) and Isolation Forests (IFs), which use only normal instances in the learning process. However, a single AE or IF might not perform well for all the normal traffic flow variations that exist within the data distribution being used. For that reason, we used an ensemble of multiple AEs or IFs to address these limitations, leveraging diversity among the models. Each model within the ensemble of AEs or IFs captures different facets of the data distribution, resulting in a more robust and reliable detection system [,]. To evaluate our anomaly detection ensemble (ADE), built with AEs or IFs, we used the baseline method by taking the prediction of each anomaly estimator individually to see if the proposed ensemble model was working. We took the predictions of each anomaly estimator individually and then took the average of all predictions. As we mentioned before, attack distributions are not static but they fluctuate over time, so we used ADEs to adapt to changes in attack flow. To test its performance in this context, we create different validation datasets with different anomaly balances using the NSL-KDD and CIC_IoT-2023 datasets and analyze how the amount of information provided to the ADE influences its predictions. In comparing AEs and IFs within the ensemble framework, the results indicate that the two ensemble methods consistently outperformed the baseline across all simulations, particularly in detecting severe anomalies. For the NSL-KDD dataset, both the AEs ensemble and the IFs ensemble achieved comparable performance in cyberattack detection. However, the IF-based ensemble reached peak performance more quickly, requiring less training data. This efficiency allowed it to better leverage the diversity of the training datasets used in the ensemble. Finally, we have observed that a smaller degree of overlap between the training data among the individual anomaly estimators in the ensemble increases diversity, which often results in enhanced overall performance.
We want to highlight the main contributions of our paper to the literature in this field. First, we present a dynamic anomaly detection ensemble composed of two distinct models: AEs and IFs. We refer to it as dynamic because the ensemble of models responds more effectively to the evaluation of different attack ratios than a simple average of models (the baseline approach). This design enables the system to remain robust under varying attack rates and mitigates the uncertainty that arises when models trained on a fixed attack rate are evaluated under rates different from the training rates []. Using these two ensemble models (AE and IF), we conduct an in-depth study and analysis of the real-world challenge posed by dynamically changing attack rates in network traffic, and we show that this issue can be effectively addressed without the need for system retraining. To clarify, the novelty of our approach does not lie in the use of AEs or IFs per se, but in the strategic ensemble design, the exclusive training on normal traffic, and the evaluation under extreme imbalance conditions, which are rarely addressed in existing literature. This point explicitly reflects the contributions of our work, as well as its methodological benefits. Second, we investigate the impact of overlapping training data among the ensemble components and how this affects the detection of extremely low attack rates, as low as 0.5%, relative to benign traffic. This analysis is conducted for both ensemble types: AEs and IFs. Finally, we examine the minimum number of records required to train each ensemble component, aiming to achieve optimal performance with minimal data and training time. We begin our study with the renowned NSL-KDD dataset. To further generalize our proposal, we then extend the evaluation of the methodology and the findings obtained using the more recent dataset CIC_IoT-2023.
The rest of the article is organized as follows. Section 2 reviews research work related to using AEs and IFs for anomaly detection in cybersecurity. In Section 3 we analyze the datasets and describe the experimental methodology, including the data preprocessing, the model description, and the evaluation metrics. Section 4 presents the results. Finally, in Section 5 we discuss the results and draw some conclusions and future work. Additional details on the ensemble algorithms and performance evaluations used in our study are provided in Appendix A.
2. Related Work
Over recent years, cybersecurity threats have increased significantly, leading many researchers to investigate detecting attacks in network traffic using different machine learning techniques, such as neural networks [,,,], ensemble models [], and soft voting techniques []. The effect of changing the attack ratio on the performance of machine learning algorithms has also been studied [].
Many studies have investigated the use of the AE in detecting attacks, such as the study carried out by Singha et al. []. A model based on a unified AE to find spatial features was proposed, and a Multiscale Convolutional Neural Network AE (MSCNN-AE) was used to find the temporal pattern using Long Short-Term Memory (LSTM). Then, a two-stage IF was used for anomaly detection. To test their model, they used different datasets, NSL-KDD, UNSW-NB15, and CIC-DDoS2019, and achieved good results. However, the complexity of using two models of one class classification to detect attacks is high, not making this proposal very suitable for real-time attack detection.
The technique of eliminating features and reducing the dimensionality to detect attacks using neural networks was proposed by Chen et al. []. The proposed method used two types of AEs. The first type applies a normal fully connected AE to capture the non-linear correlation between features. The second approach is applying a Convolutional AE (CAE) to reduce the dimensionality. The NSL-KDD dataset was used to evaluate the method, and the CAE outperformed other detection methods. However, the complexity of the suggested work is high. Our research used a simple method using all features and random AE architecture to create the ensemble of AEs, which makes it less complex and we think it is more appropriate for a real-time attack detection system.
Using the technique of eliminating features, Tang et al. [] proposed a model called SAAE-DNN. The stacked AE (SAE) extracts the features and predicts the potential layers for the DNN. The model was evaluated using binary and multi-class classification methods on the NSL-KDD dataset. SAAE-DNN achieves better results than other machine learning algorithms, such as random forests and decision trees. Although their proposed technique may work, they did not analyze the dynamic change of attack ratios over time.
Another approach is to eliminate outlier samples that could affect the basis of the AE training. This was performed by Xu et al. [] based on an extensive investigation of an AE model with five hidden layers. To evaluate the proposed model, the NSL-KDD dataset was used, which achieved good results in accuracy and F1 score. Eliminating outlier samples may improve the results, but removing patterns is not ideal in datasets like the NSL-KDD dataset, where training patterns are limited. Another approach used in this paper is a soft voting technique using an ensemble. An example of a soft voting technique was proposed by Khan et al. [], the model called OE-IDS. They used resampling methods to handle unbalanced classes, such as SMOTE, ROS, and ADASYN. The proposed method used soft voting based on different optimal sets of four algorithms: gradient boosting, RF, extra tree, and MLP. The proposed technique was tested using the UNSW-NB 15 and CICIDS-2017 datasets. While they used a soft voting technique similar to this research, they did not directly analyze the effect of this methodology on the different ratios of attack patterns versus normal traffic patterns.
Another one-class classification technique commonly used in research is the IF. Elsaid et al. [] introduce an optimized IF-based Intrusion Detection System (OIFIDS) designed to handle heterogeneous and streaming data in Industrial Internet of Things (IIoT) networks. The system optimizes the Isolation Forest algorithm using an Enhanced Harris Hawks Optimization (ERHHO) technique to reduce dataset dimensionality and improve detection performance. Evaluated on three datasets (CICIDS-2018, NSL-KDD, and UNSW-NB15), OIFIDS demonstrates superior performance compared to state-of-the-art baseline techniques, achieving higher accuracy. The proposed system effectively addresses the concept drift problem in streaming data, achieving high AUC values. AbuAlghanam et al. [] proposed a fusion-based anomaly detection system using a modified isolation forest (M-IF) for Internet of Things (IoT) network intrusion detection. The proposed system comprises two parallel subsystems, one trained on normal data and the other on attack data, utilizing a modified version of the IF classifier to enhance classification performance and reduce runtime. The system was evaluated using three benchmark datasets (UNSW-NB15, NSL-KDD, and KDDCUP99). Results showed that the proposed approach outperformed other NIDS techniques while reducing the runtime of the training model by 28.80%. The M-IF demonstrated superior performance compared to traditional IF, One-Class SVM, and Local Outlier Factors across all datasets.
Nalini et al. [] proposed a hybrid approach called Hybrid Density-Based IF with Coati Optimization (HDBIF-CO) for effective anomaly detection in cybersecurity systems. Their method combines density-based clustering (DBSCAN) with an IF algorithm optimized using the Coati Optimization technique. The approach was tested on three datasets: NSL-KDD, CICIDS2017, and UNSW-NB15. The HDBIF-CO method comprises several key stages: data collection, preprocessing (including normalization and outlier elimination), feature selection, cluster discovery using DBSCAN, anomaly detection using the HDBIF-CO algorithm, and a final decision-making phase.
A combination of both algorithms, AE and IF, was proposed by Carrera et al. [] and evaluated three novel unsupervised approaches for near real-time network traffic anomaly detection: Deep Autoencoding with GMM and IF (DAGMM-EIF), Deep AE with Isolation Forest (DA-EIF), and Memory Augmented Deep AE with IF (MemAE-EIF). These approaches combine deep learning techniques with the Extended IF algorithm to enhance anomaly detection accuracy while maintaining fast prediction speeds. The proposed methods achieved comparable or superior performance to state-of-the-art unsupervised anomaly detection algorithms on the KDD99, NSL-KDD, and CIC-IDS2017 datasets, with MemAE-EIF obtaining the highest precision and F1-score across all datasets. The addition of IF improved accuracy with only a minimal increase in inference time. SHAP analysis demonstrated that the new features introduced by the combined approaches were influential in improving anomaly detection. While the studies [,,,] propose models that demonstrate high performance metrics, they do not explicitly analyze the effect of varying attack ratios, particularly low ratios, on the model’s performance. There have been numerous investigations on the use of AE and IF in anomaly detection as an ensemble. Studies [,] conducted a comparison between the ensembles of AE and IF, finding that the ensembles of AE performed better. In [], a model was proposed utilizing a k-partitioned IF ensemble for detecting stock market manipulation. To detect anomalies in the web, the authors in [] proposed an IF with reduced execution time, enabling administrators to respond quickly to attacks. The investigation [] analyzes the effect of contaminations of IF on a highly unbalanced dataset (CERT r4.2) and found that it plays a crucial part in the performance of IF. However, none of the previous studies explicitly analyzed the effect of overlap or the different ratios of anomalies on their suggested approaches.
An exception is the work in [], which analyzed the effect of various ratios on two traditional machine learning techniques: random forest and support vector machines. The study was applied to two datasets, the UNSW-NB15 and CICIDS-2017 datasets. The investigation found that the detection of attacks on both algorithms is affected by ratio fluctuations in different ways, and the random forest is more robust in detecting attacks, even when the ratio of attacks is severe. This work aligns with the necessity to explore attack detection methodologies that adapt to the evolving nature of these attacks over time, an important topic we examine in this seminal communication.
3. Materials and Methods
In this section, we describe the preprocessing of the NSL-KDD and CIC_IoT-2023 datasets, the methodology used to build individual AE and IF models with the preprocessed data, and finally, how these models are integrated into the ensemble approach.
3.1. Dataset Analysis, Preprocessing and Performance Metrics
This section provides an overview of the datasets used (NSL-KDD and CIC_IoT-2023), highlighting their relevance for evaluating intrusion detection systems in both traditional and IoT contexts. We describe the preprocessing steps applied, including normalization and dataset partitioning strategies, with special attention to how attack ratios were simulated. Finally, we present the performance metrics used to assess the models, focusing on PR-AUC as the primary metric due to the imbalanced nature of the data, and including ROC-AUC as a complementary evaluation metric.
3.1.1. NSL-KDD Dataset
The NSL-KDD dataset [] was created by selecting the complete records from the KDD Cup’99 dataset [] to avoid some issues of missing values. The NSL-KDD dataset is divided into two subsets, one for training and one for testing. The training data consist of 67,342 normal instances, and 58,630 attack patterns of different types such as neptune, satan, ipsweep, portsweep, smurf, nmap, back, teardrop, warezclient, and pod. The testing part contains 9711 normal instances and 12,832 attack patterns. The NSL-KDD dataset contains 41 features divided into three categories: basic features, traffic features, and content features. It must be noted that the official training and testing subsets of the NSL-KDD dataset have a fixed ratio of attacks, representing approximately 46.55% and 57%, respectively. This makes it difficult to use them directly in this study. As we want to evaluate how our models behave with different ratios of benign and malignant traffic, we have merged both training and testing files (see column data aggregation in Table 1) to serve our intent to create sub-datasets that contain different attack ratios on the network traffic: 0.5%, 1%, 12.5%, 25%, and 50%. The new training file contains 51,546 normal instances, which is around two-thirds of normal instances in the column data aggregation of Table 1. We trained the base models (AEs and IFs) using random samples from this training file. The new test file contains 25,507 normal instances and 23,503 attack patterns. Using this test file, we created 20 random subsets for each anomaly percentage, each one with 10,000 patterns. Table 1 lists the number of records of the new NSL-KDD dataset used for the test part. For example, for 1% of attacks, 9900 random normal instances and 100 random attack patterns are used for each test subset. This process was repeated for each attack percentage value, as shown in Table 1. With respect to feature preprocessing and to ensure consistent feature scaling, min-max normalization was applied to each attribute using the training dataset statistics.

Table 1.
The NSL-KDD preprocessing: official and new datasets and new attacks.
3.1.2. CIC_IoT-2023 Dataset
The CIC_IoT-2023 dataset [] is one of the most modern and most extensive datasets for network traffic created by the Canadian Institute for Cybersecurity. The CIC_IoT-2023 dataset contains data from 105 IoT devices and documents 33 recorded attacks. These attacks were launched by malicious IoT devices targeting other IoT devices. In addition, CIC_IoT-2023 contains multiple attack types. To follow a similar procedure as above and maintain consistency across the two datasets, we created the same data partitions as for the NSL-KDD problem. Normal traffic instances were collected from the file BenignTraffic.pcap.csv, while attack patterns were extracted from the file Merged01.csv. Due to the random selection of records, only the 16 most representative attack types are finally used in the test partitions. As before, min-max normalization was applied to ensure consistent feature scaling using the training dataset statistics.
3.1.3. Min-Max Normalization
Min-Max normalization is one of the most common scaling techniques in data preprocessing. This method normalizes the value of each feature to a fixed range between zero and one. It is calculated as shown in the following equation:
To prevent data leakage when applying min–max normalization, the normalization parameters were obtained using the training dataset. These parameters were applied to the test set without including any information from it during the scaling process. This procedure ensures that no information from the test set leaks into the training phase, thus preventing any bias in the model evaluation.
3.1.4. Performance Metrics
Evaluating the performance of a machine learning algorithm is a necessary step to confirm its operational correctness and efficacy. Consequently, selecting appropriate assessment metrics is critical for the development of an optimal classifier, particularly for tasks such as the identification of attacks. For the purpose of this evaluation, we first distinguish the cases of interest; attacks are designated as positive instances, and all other cases, such as normal network flows, are designated as negative instances. The outcomes of a classification experiment can be summarized in a two-by-two contingency table (as shown in Table 2). Given this contingency table, the following quantities can be defined:

Table 2.
Contingency table for a two-class classification problem.
- True Positives (TP): The number of attack instances (positive) that are correctly classified as attacks.
- True Negatives (TN): The number of normal flow instances (negative) that are correctly classified as normal flows.
- False Positives (FP): The number of normal flow instances (negative) that are incorrectly classified as attacks.
- False Negatives (FN): The number of attack instances (positive) that are incorrectly classified as normal flows.
Based on these quantities, the following key performance metrics are calculated to characterize and rigorously evaluate the classifier’s performance:
- Recall (Sensitivity or True Positive Rate—TPR): Recall measures the classifier’s ability to find all the positive instances. It represents the proportion of actual positive cases that were correctly identified:
- Precision (Positive Predictive Value—PPV): Precision measures the quality of a positive prediction. It represents the proportion of positive predictions that were actually correct:
- False Positive Rate (FPR): FPR measures the proportion of negative instances that were incorrectly classified as positive. It indicates the rate of false alarms:
The metrics Recall, Precision, and FPR are essential for evaluating a single operating point (threshold) of a classifier. However, the performance often depends heavily on the chosen decision threshold. To comprehensively assess a classifier’s performance across all possible thresholds, specialized graphical tools are employed: the Receiver Operating Characteristic (ROC) curve and the Precision–Recall (PR) curve. The ROC curve plots the True Positive Rate (or Recall) against the False Positive Rate (FPR) at various threshold settings. It illustrates the trade-off between the benefits (correctly identified positive cases) and the costs (false alarms) as the decision threshold is varied. The PR curve plots Precision against Recall (TPR) at various threshold settings. It is particularly informative for classification problems with imbalanced datasets, where the number of negative instances significantly outweighs the positive instances (a common scenario in attack detection).
The overall performance of the classifier is usually summarized by the Area Under the Curve (AUC). A higher value (closer to 1) indicates a better-performing model, as it signifies a higher TPR for a given FPR. Similarly, models with higher values demonstrate better performance in achieving high Precision without sacrificing Recall. The choice between the ROC and PR curves for reporting overall performance is often dictated by the class distribution; while ROC curves are generally preferred for balanced datasets, PR curves provide a more insightful and representative view for highly imbalanced problems, such as the one under consideration [].
3.2. Autoencoder as Anomaly Detector
As we have previously commented, an automatic attack detection system that adapts to the existing normal and attack traffic balances is needed. Therefore, it would be very convenient to use a system that can be trained using only normal traffic. As a first approach, we used an AE as one of the most common methods. An AE consists of an encoder, a latent space, and a decoder. It is represented as , where X is the input data, Z represents the latent space, and represents the output data. An AE is usually trained to minimize the mean squared error (MSE) between its input and its output [,,]:
where N represents the number of samples, represents the vector of features for sample i, and represents the predicted value.
3.3. Simple Average of Autoencoders: Baseline Approach
This paper uses the AE as a baseline since network traffic attack ratios change over time. Using normal traffic, we have created 150 AEs (an empirical justification of this number is given at the beginning of the Results Section 4) with different architectures containing three layers: input, one latent space (bottleneck), and output. The input and output layers are equal to the number of features ( features for the NSL-KDD dataset, features for the CIC_IoT-2023 dataset). On the other hand, the bottleneck layer size is randomly chosen between 2 and . Individual AEs might develop specific predilections based on their training data or initial structure. As we mentioned before, we have approximately 51,000 normal traffic records (see Table 1) in the new training set. We select a random sample from the training data to train each AE, whose bottleneck dimension is also randomly chosen. We consider sample sizes in the range from 100 to 15,000, and train the AEs for each sample size. This variation in both architecture and data exposure contributes to the uniqueness of each AE, even when some share equal structural parameters, as each model is trained on a different random subset of the normal traffic data. It is important to note that, since we only have around 51,000 patterns to distribute during training among the AEs, when the training set size of each AE exceeds 340 samples, patterns start to repeat among the different AEs in the training process. This leads to a reduction in diversity regarding what each AE learns. Once the AEs are trained, we combine their individual predictions, which we call the baseline method. The following equation explains the calculation of the reconstruction errors (REs):
where index k iterates over each AE, from 1 to NA, where NA denotes the number of autoencoders that form the ensemble. In our final experiments, we use NA = 150, and an empirical justification for this choice is provided at the beginning of the Section 4. Index i runs over each pattern, and index j runs over the dimensions of the pattern (from 1 to D). Once the reconstruction errors have been evaluated on a test set t, they are used to rank the data points. Subsequently, this ranking is utilized to apply thresholds as part of the standard procedure for computing the Precision–Recall curve and its corresponding area under the curve () for each Autoencoder k (see Section 3.1.4). To calculate the performance of the baseline approach for a test set t, we simply average over all the AEs, as we can see in the following equation:
Figure 1 summarizes the steps we took to calculate the results of .
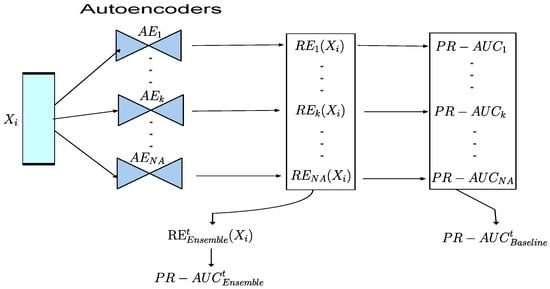
Figure 1.
Architecture of the ensemble and baseline models for the autoencoders, where NA denotes the number of autoencoders that form the ensemble.
As we mentioned above, we created 20 sub-datasets for testing in the dataset preprocessing for each ratio of attacks. Then, we took the average of the 20 tests for each attack ratio to ensure the reliability and stability of the results, reducing the impact of randomness or variability in individual runs. The following equation shows the calculation of the final results of :
The same procedure, but using ROC curves instead of PR curves, is applied when calculating the metric for the baseline approach.
3.4. Combination of Autoencoder Predictions: Ensemble Approach
To promote structural diversity within the ensemble and evaluate its impact on detection performance, we generated autoencoder architectures by randomly varying the number of bottleneck (BN) units while keeping the overall layer structure fixed. As we commented above in the Section 3.3, the number of BN units was sampled uniformly within a bounded range, specifically from 2 to , where D is the input dimension of the autoencoder. This controlled variation ensures meaningful architectural differences without compromising comparability. To reduce the influence of any particular configuration and avoid bias, multiple experimental runs were performed using different combinations of BN sizes, and the results were averaged. On the other hand, the system evaluation using individual AEs might not adapt effectively to all variations in the data distribution. It could overfit certain patterns or struggle to grasp the complete complexity of the problem. To avoid that, we combine the individual predictions of the AEs into an ensemble voting system. Therefore, the ensemble of AEs will tend to reduce the variability of the results. In this work, we used the ensemble of the same 150 random AEs of the baseline approach. Remember that each AE was trained with certain data variability (depending on the dataset training size) and has a different random architecture. Therefore, in the ensemble approach, we calculate the RE for each AE on a test dataset and average these values using a soft voting procedure among the AEs:
where index t runs over all possible test files (from 1 to 20) and represents the number of AEs. The ensemble reconstruction error is then used to rank the data points and compute the PR curve. The corresponding area under the curve for test partition t, , is used to assess the quality of the ensemble by averaging over the 20 datasets (Figure 1 and Algorithm A1 summarize this process):
The same procedure, but using ROC curves instead of PR curves, is applied when calculating the metric for the ensemble approach.
3.5. Isolation Forest as Anomaly Detector
As stated earlier, an effective attack detection system should operate without requiring labeled attack data and adapt to evolving traffic conditions. To meet this requirement, in our second approach we used IFs, a widely used anomaly detection technique that can be trained with only normal traffic. An IF is based on the principle that anomalies are data points that are few in number and distinct. It works by isolating observations through random partitioning. The process constructs multiple binary trees (isolation trees), where anomalous points tend to be isolated in fewer splits than normal points. Each data point is assigned an anomaly score (AS) based on the average path length from the root node to a leaf across all trees in the forest.
3.6. Simple Average of Isolation Forests: Baseline Approach
In this paper, we also used IF as a baseline since the ratio of network attacks to normal traffic can vary over time. Using only normal traffic, we constructed 150 IFs with 100 estimators each. Within an IF, each isolation tree is built using a random subsample of the training data, with sample sizes ranging from 10 to 15,000 records. We trained 150 IF models for each sample size. Once the IFs are trained, each model outputs an AS for every input pattern. Then, the ASs are used to calculate the area under the precision–recall curve for each IF k and, as before, the values are averaged over the IFs to obtain the final result:
Finally, is calculated as an average over the 20 test datasets as described in Equation (8). Equivalent calculations are used to obtain the measure.
3.7. Combination of IF Predictions: Ensemble Approach
As we mentioned above, the system evaluation using an individual (IF) model might not adapt effectively to all variations in the data distribution. Furthermore, a single model could become biased toward specific patterns or fail to capture the broader complexity of the underlying problem. To address this limitation, we combine the predictions of multiple IF models into an ensemble-based voting system. Consequently, the ensemble of IFs helps to reduce the variability and improve the robustness of the detection results. In this work, we used the same 150 random IF models as in the baseline approach. Each IF model was trained on data with different variability (depending on the training set size). In the ensemble approach, we compute the AS for each IF model on the test dataset and aggregate these scores using a soft voting mechanism across the ensemble:
where index t runs over all possible test files (from 1 to 20) and represents the number of IFs. We then use the ensemble AS to calculate the , for test t, and average over test sets to obtain as in Equation (10). Figure 2 and Algorithm A2 show a schematic representation of both the baseline and the ensemble approaches. An equivalent procedure is used to obtain the measure.
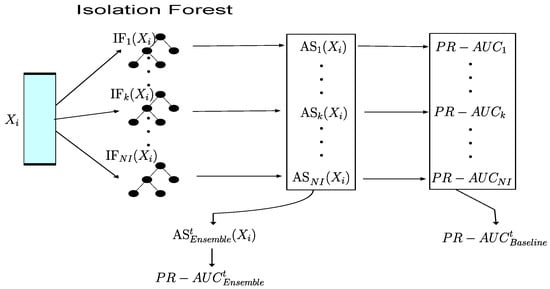
Figure 2.
Architecture of the ensemble and baseline models for the isolation forests, where NI denotes the number of IFs that form the ensemble.
4. Results
The first analysis we conduct using the NSL-KDD dataset is to examine the optimal number of components in an ensemble system designed to effectively detect different rates of malicious traffic, given a set of normal traffic records for training. Our goal is to keep the training of each model as simple as possible in terms of the number of patterns required.
Figure 3 shows the results across different attack rates for varying ensemble sizes. Table 3 details how the 51,546 normal traffic records were distributed among the autoencoders (AEs). Each AE receives slightly more than the total number of normal instances divided by the number of models in the ensemble. Based on these results, we selected an ensemble of 150 AEs, as it provides robust performance even under very low attack ratios. This configuration also ensures that each AE is trained on approximately 400 normal samples, maintaining a manageable computational load per model. This setup further allows us to investigate how the number of training samples per AE affects overall system performance. When each AE is trained on 400 or fewer samples, the overlap between training subsets remains minimal, which promotes diversity among models. However, as the number of samples per AE increases beyond 400, the overlap grows significantly, potentially reducing diversity and impacting detection effectiveness. Therefore, by fixing the number of models and varying the number of training samples per component, we indirectly assess how training data overlap influences the ensemble’s ability to detect anomalies.
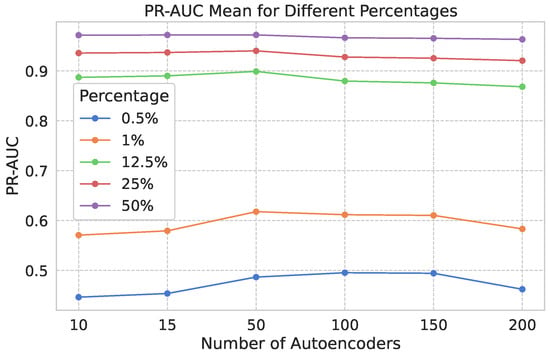
Figure 3.
results for different numbers of AEs and various ratios of benign and malignant traffic. The number of records for each number of autoencoders is listed in Table 3.

Table 3.
Number of NSL-KDD records used to train each autoencoder based on the number of autoencoders in the ensemble.
As we commented above, our primary goal is to detect attacks in conditions that closely resemble real-time network traffic. This analysis examines the impact of the number of training patterns on the ensemble of AEs and IFs across different anomaly ratios. Panels A and B of Figure 4 and Figure 5 display the results of the ensemble and baseline approaches, respectively, explained in Section 3 for AE (Figure 4) and IF (Figure 5), with the NSL-KDD dataset. These figures illustrate results for various dataset sizes used to train 150 AEs and 150 IFs, with each point representing the average of 20 tests with different percentages of attacks. The training data for the AEs ranges from 100 to 15,000 benign traffic patterns, and the training data for the IFs ranges from 10 to 15,000 benign traffic patterns. One can observe that when the percentage of attacks is very low (0.5% and 1%), both the baseline and ensemble methods struggle to detect these rare attacks, especially with smaller training dataset sizes. However, our ensemble model approach proves more reliable in these situations, showing steady improvement as the training size increases up to 1000 data points. Conversely, when attack ratios are higher, such as 25% or 50%, both models perform consistently well, even with smaller training datasets, as these more frequent attacks are easier to detect. It should be noted that a performance saturation is observed between 300 and 500 training patterns for the AE approach (see zoom in Figure 4), and even earlier for the IFs (Figure 5), which is precisely when the variability of the data seen by each AE decreases, as we already discussed in Section 3.3. The performance of both models declines when the training set exceeds 1000 records, particularly for the AE ensemble and in cases with a low percentage of attacks. This may be due to a limited number of truly distinct training samples and the presence of overlapping data, which becomes more problematic in imbalanced scenarios where attack instances are already scarce. These findings underscore not only the robustness of the ensemble approach but also how sensitive model performance is to data overlap when detecting imbalanced attack distributions.
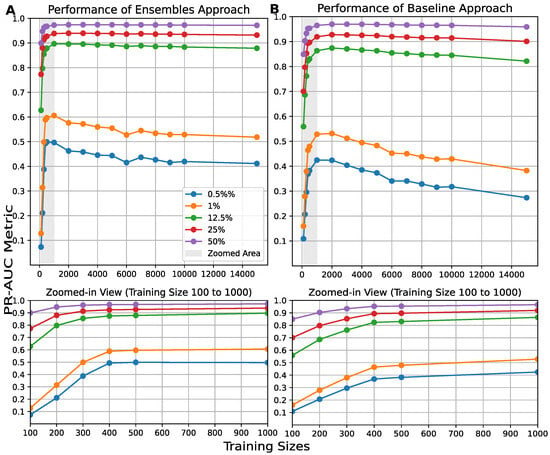
Figure 4.
results of 150 AEs for (A) the ensemble and (B) the baseline approaches with different training sizes ranging from 100 to 15,000, and for different ratios of benign and malignant traffic for the NSL-KDD dataset.
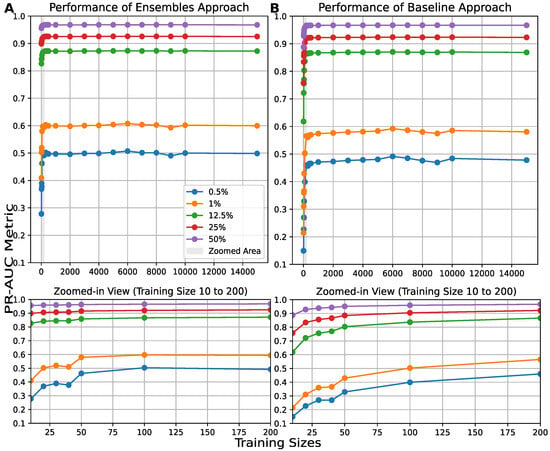
Figure 5.
results of 150 IFs for (A) the ensemble and (B) the baseline approaches with different training sizes ranging from 10 to 15,000, and for different ratios of benign and malignant traffic for the NSL-KDD dataset.
It is important to note that the ensemble approaches consistently outperform the baseline approaches, although the improvement is smaller when dealing with larger training sizes and ratios of attacks. These findings indicate that the ensembles provide a stronger and more flexible solution for identifying anomalies in networks where attack patterns constantly change, especially when the attack ratios are severely imbalanced. Finally, results were also obtained and are provided in Appendix A.2. Although these results confirm our previous observations, the differences between balanced and imbalanced datasets are less pronounced. This suggests that the ROC analysis has difficulty assessing performance in highly imbalanced datasets.
To provide a deeper comparison between ADEs (of AEs and IFs) and the baseline methods, panels (A–C) in Figure 6 illustrate their performance in detecting malicious traffic across three representative sizes of training datasets (200, 400 and 1000) and several attack ratios (0.5%, 1%, 12.5%, 25%, and 50%). We selected these three representative training sizes based on the results in Figure 4 and Figure 5.
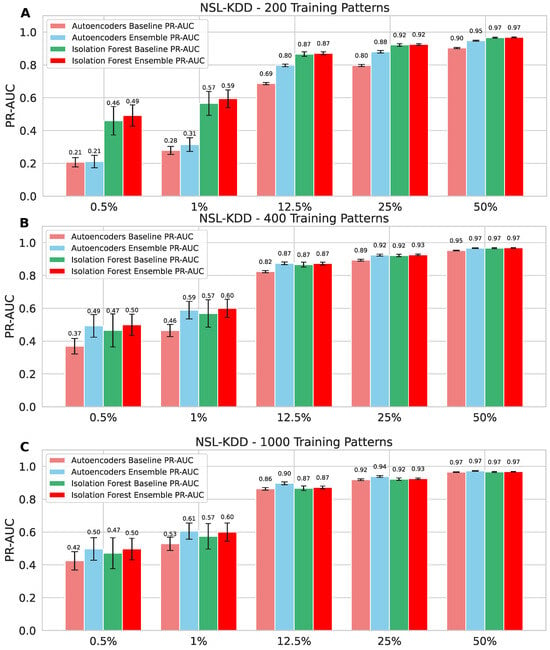
Figure 6.
NSL-KDD dataset comparison of various benign and malignant traffic ratios for the ensemble and baseline models using three different training sizes: (A) 200 patterns; (B) 400 patterns; and (C) 1000 patterns.
Panel A presents the best results for the IF ensemble when the training data size is very small (see Figure 5A). We can observe that the panel indicates that the IF ensemble outperformed the AE ensemble in terms of results under an unbalanced representation of attacks in network traffic. IF-based ensembles are known to achieve optimal performance with fewer training records [], as observed in our experiments. Conversely, when the attack representation was balanced at 50%, the results for both ensembles of AEs and IFs showed minimal differences. In contrast, AE-based ensembles required more training data to achieve comparable performance. Therefore, panel B presents the results based on the distribution of normal traffic records among the individual components of the ensembles, implying that each model was trained on a dataset with little overlap. At this stage, the ensembles reach a point where the stabilizes (see Figure 4A). This panel emphasizes that when each model within the AE ensembles is trained with an adequate amount of data, both ensembles achieve nearly identical results. Panel C highlights the best results achieved by the ensemble method using AEs (see Figure 4A). The ensemble model generally outperforms or matches the baseline, particularly at reasonably balanced attack ratios, where increasing the size of the training dataset leads to improved values.
Finally, panels (A–F) in Figure 7 compare the values for different percentage attack sizes using three methods. (i) The red point represents the ensemble results (the standard deviation along each axis is calculated using 20 different test files). (ii) The green point represents the results of the baseline approach (after averaging the results of the 150 individual estimators (left panel for AEs and right panels for IFs), the standard deviation along each axis is calculated with 20 different test files). (iii) The blue points represent the results of 150 individual estimators (left panel for AEs and right panels for IFs), where each point represents the average along each axis and is calculated using 20 different test files. Each panel displays values for one anomaly size on the y-axis and another on the x-axis to compare performance. In panels A, B, and C, which compare anomaly sizes of 0.5%, 1%, and 12.5% against each other for the number of 1000 training patterns for the AE, the blue points are widely spread, showing varying performance across individual AEs. The ensemble points are consistently placed in the upper-right area of the panels, indicating stable and high performance. The baseline points (green) fall below the ensemble, suggesting it is less effective. Panels D, E, and F highlight the same observations for IFs trained with 100 patterns. What is most remarkable about this figure, for both AEs and IFs, is that there are individual estimators that improve the average performance of the ADEs. This observation suggests that a proper selection of ensemble components could potentially improve the results.
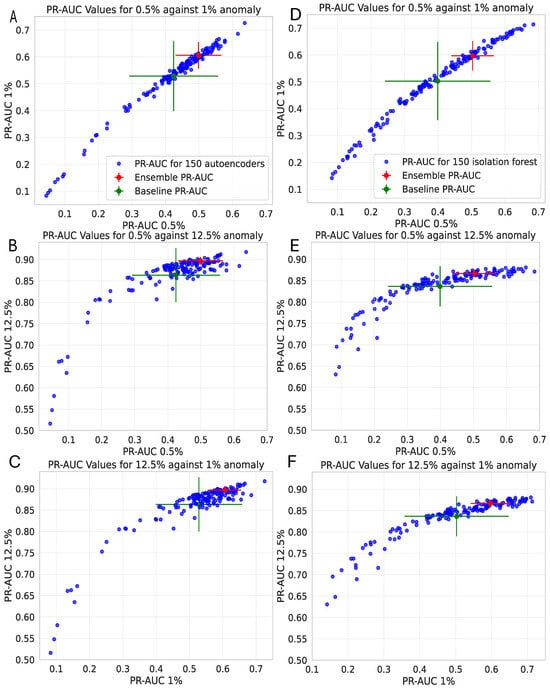
Figure 7.
A comparison of different anomaly sizes was predicted with 150 AEs using 1000 patterns for training of AEs (A–C) and 100 patterns to train IFs (D–F) against each other, along with the results of the ensemble and baseline (see panels A and B of Figure 6).
We extended the analysis of the impact of the number of training patterns on the ensemble of AEs and IFs to the CIC_IoT-2023 dataset using a similar procedure to the NSL-KDD dataset (see Section 3.1.2). As shown in Figure 8A, the ensemble of AEs achieves exceptional detection for severe anomalies, significantly earlier than the baseline, with approximately 2000 records. Moreover, it yields better results of a close to one, with a balanced ratio of attacks, employing only 300 training records. The results, included in Appendix A.2, provide similar insights; however, the differences between balanced and imbalanced datasets are less pronounced, a pattern also observed with the NSL-KDD dataset. To provide a more comprehensive comparison of ADEs on the CIC_IoT-2023 dataset, Figure 9 explicitly focuses on the ensemble and baseline approaches for AEs and IFs, for two representative sizes of training datasets: 400 and 2000 samples. The training size of 400 represents the approximate average number of samples allocated to each component of the ensemble. This approach ensured minimal overlap between the datasets used to train each model, while still leveraging the entire normal traffic dataset. However, when the training size reaches 2000 patterns, also with relatively low overlap, the ensemble stabilizes and stops improving. These panels detail the performance of the AE-based and the IF-based detection methods in identifying malicious traffic for a range of attack ratios, which include 0.5%, 1%, 12.5%, 25%, and 50%. Panel A illustrates the results of the when the training data of the normal traffic was distributed between the AE and IF models, with a small ratio of overlap. The results of the ensemble of AEs show improvement with approximately 10% in detecting severe anomalies, such as 0.5% and 1%.
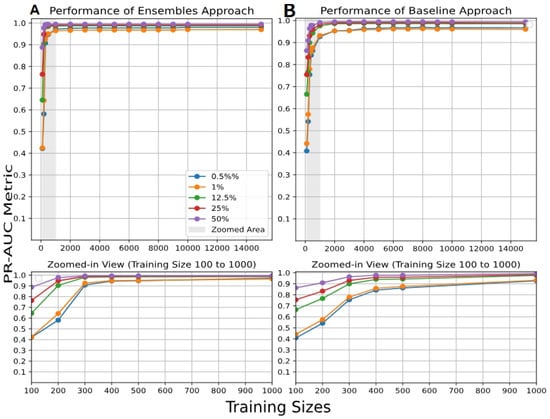
Figure 8.
results of 150 AEs for (A) the ensemble and (B) the baseline approaches with different training sizes ranging from 100 to 15,000, and for different ratios of benign and malignant traffic for the CIC_IoT-2023 dataset.
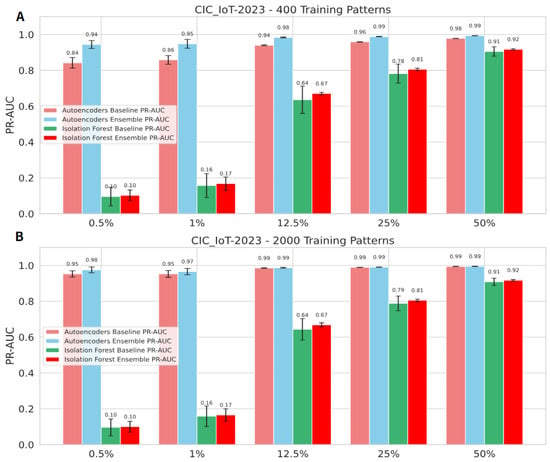
Figure 9.
A comparison of different ratios of benign and malignant traffic for the ensemble and baseline models using two different training sizes for the CIC_IoT-2023 dataset: (A) 400 patterns; and (B) 2000 patterns.
The complete stabilization of can be observed in panel B, which highlights the best results of reached by the ensemble of AEs, where the system detects the severe anomaly (0.5%) with 98% of the attacks. At the same time, it detects the balanced ratios of attacks such as 12.5%, 25%, and 50% with approximately 1. The poor performance of IF on the CIC_IoT-2023 dataset is surprising; however, similar results have already been reported in [,,], where the authors demonstrate that IF performs significantly worse compared to the AE approach.
We used as an additional performance metric to evaluate the performance of our proposed model. Figure A1 and Figure A2 (in Appendix A.2) show the results of the ROC-AUC for the NSL-KDD and CIC_IOT2023 datasets, comparing the ensemble of AEs and the baseline, for training record counts ranging from 100 to 15,000. As we can see, the ensemble of AEs reaches the optimal results with a smaller number of records. At the same time, Figure A3 (in Appendix A.2) shows the ROC-AUC results for the NSL-KDD dataset for the ensemble of IFs and the baseline. Figure A4 and Figure A5 (in Appendix A.3) illustrate the results of PR-AUC for an extended experiment that represents only two distinct attack categories of the CIC_IoT-2023 dataset: volumetric vs. semantic. DDoS-TCP Flood is a volumetric attack aiming to exhaust system resources (bandwidth, CPU, memory) by generating massive traffic volumes, where thousands or millions of packets are sent to overwhelm a server. On the other hand, DNS Spoofing is a semantic attack, meaning it manipulates the logical behavior or content of the system without producing large traffic volumes.
To place the model’s operational viability within a practical context, it is important to consider its computational performance. Although the ensemble includes 150 models, its training is performed offline and can be performed in parallel, significantly reducing computational costs. Thanks to the use of lightweight models (autoencoders and isolation forests), the entire process was executed for a training data size in a very reasonable time, as shown below. The experiments were conducted exclusively on CPUs, using an Intel XeonW-2245 processor running at 3.90 GHz (8 cores), with 64 GB of DDR4 RAM. To provide context in different training sizes, training the autoencoders with 200, 400, and 1000 input patterns took approximately 100, 120, and 180 s, respectively. During the evaluation phase in our simulations, we used 10,000 test samples for each of the 20 test files we used in the evaluation of model performance (see Section 3 Materials and Methods). The ensemble of AEs completed each inference on 10,000 test samples in approximately 60 s. Importantly, the inference time per individual sample is very low (0.006 s), making the model suitable for real-time or near-real-time applications. For training isolation forests with 200, 400, and 1000 patterns, the time required was approximately between 17 and 20 s. In the inference phase of IF, the runtime for ensembles is approximately 10 s, tested with a single test file of 10,000 patterns. Again, the inference time per individual sample is very low, making the model suitable for real-time or near-real-time applications. For scenarios with hardware resource constraints (such as IoT), future work will explore more compact configurations and optimization strategies that maintain the effectiveness of the approach without compromising its applicability.
5. Discussion and Conclusions
The attack representation in network traffic fluctuates. Some attacks may occur frequently, while others are relatively infrequent. However, it is necessary to note that the attack traffic is less than the benign traffic in most real-time network traffic, and the imbalance between both changes dynamically over time in real information system scenarios. Traditional machine learning algorithms that use two classes may fail to be real-time detectors because they depend on predefined labels of normal and attack categories and do not adapt easily to evolving threats. In this context, we proposed an ADE. The ADEs are composed of individual estimators, which are OCC models: AE and IF. Therefore, specifically in this work, we evaluated and analyzed in detail how both approaches behave in different scenarios with varying attack rates without the need for retraining, allowing us to approach real-world operating frameworks where this adaptability is essential. Since the individual estimators in the ensembles are OCC models, the system generalizes effectively across variations in the data distribution. This enhances the realism of the cyberattack detection system, as it does not rely as heavily on a predefined proportion of attack instances during training, mirroring real-world conditions where attack frequencies are unknown and unpredictable. For this purpose, we created different attack ratios using the NSL-KDD and CIC_IoT-2023 datasets to mimic these real-world scenarios. We found that the proposed ADEs adapt to changing attack rates, without the need for retraining, performing better than the baseline method under severe imbalances of benign versus malicious traffic. As mentioned above, to our knowledge, there has been no study that explicitly analyzes the effect of varying attack rates on an NIDS. For this reason, we compare the ensemble methodology with the simple average of the models that participate in the ensemble prediction (the baseline approach). Additionally, we investigated how the quantity of information supplied to the individual estimators and the overlap between this in the ensembles affect predictions in the inference phase. We found that when the training datasets are less overlapping, the ADE ensemble of AEs works better, as shown in Figure 4 and Figure 8.
Thus, as a summary, it is important to highlight that our results suggest that diversity in training data across ensemble members may contribute to enhanced performance in attack detection. Although several works have already established this relationship between diversity and performance in the context of ensemble models [], further investigation is needed to fully understand the extent and nature of this relationship in the present context. The findings point toward the potential benefits of incorporating data diversity when designing ensemble-based detection systems. When comparing the two ADE models evaluated in this study, the AE ensemble achieved reasonable performance in detecting cyberattacks, even for a severe imbalance between anomalous traffic and normal traffic when it was trained with sufficient data. However, the IF-based ensemble for the NSL-KDD reached its optimal performance more rapidly, requiring less training data, as illustrated in Figure 5. As previously discussed, reducing the overlap between the training data of individual anomaly estimators tends to increase diversity, which may contribute to enhanced overall performance, particularly in the case of the IF-based ensemble. While this effect was more evident in specific configurations, further investigation is needed to assess its consistency and broader applicability. In contrast, for the CIC_IoT-2023 dataset, Figure 9 shows that the IF ensemble failed to generalize the problem effectively, an outcome consistent with prior observations of several works [,]. Nevertheless, further exploration is needed to enhance the performance of the two ADEs in detecting attacks, including feature dimensional reduction and tuning AE parameters for different ratios. Figure 7 shows that some individual estimators (both AEs and IFs) outperformed the ensemble, which could also perform better with optimized individual estimators. Finally, it is essential to highlight that when normal traffic records are distributed among the AE and IF components of the ensemble during training, with small overlap between the data assigned to each model, we have shown that the approach based on an ensemble of autoencoders outperforms the ensemble of IFs, especially on the CIC_IoT-2023 dataset. This property is especially useful in IoT environments, where multiple sensors or devices generate heterogeneous data with a small overlap. In this context, each sensor could train a simple model, for example, an autoencoder, on the normal traffic it records locally. Subsequently, when evaluating new traffic, any sensor could query the models of the rest of the network and conduct a vote based on their responses, enabling more robust collaborative and distributed detection. In conclusion, this study presents an explicit analysis of how training data overlap influences the detection of varying attack ratios, employing ensemble methods based on two algorithms: AEs and IFs.
Finally, we would like to emphasize that despite the strengths of our proposed work, there are still limitations that open avenues for future research. Regarding scalability, although the base models of the ensemble (autoencoders and isolation forests) were trained independently on separate data subsets, enabling efficient parallelization and controlled computational distribution, particularly relevant for IoT contexts, challenges may arise in extremely high-dimensional scenarios. Issues such as data dispersion or attribute redundancy could affect performance. Future research will address these challenges by incorporating dimensionality reduction techniques and evaluating performance on large-scale datasets to validate the robustness of the proposed approach in real-world detection contexts. Moreover, while our study uses artificially rebalanced datasets to simulate fluctuating attack ratios, we acknowledge that this does not fully capture the complexity of real-world traffic evolution. As future work, we plan to extend our evaluation to more realistic scenarios, incorporating temporally evolving data and naturally occurring attack patterns to better assess model adaptability under operational conditions. Additionally, although our focus was on unsupervised ensembles trained solely on normal traffic, we recognize that the experimental comparison could be strengthened by including more sophisticated baselines, such as deep learning-based multi-class classifiers or hybrid one-class models. Future work will explore these approaches to broaden the scope and generalizability of our findings.
Author Contributions
Conceptualization, F.S.S.A., L.F.L.-F. and F.B.R.; methodology, F.S.S.A., L.F.L.-F. and F.B.R.; writing—original draft preparation, F.S.S.A.; writing—review and editing, F.S.S.A., L.F.L.-F. and F.B.R.; supervision, L.F.L.-F. and F.B.R.; funding acquisition, L.F.L.-F. and F.B.R. All authors have read and agreed to the published version of the manuscript.
Funding
This research was supported by grant PID2023-149669NBI00 (MCIN/AEI and ERDF—“A way of making Europe”).
Data Availability Statement
We only use publicly available datasets. The NSL-KDD dataset can be found at https://www.kaggle.com/datasets/hassan06/nslkdd (accessed on 23 October 2025). The CIC_IoT2023 dataset can be found at https://www.unb.ca/cic/datasets/iotdataset-2023.html (accessed on 23 October 2025).
Conflicts of Interest
The authors declare no conflicts of interest.
Appendix A
This material provides additional details on the ensemble algorithms and performance evaluations used in our study. Specifically, we include pseudocode for the ensemble methods based on Autoencoders and Isolation Forests, both employing mean aggregation strategies (Section A.1). Furthermore, we present ROC–AUC results for both AE and IF based baselines and ensembles on the NSL-KDD dataset, using training set sizes ranging from 100 to 15,000 samples (Section A.2). Finally, we provide an extended evaluation on the CIC_IoT-2023 dataset for two behavioral attack scenarios—DDoS-TCP_Flood and DNS_Spoofing—using the same training range as described for the NSL-KDD dataset in Table 1 (Section A.3).
Appendix A.1. Algorithm Pseudocodes for AEs and IFs
In this subsection, we provide the pseudocode for the ensemble methods based on Autoencoders (Algorithm A1) and Isolation Forests (Algorithm A2).
| Algorithm A1 Ensemble of Autoencoders with Mean Aggregation |
|
| Algorithm A2 Ensemble of Isolation Forests with Mean Aggregation |
|
Appendix A.2. Additional Performance Metrics ROC-AUC
In this subsection, we present the results for the ensembles of AEs and the baseline models on the NSL-KDD and the CIC_IoT2023 datasets, with training sizes ranging from 100 to 15,000 samples. Additionally, the results for the ensembles of IFs and the baseline models are also shown for the NSL-KDD dataset.
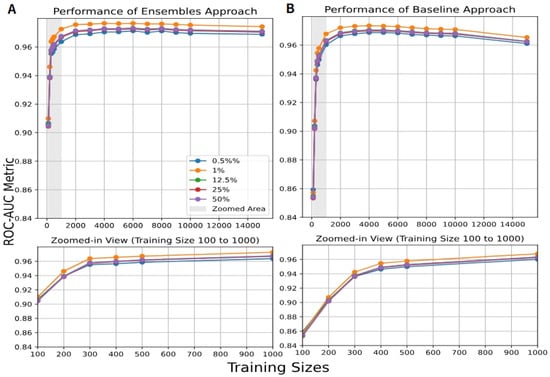
Figure A1.
results of 150 AEs for (A) the ensemble and (B) the baseline approaches with different training sizes ranging from 100 to 15,000, and for different ratios of benign and malignant traffic for the NSL-KDD dataset.
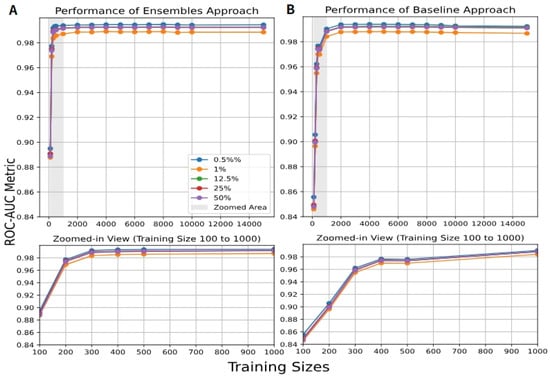
Figure A2.
results of 150 AEs for (A) the ensemble and (B) the baseline approaches with different training sizes ranging from 100 to 15,000, and for different ratios of benign and malignant traffic for the CIC_IoT-2023 dataset.
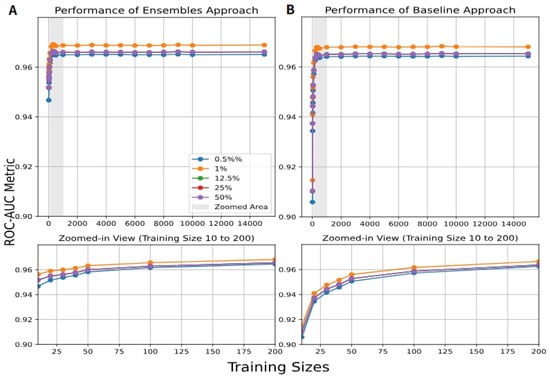
Figure A3.
results of 150 IFs for (A) the ensemble and (B) the baseline approaches with different training sizes ranging from 100 to 15,000, and for different ratios of benign and malignant traffic for the NSL-KDD dataset.
Appendix A.3. Evaluation on the CICIoT2023 Dataset for Two Different Behavioral Attack Scenarios: DDoS-TCP Flood and DNS Spoofing
In this subsection, we present results of for the CIC_IoT-2023 dataset using only two attack types (DDoS-TCP_Flood and DNS_Spoofing) using the same training size range as for the NSL-KDD dataset.
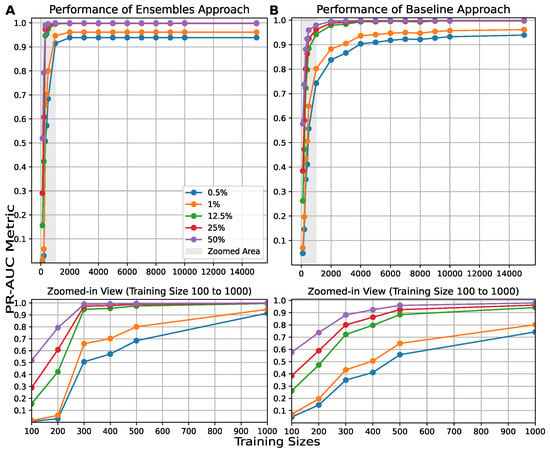
Figure A4.
results of 150 AEs for (A) the ensemble and (B) the baseline approaches with different training sizes ranging from 100 to 15,000, and for different ratios of benign and malignant traffic for the CIC_IoT-2023 dataset for two types of attacks: DDoS-TCP_Flood and DNS_Spoofing.
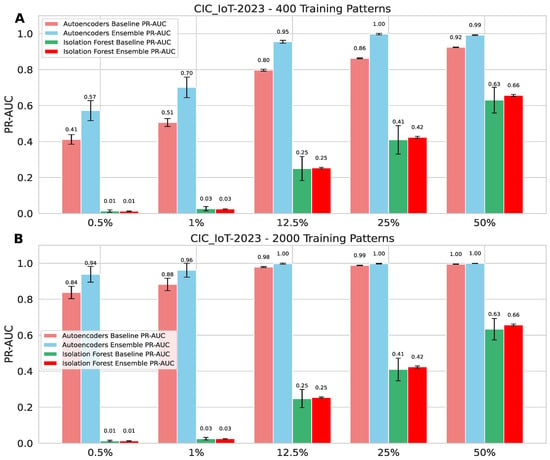
Figure A5.
A comparison of different ratios of benign and malignant traffic for the ensemble and baseline models for two different training sizes, and using only two types of attacks (DDoS-TCP_Flood, and DNS_Spoofing), for the CIC_IoT-2023 dataset: (A) 400 patterns; (B) 2000 patterns.
References
- IBM. What Is Cybersecurity? 2024. Available online: https://www.ibm.com/think/topics/cybersecurity (accessed on 24 March 2025).
- Alraddadi, F.S.; Lago-Fernández, L.F.; Rodríguez, F.B. Impact of Minority Class Variability on Anomaly Detection by Means of Random Forests and Support Vector Machines. In Advances in Computational Intelligence: Proceedings of the 16th International Work-Conference on Artificial Neural Networks, IWANN 2021, Virtual Event, 16–18 June 2021; Springer: Berlin/Heidelberg, Germany, 2021; pp. 416–428. [Google Scholar] [CrossRef]
- Zhou, Z.H. Ensemble Methods: Foundations and Algorithms, 1st ed.; Chapman & Hall/CRC: Boca Raton, FL, USA, 2012. [Google Scholar]
- Núñez Delafuente, H.; Astudillo, C.A.; Díaz, D. Ensemble Approach Using k-Partitioned Isolation Forests for the Detection of Stock Market Manipulation. Mathematics 2024, 12, 1336. [Google Scholar] [CrossRef]
- Singh, A.; Jang-Jaccard, J. Autoencoder-based Unsupervised Intrusion Detection using Multi-Scale Convolutional Recurrent Networks. arXiv 2022, arXiv:2204.03779. [Google Scholar]
- Xu, W.; Jang-Jaccard, J.; Singh, A.; Wei, Y.; Sabrina, F. Improving Performance of Autoencoder-Based Network Anomaly Detection on NSL-KDD Dataset. IEEE Access 2021, 9, 140136–140146. [Google Scholar] [CrossRef]
- Chen, Z.; Yeo, C.; Lee, B.; Lau, C. Autoencoder-Based Network Anomaly Detection. In Proceedings of the 2018 Wireless Telecommunications Symposium (WTS), Phoenix, AZ, USA, 17–20 April 2018; pp. 1–5. [Google Scholar] [CrossRef]
- Tang, C.; Luktarhan, N.; Zhao, Y. SAAE-DNN: Deep Learning Method on Intrusion Detection. Symmetry 2020, 12, 1695. [Google Scholar] [CrossRef]
- Khan, M.A.; Iqbal, N.; Imran; Jamil, H.; Kim, D.H. An Optimized Ensemble Prediction Model using AutoML Based on Soft Voting Classifier for Network Intrusion Detection. J. Netw. Comput. Appl. 2023, 212, 103560. [Google Scholar] [CrossRef]
- Elsaid, S.A.; Binbusayyis, A. An optimized isolation forest based intrusion detection system for heterogeneous and streaming data in the industrial Internet of Things (IIoT) networks. Discov. Appl. Sci. 2024, 6, 483. [Google Scholar] [CrossRef]
- AbuAlghanam, O.; Alazzam, H.; Alhenawi, E.; Qatawneh, M.; Adwan, O. Fusion-based anomaly detection system using modified isolation forest for Internet of Things. J. Ambient Intell. Humaniz. Comput. 2023, 14, 131–145. [Google Scholar] [CrossRef]
- Nalini, M.; Yamini, B.; Ambhika, C.; Siva Subramanian, R. Enhancing early attack detection: Novel hybrid density-based isolation forest for improved anomaly detection. Int. J. Mach. Learn. Cybern. 2025, 16, 3429–3447. [Google Scholar] [CrossRef]
- Carrera, F.; Dentamaro, V.; Galantucci, S.; Iannacone, A.; Impedovo, D.; Pirlo, G. Combining Unsupervised Approaches for Near Real-Time Network Traffic Anomaly Detection. Appl. Sci. 2022, 12, 1759. [Google Scholar] [CrossRef]
- Smolen, T.; Benova, L. Comparing Autoencoder and Isolation Forest in Network Anomaly Detection. In Proceedings of the 2023 33rd Conference of Open Innovations Association (FRUCT), Zilina, Slovakia, 24–26 May 2023; pp. 276–282. [Google Scholar] [CrossRef]
- Maheswari, G.; Vinith, A.; Sathyanarayanan, A.S.; Sowmi Saltonya, M. An Ensemble Framework for Network Anomaly Detection Using Isolation Forest and Autoencoders. In Proceedings of the 2024 International Conference on Advances in Data Engineering and Intelligent Computing Systems (ADICS), Chennai, India, 18–19 April 2024; pp. 1–6. [Google Scholar] [CrossRef]
- Chua, W.; Pajas, A.L.D.; Castro, C.S.; Panganiban, S.P.; Pasuquin, A.J.; Purganan, M.J.; Malupeng, R.; Pingad, D.J.; Orolfo, J.P.; Lua, H.H.; et al. Web Traffic Anomaly Detection Using Isolation Forest. Informatics 2024, 11, 83. [Google Scholar] [CrossRef]
- Al-Shehari, T.; Al-Razgan, M.; Alfaqih, T.; Alsowail, R.; Pandiaraj, S. Insider Threat Detection Model Using Anomaly-Based Isolation Forest Algorithm. IEEE Access 2023, 11, 118170–118185. [Google Scholar] [CrossRef]
- Tavallaee, M.; Bagheri, E.; Lu, W.; Ghorbani, A.A. A Detailed Analysis of the KDD CUP 99 Data Set. In Proceedings of the 2009 IEEE Symposium on Computational Intelligence for Security and Defense Applications, Ottawa, ON, Canada, 8–10 July 2009; pp. 1–6. [Google Scholar] [CrossRef]
- Stolfo, S.; Fan, W.; Lee, W.; Prodromidis, A.; Chan, P. KDD Cup 1999 Data [Dataset]. 1999. [CrossRef]
- Neto, E.C.P.; Dadkhah, S.; Ferreira, R.; Zohourian, A.; Lu, R.; Ghorbani, A.A. CICIoT2023: A Real-Time Dataset and Benchmark for Large-Scale Attacks in IoT Environment. Sensors 2023, 23, 5941. [Google Scholar] [CrossRef] [PubMed]
- Sofaer, H.; Hoeting, J.; Jarnevich, C. The area under the precision-recall curve as a performance metric for rare binary events. Methods Ecol. Evol. 2018, 10, 565–577. [Google Scholar] [CrossRef]
- Goodfellow, I.; Bengio, Y.; Courville, A. Deep Learning; MIT Press: Cambridge, MA, USA, 2016; Available online: http://www.deeplearningbook.org (accessed on 23 October 2025).
- Gong, D.; Liu, L.; Le, V.; Saha, B.; Mansour, M.R.; Venkatesh, S.; Hengel, A.V.D. Memorizing Normality to Detect Anomaly: Memory-Augmented Deep Autoencoder for Unsupervised Anomaly Detection. In Proceedings of the 2019 IEEE/CVF International Conference on Computer Vision (ICCV), Seoul, Republic of Korea, 27 October–2 November 2019; pp. 1705–1714. [Google Scholar] [CrossRef]
- Zhai, J.; Zhang, S.; Chen, J.; He, Q. Autoencoder and Its Various Variants. In Proceedings of the 2018 IEEE International Conference on Systems, Man, and Cybernetics (SMC), Miyazaki, Japan, 7–10 October 2018; pp. 415–419. [Google Scholar] [CrossRef]
- Liu, F.T.; Ting, K.M.; Zhou, Z.H. Isolation-Based Anomaly Detection. ACM Trans. Knowl. Discov. Data 2012, 6, 1–39. [Google Scholar] [CrossRef]
- Krzysztoń, E.; Rojek, I.; Mikołajewski, D. A Comparative Analysis of Anomaly Detection Methods in IoT Networks: An Experimental Study. Appl. Sci. 2024, 14, 11545. [Google Scholar] [CrossRef]
- Golestani, S.; Makaroff, D. Exploring Unsupervised One-Class Classifiers for Lightweight Intrusion Detection in IoT Systems. In Proceedings of the 2024 20th International Conference on Distributed Computing in Smart Systems and the Internet of Things (DCOSS-IoT), Abu Dhabi, United Arab Emirates, 29 April–1 May 2024; pp. 234–238. [Google Scholar] [CrossRef]
- Gheni, H.Q.; Al-Yaseen, W.L. Two-step data clustering for improved intrusion detection system using CICIoT2023 dataset. E-Prime Electr. Eng. Electron. Energy 2024, 9, 100673. [Google Scholar] [CrossRef]
- Pang, Y.; Peng, L.; Zhang, H.; Chen, Z.; Yang, B. Imbalanced ensemble learning leveraging a novel data-level diversity metric. Pattern Recognit. 2025, 157, 110886. [Google Scholar] [CrossRef]
Disclaimer/Publisher’s Note: The statements, opinions and data contained in all publications are solely those of the individual author(s) and contributor(s) and not of MDPI and/or the editor(s). MDPI and/or the editor(s) disclaim responsibility for any injury to people or property resulting from any ideas, methods, instructions or products referred to in the content. |
© 2025 by the authors. Licensee MDPI, Basel, Switzerland. This article is an open access article distributed under the terms and conditions of the Creative Commons Attribution (CC BY) license (https://creativecommons.org/licenses/by/4.0/).