Abstract
This research study aimed to evaluate the legibility of Arabic road signage using an eye-tracking approach within a virtual reality (VR) environment. The study was conducted in a controlled setting involving 20 participants who watched two videos using the HP Omnicept Reverb G2. The VR device recorded eye gazing details in addition to other physiological data of the participants, providing an overlay of heart rate, eye movement, and cognitive load, which in combination were used to determine the participants’ focus during the experiment. The data were processed through a schematic design, and the final files were saved in .txt format, which was later used for data extraction and analysis. Through the execution of this study, it became apparent that employing eye-tracking technology within a VR setting offers a promising method for assessing the legibility of road signs. The outcomes of the current research enlightened the vital role of legibility in ensuring road safety and facilitating effective communication with drivers. Clear and easily comprehensible road signs were found to be pivotal in delivering timely information, aiding navigation, and ultimately mitigating accidents or confusion on the road. As a result, this study advocates for the utilization of VR as a valuable platform for enhancing the design and functionality of road signage systems, recognizing its potential to contribute significantly to the improvement of road safety and navigation for drivers.
1. Introduction
Traffic safety depends on the integration of various components, including driver psychology and traffic, vehicle, environment, and road infrastructure [1]. Driving is a complex task that requires interaction between road users and traffic environments [2]. To perform safe driving, drivers need to receive and process various traffic information, which demands visual and attentional resources [3]. Efficient traffic signs play a significant role in the interaction between drivers and road infrastructure as the primary source of information required to promote, control, and regulate traffic.
Roadway signs must be detected, recognized, and comprehended easily and promptly for drivers to react as they drive at different speeds. Road sign visibility and legibility are related to various visual factors such as size, typography, color contrast, and luminance in relation to light during daytime and nighttime. Scholars have explored the impact of these factors on the conspicuity and legibility of roadway signs [4].
The legibility of typefaces used on roadway signage is an essential requirement for drivers to read and comprehend traffic information. Various studies investigated the performance of the Latin typefaces of the English language; remarkably, the research studies improved the legibility of the United States (US) highway fonts FHWA Standard and Clearview typefaces in relation to various factors [5,6,7,8]. The efficiency and comprehension of Arabic road signage have been investigated in relation to drivers’ personal characteristics in multiple studies [9,10,11,12,13]. However, the visibility and legibility of Arabic Road signage are yet to be examined. This paper presents an empirical assessment of the legibility of Arabic Road signage using eye-tracking in a virtual reality (VR) environment.
2. Eye-Tracking Systems in VR Environments
Eye-tracking systems in VR environments represent a cutting-edge technology that has significantly enhanced the immersive experience for users. These systems monitor and record the gaze of an individual, allowing for a detailed analysis of where the user is looking within the virtual space. This technology has found applications across various fields, from gaming and entertainment to healthcare and education. One exciting opportunity is its potential contribution to the legibility of road signage, where the fusion of eye-tracking technology and VR environments can offer novel insights into human visual perception and interaction with informational cues.
In the context of VR, eye-tracking systems utilize specialized sensors, often integrated into VR headsets, to capture and analyze the movement of the user’s eyes. These real-time data are then translated into valuable information about the user’s visual attention, such as the duration of gaze, fixation points, and patterns of eye movement. By understanding where a user directs their attention, developers and researchers can tailor virtual environments to optimize user engagement and enhance the overall experience.
Now, the integration of eye-tracking systems with Arabic road signage presents a unique opportunity to address challenges related to legibility and comprehension. Arabic script is distinctive, characterized by its right-to-left writing direction and intricate letterforms. Road signage, being a critical component of urban infrastructure, must be designed for maximum clarity to ensure safe and efficient navigation. However, factors such as font size, spacing, and color contrast can influence the legibility of Arabic text, and these factors may vary among individuals based on their visual abilities and preferences.
The interlinkage between eye-tracking systems and the legibility of Arabic road signage lies in the ability to gain precise insights into how users visually engage with and interpret the presented information. Through the integration of VR environments, researchers can simulate realistic driving scenarios, placing users in situations where they must rely on the clarity of road signs to make informed decisions. Eye-tracking technology then records the users’ gaze as they navigate these virtual environments, offering a detailed understanding of which aspects of the signage attract the most attention and how long users focus on particular elements.
These empirical data can inform design principles for Arabic road signage, guiding the optimization of factors crucial for legibility. For instance, if the eye-tracking analysis indicates that users consistently focus on certain parts of a sign, designers can prioritize these areas for critical information placement. Additionally, insights into the duration of gaze can guide decisions on font size and spacing, ensuring that drivers have sufficient time to process the information presented on the signs. Color contrast analysis through eye-tracking can further contribute to the creation of signage that is not only legible during the day but also under various lighting conditions.
Furthermore, the VR environment allows for the manipulation of design variables in real-time, enabling researchers to observe immediate changes in user behavior based on alterations to signage elements. This iterative process facilitates the refinement of road sign design, ultimately contributing to the creation of signage that is both culturally sensitive and optimized for efficient communication in the context of Arabic-speaking regions.
Effectively, the interplay between eye-tracking systems and VR environments offers a promising avenue for enhancing the legibility of Arabic road signage. By leveraging the capabilities of these technologies, researchers and designers can gain valuable insights into user visual behavior, leading to informed design decisions that prioritize safety and efficiency on the road.
The primary objective of this study is to evaluate the readability of Arabic road signs within a virtual environment utilizing eye-tracking technology in a controlled laboratory setup. The hypothesis is based on the assumption that various factors such as reading time, the number of fixations, fixation duration, the number of saccades, saccade duration, and average glance duration will differ depending on the number of messages presented on each sign, word length, and color combinations. Subsequently, these factors affect the correct and timely interpretations by drivers. Additionally, the research aims to bridge the disparity between simulated environments and real-world situations by conducting a subsequent study employing advanced eye-tracking HMDI to capture various legibility metrics, including gaze movements, response time, memory and retention, and correct interpretation, all of which are triangulated with additional breathing, blood pressure, and facial expressions captured by the device to allow for in-depth discussion. This methodology is expected to provide a more genuine insight into how individuals engage with and interpret real-world signage.
3. Reading, Legibility, and Eye Movement
Building on the understanding of how users interact with virtual environments and Arabic road signage through eye-tracking technology, it is crucial to delve into the fundamental processes of reading, legibility, and eye movement. This exploration will shed light on the intricate mechanisms underlying the comprehension of typographical symbols and the factors influencing legibility, providing a comprehensive foundation for the subsequent analysis of user gaze patterns in the context of Arabic road signage. Reading is a complex process of decoding typographical symbols into recognizable words and sentences. This happens based on parallel operations of lower-level letter identification and higher-level syntactic and semantic processes [14]. Define legibility as the ease with which a reader can accurately perceive and encode text [15]. Legibility is a product of intrinsic, such as font design and typographic features (letter height, stroke width, letter width, etc.), and extrinsic factors, such as readers’ abilities, familiarity with the language, and reading condition. Reading does not happen as a continuous movement along the lines of text; instead, it appears as a sequence of saccades and individual fixations [16].
One of the commonly used methods to study the legibility of text is through the study of eye movements [17]. Human eye movements are driven by the information they retrieve. Reading research found that the legibility of a font impacts reading and, therefore, affects eye movements. For example, Ref. [18] showed the connections between eye movement and cognitive load, which vary during reading. Eye movement tracking is instrumental in fixing, inspecting, and tracking visual stimuli or parts of them that were attended to, which predicts the processing of visual stimuli and users’ behavior [19,20]. Studying eye movements for the legibility of text has provided a body of conclusions that focus on visual processing, text perception, and cognition. Eye gaze movements can also provide insights into participants’ search for visual targets versus reading text and indicate participants’ reading speed and ease [21]. In everyday life, drivers process visual information by allocating visual attention across the environment to relevant information in the visual field. Reading is one activity requiring visual attention with a cognitive outcome. Searching for visual stimuli under controlled conditions increases visual attention, reduces information overload, and simplifies the elaboration between working and long-term memory [22].
Eye-tracking provides a potential means of understanding the nature and acquisition of visual expertise through pupil detection, image processing, data filtering, and recording movement using fixation point, frequency, duration, and saccades [23]. This usually happens within a specified timeframe to detect visual stimuli in which users are interested. As argued by [24]:
Eye-tracking allows us to measure an individual’s visual attention, yielding a rich source of information on where, when, how long, and in which sequence certain information in space or about space is looked at.
Eye-tracking technologies allowed researchers to investigate various aspects of the legibility of text in different contexts, such as the legibility of highway signs for road users. Eye-tracking and drivers’ responses have been utilized in studying signs’ visibility and legibility within field studies or laboratory-based settings. Eye-tracking studies are used to study subject eye movements to improve the design and performance of road traffic signs. The drivers’ response method relies on the driver to indicate when they can read a sign’s content and the eye tracking captures eye movements and glances at a sign. Font legibility influences reading [25,26,27] and, therefore, eye movement. When the letterforms are more difficult to recognize, reading takes a longer time as readers make more and longer eye fixations, smaller saccades, and more regressions, which consequently slows reading [18,28,29]. In line with the above, the subsequent step would be exploring the distinct aspects of the legibility of road signage since it is a critical aspect of transportation and urban planning, aiming to ensure that drivers and pedestrians can quickly and accurately interpret the messages conveyed by traffic signs.
4. Legibility of Road Signage
Drivers are confronted with excessive information and complex roadway situations that require focus on vehicle control and guidance and on navigating to their destination. The information presented at these two levels is acquired from the drivers’ roadway and in-vehicle environments. Drivers gather and perceive most of the road information visually, mainly through traffic control devices such as directional and regulatory traffic signs. Scholars studied the influence of signs on drivers’ reading behavior using physiological characteristics such as driver’s vision and reaction ability [30], which were part of more widely discussed factors related to the driver’s eye movement as a visual information processing process [31] and the evaluation of the situation by analyzing essential visual elements. Research showed that the complexity of traffic signs and the amount of information has a significant impact on the driver’s visual research level.
Several studies utilized eye-tracking methods to explore drivers’ behavior. Rockwell et al. [32] have long established that drivers’ eye movements on the road differ at night from during the day. Similarly, Mourant and Rockwell [33] revealed that when drivers become more familiar with a route, eye fixations become more focused on the road ahead rather than on observing the environment, but soon after, Bhise and Rockwell [34] found that drivers do not concentrate steadily on a sign to obtain information; instead, they performed several glances on the approach to the sign before it became legible as the time dedicated to viewing a sign depends on the time required for it to become visible to drivers, traffic density, and its relevance. Several other studies analyzed the effects of color combinations as a function of legibility distance [35] and the relation between visual acuity and the impact of luminance value on letter contrast [36].
Nonetheless, the factors that affect road sign legibility are much wider than those related to eye-gazing, including but not limited to drivers’ age [17], environmental factors and conditions [20,37], and time of the day. Sign complexity and the type of information are shown to affect a driver’s sign-viewing behavior, as discussed in [38,39] who looked at varying aspects of driver eye-movement behavior, such as daytime versus nighttime driving [40], age, and roadway geometry [41]; these efforts discovered that drivers use several glances to obtain information from signs, but besides drivers’ centric factors, there is certainly much more related to environment and other factors are out of the scope to be discussed further. Olson and Bernstein [42] conducted a two-tiered experiment to evaluate the effects of luminance, contrast, color [43], and driver visual characteristics on sign legibility distance in labs and field settings. Zwahlen [44] studied the legibility of short words or symbol signs during nighttime driving, and Zwahlen et al. [45] evaluated the effectiveness of ground-mounted diagrammatic signs at freeway interchanges by determining if they attracted eye fixations. Schieber et al. [30] assessed the effects of age, sign luminance, and environmental demands with a remote eye-tracking system. Carlson et al. [31] have also used sign legibility and eye-tracker data to evaluate the performance needs of nighttime drivers and develop traffic sign sheeting specifications to be visible at nighttime. Hudák and Madleňák [46] explored the frequency and duration of a driver’s gaze at traffic signs. Meanwhile, Sawyer et al. [47] explored the impact of typographic style on the legibility of reading text at a glance. Wang [48] used eye tracking to investigate the influence of various highway traffic signs on drivers’ gaze behavior in relation to visual characteristics. Thus, in the following regard, the legibility of road signage, particularly within the nuanced context of dual-language contexts, such as Arabic signs featuring a structure with distinctive visual and semantic systems, the font complexity and structure hold significant importance, influencing comprehension and reading ease across two distinct alphabets.
5. Arabic Road Signage
Road signages in most of the Middle East and North Africa (MENA) are bilingual, displaying traffic information in Arabic as a primary language and English to translate traffic information for international road users. In the United Arab Emirates (UAE), road signs use Boutros Advertisers Arabic Naskh and Transport English fonts in medium weights.
Boutros Advertisers was designed in 1977 by Mourad and Arlette in collaboration with Letraset as a companion to Helvetica [49]. The font was designed based on the Arabic Naskh calligraphic style with additional linked straight lines to match the baseline level in Latin typefaces (e.g., Garamond, Palatino, and Times Roman). This font has been used widely for way-finding systems, particularly for highway signage and airport signage (e.g., Beirut International Airport and Riyadh International Airport). Boutros Advertisers was designed in eight weights: light, medium, medium italic, bold, bold condensed, bold outline, bold shadow, and bold inline.
Transport is a sans serif typeface designed for road signs in the United Kingdom in the 1960s by Jock Kinneir and Margret Calvert for the Department of Transport’s Anderson and Worboys Committees. In 2012, an updated digital adaptation of the original lettering was released with minor modifications in seven weights (thin, light, regular, medium, semi-bold, bold, and black) and italics.
According to the(Abu Dhabi Manual on Uniform Traffic Control Devices (MUTCD) [50], road signs should utilize the Arabic Naskh font and be right justified, while the English Text is placed below the Arabic sign and should be left justified. Depending on the visibility, the English Text font shall be Clear View Type 5 on Overhead Signs and Type 4 on ground-mounted signs (Figure 1).
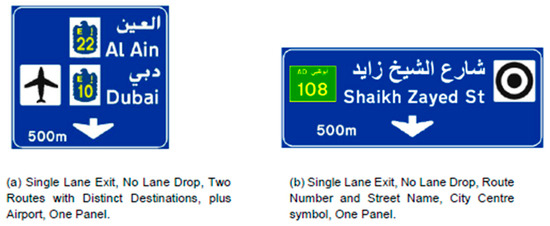
Figure 1.
Example of visual depiction of Arabic road signs.
The colors that are used on UAE Road signs adhere to international standards, ensure clarity, and convey specific meaning to drivers. The primary colors are as follows:
- Red;
- Green;
- Blue;
- White;
- Brown.
According to Taamneh and Alkheder [13], a survey-based methodology was employed to investigate the legibility and comprehension of road signs in Jordan. The paper survey consisted of 39 selected road signs (15 regulatory signs, 17 warning signs, 7 guidance signs) based on a multiple-choice questions format. These surveys were distributed among 400 drivers and non-drivers with diverse socio-demographic characteristics. According to the results that were given by the authors, 79%, 77%, and 83% of the participants were familiar with the road signs (regulatory, warning, guide signs), and the authors concluded that some of the road signs and traffic signs need to be redesigned and re-modified.
In another study [51], the effectiveness of highway traffic signs in Iraq was assessed using surveys in the form of multiple choice and short answer questions distributed to 1750 participants across the governorates within the country, including 24 signs (8 regulatory signs, 8 warning signs, and 8 guide signs). The results imply that comprehension of all 24 road signs was 53%, and the author concluded that the comprehension level of participants regarding road signs was low. One of the reasons the author mentions is the discrepancies in participants’ education levels. The results concluded with the importance of educating and informing people about the road signs and improving the road signs to be more legible. Several other researchers have already established similar findings across different foreign languages other than English [52,53,54,55,56,57,58].
6. Research Hypothesis
The effect of eye movements on the legibility of road signage can be measured in terms of total number of glances, total glance duration, minimum glance duration, maximum glance duration, and average glance duration. The legibility threshold data are the measure of the effectiveness of the legibility task.
The aim of the experiment here is to assess the legibility of Arabic road signs in a virtual environment using the eye-tracking technique in a controlled laboratory setting. The dependent measures of the experiment were reading time, the number of fixations, fixation duration, the number of saccades, and saccade duration.
The experiment was established based on the hypothesis that legibility factors such as reading time, the number of fixations, average fixation durations, the number of saccades, saccade duration, and average glance duration will vary based the number of messages displayed in each sign, word length (characters number), and color combinations (positive and negative), contrast, supported by the literature [58,59,60,61] that justifies these metrics as sufficient to our evaluation goal.
One aspect to be noted here is that in the current research on assessing legibility, the reliance on a perfectly simulated environment, be it in virtual reality (VR) or desktop settings, might not always provide the most accurate representation of real-world scenarios [62]. Therefore, a follow-up study will be conducted later to bridge this gap by employing advanced eye-tracking glasses. These glasses will have the capability to capture both eye gaze data and high-definition (HD) video recordings of the subject’s visual perspective. By overlaying the eye gaze data onto the recorded video, this approach is anticipated to offer a more authentic understanding of how individuals interact with and perceive real-world signage. However, it is essential to note that although such technological advancements make this methodology feasible, potential safety concerns persist, especially in contexts such as driving experiments, which need careful consideration and evaluation.
6.1. Experiment
The experiment was conducted in a VR environment where the participants watched two videos that lasted approximately 4 to 5 min while answering questions that appeared during the video. The initial pilot included several videos recorded for the drives over different routes; the key was to cover different types of roads, conditions, and times of the day, as well as several road sign types. The recorded drives were piloted with two different qualities. The first type was based on 360 videos of 4k resolutions [62,63]. Upon our initial pilot testing with users, we found that there are several factors that suggest a completely immersive video will influence low recall levels when compared to specific spatial x-, y-, and z-dimension videos within the immersive space (width–height–depth) [64,65,66,67,68], a finding that cannot be generalized as context and objectives of the experiment remain different. The placement of the videos within the space was carefully calibrated to represent a similar visual field of view and positioned to simulate a seated driver [62,69,70,71].
Unity® was the game engine of choice for developing the immersive environment for the present experiment, with the desired functionality interactions between the software and hardware sensors within the HP Head Mounted Device (HMD).
The environment where the user viewed the videos was simple; the camera was directed to the screen where the User Interface (UI) and the videos were displayed. The UI had the questions displayed. During the experiment, a question related to either a speed sign or road sign appeared, and the participant had 10–15 s to respond to the question by tapping the back trigger of the VR controller. All sorts of distractions in the environment were eliminated to help the participant focus on the experiment and maintain a simple environment. All the user’s responses were collected by the script that has been written to record the exact time the user responded to the questions that were being showcased on the screen. Figure 2 shows the start menu, while Figure 3 displays the questions UI on users’ perspective when they wore the head-mounted display (HMD) alongside the physiological data overlay by HP showing the participants’ heart rate, eye movement, and cognitive load.
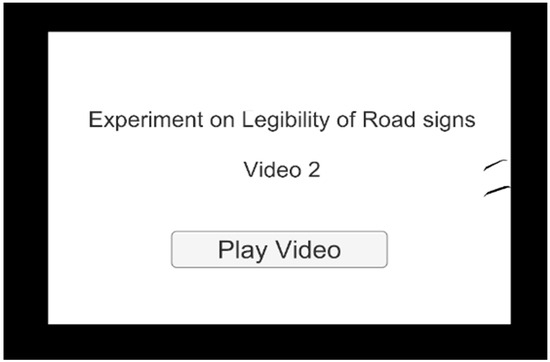
Figure 2.
Start UI.
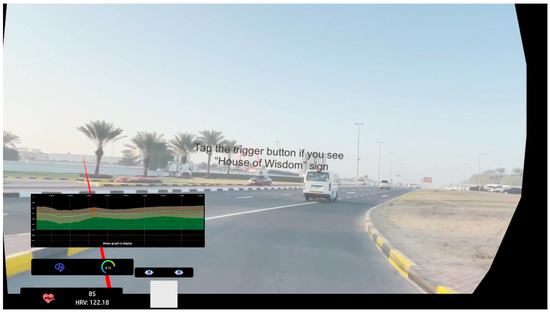
Figure 3.
Question UI and physiological data overlay by HP showing the participants’ heart rate, eye movement, and cognitive load.
Since HP reverb G2 has its own SDK (Gallia SDK), it allowed us to gather the necessary physiological data to examine for the experiment. Once all the data were collected, they were then imported into a spreadsheet to be more comprehensible.
One great advantage of the HMD is that its eye-tracking sensors are manufactured by Tobii. Tobii is one of the companies that leads the eye-tracking technology. Using the SDK that Tobii provided for the HMD, the observance of visual eye-tracking of each experiment became possible (as shown in Figure 4).
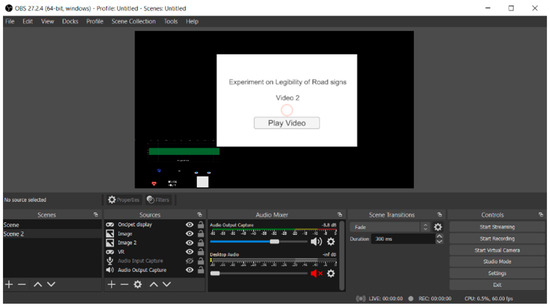
Figure 4.
Positioning of the physiological data overlay in OBS.
6.2. Participants
A total of 20 participants took part in this study, who were recruited from the University of Sharjah, Sharjah, United Arab Emirates. Their ages ranged from 18 to 25 years. Inclusion criteria were that participants had a normal or corrected-to-normal vision as self-reported, and Arabic must be their native language. The participants were recruited through an announcement distributed via university email. Participants volunteered to take part in the experiment and did not receive financial compensation. After explaining the experiment objectives and procedure verbally and in written form, participants filled out and signed an information consent form. This study was reviewed and approved by the University of Sharjah Research Ethics Committee.
6.3. Apparatus
We started by recording a drive-through video using (the video recording equipment) that was in 4k 3840 × 2160 resolution since we needed high-quality videos to use in our project. This gave us better clarity on the road signs that appeared in the video. We recorded five drive-throughs; each had different signs, and the vehicle speed was at the speed limit assigned for each route. We then extracted the GPX from the footage; GPX is a GPS data format that, by extraction, can enable us to analyze the routes that have been traveled in the recorded footage.
Since our experiment was conducted in a VR environment, we needed a device that could support high-quality video when it is being shown to the user. Hence, HP Omnicept Reverb G2 was used, which helped us deliver the resolution that needed to be displayed.
HP Omnicept Reverb G2 is one of the VR headsets that, besides giving a high display resolution compared to its competitors, provides a range of physiological data using its integrated sensors that are available in the HMD, such as eye tracking, cognitive load, and heart rate. All these data can be accessed through the SDK that was provided with the HMD.
Eye-tracking data were recorded at 120 frames per second, while heart rate data were recorded every 5 s with the available PPG (Photoplethysmography) sensors that detected the blood volume changes using light signals that reflected the forehead skin. The cognitive load recorded the first data after receiving the first eye-tracking information within 45 s.
To make the observation better, we used an overlay that was specifically designed for the HMD headset to display physiological data such as eye movement, heart rate, and cognitive load (Figure 4). The overlay was added in the OBS studio where the session was being recorded. The overlay can visualize multiple physiological data such as cognitive load, heart rate, and participants’ eye movements (Figure 5).
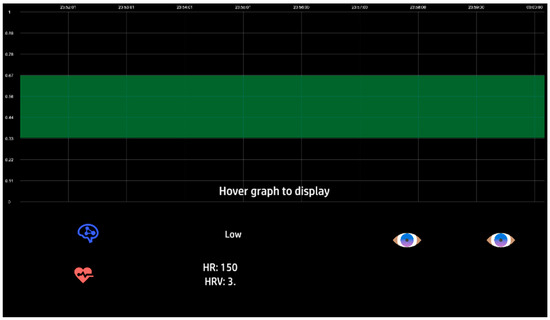
Figure 5.
Physiological data overlay.
6.4. Stimuli and Task
A total of 16 road signs were used in the experiments. The list is depicted in Table 1. Each drive covered four to five signs from the list (Figure 6).

Table 1.
Number and types of road signs shown in the project.
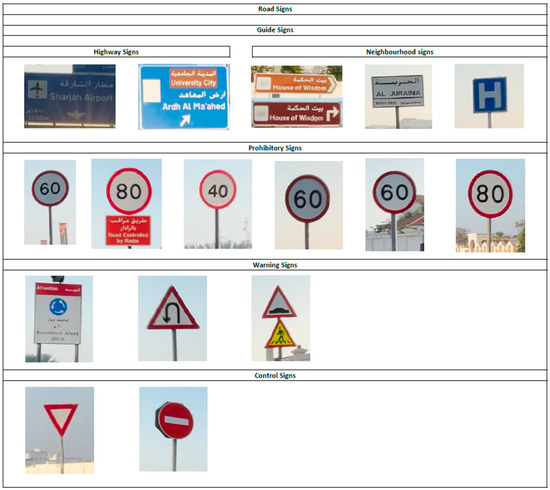
Figure 6.
All road signs that were evaluated in the video experiment.
Questions that were related to operative memory, e.g., speed signs, were in a multiple-choice format, where the participant selected one answer (Figure 7).
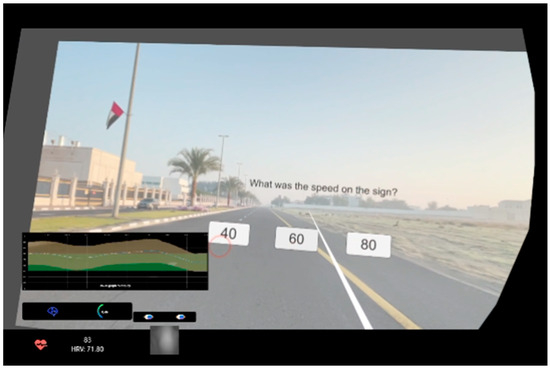
Figure 7.
Multiple choice question from a user’s perspective.
Before we began the experiment with our participants, we gave them brief instructions about the experiment. Once the participants were informed, they were required to sign consent and ethical forms to take part in the work.
Next, the participants wore the HMD and started the experiment by pressing the start button once they were comfortable with the device. During the experiment, the participant came across questions related to the road signs in the videos. Whenever the user responded to one of the questions appearing on the screen, the response time and the answers were stored as a plain text (.txt) file.
In alignment with the proposed hypothesis, the study involved the recording of various data points, including eye-tracking metrics, heart rate, and cognitive load. These measurements were facilitated through the available sensors integrated into the HMD, which was utilized during the experimental sessions. After each required trial, the gathered data were stored and compiled into a comprehensive .txt file (see Figure 8). This aggregation of data into .txt files served as the foundation for subsequent analysis, allowing for the conversion of these intricate datasets into visual representations such as charts and graphs. This analytical process proved instrumental in deciphering and elucidating the experiment’s outcomes, aligning with the study’s overarching aim to investigate the multifaceted variables outlined in the hypothesis.
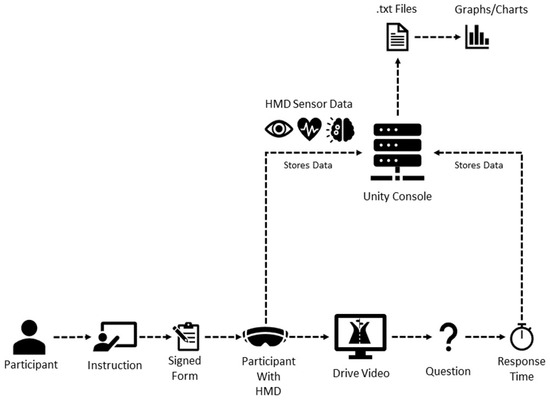
Figure 8.
Schema shows the steps made throughout the project.
7. Results
As illustrated in Figure 8, which shows the schema of the study protocol, we gathered 26 responses across two video experiments we had prepared. A total of 5 out of the 20 participants were unable to continue after finishing the first experiment; additionally, one participant was unable to complete any of the experiments due to the nausea induced by the HMD.
We compared the collected responses with the exact time that each sign appeared in the participants’ view. This measure showed us how fast participants reacted once they got a question regarding one of the road signs in the experience. In Figure 7, visualizing cognitive load helps us pinpoint when the participant is focused during the experiment using the overlay provided by HP Omnicept.
To better understand the results, we compared video 1 and video 2 responses from 23 participants. In this experiment, we analyzed the results based on conditions such as missed responses, fast responses, average response time per question, and recall based on operative memory responses, all of which were carefully considered based on the literature findings in relation to the nature of required tasks from participants [72,73] and the acquisition instrument [59,60,61,74].
Figure 9 shows the responses across video 1 and video 2. Note that each video has different questions. Since each video has different questions, there are reasons why participants missed or answered the questions incorrectly.
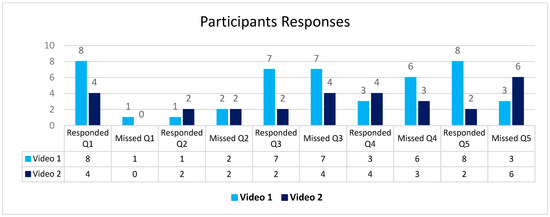
Figure 9.
Participant responses from videos 1 and 2.
In Question 1 of the experiment, we asked how quickly the participants could spot the car plate in video 1. In video 2, we asked for the airport sign, which was obfuscated as a silhouette as the sun was setting at 40°; none of the participants were able to identify it, which is in line with the findings of similar work [54,75,76,77,78,79].
For Question 2, we asked to identify a hospital sign and “bait al hikmah”, located at a specific location (25.31838, 55.50612). Since we have the route of the drives aligned with time, the timing of the question was mapped to appear 6 s before the sign, which, in terms of distance, translates into approximately 700 m that were estimated and verified during the pilot to represent a typical real scenario for initial recognition, processing, and reaction to the intended sign [80,81]; however, the participants seemed to overlook signs that ask for a particular location which could be related to the influence of the road curve, size, placement, and height of the sign, in addition to perceptual issues, ages, and other factors [41,45,72,74,81]. In Question 3, we asked about the speed on the signs; in video 1, the speed sign was located after a roundabout, while the speed sign in video 2 was located where speed warning signs are typically placed at approximately 70 m closer to the start of the intended speed change when the advisory speed is within 60 km/h range [82] as it is the case of this sign. Participants were more likely to miss the signs placed near the roundabout.
In Question 4, six participants missed the sign since, in video 1, the sign was located on the curve of a roundabout. Finally, in Question 5, the participants struggled to read smaller fonts or confused 200 with 500 m written on the sign, which indicated the distance to the next roundabout in video 2 [83,84]. The following summarizes the results based on our observations across video 1 and video 2:
- Participants struggled to see signs placed near a roundabout, and some participants had difficulty seeing a sign with sun-glare in the afternoon or morning hours as the sun shone through drivers’ windshields at 45°.
- Participants struggled to identify the number on some of the speed signs due to them having small fonts.
- Participants ignored signs that were related to a specific location, e.g., Bait al-Hikmah
We then analyzed the average response time per question in video 1 and video 2. There is a set of conditions that influenced recorded response times. Questions that required the participants to identify the signs had a maximum of 5 s response time to be evaluated as a fast response time. In contrast, questions that challenge the operative memory, e.g., the multiple-choice questions, had a maximum of 7 s response time. Figure 10 shows how many participants have a fast response and correct answers.
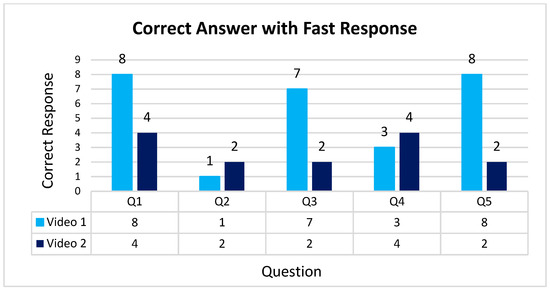
Figure 10.
Each question with correct answer fast response time in videos 1 and 2.
According to Figure 10, most of the questions that the participants answered had good response times. Meanwhile, Question 1 in video 2 and Question 2 in video 1 had a 6-s response time, indicating that the maximum response time can vary according to the road type, conditions, and time of the day, notwithstanding the fact of the differences between the individual participants. Question 1 in video 2 made the participant wait longer to see the sign since there was sunlight obfuscating the sign, while in Question 2 of video 1, the hospital sign was right before the roundabout, which made the participant not pay much attention to the sign.
According to the data collected, we found that 44% of the participants had correct responses (Figure 11). Additionally, the significance value for the analyzed cognitive load shows that the participants’ responses are statistically significant, which means that the responses are unlikely to result from chance, as discussed later in the paper. Furthermore, in Figure 12, participants’ response time was quicker to the multiple-choice questions aimed at identifying a road sign at a distance. This can be attributed to participants’ focus on scanning and locating the asked road sign during the experiment [83,84,85].
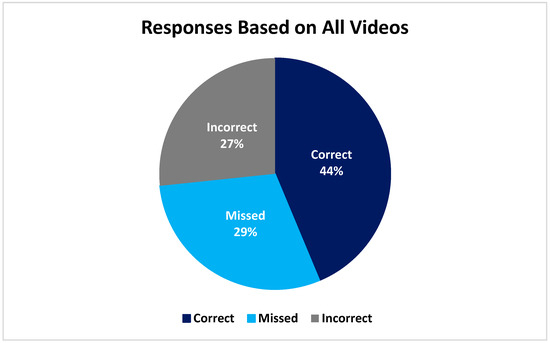
Figure 11.
Responses based on all videos.
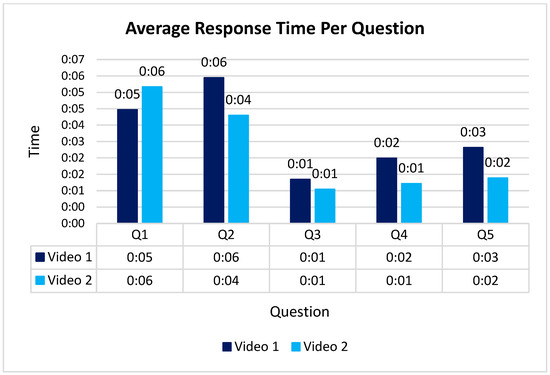
Figure 12.
Average response time in each question from videos 1 and 2.
In the context of human visual search strategies, particularly in way-finding scenarios and the interpretation of visual signs, the data captured and illustrated in Figure 13 through eye-tracking technology provides valuable insights. The scatter plot represents comprehensive eye-tracking data collected from all participants across various videos. Specifically, the eye-tracking system integrated into the headset meticulously records the X and Y axes of the participants’ gazes. While measuring the depth of eye gaze, the Z axis was not a primary focus for our experiment; the plotted data reveal a significant concentration indicative of how participants visually engaged with the videos. This concentration may offer critical implications about how humans navigate and concentrate their visual attention in way-finding tasks, shedding light on the nuanced cognitive activities involved in processing and interpreting visual signs for efficient navigation. The visualization of these data aids in understanding the strategies employed by individuals when engaged in way-finding activities and their cognitive processing of visual signage. Figure 14 depicts the Q-Q plots for eye-tracking.
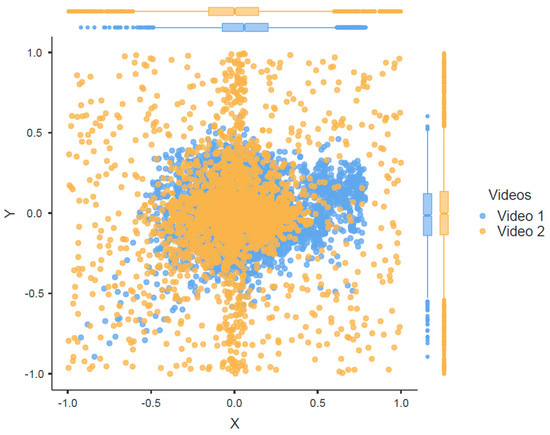
Figure 13.
Participants’ eye-tracking across all videos.
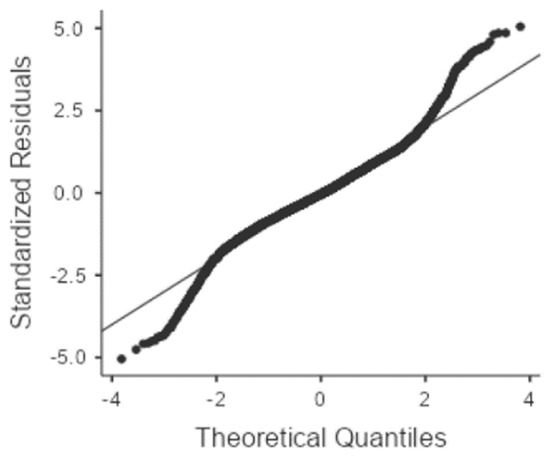
Figure 14.
Q-Q plot for eye-tracking.
Statistical Analysis of Eye-Tracking, Cognitive Load, and Heart Rate in Relation to Video Content
The statistical analysis of the eye-tracking data was performed using SPSS. Firstly, the correlation matrix for eye tracking between X and Y values was computed. As provided in Table 2, the provided correlation matrix illustrates the relationship between variables X and Y based on various correlation coefficients (Pearson’s r, Spearman’s rho, Kendall’s Tau B) and their respective p-values, indicating the statistical significance of these relationships.

Table 2.
Correlation matrix for eye tracking between X and Y values.
The correlation coefficients for the variables X and Y suggested a weak positive relationship across all three correlation measures (Pearson’s r = 0.079, Spearman’s rho = 0.041, Kendall’s Tau B = 0.029). Each correlation coefficient had a p-value of less than 0.001, indicating a high level of statistical significance.
These results suggest a statistically significant but weak positive correlation between variables X and Y in the context of eye-tracking data. The findings could imply that as variable X changes, variable Y also tends to change, but the relationship is not particularly strong based on the correlation coefficients. It is crucial to note that while statistically significant, the correlation is not substantial, which might indicate a limited or indirect relationship between X and Y in the eye-tracking data.
Table 3 presents the results of the one-sample t-test for eye-tracking. For variable X, the One Sample T-Test shows a significant difference from the null hypothesis (Ha μ ≠ 0) with a high t-statistic of 14.39 (df = 7092) and a p-value of less than 0.001. This significant t-statistic indicates that the mean value of variable X is significantly different from zero. The effect size (Cohen’s d) is 0.1709, signifying a small effect but still statistically significant. The 95% confidence interval (CI) for the effect size ranges from 0.1474 to 0.19432.

Table 3.
Eye-tracking t-tests.
In contrast, for variable Y, the One Sample T-Test does not show a significant difference from the null hypothesis (Ha μ ≠ 0) with a t-statistic of −1.43 (df = 7179) and a p-value of 0.153, which is higher than the commonly used significance level of 0.05. Therefore, this indicates that the mean value of variable Y is not significantly different from zero. The effect size (Cohen’s d) is minimal (−0.0169), suggesting a negligible effect, and the 95% confidence interval for the effect size crosses zero, indicating an inconclusive effect.
Additionally, the descriptive statistics table provides the mean, median, standard deviation (SD), and standard error (SE) for variables X and Y. For variable X, the mean is 0.04865 with a standard deviation of 0.285, and for variable Y, the mean is −0.0044 with a standard deviation of 0.261.
Furthermore, Table 4 showcases the results of the paired samples test, explicitly examining the cognitive load of each participant across different videos. The test aims to identify significant differences in cognitive load within each video compared to time. The table presents paired differences, the t-statistic, degrees of freedom (df), significance (p-values), and descriptive statistics. For video 1, it was noted that all participants (participants 1–18) displayed substantial differences in cognitive load as indicated by the high t-statistics and low p-values (all “<0.001”). This is to confirm the statistically significant variation in cognitive load for each participant within video 1. In video 2, similar significant differences in cognitive load were observed among various participants (participants 2, 3, 7, 8, 11, 12, 13, 15, and 16), highlighted by low p-values (“<0.001”) and high t-statistics.

Table 4.
Sample t-test between cognitive load and time for every participant in every video.
These results suggest that, for both video 1 and video 2, some participants exhibit noteworthy variations in cognitive load concerning time. However, not all participants within video 2 demonstrate this significant discrepancy, implying potential distinctions in cognitive load response among participants based on the presented visual stimuli, speed, and placement.
Overall, the results from the paired samples test between cognitive load and time for different participants across the videos highlight significant variations in cognitive load, providing insights into how different content or factors within each video might influence the cognitive demands experienced by individuals, which is an indication of how highly contextual this assessment was, specifically pertaining to the participants’ individual characteristics, road type, speed and type/size and placement of the sign, in addition to the typographical variations [67,68,80,81,82,84,86,87].
Finally, Table 5 recapitulates the results of the paired samples test for the heart rate of individual participants across both videos, aiming to identify significant differences in heart rate concerning time for each participant.

Table 5.
Sample t-test between heart rate and time for every participant in every video.
In video 1, several participants (participants 1, 2, 3, 4, 7, 8, 9, 10, 11, 12, 13, 14, 15, 16, 18) exhibited substantial variations in heart rate with very low p-values (“<0.001”) and relatively high t-statistics, indicating a statistically significant difference in heart rate compared to time for these participants within video 1. Similarly, in video 2, several participants (participants 5, 6, 8, 11, 12, 13, 15, 16, 2, 3, 7, 18) exhibit significant differences in heart rate concerning time, highlighted by low p-values (“<0.001”) and high t-statistics.
These results suggest that, for both video 1 and video 2, various participants demonstrate considerable differences in heart rate concerning time. However, some participants within video 2, notably participant 16, showed a moderate t-statistic and a p-value slightly higher than 0.05 (0.041), indicating a less significant difference in heart rate compared to time variance.
Overall, the outcomes of the paired samples test between heart rate and time for different participants across the videos emphasize notable variations in heart rate, providing insights into how different content or other factors within each video might influence the physiological response in terms of heart rate among individuals.
8. Discussion and Conclusions
There is a significant gap in the literature regarding the use of VR technology to assess the legibility and comprehension of Arabic road signs across GCC [84,88,89]. Previous research performed in this field predominantly relied on survey-based methodologies. These traditional approaches fail to leverage VR’s immersive and interactive nature to help create a realistic and engaging environment for studying legibility while maintaining consistency with existing research findings that drivers could correctly identify 77% of presented signs [88].
By utilizing VR Technologies, we were able to capture multiple data that can determine whether road signs are legible or not, such as eye tracking to observe participant’s gaze movements, cognitive load, and even heart rate. Both approaches have their advantages and limitations [64,66,70,90,91,92].
Experimenting with virtual reality presented several challenges, including but not limited to the probability of participants experiencing nausea while using a VR headset for the first time [64]. Furthermore, the required time to conduct experiments in a virtual setting was comparatively longer, resulting in fewer participants. However, these limitations were outweighed by the immersive VR environment, which resembles being in a real driving scenario.
In contrast, traditional approaches like surveys allow for a larger participant pool. However, it can result in less accurate results compared to the virtual environment. Surveys typically present the road signs in higher quality (digitized) [70,90]. It fails to consider factors such as occlusion caused by sunlight reflection and driving distractions that were found to be crucial factors in real-life scenarios as we believe they can alter the results obtained. These types of factors are not presented or visualized in survey-based experiments.
As we conclude, the current study has investigated the legibility of Arabic road signs using a VR environment. The results presented in this study suggest that immersive and eye-tracking techniques, while challenging, offer wider opportunities for studying legibility in a realistic but controlled environment since they can capture biometric data that reveal different insights for the community.
According to our findings, legibility is critical in ensuring road safety and effective communication with drivers. Clear and easy road signs will assist in providing essential, timely information, guiding navigation, and further reducing accidents or confusion on the road. This result aligns with several reported findings for research conducted within similar settings with bilingual signs using English and other foreign languages on the road signs [93,94,95,96,97,98]. The authors reported that the characteristics of road signs, such as the density of information on the sign, length of content, illumination, color, placement height, and approximation with the speed limit, all have a significant association with timely response and potential traffic hazards. Hence, VR can be a valuable platform that can contribute to the design and improvement of road signage systems to efficiently circumvent these issues. In the current paradigm, using cognitive load and other tacit biometric data related to active cognitive processes presents new horizons for research opportunities and challenges in this domain. Hence, further research should be considered, particularly so since such an approach allows researchers to use eye-gazing data triangulated with additional non-invasive Electroencephalography (EEG) devices such as OPEN BCI or EMOTIV EPOC X that have the potential of brain rhythm sensing to corroborate concluded results.
While this study represents a significant step in understanding the legibility of road signs, there are some limitations to acknowledge.
Although the present environment was immersive, it may not fully replicate the complexity and dynamics of real-world driving conditions, considering that the experiment took place in a controlled setting owing to safety concerns. However, unlike synthetic data (3d-generated) simulated in several comparative studies, the data that have been imported into the scene and used are of a natural/actual setting to make sure different settings are not necessarily made ideal for testing, as it is usually the case with drivers going into actual challenges driving on different road conditions, speeds, and with the influence of other operators. We also acknowledge the limitation in sample size that may not fully capture the diversity of drivers’ experiences and preferences. However, the findings presented in this study profoundly lay the ground for understanding and developing standardized legibility guidelines that can enhance and improve the overall driving experience (legibility, safety, urban planning) in addition to traffic signs’ design and placement in the real world. Finally, as we plan for further work in this area, we encourage our peers in the domain to further look into these limitations as an opportunity and a challenge that we realize demands further research in the field, not only to bridge the knowledge gaps but to help save lives on the road.
Author Contributions
M.L. Conceptualization, methodology, administration, writing and revisions. N.A. Validation, analysis, writing and editing. S.E. Analysis, methodology, writing and editing. S.G. Implementation, validation analysis, writing and editing. All authors have read and agreed to the published version of the manuscript.
Funding
This research did not receive any specific grant from funding agencies in the public, commercial, or not-for-profit sectors.
Data Availability Statement
The data that support the findings of this study are available upon request from the corresponding author.
Conflicts of Interest
The authors declare no conflicts of interest.
References
- Bucchi, A.; Sangiorgi, C.; Vignali, V. Traffic Psychology and Driver Behavior. Procedia-Soc. Behav. Sci. 2012, 53, 972–979. [Google Scholar] [CrossRef]
- Oviedo-Trespalacios, O.; Truelove, V.; Watson, B.; Hinton, J.A. The impact of road advertising signs on driver behaviour and implications for road safety: A critical systematic review. Transp. Res. Part A Policy Pract. 2019, 122, 85–98. [Google Scholar] [CrossRef]
- Tejero, P.; Insa, B.; Roca, J. Reading Traffic Signs While Driving: Are Linguistic Word Properties Relevant in a Complex, Dynamic Environment? J. Appl. Res. Mem. Cogn. 2019, 8, 202–213. [Google Scholar] [CrossRef]
- Garvey, P.M.; Klena, M.J.; Eie, W.-Y.; Meeker, D.T.; Pietrucha, M.T. Legibility of the Clearview Typeface and FHWA Standard Alphabets on Negative- and Positive-Contrast Signs. Transp. Res. Rec. J. Transp. Res. Board 2016, 2555, 28–37. [Google Scholar] [CrossRef]
- Bullough, J.D.; Skinner, N.P.; O’Rourke, C.P. Legibility of urban highway traffic signs using new retroreflective materials. Transport 2010, 25, 229–236. [Google Scholar] [CrossRef]
- Dobres, J.; Chrysler, S.T.; Wolfe, B.; Chahine, N.; Reimer, B. Empirical Assessment of the Legibility of the Highway Gothic and Clearview Signage Fonts. Transp. Res. Rec. J. Transp. Res. Board 2017, 2624, 1–8. [Google Scholar] [CrossRef]
- Garvey, P.M.; Pietrucha, M.T.; Meeker, D. Effects of Font and Capitalization on Legibility of Guide Signs. Transp. Res. Rec. J. Transp. Res. Board 1997, 1605, 73–79. [Google Scholar] [CrossRef]
- Gene Hawkins, H., Jr.; Picha, D.L.; Wooldridge, M.D.; Greene, F.K.; Brinkmeyer, G. Performance Comparison of Three Freeway Guide Sign Alphabets. Transp. Res. Rec. J. Transp. Res. Board 1999, 1692, 9–16. [Google Scholar] [CrossRef]
- Al-Madani, H. Prediction of Drivers’ Recognition of Posted Signs in Five Arab Countries. Percept. Mot. Ski. 2001, 92, 72–82. [Google Scholar] [CrossRef]
- Al-Madani, H.; Al-Janahi, A.-R. Assessment of drivers’ comprehension of traffic signs based on their traffic, personal and social characteristics. Transp. Res. Part F Traffic Psychol. Behav. 2002, 5, 63–76. [Google Scholar] [CrossRef]
- Ghadban, N.R.; Abdella, G.M.; Alhajyaseen, W.; Al-Khalifa, K.N. Analyzing the Impact of Human Characteristics on the Comprehensibility of Road Traffic Signs. In Proceedings of the International Conference on Industrial Engineering and Operations Management, Bandung, Indonesia, 6–8 March 2018; pp. 2210–2219. [Google Scholar]
- Mahgoub, A.O.; Choe, P. Comparing Design Preference of Guide Road Signs by Native Arabic Speakers and International Speakers in the State of Qatar. In Proceedings of the 2020 IEEE International Conference on Industrial Engineering and Engineering Management (IEEM), Singapore, 14–17 December 2020; pp. 504–508. [Google Scholar] [CrossRef]
- Taamneh, M.; Alkheder, S. Traffic sign perception among Jordanian drivers: An evaluation study. Transp. Policy 2018, 66, 17–29. [Google Scholar] [CrossRef]
- Beier, S.; Oderkerk, C.A.T. High letter stroke contrast impairs letter recognition of bold fonts. Appl. Ergon. 2021, 97, 103499. [Google Scholar] [CrossRef] [PubMed]
- Slattery, T.J.; Rayner, K. The influence of text legibility on eye movements during reading. Appl. Cogn. Psychol. 2010, 24, 1129–1148. [Google Scholar] [CrossRef]
- Franken, G.; Pangerc, M.; Možina, K. Impact of Typeface and Colour Combinations on LCD Display Legibility. Emerg. Sci. J. 2020, 4, 436–442. [Google Scholar] [CrossRef]
- Dijanić, H.; Jakob, L.; Babić, D.; Garcia-Garzon, E. Driver eye movements in relation to unfamiliar traffic signs: An eye tracking study. Appl. Ergon. 2020, 89, 103191. [Google Scholar] [CrossRef] [PubMed]
- Reingold, E.M.; Rayner, K. Examining the Word Identification Stages Hypothesized by the E-Z Reader Model. Psychol. Sci. 2006, 17, 742–746. [Google Scholar] [CrossRef] [PubMed]
- Henderson, J.M. Gaze Control as Prediction. Trends Cogn. Sci. 2017, 21, 15–23. [Google Scholar] [CrossRef] [PubMed]
- Torralba, A.; Oliva, A.; Castelhano, M.S.; Henderson, J.M. Contextual guidance of eye movements and attention in real-world scenes: The role of global features in object search. Psychol. Rev. 2006, 113, 766–786. [Google Scholar] [CrossRef] [PubMed]
- Goldberg, J.H.; Wichansky, A.M. Eye Tracking in Usability Evaluation: A Practitioner’s Guide. In The Mind’s Eye: Cognitive and Applied Aspects of Eye Movement Research; Elsevier: Amsterdam, The Netherlands, 2003; pp. 493–516. Available online: https://www.researchgate.net/publication/259703518 (accessed on 18 March 2024). [CrossRef]
- Valdois, S.; Roulin, J.-L.; Bosse, M.L. Visual attention modulates reading acquisition. Vis. Res. 2019, 165, 152–161. [Google Scholar] [CrossRef] [PubMed]
- Klaib, A.F.; Alsrehin, N.O.; Melhem, W.Y.; Bashtawi, H.O.; Magableh, A.A. Eye tracking algorithms, techniques, tools, and applications with an emphasis on machine learning and Internet of Things technologies. Expert Syst. Appl. 2021, 166, 114037. [Google Scholar] [CrossRef]
- Kiefer, P.; Giannopoulos, I.; Raubal, M.; Duchowski, A. Eye tracking for spatial research: Cognition, computation, challenges. Spat. Cogn. Comput. 2017, 17, 1–19. [Google Scholar] [CrossRef]
- Arditi, A.; Cho, J. Serifs and Font Legibility. Vis. Res. 2005, 45, 2926–2933. [Google Scholar] [CrossRef] [PubMed]
- Mansfield, J.S.; Legge, G.E.; Bane, M.C. Psychophysics of Reading. XV: Font Effects in Normal and Low Vision. Investig. Ophthalmol. Vis. Sci. 1996, 37, 1492–1501. [Google Scholar]
- Tinker, M.A. Influence of simultaneous variation in size of type, width of line, and leading for newspaper type. J. Appl. Psychol. 1963, 47, 380–382. [Google Scholar] [CrossRef]
- Rayner, K. Eye movements in reading and information processing: 20 years of research. Psychol. Bull. 1998, 124, 372–422. [Google Scholar] [CrossRef] [PubMed]
- Rayner, K.; Reichle, E.D.; Stroud, M.J.; Williams, C.C.; Pollatsek, A. The effect of word frequency, word predictability, and font difficulty on the eye movements of young and older readers. Psychol. Aging 2006, 21, 448–465. [Google Scholar] [CrossRef] [PubMed]
- Schieber, F.; Burns, D.M.; Myers, J.; Willan, N.; Gilland, J. Driver Eye Fixation and Reading Patterns while Using Highway Signs under Dynamic Nighttime Driving Conditions: Effects of Age, Sign Luminance and Environmental Demand. In Proceedings of the 83rd Annual Meeting of the Transportation Research Board, Washington, DC, USA, 11–15 January 2004. [Google Scholar]
- Carlson, P.; Miles, J.; Park, E.S.; Young, S.; Chrysler, S.; Clark, J. Development of a Model Performance-Based Sign Sheeting Specification Based on the Evaluation of Nighttime Traffic Signs Using Legibility and Eye-Tracker Data; Texas Transportation Institute: Bryan, TX, USA, 2010. [Google Scholar]
- Rockwell, T.H.; Overby, C.; Mourant, R.R. Drivers’ Eye Movements: An Apparatus and Calibration. Highw. Res. Rec. 1968, 247, 29–42. [Google Scholar]
- Mourant, R.R.; Rockwell, T.H. Mapping eye-movement patterns to the visual scene in driving: An exploratory study. Hum. Factors: J. Hum. Factors Ergon. Soc. 1970, 12, 81–87. [Google Scholar] [CrossRef] [PubMed]
- Bhise, V.D.; Rockwell, T.H. Development of a Methodology for Evaluating Road Signs. In Bull 207 Final Report; Elsevier: Amsterdam, The Netherlands, 1973. [Google Scholar]
- Forbes, T.W.; Saari, B.B.; Greenwood, W.H.; Goldblatt, J.G.; Hill, T.E. Luminance and contrast requirements for legibility and visibility of highway signs. Transp. Res. Rec. 1976, 562, 59–72. [Google Scholar]
- Richards, O.W. Effects of luminance and contrast on visual acuity, ages 16 to 90 years. Am. J. Optom. Physiol. Opt. 1977, 54, 178–184. [Google Scholar] [CrossRef]
- Silavi, T.; Hakimpour, F.; Claramunt, C.; Nourian, F. The Legibility and Permeability of Cities: Examining the Role of Spatial Data and Metrics. ISPRS Int. J. Geo-Inf. 2017, 6, 101. [Google Scholar] [CrossRef]
- Rackoff, N.J.; Rockwell, T.H. Driver Search and Scan Patterns in Night Driving. Transp. Res. Board Spec. Rep. 1975, 156, 53–63. [Google Scholar]
- Shinar, D.; McDowell, E.D.; Rackoff, N.J.; Rockwell, T.H. Field Dependence and Driver Visual Search Behavior. Hum. Factors 1978, 20, 553–559. [Google Scholar] [CrossRef]
- USDHWA. Workshops on Nighttime Visibility of Traffic Signs: Summary of Workshop Findings. 2002. Available online: https://highways.dot.gov/safety/other/visibility/workshops-nighttime-visibility-traffic-signs-summary-workshop-findings-7 (accessed on 18 March 2024).
- Yin, Y.; Wen, H.; Sun, L.; Hou, W. The Influence of Road Geometry on Vehicle Rollover and Skidding. Int. J. Environ. Res. Public Health 2020, 17, 1648. [Google Scholar] [CrossRef] [PubMed]
- Olson, P.L.; Bernstein, A. The Nighttime Legibility of Highway Signs as a Function of Their Luminance Characteristics. Hum. Factors J. Hum. Factors Ergon. Soc. 1979, 21, 145–160. [Google Scholar] [CrossRef] [PubMed]
- Lai, C.J. Effects of color scheme and message lines of variable message signs on driver performance. Accid. Anal. Prev. 2010, 42, 1003–1008. [Google Scholar] [CrossRef] [PubMed]
- Zwahlen, H.T. Traffic sign reading distances and times during night driving. Transp. Res. Rec. 1995, 1495, 140–146. [Google Scholar]
- Zwahlen, H.T.; Russ, A.; Schnell, T. Viewing Ground-Mounted Diagrammatic Guide Signs Before Entrance Ramps at Night: Driver Eye Scanning Behavior. Transp. Res. Rec. J. Transp. Res. Board 2003, 1843, 61–69. [Google Scholar] [CrossRef]
- Hudák, M.; Madleňák, R. The Research of Driver’s Gaze at the Traffic Signs. CBU Int. Conf. Proc. 2016, 4, 896–899. [Google Scholar] [CrossRef]
- Sawyer, B.D.; Dobres, J.; Chahine, N.; Reimer, B. The Cost of Cool: Typographic Style Legibility in Reading at a Glance. Proc. Hum. Factors Ergon. Soc. Annu. Meet. 2017, 61, 833–837. [Google Scholar] [CrossRef]
- Wang, L.G. Influence of different highway traffic signs on driver’s gaze behavior based on visual characteristic analysis. Adv. Transp. Stud. 2021, 53, 211–219. [Google Scholar]
- BoutrosFonts. Boutros Advertisers Naskh—Boutros Fonts—Arabic Font Design Experts. 1977. Available online: https://www.boutrosfonts.com/Boutros-Advertisers-Naskh.html (accessed on 18 March 2024).
- Department of Municipalities and Transport. Abu Dhabi Manual on Uniform Traffic Control Devices (MUTCD); Department of Municipalities and Transport: Abu Dhabi, United Arab Emirates, 2020.
- Ismail, A.A.-I. Comprehension of Posted Highway Traffic Signs in Iraq. Tikrit J. Eng. Sci. 2012, 19, 62–70. [Google Scholar] [CrossRef]
- Abu-Rabia, S. Reading in Arabic Orthography: The Effect of Vowels and Context on Reading Accuracy of Poor and Skilled Native Arabic Readers in Reading Paragraphs, Sentences, and Isolated Words. J. Psycholinguist. Res. 1997, 26, 465–482. [Google Scholar] [CrossRef] [PubMed]
- Jamoussi, R.; Roche, T. Road sign romanization in Oman: The linguistic landscape close-up. Aust. Rev. Appl. Linguist. 2017, 40, 40–70. [Google Scholar] [CrossRef]
- Jamson, S.L.; Tate, F.N.; Jamson, A.H. Evaluating the effects of bilingual traffic signs on driver performance and safety. Ergonomics 2005, 48, 1734–1748. [Google Scholar] [CrossRef][Green Version]
- Lemonakis, P.; Kourkoumpas, G.; Kaliabetsos, G.; Eliou, N. Survey and Design Consistency Evaluation in Two-Lane Rural Road Segments. WSEAS Trans. Syst. Control 2022, 17, 50–55. [Google Scholar] [CrossRef]
- Sloboda, M.; Szabó-Gilinger, E.; Vigers, D.; Šimičić, L. Carrying out a language policy change: Advocacy coalitions and the management of linguistic landscape. Curr. Issues Lang. Plan. 2010, 11, 95–113. [Google Scholar] [CrossRef]
- Street, J.; Papaix, C.; Yang, T.; Büttner, B.; Zhu, H.; Ji, Q.; Lin, Y.; Wang, T.; Lu, J. Street Usage Characteristics, Subjective Perception and Urban Form of Aging Group: A Case Study of Shanghai, China. Sustainability 2022, 14, 5162. [Google Scholar] [CrossRef]
- Wang, J.; Xiong, C.; Lu, M.; Li, K. Longitudinal driving behaviour on different roadway categories: An instrumented-vehicle experiment, data collection and case study in China. IET Intell. Transp. Syst. 2015, 9, 555–563. [Google Scholar] [CrossRef]
- Eißfeldt, H.; Bruder, C. Using eye movements parameters to assess monitoring behavior for flight crew selection. In Psicologia: Teoria e Prática; 2009; Available online: https://www.academia.edu/23413635/Using_eye_movements_parameters_to_assess_monitoring_behavior_for_flight_crew_selection (accessed on 18 March 2024).
- Kirkby, J.A.; Blythe, H.I.; Drieghe, D.; Benson, V.; Liversedge, S.P. Investigating eye movement acquisition and analysis technologies as a causal factor in differential prevalence of crossed and uncrossed fixation disparity during reading and dot scanning. Behav. Res. Methods 2013, 45, 664–678. [Google Scholar] [CrossRef][Green Version]
- Oliveira, D.G.; Mecca, T.P.; Botelho, P.; Ivan, S.; Pinto, S.; Macedo, E.C. Text Complexity and Eye Movements Measures in Adults Readers. Psicologia: Teoria e Prática 2013, 15, 163–174. [Google Scholar]
- Bhargava, A.; Bertrand, J.W.; Gramopadhye, A.K.; Madathil, K.C.; Babu, S.V. Evaluating multiple levels of an interaction fidelity continuum on performance and learning in near-field training simulations. IEEE Trans. Vis. Comput. Graph. 2018, 24, 1418–1427. [Google Scholar] [CrossRef]
- Luo, Y.; Ahn, S.; Abbas, A.; Seo, J.O.; Cha, S.H.; Kim, J.I. Investigating the impact of scenario and interaction fidelity on training experience when designing immersive virtual reality-based construction safety training. Dev. Built Environ. 2023, 16, 100223. [Google Scholar] [CrossRef]
- Ahn, S.J.; Nowak, K.L.; Bailenson, J.N. Unintended consequences of spatial presence on learning in virtual reality. Comput. Educ. 2022, 186, 104532. [Google Scholar] [CrossRef]
- Chowdhury, T.I.; Costa, R.; Quarles, J. Information recall in VR disability simulation. In Proceedings of the 2017 IEEE Symposium on 3D User Interfaces, 3DUI, Los Angeles, CA, USA, 18 March 2017; IEEE: New York, NY, USA, 2017; pp. 219–220. [Google Scholar] [CrossRef]
- Cummings, J.J.; Bailenson, J.N. How Immersive Is Enough? A Meta-Analysis of the Effect of Immersive Technology on User Presence. Media Psychol. 2016, 19, 272–309. [Google Scholar] [CrossRef]
- Ragan, E.D.; Sowndararajan, A.; Kopper, R.; Bowman, D. The effects of higher levels of immersion on procedure memorization performance and implications for educational virtual environments. Presence Teleoper. Virtual Environ. 2010, 19, 527–543. [Google Scholar] [CrossRef]
- Sinatra, A.; Pollard, K.; Oiknine, A.; Patton, D.; Ericson, M.; Dalangin, B. The Impact of Immersion Level and Virtual Reality Experience on Outcomes from Navigating in a Virtual Environment; SPIE: Bellingham, WA, USA, 2020; Volume 18. [Google Scholar] [CrossRef]
- Aeckersberg, G.; Gkremoutis, A.; Schmitz-Rixen, T.; Kaiser, E. The relevance of low-fidelity virtual reality simulators compared with other learning methods in basic endovascular skills training. J. Vasc. Surg. 2019, 69, 227–235. [Google Scholar] [CrossRef]
- Bracken, C.C. Presence and image quality: The case of high-definition television. Media Psychol. 2005, 7, 191–205. [Google Scholar] [CrossRef]
- Brade, J.; Lorenz, M.; Busch, M.; Hammer, N.; Tscheligi, M.; Klimant, P. Being there again—Presence in real and virtual environments and its relation to usability and user experience using a mobile navigation task. Int. J. Hum. Comput. Stud. 2017, 101, 76–87. [Google Scholar] [CrossRef]
- Azarby, S.; Rice, A. Understanding the Effects of Virtual Reality System Usage on Spatial Perception: The Potential Impacts of Immersive Virtual Reality on Spatial Design Decisions. Sustainability 2022, 14, 10326. [Google Scholar] [CrossRef]
- Xiong, J.; Hsiang, E.L.; He, Z.; Zhan, T.; Wu, S.T. Augmented reality and virtual reality displays: Emerging technologies and future perspectives. Light Sci. Appl. 2021, 10, 216. [Google Scholar] [CrossRef]
- Kahana, E.; Lovegreen, L.; Kahana, B.; Kahana, M. Person, environment, and person-environment fit as influences on residential satisfaction of elders. Environ. Behav. 2003, 35, 434–453. [Google Scholar] [CrossRef]
- Beier, S.; Oderkerk, C.A.T. Smaller visual angles show greater benefit of letter boldness than larger visual angles. Acta Psychol. 2019, 199, 102904. [Google Scholar] [CrossRef] [PubMed]
- Bernard, J.B.; Kumar, G.; Junge, J.; Chung, S.T.L. The effect of letter-stroke boldness on reading speed in central and peripheral vision. Vis. Res. 2013, 84, 33–42. [Google Scholar] [CrossRef] [PubMed]
- Burmistrov, I.; Zlokazova, T.; Ishmuratova, I.; Semenova, M. Legibility of light and ultra-light fonts: Eyetracking study. In Proceedings of the 9th Nordic Conference on Human-Computer Interaction, Gothenburg, Sweden, 23–27 October 2016; Association for Computing Machinery: New York, NY, USA, 2016. [Google Scholar] [CrossRef]
- Dyson, M.C.; Beier, S. Investigating typographic differentiation: Italics are more subtle than bold for emphasis. Inf. Des. J. 2016, 22, 3–18. [Google Scholar] [CrossRef]
- Castro, C.; Horberry, T. (Eds.) The Human Factors of Transport Signs; CRC Press: Boca Raton, FL, USA, 2004. [Google Scholar] [CrossRef]
- Priambodo, M.I.; Siregar, M.L. Road Sign Detection Distance and Reading Distance at an Uncontrolled Intersection. E3S Web Conf. 2018, 65, 09004. [Google Scholar] [CrossRef]
- Schnell, T.; Smith, N.; Cover, M.; Richey, C.; Stoltz, J.; Parker, B. Traffic Signs and Real-World Driver Interaction. Transp. Res. Rec. 2024. [Google Scholar] [CrossRef]
- Hawkins, H.G.; Brimley, B.K.; Carlson, P.J. Updated model for advance placement of turn and curve warning signs. Transp. Res. Rec. 2016, 2555, 111–119. [Google Scholar] [CrossRef]
- Cui, X.; Wang, J.; Gong, X.; Wu, F. Roundabout Recognition Method Based on Improved Hough Transform in Road Networks. Cehui Xuebao/Acta Geod. Et Cartogr. Sin. 2018, 47, 1670–1679. [Google Scholar] [CrossRef]
- Miniyar, K.P. Traffic Sign Detection and Recognition Methods, Review, Analysis and Perspectives. In Proceedings of the 14th International Conference on Advances in Computing, Control, and Telecommunication Technologies, ACT 2023, Hyderabad, India, 27–28 June 2022; pp. 2017–2024. [Google Scholar]
- Yu, M.; Ye, Y.; Zhao, X. Research on Reminder Sign Setting of Auxiliary Deceleration Lane Based on Short-Term Memory Characteristics. In CICTP 2020: Advanced Transportation Technologies and Development-Enhancing Connections—Proceedings of the 20th COTA International Conference of Transportation Professionals, Xi’an, China, 14–16 August 2020; American Society of Civil Engineers: Reston, VA, USA, 2020; pp. 2271–2277. [Google Scholar] [CrossRef]
- Akagi, Y.; Seo, T.; Motoda, Y. Influence of visual environments on visibility of traffic signs. Transp. Res. Rec. 1996, 1553, 53–58. [Google Scholar] [CrossRef]
- Schnell, T.; Yekhshatyan, L.; Daiker, R. Effect of luminance and text size on information acquisition time from traffic signs. Transp. Res. Rec. 2009, 2122, 52–62. [Google Scholar] [CrossRef]
- Al-Rousan, T.M.; Umar, A.A. Assessment of traffic sign comprehension levels among drivers in the emirate of abu dhabi, uae. Infrastructures 2021, 6, 122. [Google Scholar] [CrossRef]
- Shinar, D.; Dewar, R.E.; Summala, H.; Zakowska, L. Traffic sign symbol comprehension: A cross-cultural study. Ergonomics 2003, 46, 1549–1565. [Google Scholar] [CrossRef] [PubMed]
- Lee, Y.H.; Zhan, T.; Wu, S.T. Prospects and challenges in augmented reality displays. Virtual Real. Intell. Hardw. 2019, 1, 10–20. [Google Scholar] [CrossRef]
- Schroeder, B.L.; Bailey, S.K.T.; Johnson, C.I.; Gonzalez-Holland, E. Presence and usability do not directly predict procedural recall in virtual reality training. Commun. Comput. Inf. Sci. 2017, 714, 54–61. [Google Scholar] [CrossRef] [PubMed]
- Zhan, T.; Yin, K.; Xiong, J.; He, Z.; Wu, S.T. Augmented reality and virtual reality displays: Perspectives and challenges. iScience 2020, 23, 101397. [Google Scholar] [CrossRef] [PubMed]
- Ben-Bassat, T.; Shinar, D. The effect of context and drivers’ age on highway traffic signs comprehension. Transp. Res. Part F Traffic Psychol. Behav. 2015, 33, 117–127. [Google Scholar] [CrossRef]
- Choocharukul, K.; Sriroongvikrai, K. Striping, Signs, and Other Forms of Information. In International Encyclopedia of Transportation; Elsevier: Amsterdam, The Netherlands, 2021; Volume 1. [Google Scholar] [CrossRef]
- Cristea, M.; Delhomme, P. Facteurs influençant la lecture des automobilistes et leur compréhension de messages embarqués portant sur le trafic routier. Rev. Eur. Psychol. Appl. 2015, 65, 211–219. [Google Scholar] [CrossRef]
- Di Stasi, L.L.; Megías, A.; Cándido, A.; Maldonado, A.; Catena, A. Congruent visual information improves traffic signage. Transp. Res. Part F Traffic Psychol. Behav. 2012, 15, 438–444. [Google Scholar] [CrossRef]
- Kirmizioglu, E.; Tuydes-Yaman, H. Comprehensibility of traffic signs among urban drivers in Turkey. Accid. Anal. Prev. 2012, 45, 131–141. [Google Scholar] [CrossRef]
- Rajesh, R.; Gowri, D.R.; Suhana, N. The usability of road traffic signboards in kottayam. In Emerging Trends in Engineering, Science and Technology for Society, Energy and Environment—Proceedings of the International Conference in Emerging Trends in Engineering, Science and Technology, ICETEST 2018, Kerala, India, 18–20 January 2018; CRC Press: Boca Raton, FL, USA, 2018; pp. 323–328. [Google Scholar] [CrossRef]
Disclaimer/Publisher’s Note: The statements, opinions and data contained in all publications are solely those of the individual author(s) and contributor(s) and not of MDPI and/or the editor(s). MDPI and/or the editor(s) disclaim responsibility for any injury to people or property resulting from any ideas, methods, instructions or products referred to in the content. |
© 2024 by the authors. Licensee MDPI, Basel, Switzerland. This article is an open access article distributed under the terms and conditions of the Creative Commons Attribution (CC BY) license (https://creativecommons.org/licenses/by/4.0/).