Simple Summary
Sugemalimab showed improved survival outcomes for patients with advanced or metastatic gastric cancer in the GEMSTONE-303 trial. However, given its high cost, evaluating its cost-effectiveness is essential. We conducted a model-based economic evaluation to simulate and compare the cost-effectiveness of sugemalimab plus chemotherapy versus chemotherapy alone over 40 years, with the willingness-to-pay for one quality-adjusted life-year set at three times the 2024 GDP per capita. Compared to chemotherapy alone, adding sugemalimab resulted in an incremental gain of 0.39 quality-adjusted life-years at an additional cost of USD 47,020, leading to an incremental net monetary benefit of −USD 7478. Therefore, from the perspective of Taiwan’s healthcare payer, sugemalimab plus chemotherapy is not cost-effective for advanced or metastatic gastric cancer. Achieving cost-effectiveness would require a 20–30% price reduction for sugemalimab (to USD 1204–USD 1376 per 600 mg), assuming reimbursement is limited to the median treatment duration observed in the trial. If reimbursement continued until disease progression, a reduction of approximately 68% would be required (USD 550 per 600 mg).
Abstract
Background/Objectives: Sugemalimab demonstrated clinical efficacy in the GEMSTONE-303 trial, but its cost-effectiveness remains unclear. This study aims to evaluate the cost-effectiveness of sugemalimab in combination with chemotherapy (CAPOX) as a first-line treatment for patients with advanced or metastatic gastric or gastroesophageal junction (G/GEJ) adenocarcinoma, compared to chemotherapy alone, from the perspective of Taiwan’s healthcare payer. Methods: A partitioned survival model was developed to simulate outcomes over a 40-year time horizon, and model parameters were derived from GEMSTONE-303 and the wider literature. Health benefits were measured in quality-adjusted life-years (QALYs), and only direct medical costs were included, with both discounted at an annual rate of 3%. The willingness-to-pay threshold was set at three times the 2024 GDP per capita. Deterministic and probabilistic sensitivity analyses were conducted alongside scenario analyses. Results: Compared to capecitabine and oxaliplatin (CAPOX) alone, adding sugemalimab yielded an incremental gain of 0.39 QALYs at an additional cost of USD 47,020, resulting in an incremental net monetary benefit of −USD 7478. Conclusions: Sugemalimab plus CAPOX is not cost-effective for advanced or metastatic G/GEJ adenocarcinoma from the Taiwan payer’s perspective. Achieving cost-effectiveness would require a 20–30% price reduction for sugemalimab (to USD 1204–USD 1376 per 600 mg), assuming first-line therapy is administered for the median treatment duration observed in the GEMSTONE-303 trial. If reimbursement continued until disease progression, a reduction of approximately 68% would be required (USD 550 per 600 mg).
1. Introduction
Gastric cancer is the fifth leading cause of cancer-related death worldwide [1], with a particularly significant impact in certain regions, such as Andean Latin America and East Asia [2,3]. In Asian countries—including Japan, Mongolia, China, Korea, and Taiwan, which represent the most severely affected region globally—gastric cancer accounts for 2.06% to 4.04% of all deaths [2], underscoring its substantial disease burden. For advanced or metastatic gastric cancer, standard chemotherapy, typically a combination of fluoropyrimidine and oxaliplatin, has long been the primary treatment [4]. Recent advances, including the approval of immunotherapies and targeted therapies directed at specific biomarkers such as programmed cell death protein 1 (PD-1), human epidermal growth factor receptor 2 (HER2), and claudin 18.2, have significantly improved overall survival (OS) for these patients [4,5].
Several randomized controlled trials have demonstrated the superior efficacy of immunotherapies targeting PD-1 in advanced gastric cancer, including nivolumab (CheckMate-649, [6,7]), pembrolizumab (KEYNOTE-859, [8,9]), sintilimab (ORIENT-16, [10]), and tislelizumab (RATIONALE-305, [11]). The National Comprehensive Cancer Network recommends administering nivolumab, pembrolizumab, and tislelizumab [4], while the European Society for Medical Oncology suggests nivolumab and pembrolizumab for patients with HER2-negative tumors and a PD-L1 combined positive score (CPS) of 5 or higher [12].
Sugemalimab, a programmed death-ligand 1 (PD-L1) inhibitor, acts on a different component of the PD-1/PD-L1 signaling pathway from other inhibitors and has demonstrated promising results in advanced non-small cell lung cancer [13,14,15], esophageal squamous cell carcinoma [16], and gastric or gastroesophageal junction (G/GEJ) adenocarcinoma [17]. In the GEMSTONE-303 trial, sugemalimab achieved a hazard ratio of 0.66 (95% CI: 0.54–0.81) for progression-free survival (PFS) and 0.75 (95% CI: 0.61–0.92) for OS among patients with advanced or metastatic G/GEJ adenocarcinoma with a PD-L1 CPS ≥ 5 [17]. Sugemalimab is currently approved as a first-line treatment for metastatic non-small-cell lung cancer in the European Union [18], the United Kingdom [19], and China [20]. In China, its indication has recently been expanded to include unresectable, locally advanced, or metastatic G/GEJ adenocarcinoma with PD-L1 expression [21,22].
Taiwan’s National Health Insurance is a universal, single-payer system that covers over 99% of the population (approximately 23 million people). Currently, it only reimburses nivolumab as a first-line treatment for advanced or metastatic G/GEJ adenocarcinoma in patients with HER2-negative tumors and a PD-L1 CPS ≥ 5. Although two recent cost-effectiveness analyses from the perspective of China’s healthcare system concluded that sugemalimab is not cost-effective [23,24], differences in healthcare systems and direct medical costs between China and Taiwan limit the applicability of these findings to the Taiwanese context. Given the limited treatment options and the high costs associated with immunotherapies, particularly within a social insurance framework, it is essential to assess the cost-effectiveness of new therapies in Taiwan. Therefore, this study aims to evaluate the cost-effectiveness of sugemalimab in combination with capecitabine and oxaliplatin (CAPOX) as a first-line treatment for advanced or metastatic G/GEJ adenocarcinoma with a PD-L1 CPS ≥ 5 from the perspective of Taiwan’s healthcare payer. Additionally, this study seeks to recommend an economically justifiable price for sugemalimab.
2. Materials and Methods
2.1. Health Economic Analysis Plan
We adopted a three-state partitioned survival model comprising progression-free (PF), progressed disease (PD), and death states—a widely accepted approach in oncology—to evaluate the cost-effectiveness of sugemalimab plus CAPOX for patients with advanced or metastatic G/GEJ adenocarcinoma and a PD-L1 CPS ≥ 5. The analysis was conducted from the perspective of Taiwan’s National Health Insurance Administration (NHIA) because innovative cancer drugs are seldom self-paid by patients. Through the NHI and Cancer Drug Fund, the NHIA is the primary payer for cancer treatments and thus determines the market entry and pricing of medicines for approximately 99% of the population. Health outcomes were measured in quality-adjusted life-years (QALYs), and costs included only direct medical expenses reimbursed by the NHIA. Both costs and health outcomes were simulated over a lifetime horizon (40 years) and discounted at an annual rate of 3%. Since Taiwan’s regulatory authorities do not specify a willingness-to-pay (WTP) threshold for advanced cancer treatments, the WTP threshold was set at three times Taiwan’s 2024 GDP per capita (USD 101,949) [25], in line with common practice in oncology cost-effectiveness analyses [23,24,26,27,28,29]. The primary cost-effectiveness metrics were the incremental cost-effectiveness ratio (ICER) and incremental net monetary benefit (INMB). To ensure comprehensiveness and transparency, this study adheres to the Consolidated Health Economic Evaluation Reporting Standards statements (CHEERS; see Table A1) [30,31]. The cost-effectiveness analysis was conducted using the “heemod” package [32] in R (version 4.3.2, Vienna, Austria).
2.2. Study Population
The study population comprised treatment-naive patients with unresectable, locally advanced, or metastatic G/GEJ adenocarcinoma. Eligibility criteria were based on the GEMSTONE-303 trial: patients aged 18–75 years with a PD-L1 CPS ≥ 5, an HER2-negative status, and an Eastern Cooperative Oncology Group performance status of 0 or 1 [17]. Additionally, a subgroup analysis was performed for patients with a PD-L1 CPS ≥ 10 to explore potential heterogeneity in cost-effectiveness.
2.3. Intervention and Comparator
Treatment protocols mirrored those in the GEMSTONE-303 trial [17]. The intervention group received sugemalimab (1200 mg IV every 3 weeks for up to 24 months) combined with CAPOX (oral capecitabine at 1000 mg/m2 twice daily for 14 days and IV oxaliplatin at 130 mg/m2 on day 1, every 3 weeks, for up to 6 cycles) [17]. The comparator group received CAPOX alone on the same schedule and at the same dosage for up to 6 cycles [17].
2.4. Clinical Efficacy
As individual patient data (IPD) from the GEMSTONE-303 trial were unavailable, we applied Guyot’s method [33] to reconstruct pseudo-IPD by digitizing published Kaplan–Meier curves for PFS and OS using WebPlotDigitizer (version 4.6) [34] and the “IPDfromKM” package [35] in R (version 4.3.2, Vienna, Austria). The accuracy of the reconstructed curves was validated by comparison with the original published data.
For extrapolation to 40 years, pseudo-IPD were fitted to seven parametric survival models in line with the National Institute for Health and Care Excellence recommendations [36]: exponential, Weibull, gamma, log-normal, log-logistic, Gompertz, and generalized gamma. Model selection was based on the Akaike information criterion (AIC), Bayesian information criterion (BIC), visual inspection, and clinical expert opinion (model fit statistics are shown in Table A2). Log-logistic distributions were selected for both groups in the base-case analysis. Detailed model parameters are provided in Table 1.

Table 1.
Model parameters, baseline values, ranges, and distributions for sensitivity analyses.
2.5. Treatment-Related Adverse Events
Grade ≥ 3 treatment-related adverse events (AEs) with incidence rates greater than 5% from the GEMSTONE-303 trial were considered in the analysis, comprising anemia (10.8% for sugemalimab plus CAPOX vs. 7.2% for CAPOX alone) and decreased white blood cell (6.6% vs. 3.0%), neutrophil (14.1% vs. 14.3%), and platelet counts (18.3% vs. 16.0%). Following clinical expert recommendations, decreased white blood cell and neutrophil counts were grouped as neutropenia, while anemia and a decreased platelet count were grouped as anemia, as these AEs are managed similarly in real-world Taiwanese clinical practice. To ensure a conservative analysis, the higher incidence rate within each category was used in the model (see Table 1).
2.6. Direct Medical Costs
Direct medical costs included medication, chemotherapy administration, non-medication services, supportive care during the PD state, terminal care in the 1 month preceding death, and the management of AEs. The four cost types in the PD state—supportive care, chemotherapy medication, chemotherapy administration, and terminal care costs—were mutually exclusive. Since sugemalimab has not yet been approved by Taiwan’s Food and Drug Administration, no local market price was available. Therefore, we used the price from China (CNY 12,375 per 600 mg, obtained from the Yaozh database on 5 March 2025 [37]), which was converted to U.S. dollars using the Taiwan Central Back 2024 exchange rate of 7.1975 CNY/USD (accessed on 28 July 2025 [43]), resulting in a hypothetical price of USD 1720 per 600 mg. All other costs were sourced from a CEA currently under review (see published abstract [26]), which examined the same patient population. These costs are reported in 2024 U.S. dollars (USD 1 = TWD 32.11) [44].
2.7. Health Utilities
Because the GEMSTONE-303 trial did not report utility values, we referenced the Australian Pharmaceutical Benefits Advisory Committee report for advanced G/GEJ patients treated with first-line CAPOX with and without nivolumab [38], considering sugemalimab’s similar mechanism as an immune checkpoint inhibitor [5]. The utility values were 0.812 and 0.798 (PF) and 0.746 and 0.721 (PD) for the intervention and comparator arms, respectively [38]. Disutilities for adverse events were obtained from published studies in advanced unresectable or metastatic esophageal squamous cell carcinoma [39] and non-small cell lung cancer [40], as data for G/GEJ adenocarcinoma were unavailable. All utility and disutility values were assumed to follow beta distributions (see Table 1).
2.8. Model Assumptions
Key model assumptions included the following: (1) patients received either sugemalimab plus CAPOX or CAPOX alone as first-line treatment, which continued until the earlier of either disease progression or the median treatment duration (6.3 months for sugemalimab plus CAPOX, 5.2 months for CAPOX alone) occurred in both the PD-L1 CPS ≥ 5 and ≥10 groups; (2) following progression, all patients received standardized supportive care; (3) only AEs with ≥5% incidence were modeled, and Grade 3/4 AEs incurred a utility decrement for the full cycle in which they occurred; (4) AEs were assumed to occur only during the first cycle in the PF state; (5) health states were assumed to be independent, consistent with a partitioned survival model structure; (6) in line with Taiwan’s NHIA, we modeled a point-based fee schedule, with one point valued at TWD 1 for medications and a conversion factor (assumed at TWD 0.9198 per point) for non-medication services; and (7) the direct medical costs for patients with advanced or metastatic gastric adenocarcinoma were assumed to be identical to those for patients with advanced or metastatic GEJ adenocarcinoma.
2.9. Sensitivity Analysis
Deterministic sensitivity analysis (DSA) and probabilistic sensitivity analysis (PSA) were performed to assess the impact of parameter uncertainty. The DSA varied each parameter within its 95% confidence interval or ±25% where data were unavailable. The PSA employed a Monte Carlo simulation with 5000 iterations, with results plotted on the cost-effectiveness plane and summarized using a cost-effectiveness acceptability curve. The expected value of perfect information (EVPI) was calculated to estimate the monetary value of eliminating parameter uncertainty.
2.10. Scenario Analysis
Several scenario analyses were performed to assess cost-effectiveness under varying assumptions: (1) substituting the equal value of life-years gained (evLYG) for QALYs; (2) altering treatment duration parameters, such as using the median PFS, continuing treatment until the protocol-defined maximum or until disease progression occurred; (3) varying the time horizon (5, 10, 20, and 30 years); (4) applying a gradual 10% reduction to the hypothesized price of sugemalimab; (5) assuming one point equals TWD 1 for all non-medication costs; and (6) fitting alternative parametric survival models, including log-normal models and best-fit models based solely on the AIC and BIC.
3. Results
3.1. Base-Case Analysis
In the base-case analysis, sugemalimab plus CAPOX provided 1.56 QALYs (equivalent to 2.05 life-years) at a direct medical cost of USD 123,373 (Table 2). In comparison, CAPOX alone yielded 1.17 QALYs (1.59 life-years) at a cost of USD 76,353. The addition of sugemalimab to CAPOX resulted in an incremental gain of 0.39 QALYs (0.46 life-years) and an incremental cost of USD 47,020. This corresponds to an ICER of USD 121,230 per QALY gained and an INMB of −USD 7478.
Table 2.
Base-case results.
3.2. Base-Case Sensitivity Analysis
The DSA identified the most influential parameters as the utility values for the PF and PD states, the cost of supportive care during the PD state, the medication cost of sugemalimab, and the treatment duration of sugemalimab plus CAPOX (Figure 1). At some extreme values for these parameters, the cost-effectiveness conclusion was reversed. In the PSA, 5000 Monte Carlo simulations indicated that most iterations fell within the northeast quadrant of the cost-effectiveness plane, reflecting greater effectiveness at higher costs for sugemalimab plus CAPOX (Figure 2). At a WTP threshold of three times the GDP per capita per QALY gained, the cost-effectiveness acceptability curve demonstrated only a 38.4% probability that the intervention would be considered cost-effective, with an EVPI of USD 6274 per person (Table 3).
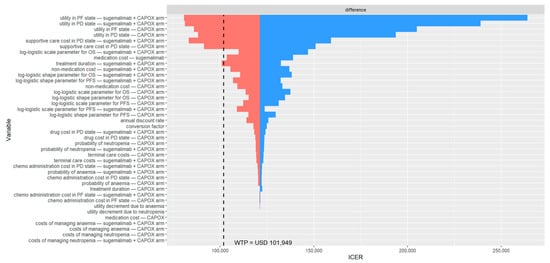
Figure 1.
Deterministic sensitivity analysis results among patients with PD-L1 CPS ≥ 5. The black dashed line indicates the willingness-to-pay threshold of USD 101,949 per QALY gained. CAPOX, a combination of oxaliplatin and capecitabine; chemo, chemotherapy; ICER, incremental cost-effectiveness ratio; OS, overall survival; PD, progressed disease; PF, progression-free; PFS, progression-free survival; USD, United States dollar; WTP, willingness-to-pay.
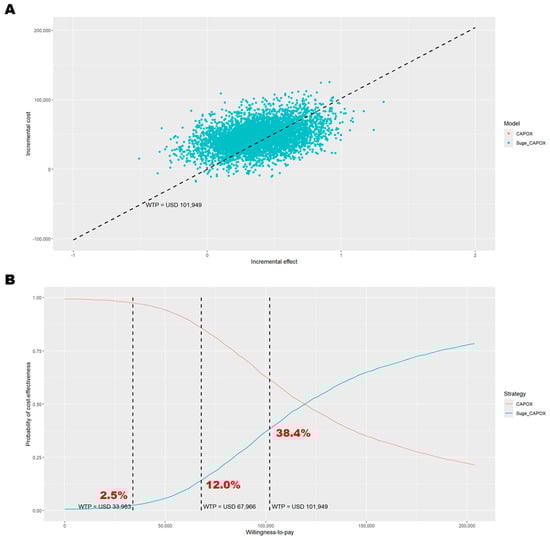
Figure 2.
Probabilistic sensitivity analysis results among patients with PD-L1 CPS ≥ 5. (A) Outcomes over 5000 Monte Carlo simulations on the cost-effectiveness plane; (B) cost-effectiveness acceptance curve. In panel (A), the black dashed line represents the willingness-to-pay threshold of USD 101,949 per QALY gained. In panel (B), the dashed lines indicate willingness-to-pay thresholds of USD 33,983, USD 67,966, and USD 101,949 per QALY gained. CAPOX, a combination of oxaliplatin and capecitabine; Suge_CAPOX, sugemalimab plus CAPOX; WTP, willingness-to-pay.
Table 3.
Scenario analyses with base-case and probabilistic sensitivity analyses for sugemalimab plus CAPOX versus CAPOX alone among patients with PD-L1 CPS ≥ 5.
3.3. Scenario Analysis
Most scenario analyses, except those varying health benefit measures, treatment duration, and the hypothesized price of sugemalimab, produced results consistent with the base-case analysis, with the probability of cost-effectiveness for the combination therapy ranging from 29.6% to 37.6% (Table 3). When evLYG was used as the health benefit measure, the combination of sugemalimab and CAPOX yielded an ICER of USD 101,801 per life-year gained, which is very close to the pre-defined WTP threshold of USD 101,949. Although these scenarios did not alter the overall cost-effectiveness conclusion, changes in treatment duration had a significant impact on the probability of the intervention being cost-effective. When first-line therapy was administered until the median PFS was reached, the probability of cost-effectiveness decreased to 31.2%. Extending the treatment duration to the earlier of the two, i.e., either the protocol-defined maximum was reached, or progression occurred, reduced the probability further to 8.5%, and administering treatment until progression lowered it to just 3.6%. In price reduction scenarios, a decrease of 28% in the cost of sugemalimab would be required to achieve cost-effectiveness, resulting in approximately USD 1204 per 600 mg.
3.4. Subgroup Analysis
In patients with a PD-L1 CPS ≥ 10, who derived greater clinical benefit from the addition of sugemalimab to CAPOX, the cost-effectiveness conclusions were consistent with those observed in the base-case analysis (PD-L1 CPS ≥ 5). Sugemalimab plus CAPOX provided 1.65 QALYs (equivalent to 2.17 life-years) at a direct medical cost of USD 130,008 (Table 2), whereas CAPOX alone yielded 1.15 QALYs (1.56 life-years) at a cost of USD 71,990. Thus, adding sugemalimab to CAPOX resulted in an incremental gain of 0.5 QALYs (0.61 life-years) and an additional cost of USD 58,017. This translates to an ICER of USD 115,568 per QALY gained and an INMB of −USD 6837. The PSA indicated a similar probability of cost-effectiveness (39.8%, Figure A1). The most influential parameters in the DSA remained consistent with those identified for patients with PD-L1 CPS ≥ 5 (Figure A2). The scenario analyses confirmed that treatment duration substantially affects the probability of sugemalimab plus CAPOX being cost-effective (ranging from 4.2% to 32.8%, Table A3). A price reduction of 25% for sugemalimab would be required for the combination to become cost-effective, approximately USD 1376 per 600 mg. When the evLYG was used as the health benefit measure, the probability of cost-effectiveness increased to 60.5%.
4. Discussion
In our base-case analysis, the combination of sugemalimab and CAPOX was not cost-effective as a first-line treatment for advanced or metastatic G/GEJ adenocarcinoma in patients with either a PD-L1 CPS ≥ 5 or ≥10. These findings align with two recent studies conducted from the Chinese healthcare perspective [23,24]. When the evLYG was used as the health benefit measure, sugemalimab approached borderline cost-effectiveness for PD-L1 CPSs ≥ 5 and was cost-effective when the score was ≥10. Price scenario analyses indicated that a reduction of approximately 20–30% from the hypothesized price, equivalent to about USD 1204 per 600 mg (for PD-L1 CPS ≥ 5) or USD 1376 per 600 mg (for PD-L1 CPS ≥ 10), would be required for sugemalimab to achieve cost-effectiveness, although considerable uncertainty remains. While other scenario analyses also yielded unfavorable cost-effectiveness results, assumptions regarding treatment duration had a particularly substantial impact on the outcomes.
The probability of sugemalimab being cost-effective decreased markedly as the assumed treatment duration extended. In our base-case model, which used the median treatment duration from the GEMSTONE-303 trial, the probability of cost-effectiveness was 38.4% and 39.8% for patients with CPSs ≥ 5 and ≥10, respectively. When first-line therapy was modeled until median PFS was reached, the earlier of two occurrences, i.e., the protocol-defined maximum was reached or progression occurred, and disease progression, the probabilities of sugemalimab being cost-effective among PD-L1 CPS ≥ 5 patients declined to 31.2%, 8.5%, and 3.6%, respectively. We conducted three additional price scenario analyses based on different treatment durations. If the NHIA reimbursed sugemalimab based on the median PFS (7.72 months), the price would need to be reduced by approximately 35–38% to achieve cost-effectiveness (PD-L1 CPS ≥ 5: USD 1066 per 600 mg; PD-L1 CPS ≥ 10: USD 1117 per 600 mg); if reimbursement was based on the earlier of either the protocol-defined maximum being reached (24 months for sugemalimab or placebo, 4.5 months for CAPOX) or progression occurring, a price reduction of about 62% would be necessary (USD 653 per 600 mg); and if reimbursement continued until disease progression, a reduction of approximately 68% would be required (USD 550 per 600 mg). These findings highlight the significant impact of treatment duration assumptions.
To simulate long-term cost-effectiveness outcomes, it is necessary to make assumptions regarding decision-analytical models and key parameters in model-based health technology assessments. Although our base-case analysis reached similar conclusions to a recently published Chinese study [23], there was a substantial difference in the estimated probability of sugemalimab plus CAPOX being cost-effective. Tang et al. reported a 0% probability of cost-effectiveness for the sugemalimab regimen [23], whereas our base-case analysis indicated a 38.4% probability. Most of this discrepancy arises from differences in utility values, treatment duration assumptions, and time horizons. Tang et al. used utility data from patients with HER2-positive advanced gastric cancer and assumed treatment continued until disease progression, with a 10-year simulation horizon [23]. In contrast, we sourced utility values from patients with HER2-negative advanced gastric cancer, which we believe better reflects our study population. We also assumed treatment duration was equal to the median duration observed in the GEMSTONE-303 trial, with a 40-year lifetime horizon. When we applied a 10-year time horizon, the probability of sugemalimab plus CAPOX being cost-effective decreased slightly to 35.4%, and using the same utility values as Tang et al. led to a dramatic reduction in cost-effectiveness probability to 12.1%. Further aligning our treatment duration assumptions with theirs (i.e., treatment until disease progression) resulted in a substantial decrease to 0.06%, closely matching their findings. Although there is no universal standard for parameter selection in health technology assessments, since these choices are context-specific, transparency in methodology and assumptions is essential to inform sound decision-making.
This study shares limitations common to model-based oncology cost-effectiveness analyses, primarily due to data inaccessibility [26,27,28,29]. Without patient-level trial data, we could not conduct survival modeling that accurately reflects transition probabilities, limiting our ability to simulate with a Markov model and evaluate model uncertainty. We were also unable to estimate treatment heterogeneity or address more nuanced equity considerations. While using a parametric distribution to model the time to treatment discontinuation would be preferable, we lacked access to individual patient data from GEMSTONE-303 and therefore, assumed the treatment duration to be equal to the median duration reported, treating it as a fixed parameter in the PSA. Additionally, in the absence of detailed information on AE timing, we assumed that all AEs occurred in the first treatment cycle, a common approach in oncology cost-effectiveness studies. Because advanced gastric cancer-specific disutility values for AEs were unavailable, we relied on estimates from other cancer types, which may introduce additional uncertainty. Direct medical costs were obtained from a previous study that used NHI claims data for estimation; however, the sample may not fully represent the trial population because the NHI claims data lack laboratory examination results and diagnostic codes for GEJ adenocarcinoma. Additionally, the exclusion of self-financed medical expenses from the NHI database may have led to a misclassification of treatment groups, potentially affecting cost estimates. Anemia and thrombocytopenia are managed differently in clinical practice; however, we grouped these AEs based on clinical oncologist judgment, as distinguishing between them using Taiwan’s NHI claims data is extremely challenging. This approach may underestimate heterogeneity and increase uncertainty in our cost-effectiveness model.
There are two directions for future research. First, a health technology reassessment should be conducted once sufficient real-world data have been collected. Second, head-to-head cost-effectiveness comparisons among immune checkpoint inhibitors for the treatment of advanced or metastatic gastric cancer are warranted, particularly in countries where these agents are not yet available as first-line treatment options.
5. Conclusions
The combination of sugemalimab and CAPOX is not cost-effective for patients with advanced or metastatic G/GEJ adenocarcinoma from the perspective of Taiwan’s NHIA compared to CAPOX alone. To achieve cost-effectiveness, the hypothesized price of sugemalimab would need to be reduced by 20–30% (to approximately USD 1204 per 600 mg for PD-L1 CPS ≥ 5 and USD 1376 per 600 mg for PD-L1 CPS ≥ 10), assuming first-line therapy is administered for the median treatment duration observed in the GEMSTONE-303 trial. If reimbursement continued until disease progression, a reduction of approximately 68% would be required (USD 550 per 600 mg).
Author Contributions
Conceptualization, C.-H.C. and Y.-W.T.; data curation, W.-M.H. and M.-Y.H.; formal analysis, M.-Y.H.; funding acquisition, Y.-W.T.; investigation, C.-H.C., W.-M.H. and M.-Y.H.; methodology, C.-H.C., W.-M.H., M.-Y.H., Y.-W.T. and H.-L.C.; project administration, C.-H.C., Y.-W.T. and N.-J.C.; resources, Y.-W.T.; software, C.-H.C. and M.-Y.H.; supervision, C.-H.C., Y.-W.T. and N.-J.C.; validation, C.-H.C. and W.-M.H.; visualization, M.-Y.H.; writing—original draft preparation, C.-H.C. and M.-Y.H.; writing—review and editing, C.-H.C., W.-M.H., M.-Y.H., Y.-W.T., N.-J.C. and H.-L.C. All authors have read and agreed to the published version of the manuscript.
Funding
This research was supported by the College of Medicine, National Yang Ming Chiao Tung University, Taiwan, and the Medical AI Development Center, Taipei Veterans General Hospital, Taiwan.
Institutional Review Board Statement
This study utilized data obtained from the published literature and employed simulation modeling. No data were collected from real human subjects; therefore, institutional review board review was not required.
Data Availability Statement
The reconstructed pseudo-individual patient data used for effectiveness extrapolation and model simulation will be made available by the authors upon request.
Conflicts of Interest
Y.W.T. has received research funding from IQVIA for studies on health economics and epidemiology related to chronic urticaria in Taiwan. This funding is unrelated to the current study and has not influenced its design, conduct, or reporting. The terms of this arrangement were reviewed and approved by National Yang Ming Chiao Tung University in accordance with its policy on research objectivity. The other authors declare no conflicts of interest.
Appendix A
Table A1.
CHEERS checklist.
Table A1.
CHEERS checklist.
| Topic | No. | Item | Location Where Item Is Reported |
|---|---|---|---|
| Title | |||
| 1 | Identify the study as an economic evaluation and specify the interventions being compared. | Title page | |
| Abstract | |||
| 2 | Provide a structured summary that highlights context, key methods, results, and alternative analyses. | Abstract section | |
| Introduction | |||
| Background and objectives | 3 | Give the context for the study, the study question, and its practical relevance for decision making in policy or practice. | Introduction section |
| Methods | |||
| Health economic analysis plan | 4 | Indicate whether a health economic analysis plan was developed and where available. | Health economic analysis plan subsection |
| Study population | 5 | Describe characteristics of the study population (such as age range, demographics, socioeconomic, or clinical characteristics). | Study population subsection |
| Setting and location | 6 | Provide relevant contextual information that may influence findings. | Health economic analysis plan subsection |
| Comparators | 7 | Describe the interventions or strategies being compared and why chosen. | Intervention and comparator subsection |
| Perspective | 8 | State the perspective(s) adopted by the study and why chosen. | Health economic analysis plan subsection |
| Time horizon | 9 | State the time horizon for the study and why appropriate. | Health economic analysis plan subsection |
| Discount rate | 10 | Report the discount rate(s) and reason chosen. | Health economic analysis plan subsection |
| Selection of outcomes | 11 | Describe what outcomes were used as the measure(s) of benefit(s) and harm(s). | Health economic analysis plan subsection |
| Measurement of outcomes | 12 | Describe how outcomes used to capture benefit(s) and harm(s) were measured. | Clinical efficacy, Treatment-Related adverse events, and Health utilities subsections |
| Valuation of outcomes | 13 | Describe the population and methods used to measure and value outcomes. | Health utilities subsection |
| Measurement and valuation of resources and costs | 14 | Describe how costs were valued. | Direct medical costs subsection |
| Currency, price date, and conversion | 15 | Report the dates of the estimated resource quantities and unit costs, plus the currency and year of conversion. | Health economic analysis plan and Direct medical costs subsections |
| Rationale and description of model | 16 | If modelling is used, describe in detail and why used. Report if the model is publicly available and where it can be accessed. | Health economic analysis plan and Clinical efficacy subsections |
| Analytics and assumptions | 17 | Describe any methods for analysing or statistically transforming data, any extrapolation methods, and approaches for validating any model used. | Model assumptions subsection |
| Characterising heterogeneity | 18 | Describe any methods used for estimating how the results of the study vary for subgroups. | Health economic analysis plan subsection |
| Characterising distributional effects | 19 | Describe how impacts are distributed across different individuals or adjustments made to reflect priority populations. | Not available |
| Characterising uncertainty | 20 | Describe methods to characterise any sources of uncertainty in the analysis. | Sensitivity analysis and Scenario analysis subsections |
| Approach to engagement with patients and others affected by the study | 21 | Describe any approaches to engage patients or service recipients, the general public, communities, or stakeholders (such as clinicians or payers) in the design of the study. | Not available |
| Results | |||
| Study parameters | 22 | Report all analytic inputs (such as values, ranges, references) including uncertainty or distributional assumptions. | Methods section and Table 1 |
| Summary of main results | 23 | Report the mean values for the main categories of costs and outcomes of interest and summarise them in the most appropriate overall measure. | Base-Case analysis and Base-Case sensitivity analysis subsections |
| Effect of uncertainty | 24 | Describe how uncertainty about analytic judgments, inputs, or projections affect findings. Report the effect of choice of discount rate and time horizon, if applicable. | Base-Case sensitivity analysis, Scenario analysis, and Subgroup analysis subsections |
| Effect of engagement with patients and others affected by the study | 25 | Report on any difference patient/service recipient, general public, community, or stakeholder involvement made to the approach or findings of the study | Not available |
| Discussion | |||
| Study findings, limitations, generalisability, and current knowledge | 26 | Report key findings, limitations, ethical or equity considerations not captured, and how these could affect patients, policy, or practice. | Discussion section |
| Other relevant information | |||
| Source of funding | 27 | Describe how the study was funded and any role of the funder in the identification, design, conduct, and reporting of the analysis | Funding section |
| Conflicts of interest | 28 | Report authors’ conflicts of interest according to journal or International Committee of Medical Journal Editors requirements. | Conflict of interest section |
Table A2.
AIC and BIC for each parametric model.
Table A2.
AIC and BIC for each parametric model.
| Regimen | Distribution | Progression-Free Survival | Overall Survival | ||
|---|---|---|---|---|---|
| AIC | BIC | AIC | BIC | ||
| PD-L1 CPS ≥ 5 | |||||
| Sugemalimab + CAPOX | Exponential | 1068.252 | 1071.737 | 1304.787 | 1308.272 |
| Weibull | 1040.966 | 1047.936 | 1286.684 | 1293.653 | |
| Gompertz | 1067.179 | 1074.148 | 1303.422 | 1310.392 | |
| Log-normal | 1006.989 | 1013.959 | 1269.906 | 1276.875 | |
| Log-logistic | 1008.241 | 1015.210 | 1268.815 | 1275.784 | |
| Generalized gamma | 1012.230 | 1022.685 | 1272.836 | 1283.290 | |
| Gamma | 1027.590 | 1034.560 | 1280.048 | 1287.018 | |
| Placebo + CAPOX | Exponential | 1107.486 | 1110.958 | 1386.945 | 1390.418 |
| Weibull | 1064.901 | 1071.846 | 1363.771 | 1370.716 | |
| Gompertz | 1100.335 | 1107.279 | 1383.564 | 1390.508 | |
| Log-normal | 1031.080 | 1038.025 | 1343.358 | 1350.303 | |
| Log-logistic | 1031.023 | 1037.968 | 1344.653 | 1351.597 | |
| Generalized gamma | 1031.948 | 1042.365 | 1345.268 | 1355.685 | |
| Gamma | 1048.522 | 1055.467 | 1355.548 | 1362.492 | |
| PD-L1 CPS ≥ 10 | |||||
| Sugemalimab + CAPOX | Exponential | 556.6350 | 559.5025 | 700.3561 | 703.2237 |
| Weibull | 543.0814 | 548.8165 | 691.7390 | 697.4740 | |
| Gompertz | 556.9605 | 562.6955 | 700.5508 | 706.2858 | |
| Log-normal | 523.6356 | 529.3707 | 681.7808 | 687.5159 | |
| Log-logistic | 526.4785 | 532.2136 | 682.9770 | 688.7121 | |
| Generalized gamma | 527.9641 | 536.5668 | 684.7373 | 693.3399 | |
| Gamma | 535.8626 | 541.5977 | 688.2621 | 693.9972 | |
| Placebo + CAPOX | Exponential | 580.5273 | 583.3794 | 746.9172 | 749.7692 |
| Weibull | 564.0427 | 569.7467 | 740.0807 | 745.7848 | |
| Gompertz | 579.3337 | 585.0377 | 747.3778 | 753.0819 | |
| Log-normal | 549.3813 | 555.0854 | 733.1846 | 738.8886 | |
| Log-logistic | 550.6078 | 556.3118 | 733.3101 | 739.0141 | |
| Generalized gamma | 550.9119 | 559.4680 | 735.0102 | 743.5663 | |
| Gamma | 557.4220 | 563.1261 | 737.2156 | 742.9196 | |
AIC, Akaike information criterion; BIC, Bayesian information criterion; CAPOX, combination of capecitabine and oxaliplatin; CPS, combined positive score; PD-L1, programmed cell death-ligand 1.
Table A3.
Scenario analyses with base-case and probabilistic sensitivity analyses for sugemalimab plus CAPOX versus CAPOX alone among patients with PD-L1 CPS ≥ 10.
Table A3.
Scenario analyses with base-case and probabilistic sensitivity analyses for sugemalimab plus CAPOX versus CAPOX alone among patients with PD-L1 CPS ≥ 10.
| Scenario | Sugemalimab + CAPOX vs. Placebo + CAPOX | |||||||
|---|---|---|---|---|---|---|---|---|
| Base-Case Analysis | Probabilistic Sensitivity Analysis | |||||||
| Incremental Costs (USD) | Incremental Effectiveness (QALYs) | ICER | INMB (USD) | ICER | INMB (USD) | Probability of Cost-Effectiveness | EVPI/Person | |
| 0. Base case | 58,017 | 0.50 | 115,568 | −6837 | 113,965 | −6098 | 39.8% | 6993 |
| 1. Effectiveness measure: Equal value of life-years gained | 58,017 | 0.61 | 94,385 | 4648 | 93,893 | 4952 | 60.5% | 5024 |
| 2a. Treatment duration: Median PFS (7.92 months vs. 6.93 months) | 62,572 | 0.50 | 124,641 | −11,392 | 122,928 | −10,647 | 32.8% | 5336 |
| 2b. Treatment duration: Protocol-defined maximum | 86,230 | 0.50 | 171,766 | −35,049 | 169,454 | −34,259 | 7.9% | 854 |
| 2c. Treatment duration: Administered until disease progressed | 94,078 | 0.50 | 187,400 | −42,898 | 185,641 | −42,474 | 4.2% | 362 |
| 3a. Time horizons: 5 years | 48,985 | 0.39 | 125,418 | −9166 | 124,393 | −8786 | 34.1% | 4764 |
| 3b. Time horizons: 10 years | 55,509 | 0.47 | 117,607 | −7390 | 116,260 | −6780 | 38.4% | 6383 |
| 3c. Time horizons: 20 years | 57,671 | 0.49 | 115,824 | −6908 | 114,292 | −6199 | 39.7% | 6901 |
| 3d. Time horizons: 30 years | 57,957 | 0.50 | 115,611 | −6849 | 114,026 | −6117 | 39.7% | 6975 |
| 4a. Price: 90% of the hypothesized price of sugemalimab | 55,235 | 0.50 | 110,026 | −4054 | 108,490 | −3320 | 44.4% | 8158 |
| 4b. Price: 80% of the hypothesized price of sugemalimab | 52,453 | 0.50 | 104,484 | −1272 | 103,016 | −541 | 49.4% | 9465 |
| 4c. Price: 70% of the hypothesized price of sugemalimab | 49,671 | 0.50 | 98,943 | 1509 | 97,541 | 2237 | 54.0% | 8663 |
| 4d. Price: 60% of the hypothesized price of sugemalimab | 46,889 | 0.50 | 93,401 | 4291 | 92,066 | 5015 | 58.5% | 7448 |
| 4e. Price: 50% of the hypothesized price of sugemalimab | 44,107 | 0.50 | 87,859 | 7073 | 86,591 | 7794 | 62.9% | 6354 |
| 5. Conversion factor: One point equals TWD 1 | 60,490 | 0.50 | 120,494 | −9310 | 118,856 | −8580 | 36.2% | 6268 |
| 6a. Survival models: Log-logistic | 56,523 | 0.48 | 116,472 | −7048 | 114,450 | −6142 | 40.2% | 7469 |
CPS, combined positive score; EVPI, expected value of perfect information; ICER, incremental cost-effectiveness ratio; INMB, incremental net monetary benefit; PFS, progression-free survival; TWD, New Taiwan dollar; PD-L1, programmed death-ligand 1; QALYs, quality-adjusted life-years.

Figure A1.
Probabilistic sensitivity analysis results among patients with PD-L1 CPS ≥ 10. (A) Outcomes over 5000 Monte Carlo simulations on the cost-effectiveness plane; (B) cost-effectiveness acceptance curve. In panel (A), the black dashed line represents the willingness-to-pay threshold of USD 101,949 per QALY gained. In panel (B), the dashed lines indicate willingness-to-pay thresholds of USD 33,983, USD 67,966, and USD 101,949 per QALY gained. CAPOX, a combination of oxaliplatin and capecitabine; Suge_CAPOX, sugemalimab plus CAPOX; WTP, willingness-to-pay.

Figure A2.
Deterministic sensitivity analysis results among patients with PD-L1 CPS ≥ 10. The black dashed line indicates the willingness to pay threshold of USD 101,949 per QALY gained. CAPOX, a combination of oxaliplatin and capecitabine; chemo, chemotherapy; ICER, incremental cost-effectiveness ratio; OS, overall survival; PD, progressed disease; PF, progression-free; PFS, progression-free survival; USD, United States dollar; WTP, willingness-to-pay.
References
- Bray, F.; Laversanne, M.; Sung, H.; Ferlay, J.; Siegel, R.L.; Soerjomataram, I.; Jemal, A. Global Cancer Statistics 2022: GLOBOCAN Estimates of Incidence and Mortality Worldwide for 36 Cancers in 185 Countries. CA A Cancer J. Clin. 2024, 74, 229–263. [Google Scholar] [CrossRef] [PubMed]
- GBD Compare. Available online: http://vizhub.healthdata.org/gbd-compare (accessed on 20 April 2025).
- Qin, N.; Fan, Y.; Yang, T.; Yang, Z.; Fan, D. The Burden of Gastric Cancer and Possible Risk Factors from 1990 to 2021, and Projections until 2035: Findings from the Global Burden of Disease Study 2021. Biomark. Res. 2025, 13, 5. [Google Scholar] [CrossRef] [PubMed]
- Guidelines Detail. Available online: https://www.nccn.org/guidelines/guidelines-detail?category=1&id=1434 (accessed on 21 July 2025).
- Klempner, S.J.; Lee, J.; Sundar, R. PD-1 or PD-L1—A Difference That Makes No Difference? JAMA 2025, 333, 1296. [Google Scholar] [CrossRef]
- Janjigian, Y.Y.; Shitara, K.; Moehler, M.; Garrido, M.; Salman, P.; Shen, L.; Wyrwicz, L.; Yamaguchi, K.; Skoczylas, T.; Bragagnoli, A.C.; et al. First-Line Nivolumab plus Chemotherapy versus Chemotherapy Alone for Advanced Gastric, Gastro-Oesophageal Junction, and Oesophageal Adenocarcinoma (CheckMate 649): A Randomised, Open-Label, Phase 3 Trial. Lancet 2021, 398, 27–40. [Google Scholar] [CrossRef]
- Janjigian, Y.Y.; Ajani, J.A.; Moehler, M.; Shen, L.; Garrido, M.; Gallardo, C.; Wyrwicz, L.; Yamaguchi, K.; Cleary, J.M.; Elimova, E.; et al. First-Line Nivolumab Plus Chemotherapy for Advanced Gastric, Gastroesophageal Junction, and Esophageal Adenocarcinoma: 3-Year Follow-Up of the Phase III CheckMate 649 Trial. JCO 2024, 42, 2012–2020. [Google Scholar] [CrossRef] [PubMed]
- Rha, S.Y.; Wyrwicz, L.S.; Yanez Weber, P.E.; Bai, Y.; Ryu, M.-H.; Lee, J.; Rivera, F.; Alves, G.V.; Garrido, M.; Shiu, K.-K.; et al. Pembrolizumab (Pembro) + Chemotherapy (Chemo) for Advanced HER2-Negative Gastric or Gastroesophageal Junction (G/GEJ) Cancer: Updated Results from the KEYNOTE-859 Study. JCO 2024, 42, 4045. [Google Scholar] [CrossRef]
- Rha, S.Y.; Oh, D.-Y.; Yañez, P.; Bai, Y.; Ryu, M.-H.; Lee, J.; Rivera, F.; Alves, G.V.; Garrido, M.; Shiu, K.-K.; et al. Pembrolizumab plus Chemotherapy versus Placebo plus Chemotherapy for HER2-Negative Advanced Gastric Cancer (KEYNOTE-859): A Multicentre, Randomised, Double-Blind, Phase 3 Trial. Lancet Oncol. 2023, 24, 1181–1195. [Google Scholar] [CrossRef]
- Xu, J.; Jiang, H.; Pan, Y.; Gu, K.; Cang, S.; Han, L.; Shu, Y.; Li, J.; Zhao, J.; Pan, H.; et al. Sintilimab Plus Chemotherapy for Unresectable Gastric or Gastroesophageal Junction Cancer: The ORIENT-16 Randomized Clinical Trial. JAMA 2023, 330, 2064–2074. [Google Scholar] [CrossRef] [PubMed]
- Qiu, M.-Z.; Oh, D.-Y.; Kato, K.; Arkenau, T.; Tabernero, J.; Correa, M.C.; Zimina, A.V.; Bai, Y.; Shi, J.; Lee, K.-W.; et al. Tislelizumab plus Chemotherapy versus Placebo plus Chemotherapy as First Line Treatment for Advanced Gastric or Gastro-Oesophageal Junction Adenocarcinoma: RATIONALE-305 Randomised, Double Blind, Phase 3 Trial. BMJ 2024, 385, e078876. [Google Scholar] [CrossRef]
- Lordick, F.; Candia Montero, L.; Castelo-Branco, L.; Pentheroudakis, G.; Sessa, C.; Smyth, E.C. ESMO Gastric Cancer Living Guideline v1.4. Available online: https://www.esmo.org/guidelines/living-guidelines/esmo-living-guideline-gastric-cancer (accessed on 11 August 2025).
- Zhou, Q.; Chen, M.; Jiang, O.; Pan, Y.; Hu, D.; Lin, Q.; Wu, G.; Cui, J.; Chang, J.; Cheng, Y.; et al. Sugemalimab versus Placebo after Concurrent or Sequential Chemoradiotherapy in Patients with Locally Advanced, Unresectable, Stage III Non-Small-Cell Lung Cancer in China (GEMSTONE-301): Interim Results of a Randomised, Double-Blind, Multicentre, Phase 3 Trial. Lancet Oncol. 2022, 23, 209–219. [Google Scholar] [CrossRef]
- Zhou, C.; Wang, Z.; Sun, Y.; Cao, L.; Ma, Z.; Wu, R.; Yu, Y.; Yao, W.; Chang, J.; Chen, J.; et al. Sugemalimab versus Placebo, in Combination with Platinum-Based Chemotherapy, as First-Line Treatment of Metastatic Non-Small-Cell Lung Cancer (GEMSTONE-302): Interim and Final Analyses of a Double-Blind, Randomised, Phase 3 Clinical Trial. Lancet Oncol. 2022, 23, 220–233. [Google Scholar] [CrossRef] [PubMed]
- Zhou, C.; Wang, Z.; Sun, M.; Cao, L.; Ma, Z.; Wu, R.; Yu, Y.; Yao, W.; Sun, S.; Chen, J.; et al. Sugemalimab versus Placebo, in Combination with Platinum-Based Chemotherapy, as First-Line Treatment of Metastatic Non-Small-Cell Lung Cancer (GEMSTONE-302): 4-Year Outcomes from a Double-Blind, Randomised, Phase 3 Trial. Lancet Oncol. 2025, 26, 887–897. [Google Scholar] [CrossRef]
- Li, J.; Chen, Z.; Bai, Y.; Liu, B.; Li, Q.; Zhang, J.; Zhou, J.; Deng, T.; Zhou, F.; Gao, S.; et al. First-Line Sugemalimab with Chemotherapy for Advanced Esophageal Squamous Cell Carcinoma: A Randomized Phase 3 Study. Nat. Med. 2024, 30, 740–748. [Google Scholar] [CrossRef] [PubMed]
- Zhang, X.; Wang, J.; Wang, G.; Zhang, Y.; Fan, Q.; Lu, C.; Hu, C.; Sun, M.; Wan, Y.; Sun, S.; et al. First-Line Sugemalimab Plus Chemotherapy for Advanced Gastric Cancer: The GEMSTONE-303 Randomized Clinical Trial. JAMA 2025. [Google Scholar] [CrossRef]
- Cejemly|European Medicines Agency (EMA). Available online: https://www.ema.europa.eu/en/medicines/human/EPAR/cejemly (accessed on 18 September 2025).
- Sugemalimab Approved to Treat Adult Patients with Non-Small Cell Lung Cancer. Available online: https://www.gov.uk/government/news/sugemalimab-approved-to-treat-adult-patients-with-non-small-cell-lung-cancer (accessed on 21 July 2025).
- Dhillon, S.; Duggan, S. Sugemalimab: First Approval. Drugs 2022, 82, 593–599. [Google Scholar] [CrossRef]
- CStone Announces the Fifth Indication Approved for Sugemalimab in China as First-Line Treatment for Gastric Cancer-CStone Pharmaceuticals. Available online: https://www.cstonepharma.com/en/html/news/3668.html (accessed on 21 July 2025).
- Sugemalimab 600 mg (20.0 mL)—Yaozh. Available online: https://db.yaozh.com/pijian/bJmWaWllbmZplWRilJaanDkwMzli.html (accessed on 18 September 2025).
- Tang, L.; Zhu, L.; Zhan, S.; Chen, Y.; Feng, P.-F. Cost-Effectiveness Analysis of Sugemalimab Combined with Chemotherapy as First-Line Treatment for Advanced Gastric Cancer. Front. Public Health 2025, 13, 1620663. [Google Scholar] [CrossRef]
- Zhang, Y.; He, Y.; Chen, R.; You, M. Cost-Effective Analysis of Sugemalimab plus Chemotherapy as First-Line Treatment for Advanced Gastric or Gastroesophageal Junction Adenocarcinoma with PD-L1 CPS ≥ 5. Front. Public Health 2025, 13, 1604372. [Google Scholar] [CrossRef] [PubMed]
- Statistical Tables. Available online: https://eng.stat.gov.tw/cp.aspx?n=2334 (accessed on 28 July 2025).
- Huang, W.M.; Chiang, N.J.; Tsai, Y.W. EE836 Cost-Effectiveness of Zolbetuximab Plus Chemotherapy as First-Line Treatment for Advanced Gastric or Gastroesophageal Adenocarcinoma in Taiwan. Value Health 2024, 27, S219. [Google Scholar] [CrossRef]
- Chen, K.-A.; Huang, W.-M.; Chen, E.Y.-T.; Ho, P.-K.; Chueh, C.-H.; Wen, Y.-W.; Chen, M.-H.; Chiang, N.-J.; Tsai, Y.-W. Cost-Effectiveness of Ivosidenib versus Chemotherapy for Previously Treated IDH1-Mutant Advanced Intrahepatic Cholangiocarcinoma in Taiwan. BMC Cancer 2024, 24, 622. [Google Scholar] [CrossRef]
- Chueh, C.-H.; Tsai, Y.-W.; Chen, Z.-R.; Shiu, M.-N.; Wen, Y.-W.; Chiang, N.-J. Cost-Effectiveness Analysis of a New Second-Line Treatment Regimen for Advanced Intrahepatic Cholangiocarcinoma: Biomarker-Driven Targeted Therapy of Pemigatinib Versus 5-FU Chemotherapy. PharmacoEconomics 2023, 41, 307–319. [Google Scholar] [CrossRef]
- Chen, Z.-R.; Chueh, C.-H.; Chiang, N.-J.; Tsai, Y.-W. Cost-Effectiveness of Pemigatinib as a Second-Line Treatment for Advanced Intrahepatic Cholangiocarcinoma with Fibroblast Growth Factor Receptor 2 Fusions in Taiwan: From the Evidence of the Phase II Trial and the Perspective of Taiwan’s National Health Insurance Administration. Cost Eff. Resour. Alloc. 2023, 21, 61. [Google Scholar] [CrossRef] [PubMed]
- Husereau, D.; Drummond, M.; Augustovski, F.; de Bekker-Grob, E.; Briggs, A.H.; Carswell, C.; Caulley, L.; Chaiyakunapruk, N.; Greenberg, D.; Loder, E.; et al. Consolidated Health Economic Evaluation Reporting Standards 2022 (CHEERS 2022) Statement: Updated Reporting Guidance for Health Economic Evaluations. Value Health 2022, 25, 3–9. [Google Scholar] [CrossRef] [PubMed]
- Husereau, D.; Drummond, M.; Augustovski, F.; de Bekker-Grob, E.; Briggs, A.H.; Carswell, C.; Caulley, L.; Chaiyakunapruk, N.; Greenberg, D.; Loder, E.; et al. Consolidated Health Economic Evaluation Reporting Standards (CHEERS) 2022 Explanation and Elaboration: A Report of the ISPOR CHEERS II Good Practices Task Force. Value Health 2022, 25, 10–31. [Google Scholar] [CrossRef] [PubMed]
- Filipović-Pierucci, A.; Zarca, K.; Durand-Zaleski, I. Markov Models for Health Economic Evaluations: The R Package Heemod. arXiv 2017, arXiv:1702.03252. [Google Scholar] [CrossRef]
- Guyot, P.; Ades, A.; Ouwens, M.J.; Welton, N.J. Enhanced Secondary Analysis of Survival Data: Reconstructing the Data from Published Kaplan-Meier Survival Curves. BMC Med. Res. Methodol. 2012, 12, 9. [Google Scholar] [CrossRef]
- Automeris. Io: Computer Vision Assisted Data Extraction from Charts Using WebPlotDigitizer. Available online: https://automeris.io/ (accessed on 28 July 2025).
- Liu, N.; Zhou, Y.; Lee, J.J. IPDfromKM: Reconstruct Individual Patient Data from Published Kaplan-Meier Survival Curves. BMC Med. Res. Methodol. 2021, 21, 111. [Google Scholar] [CrossRef]
- Latimer, N. Nice Dsu Technical Support Document 14: Survival Analysis for Economic Evaluations Alongside Clinical Trials—Extrapolation with Patient-Level Data; Decision Support Unit: Sheffield, UK, 2011. [Google Scholar]
- Drugdataexpy. Available online: https://data.yaozh.com/ (accessed on 17 July 2025).
- Australian Government Department of Health and Aged Care, Pharmaceutical Benefits Scheme (PBS). Nivolumab (HER-2-Neg Gastric Cancer, Gastroesophageal Junction Cancer or Oesophageal Adenocarcinoma): Injection Concentrate for I.V. Infusion 40 Mg in 4 mL, Injection Concentrate for I.V. Infusion 100 Mg in 10 mL; OPDIVO®. Available online: https://www.pbs.gov.au/info/industry/listing/elements/pbac-meetings/psd/2022-03/nivolumab-her-2-neg-gastric-cancer-gastroesophageal-junction-cancer (accessed on 21 July 2025).
- Cai, H.; Xu, B.; Li, N.; Zheng, B.; Zheng, Z.; Liu, M. Cost-Effectiveness Analysis of Camrelizumab Versus Chemotherapy as Second-Line Treatment of Advanced or Metastatic Esophageal Squamous Cell Carcinoma. Front. Pharmacol. 2021, 12, 732912. [Google Scholar] [CrossRef]
- Nafees, B.; Stafford, M.; Gavriel, S.; Bhalla, S.; Watkins, J. Health State Utilities for Non Small Cell Lung Cancer. Health Qual. Life Outcomes 2008, 6, 84. [Google Scholar] [CrossRef]
- Taiwan Center for Drug Evaluation. Methodology Guidelines for Health Technology Assessment. Available online: https://www.cde.org.tw/hta/1444/1834/2155/12989/ (accessed on 8 August 2025).
- National Health Insurance Administration, Ministry of Health and Welfare. Settlement and Estimated Point Value. Available online: https://www.nhi.gov.tw/ch/cp-5773-4d180-2767-1.html (accessed on 12 August 2025).
- Exchange Rates of TWD and Major Trading Partner Currencies Versus USD Over Selected Periods. Available online: https://cpx.cbc.gov.tw/Range/RangeSelect?pxfilename=BP01Y01.px (accessed on 28 July 2025).
- CBC Statistical Database. Available online: https://cpx.cbc.gov.tw/Data/DataMain/?pxfilename=BP06Y01en.px (accessed on 17 August 2025).
Disclaimer/Publisher’s Note: The statements, opinions and data contained in all publications are solely those of the individual author(s) and contributor(s) and not of MDPI and/or the editor(s). MDPI and/or the editor(s) disclaim responsibility for any injury to people or property resulting from any ideas, methods, instructions or products referred to in the content. |
© 2025 by the authors. Licensee MDPI, Basel, Switzerland. This article is an open access article distributed under the terms and conditions of the Creative Commons Attribution (CC BY) license (https://creativecommons.org/licenses/by/4.0/).