Correction: Gonçalves et al. Macrophage and Lymphocyte Infiltration Is Associated with Volumetric Tumor Size but Not with Volumetric Growth in the Tübingen Schwannoma Cohort. Cancers 2021, 13, 466

 , ,
, ,  , and
, and Text Correction
Error in Figures and Tables
Reference
- Gonçalves, V.M.; Suhm, E.-M.; Ries, V.; Skardelly, M.; Tabatabai, G.; Tatagiba, M.; Schittenhelm, J.; Behling, F. Macrophage and Lymphocyte Infiltration Is Associated with Volumetric Tumor Size but Not with Volumetric Growth in the Tübingen Schwannoma Cohort. Cancers 2021, 13, 466. [Google Scholar] [CrossRef] [PubMed]


| Variable | N (%) | Mean Tumor Volume in cm3 | p-Value (ANOVA) |
|---|---|---|---|
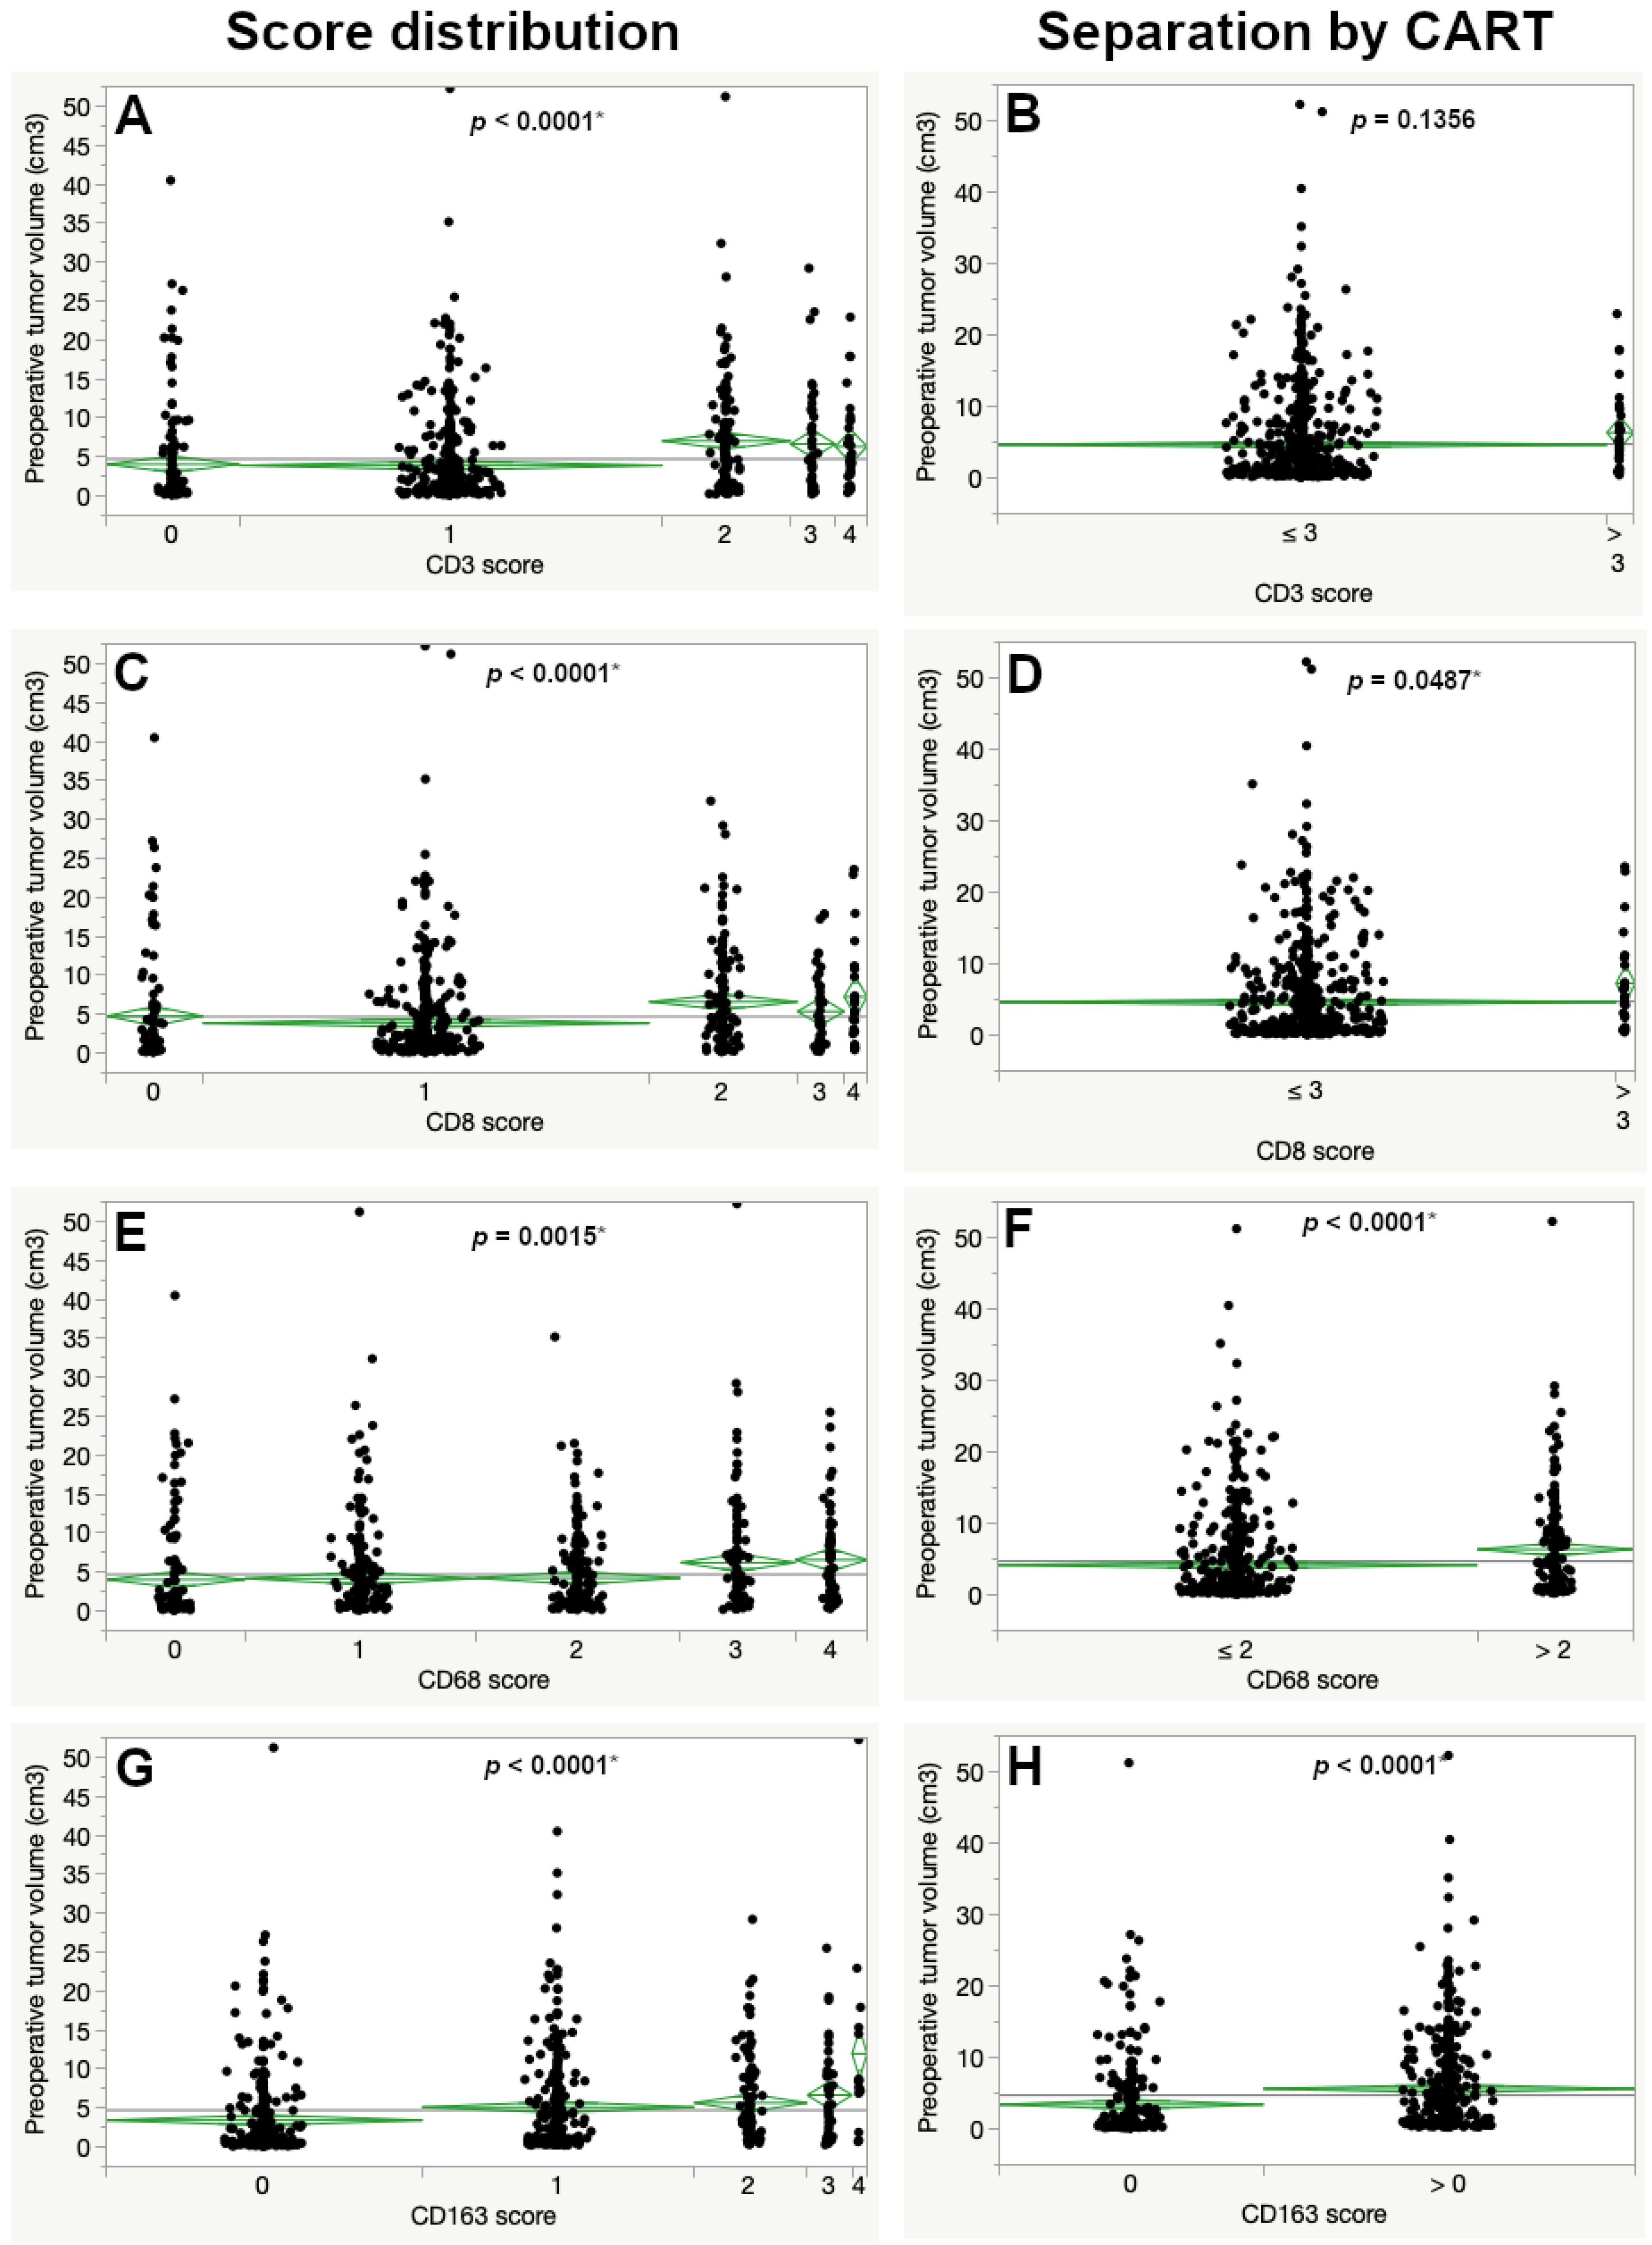
| CD3 score | |||
| 0 | 134 (17.5) | 4.05 | <0.0001 * |
| 1 | 424 (55.5) | 3.9 | |
| 2 | 129 (16.9) | 7.06 | |
| 3 | 45 (5.9) | 6.66 | |
| 4 | 32 (4.2) | 6.34 | |
| ≤3 | 732 (95.8) | 4.65 | 0.1356 |
| >3 | 32 (4.2) | 6.34 | |
| CD8 score | |||
| 0 | 97 (12.7) | 4.78 | <0.0001 * |
| 1 | 449 (58.7) | 3.88 | |
| 2 | 149 (19.5) | 6.6 | |
| 3 | 47 (6.1) | 5.37 | |
| 4 | 23 (3.0) | 7.24 | |
| ≤3 | 742 (97.0) | 4.64 | 0.0487 * |
| >3 | 23 (3.0) | 7.24 | |
| CD68 score | |||
| 0 | 139 (18.2) | 4.04 | 0.0015 * |
| 1 | 231 (30.3) | 4.19 | |
| 2 | 205 (26.9) | 4.25 | |
| 3 | 115 (15.1) | 6.23 | |
| 4 | 72 (9.5) | 6.58 | |
| ≤2 | 575 (75.5) | 4.18 | <0.0001 * |
| >2 | 187 (24.5) | 6.36 | |
| CD163 score | |||
| 0 | 316 (41.5) | 3.42 | <0.0001 * |
| 1 | 272 (35.7) | 5.11 | |
| 2 | 113 (14.8) | 5.67 | |
| 3 | 45 (6.0) | 6.67 | |
| 4 | 15 (2.0) | 11.97 | |
| 0 | 316 (41.5) | 3.42 | <0.0001 * |
| >0 | 445 (58.5) | 5.64 | |
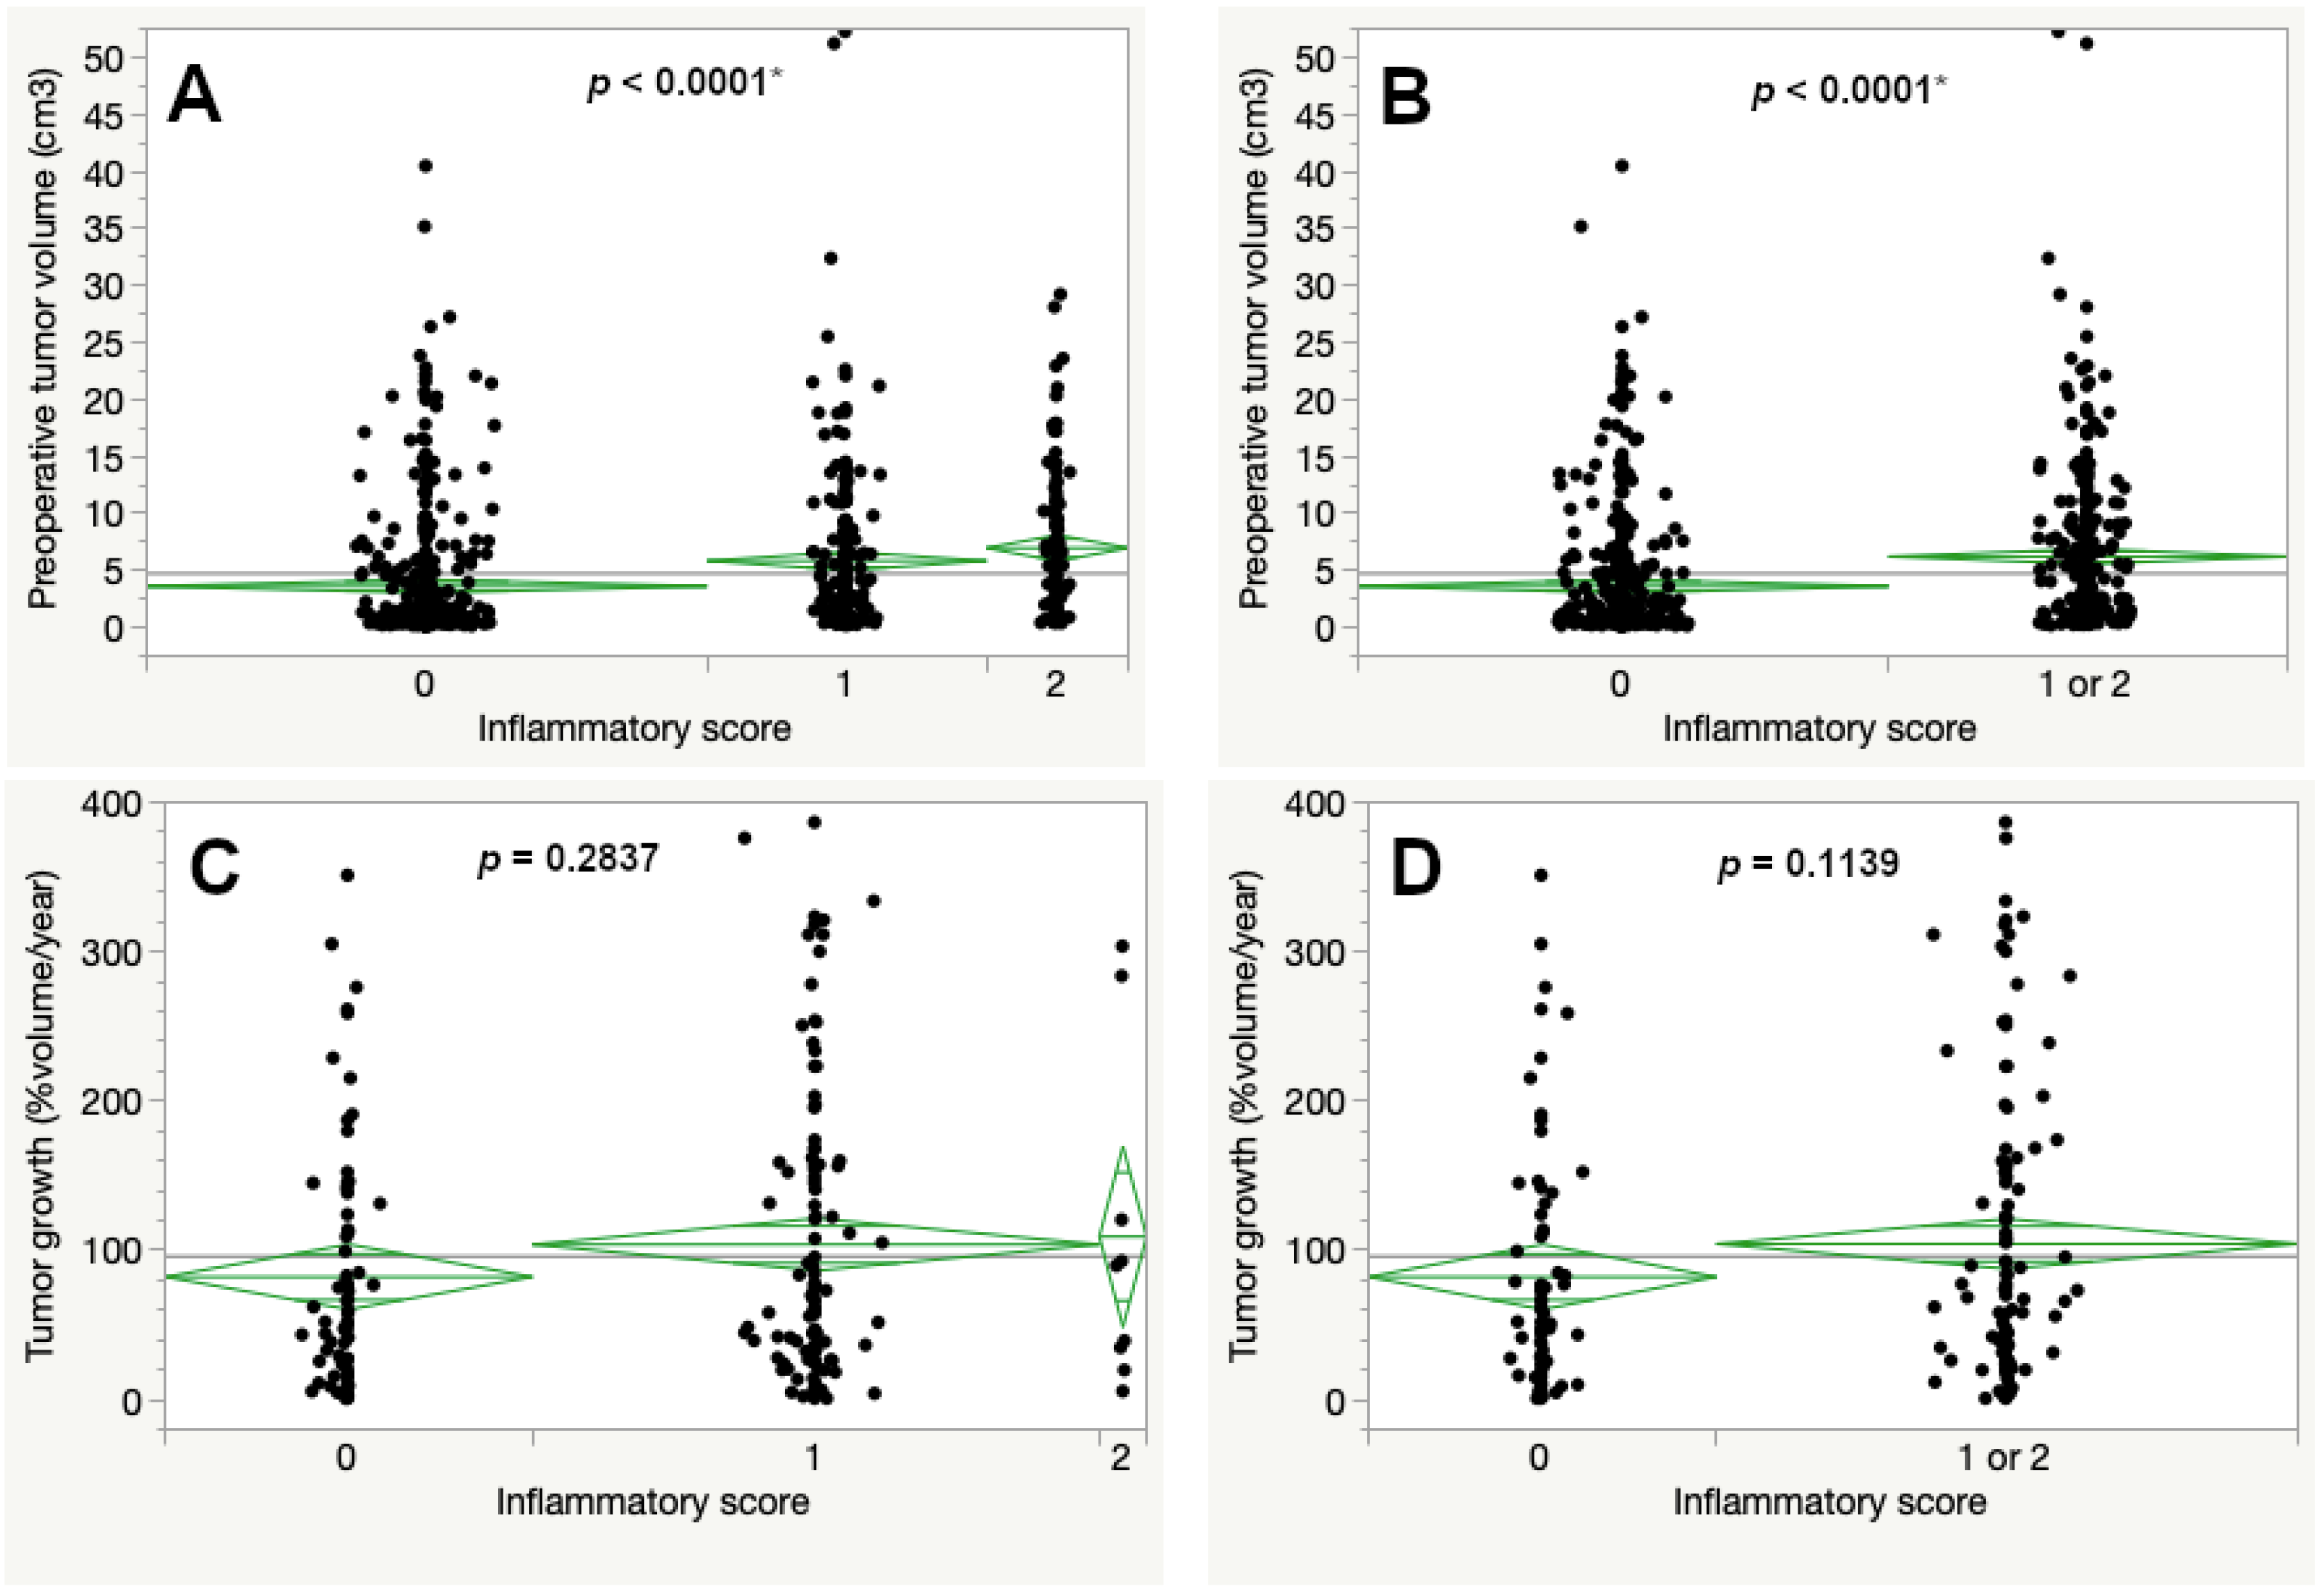
| Inflammatory score | |||
| 0 | 435 (57.1) | 3.62 | <0.0001 * |
| 1 | 217 (28.5) | 5.84 | |
| 2 | 110 (14.4) | 6.97 | |
| 0 | 435 (57.1) | 3.62 | <0.0001 * |
| 1 or 2 | 327 (42.9) | 6.22 |
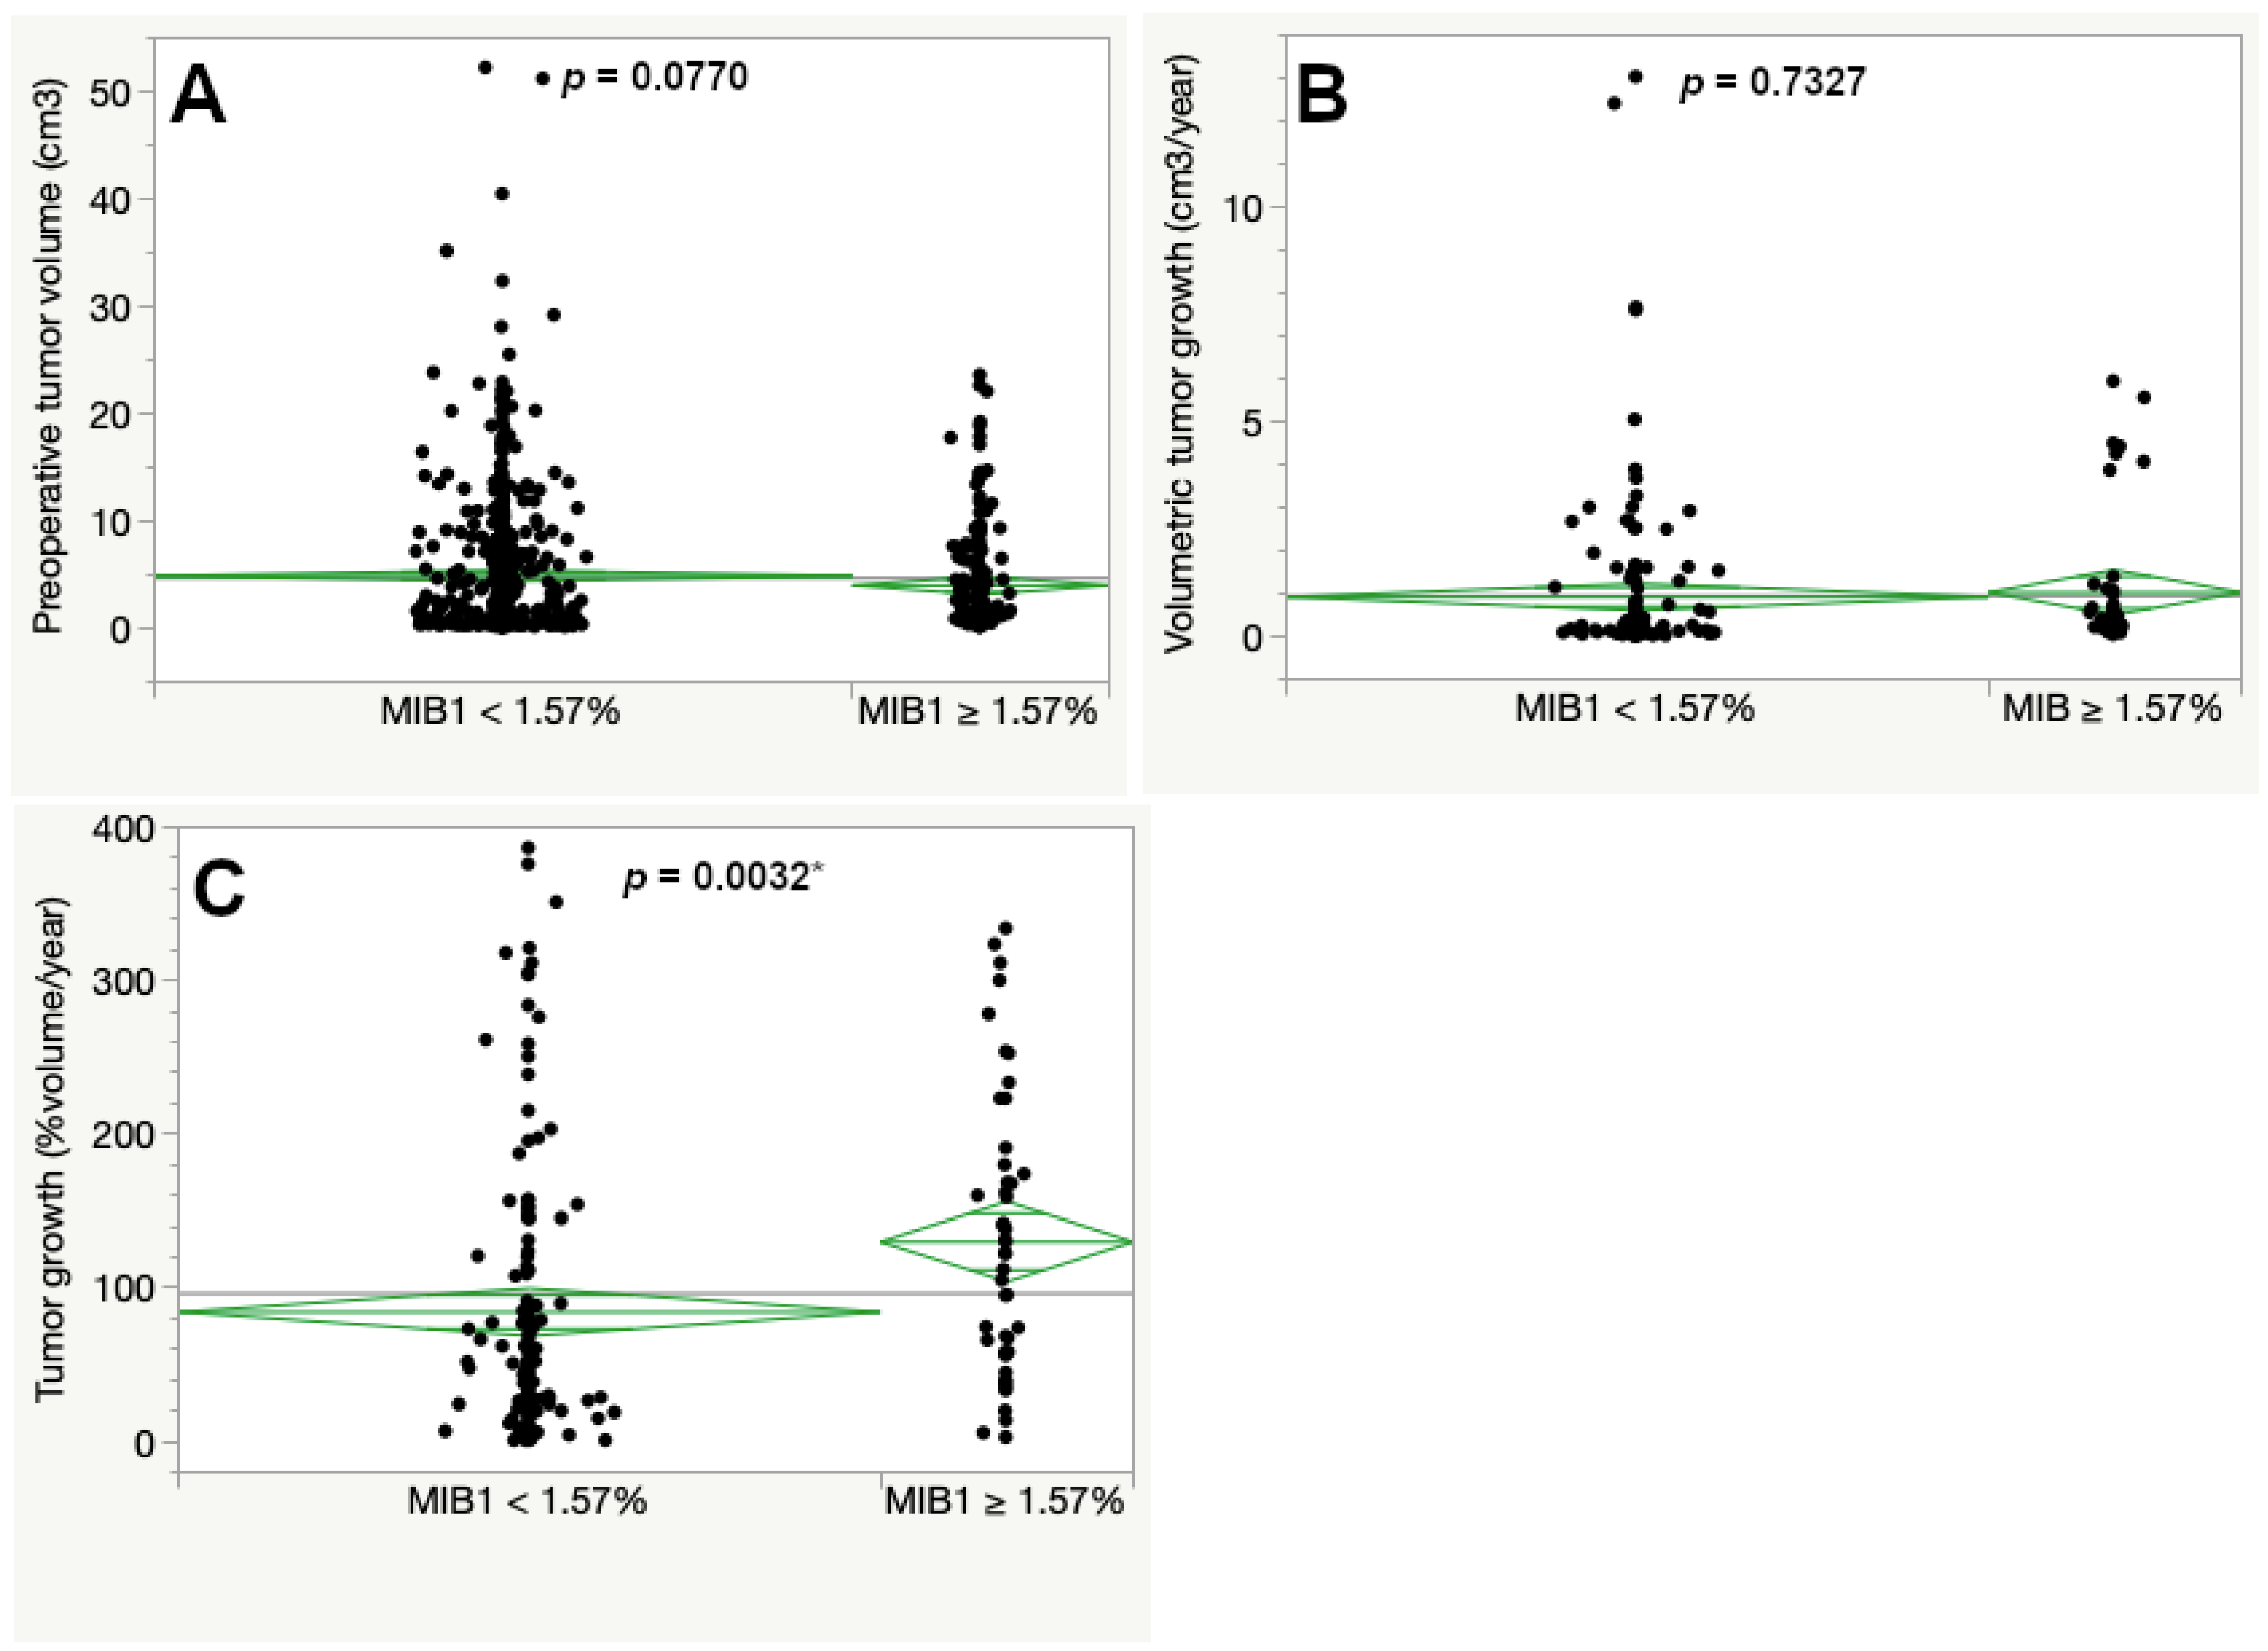
| Estimate | Std Error | t Ratio | Lower 95% | Upper 95% | p-Value | |
|---|---|---|---|---|---|---|
| Intercept | 104.30 | 8.29 | 12.58 | 87.94 | 120.66 | <0.0001 * |
| MIB1 ≥ 1.57% | −20.92 | 8.07 | 12.58 | −36.83 | −5.00 | 0.0103 * |
| Inflammatory score 0 | −7.91 | 7.33 | −1.08 | −22.38 | 6.55 | 0.2818 |
Disclaimer/Publisher’s Note: The statements, opinions and data contained in all publications are solely those of the individual author(s) and contributor(s) and not of MDPI and/or the editor(s). MDPI and/or the editor(s) disclaim responsibility for any injury to people or property resulting from any ideas, methods, instructions or products referred to in the content. |
© 2023 by the authors. Licensee MDPI, Basel, Switzerland. This article is an open access article distributed under the terms and conditions of the Creative Commons Attribution (CC BY) license (https://creativecommons.org/licenses/by/4.0/).
Share and Cite
Gonçalves, V.M.; Suhm, E.-M.; Ries, V.; Skardelly, M.; Tabatabai, G.; Tatagiba, M.; Schittenhelm, J.; Behling, F. Correction: Gonçalves et al. Macrophage and Lymphocyte Infiltration Is Associated with Volumetric Tumor Size but Not with Volumetric Growth in the Tübingen Schwannoma Cohort. Cancers 2021, 13, 466. Cancers 2023, 15, 377. https://doi.org/10.3390/cancers15020377
Gonçalves VM, Suhm E-M, Ries V, Skardelly M, Tabatabai G, Tatagiba M, Schittenhelm J, Behling F. Correction: Gonçalves et al. Macrophage and Lymphocyte Infiltration Is Associated with Volumetric Tumor Size but Not with Volumetric Growth in the Tübingen Schwannoma Cohort. Cancers 2021, 13, 466. Cancers. 2023; 15(2):377. https://doi.org/10.3390/cancers15020377
Chicago/Turabian StyleGonçalves, Vítor Moura, Elisa-Maria Suhm, Vanessa Ries, Marco Skardelly, Ghazaleh Tabatabai, Marcos Tatagiba, Jens Schittenhelm, and Felix Behling. 2023. "Correction: Gonçalves et al. Macrophage and Lymphocyte Infiltration Is Associated with Volumetric Tumor Size but Not with Volumetric Growth in the Tübingen Schwannoma Cohort. Cancers 2021, 13, 466" Cancers 15, no. 2: 377. https://doi.org/10.3390/cancers15020377
APA StyleGonçalves, V. M., Suhm, E.-M., Ries, V., Skardelly, M., Tabatabai, G., Tatagiba, M., Schittenhelm, J., & Behling, F. (2023). Correction: Gonçalves et al. Macrophage and Lymphocyte Infiltration Is Associated with Volumetric Tumor Size but Not with Volumetric Growth in the Tübingen Schwannoma Cohort. Cancers 2021, 13, 466. Cancers, 15(2), 377. https://doi.org/10.3390/cancers15020377