DNA Damage in Blood Leukocytes of Prostate Cancer Patients Undergoing PET/CT Examinations with [68Ga]Ga-PSMA I&T

 , and
, and 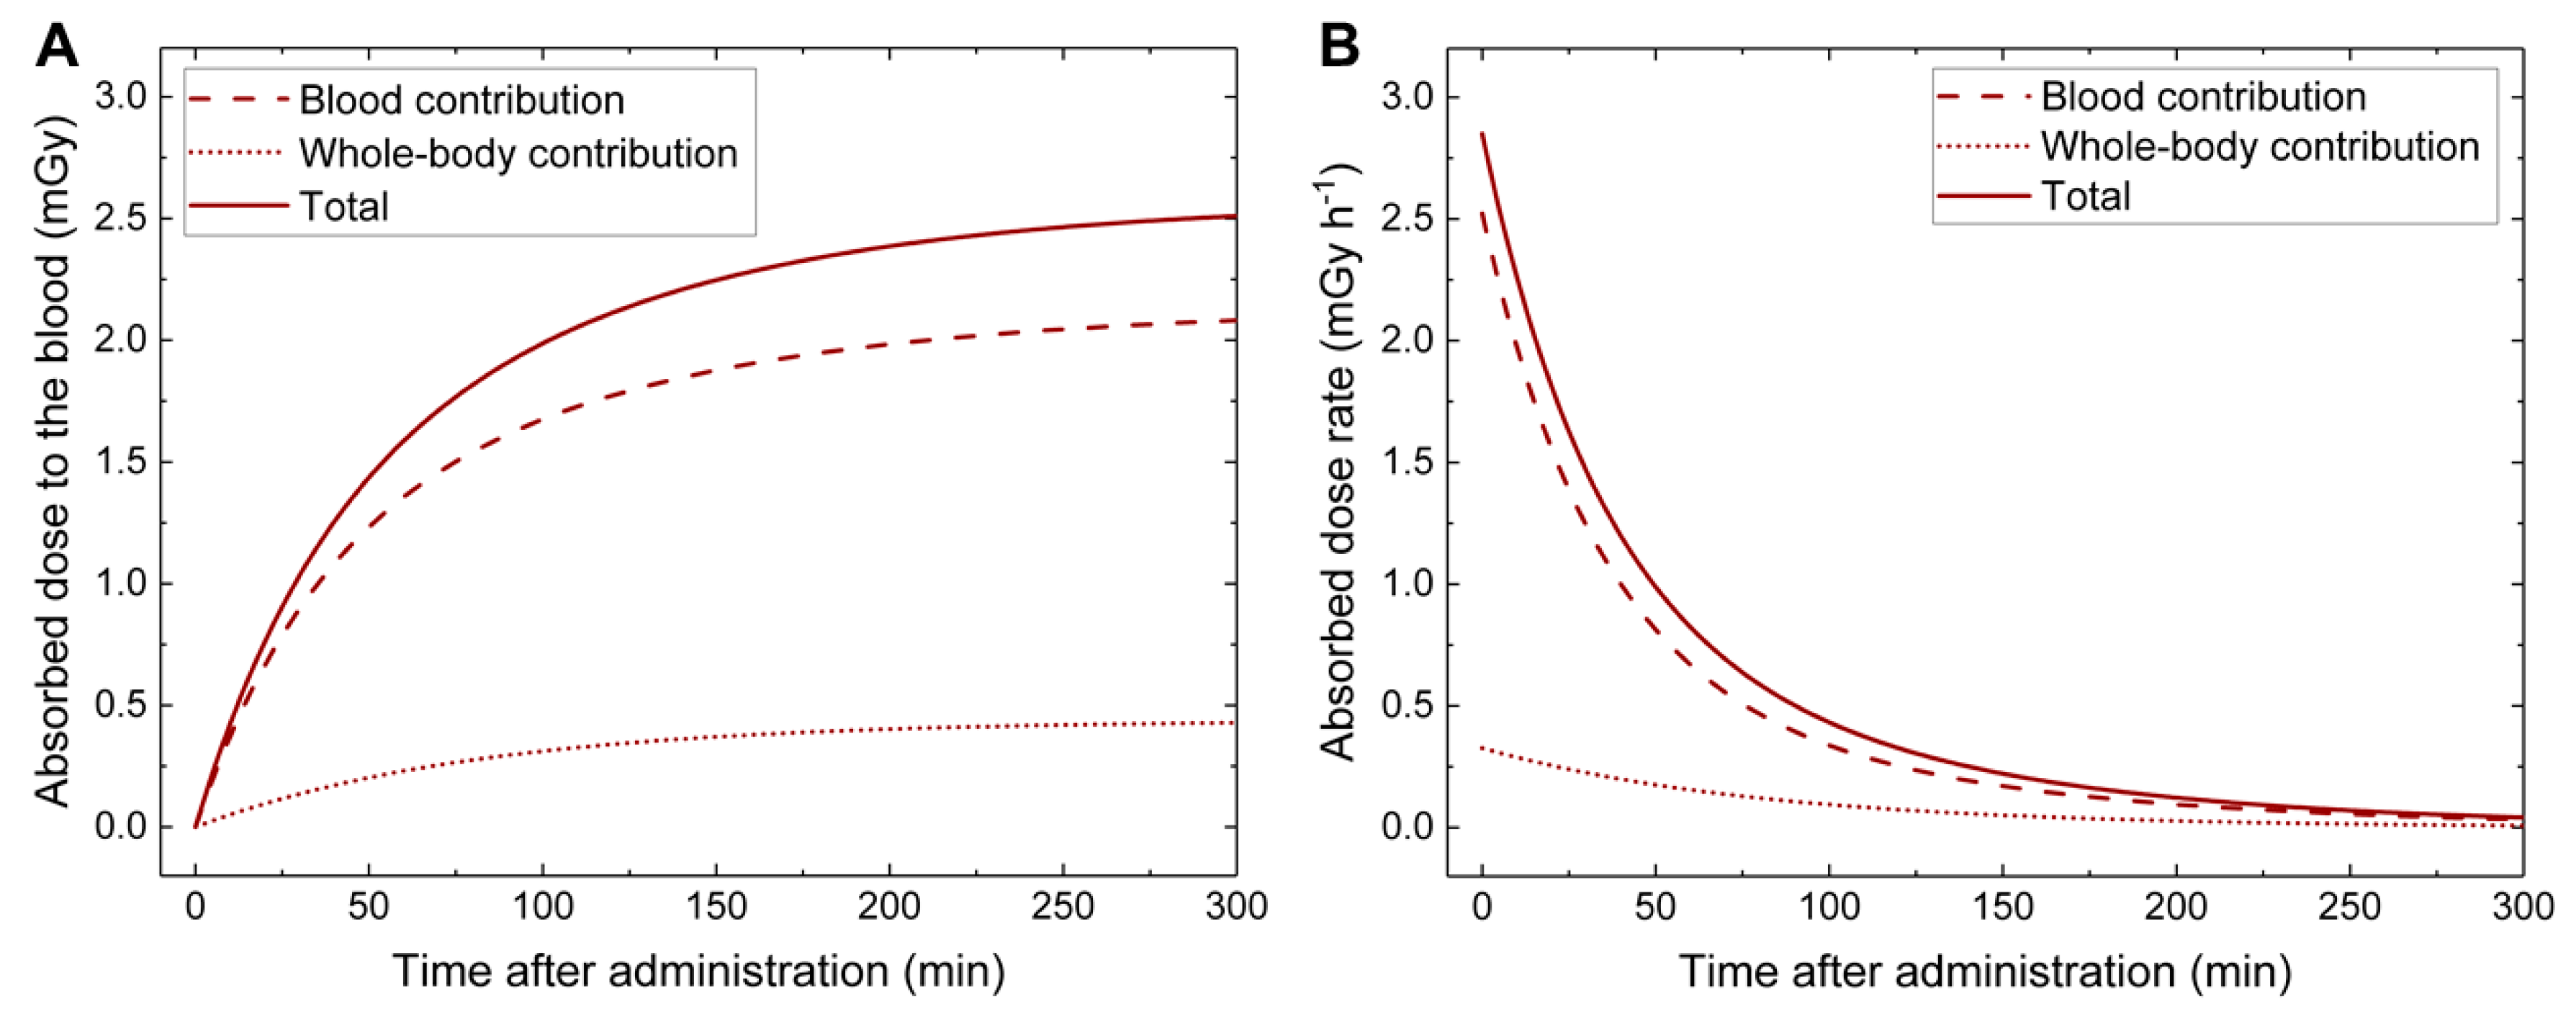
Abstract
1. Introduction
2. Results
2.1. In Vivo Study
2.1.1. Patients and Blood Sampling
2.1.2. Dosimetry
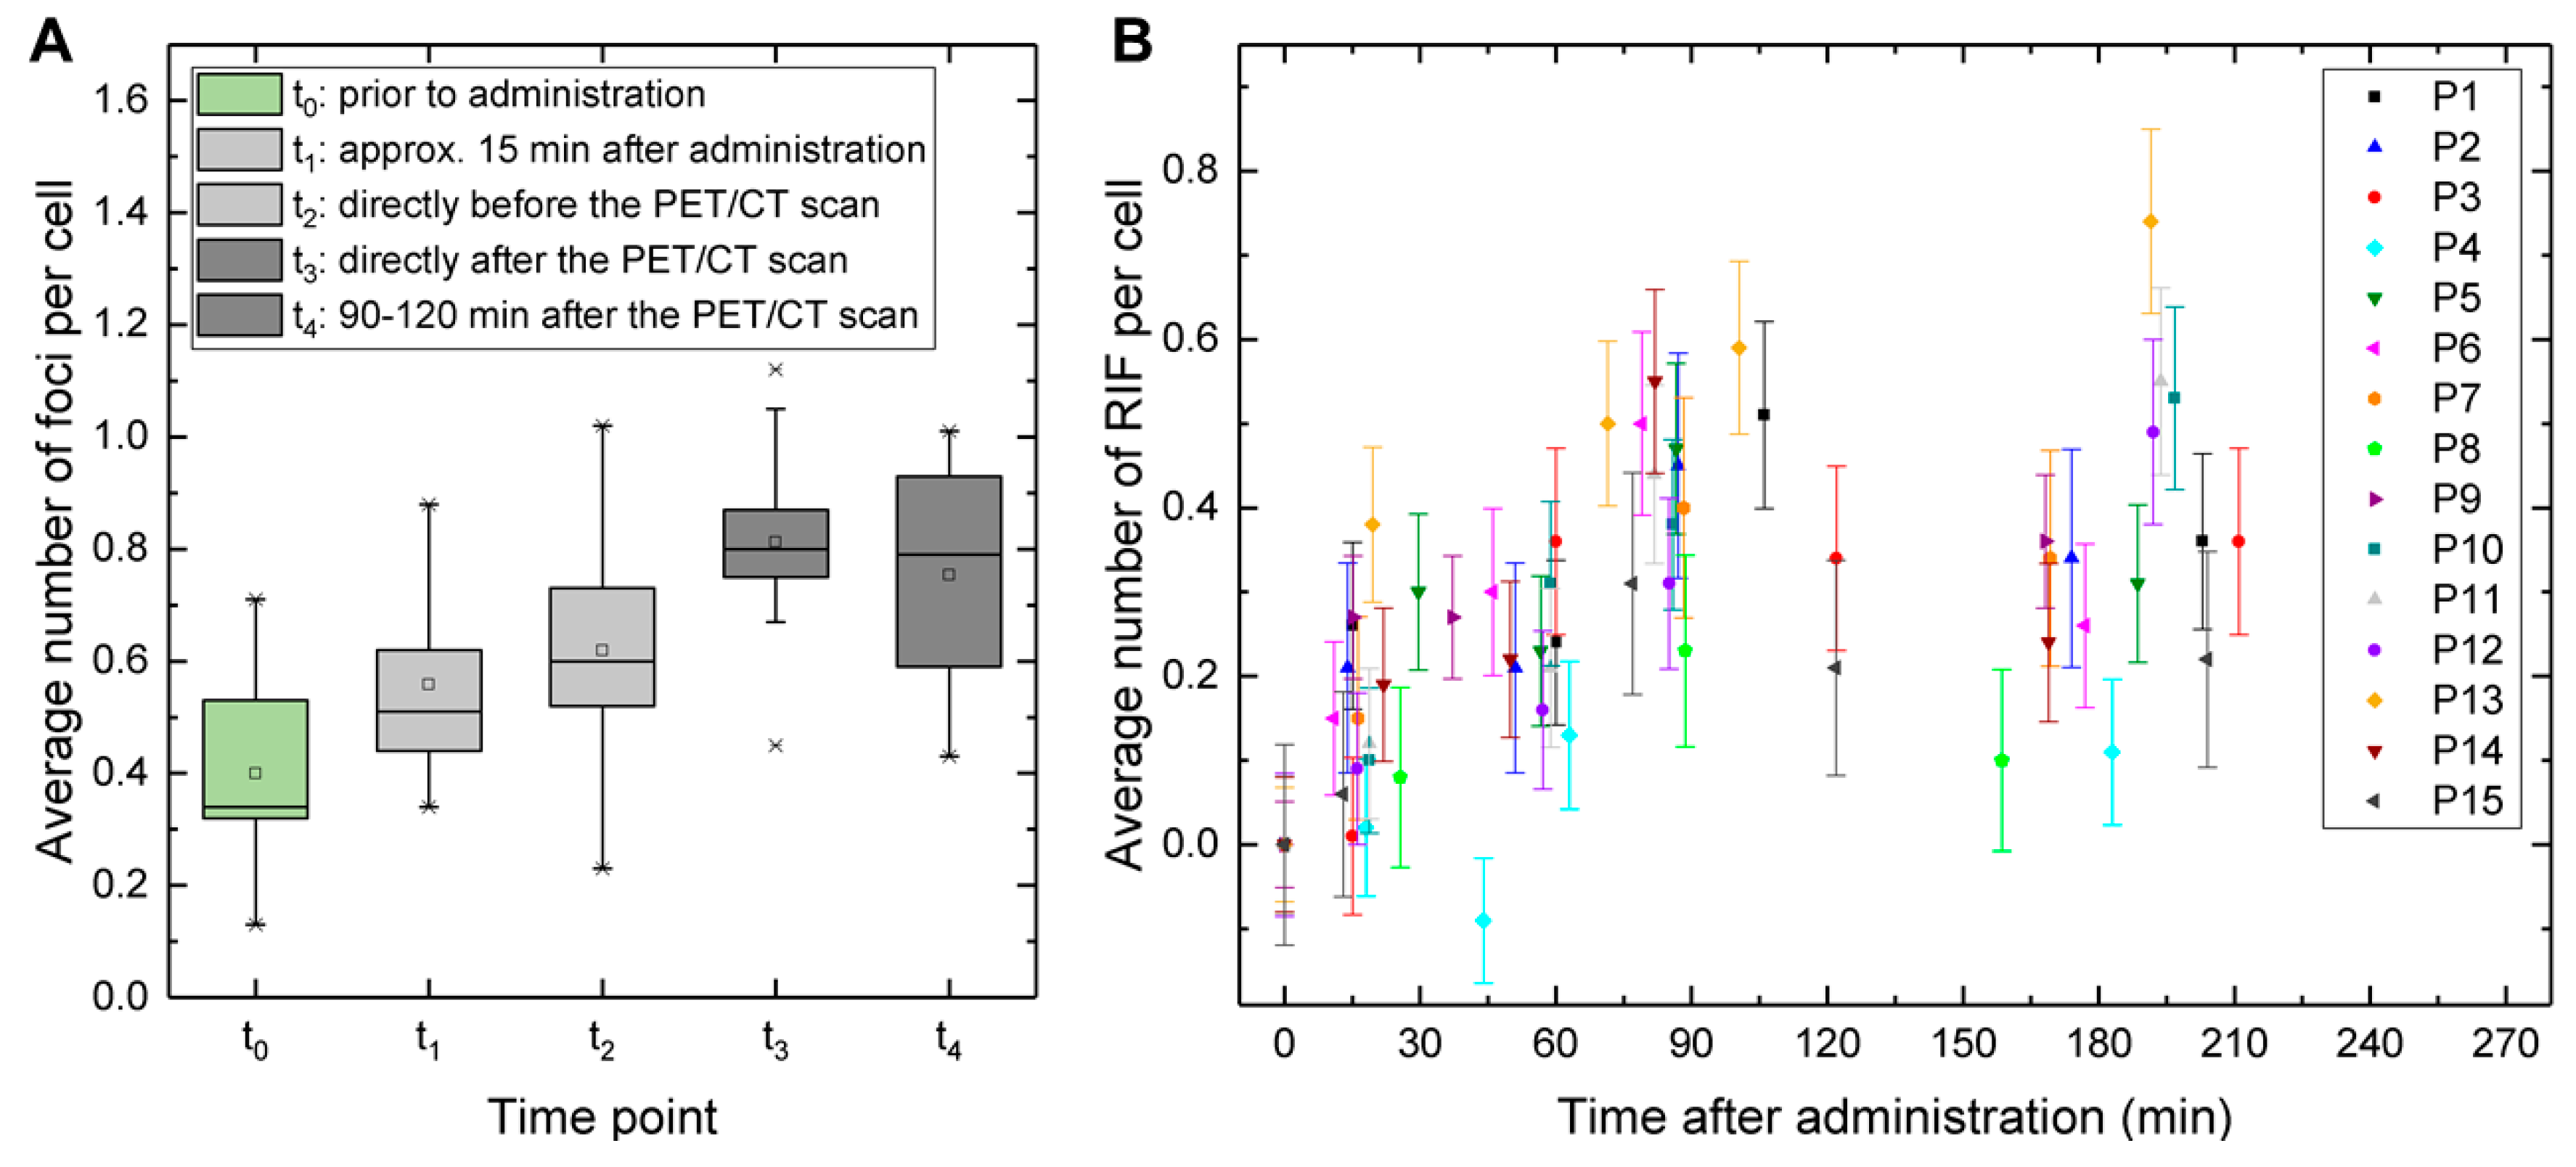
2.1.3. Time- and Absorbed Dose-Dependency of γ-H2AX+53BP1 Foci
2.2. Ex Vivo Study
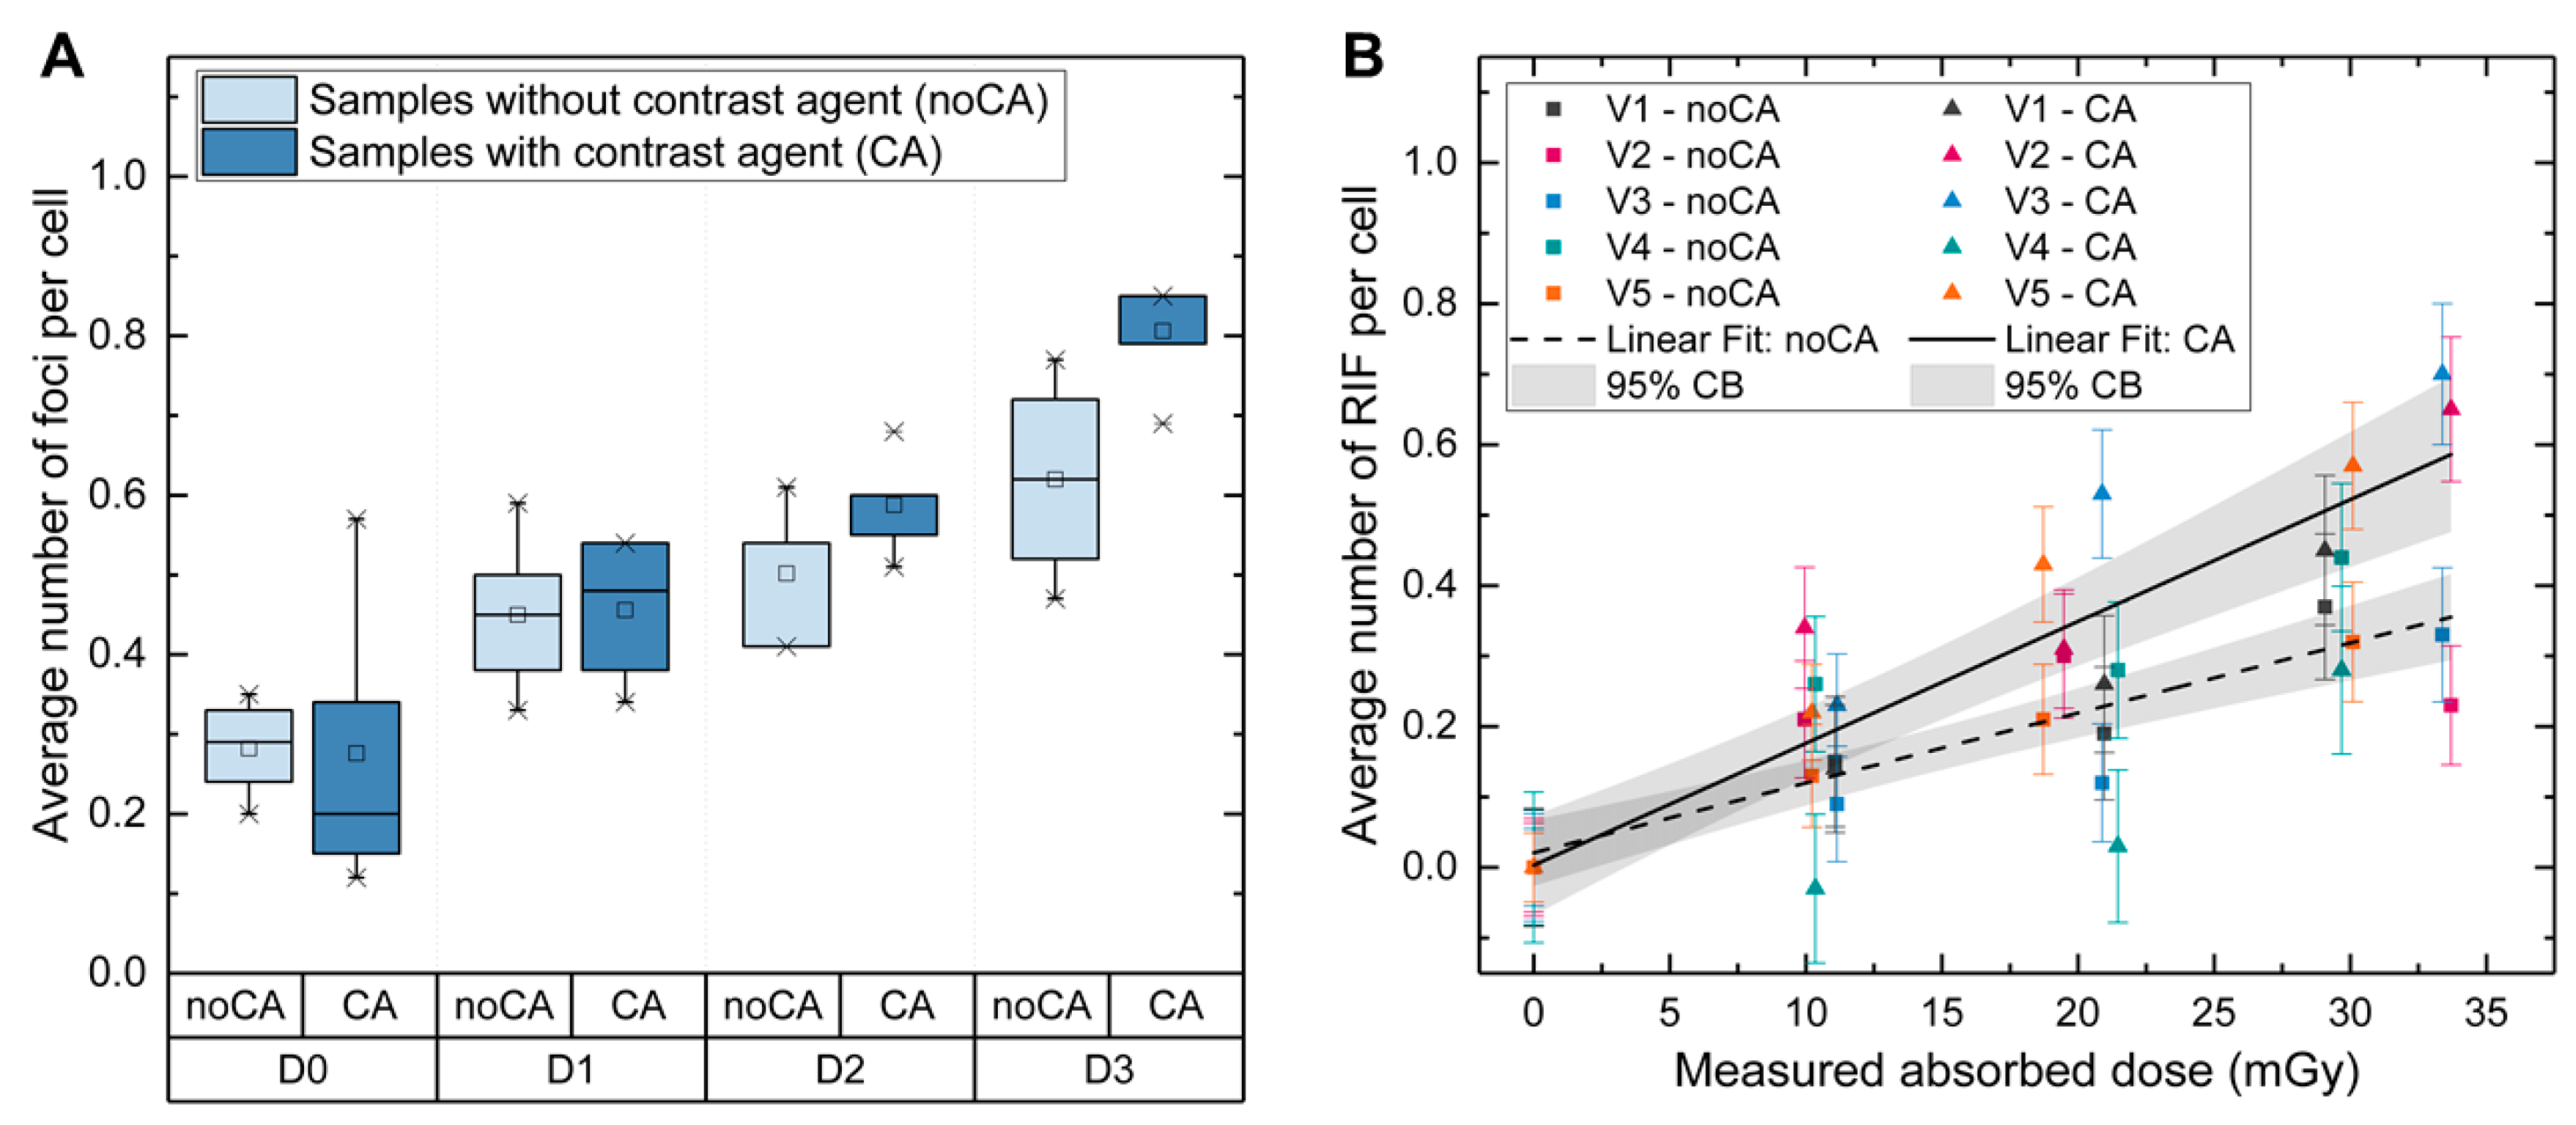
2.2.1. Absorbed Dose-Dependency of γ-H2AX+53BP1 Foci
2.2.2. Estimation of the CT-Caused Absorbed Dose to the Blood in the Patient Study
3. Discussion
4. Materials and Methods
4.1. Ethics Committee Approval and Patient Consent
4.2. In Vivo Study
4.2.1. Patients
4.2.2. Blood Sampling and External Dose Rate Measurements
4.2.3. Activity Quantification
4.2.4. Calculation of the Absorbed Doses to the Blood Related to 68Ga Application
4.3. Ex Vivo Study
4.3.1. Blood Sampling and Irradiation
4.3.2. Absorbed Dose Measurements
4.4. Evaluation of DNA Damage
4.5. Statistical Analysis
5. Conclusions
Supplementary Materials
Author Contributions
Funding
Acknowledgments
Conflicts of Interest
References
- Fendler, W.P.; Eiber, M.; Beheshti, M.; Bomanji, J.; Ceci, F.; Cho, S.; Giesel, F.; Haberkorn, U.; Hope, T.A.; Kopka, K.; et al. 68Ga-PSMA PET/CT: Joint EANM and SNMMI procedure guideline for prostate cancer imaging: Version 1.0. Eur. J. Nucl. Med. Mol. Imaging 2017, 44, 1014–1024. [Google Scholar] [CrossRef] [PubMed]
- Herrmann, K.; Bluemel, C.; Weineisen, M.; Schottelius, M.; Wester, H.J.; Czernin, J.; Eberlein, U.; Beykan, S.; Lapa, C.; Riedmiller, H.; et al. Biodistribution and radiation dosimetry for a probe targeting prostate-specific membrane antigen for imaging and therapy. J. Nucl. Med. 2015, 56, 855–861. [Google Scholar] [CrossRef] [PubMed]
- Weineisen, M.; Schottelius, M.; Simecek, J.; Baum, R.P.; Yildiz, A.; Beykan, S.; Kulkarni, H.R.; Lassmann, M.; Klette, I.; Eiber, M.; et al. 68Ga- and 177Lu-Labeled PSMA I&T: Optimization of a PSMA-Targeted Theranostic Concept and First Proof-of-Concept Human Studies. J. Nucl. Med. 2015, 56, 1169–1176. [Google Scholar] [CrossRef] [PubMed]
- Rogakou, E.P.; Boon, C.; Redon, C.; Bonner, W.M. Megabase chromatin domains involved in DNA double-strand breaks in vivo. J. Cell Biol. 1999, 146, 905–916. [Google Scholar] [CrossRef]
- Rogakou, E.P.; Pilch, D.R.; Orr, A.H.; Ivanova, V.S.; Bonner, W.M. DNA double-stranded breaks induce histone H2AX phosphorylation on serine 139. J. Biol. Chem. 1998, 273, 5858–5868. [Google Scholar] [CrossRef]
- Schultz, L.B.; Chehab, N.H.; Malikzay, A.; Halazonetis, T.D. p53 binding protein 1 (53BP1) is an early participant in the cellular response to DNA double-strand breaks. J. Cell Biol. 2000, 151, 1381–1390. [Google Scholar] [CrossRef]
- Schumann, S.; Scherthan, H.; Lapa, C.; Serfling, S.; Muhtadi, R.; Lassmann, M.; Eberlein, U. DNA damage in blood leucocytes of prostate cancer patients during therapy with 177Lu-PSMA. Eur. J. Nucl. Med. Mol. Imaging 2019. [Google Scholar] [CrossRef]
- Eberlein, U.; Scherthan, H.; Bluemel, C.; Peper, M.; Lapa, C.; Buck, A.K.; Port, M.; Lassmann, M. DNA Damage in Peripheral Blood Lymphocytes of Thyroid Cancer Patients after Radioiodine Therapy. J. Nucl. Med. 2016, 57, 173–179. [Google Scholar] [CrossRef]
- Eberlein, U.; Nowak, C.; Bluemel, C.; Buck, A.K.; Werner, R.A.; Scherthan, H.; Lassmann, M. DNA damage in blood lymphocytes in patients after 177Lu peptide receptor radionuclide therapy. Eur. J. Nucl. Med. Mol. Imaging 2015, 42, 1739–1749. [Google Scholar] [CrossRef]
- Eberlein, U.; Peper, M.; Fernandez, M.; Lassmann, M.; Scherthan, H. Calibration of the gamma-H2AX DNA double strand break focus assay for internal radiation exposure of blood lymphocytes. PLoS ONE 2015, 10, e0123174. [Google Scholar] [CrossRef]
- Schumann, S.; Eberlein, U.; Muller, J.; Scherthan, H.; Lassmann, M. Correlation of the absorbed dose to the blood and DNA damage in leukocytes after internal ex-vivo irradiation of blood samples with Ra-224. EJNMMI Res. 2018, 8, 77. [Google Scholar] [CrossRef] [PubMed]
- Schumann, S.; Eberlein, U.; Muhtadi, R.; Lassmann, M.; Scherthan, H. DNA damage in leukocytes after internal ex-vivo irradiation of blood with the alpha-emitter Ra-223. Sci. Rep. 2018, 8, 2286. [Google Scholar] [CrossRef] [PubMed]
- Lassmann, M.; Hanscheid, H.; Gassen, D.; Biko, J.; Meineke, V.; Reiners, C.; Scherthan, H. In vivo formation of gamma-H2AX and 53BP1 DNA repair foci in blood cells after radioiodine therapy of differentiated thyroid cancer. J. Nucl. Med. 2010, 51, 1318–1325. [Google Scholar] [CrossRef] [PubMed]
- Rief, M.; Hartmann, L.; Geisel, D.; Richter, F.; Brenner, W.; Dewey, M. DNA double-strand breaks in blood lymphocytes induced by two-day 99mTc-MIBI myocardial perfusion scintigraphy. Eur. Radiol. 2018, 28, 3075–3081. [Google Scholar] [CrossRef] [PubMed]
- Lee, W.H.; Nguyen, P.; Hu, S.; Liang, G.; Ong, S.G.; Han, L.; Sanchez-Freire, V.; Lee, A.S.; Vasanawala, M.; Segall, G.; et al. Variable activation of the DNA damage response pathways in patients undergoing single-photon emission computed tomography myocardial perfusion imaging. Circ. Cardiovasc. Imaging 2015, 8, e002851. [Google Scholar] [CrossRef]
- Okuda, K.; Watanabe, N.; Hashimoto, M.; Doai, M.; Kawai, Y.; Takahashi, T.; Arikawa, T.; Ooiso, K.; Sunatani, Y.; Iwabuchi, K.; et al. Preliminary quantitative evaluation of radiation-induced DNA damage in peripheral blood lymphocytes after cardiac dual-isotope imaging. Appl. Radiat. Isot. 2019, 154, 108890. [Google Scholar] [CrossRef]
- May, M.S.; Brand, M.; Wuest, W.; Anders, K.; Kuwert, T.; Prante, O.; Schmidt, D.; Maschauer, S.; Semelka, R.C.; Uder, M.; et al. Induction and repair of DNA double-strand breaks in blood lymphocytes of patients undergoing 18F-FDG PET/CT examinations. Eur. J. Nucl. Med. Mol. Imaging 2012, 39, 1712–1719. [Google Scholar] [CrossRef]
- Schnarr, K.; Carter, T.F.; Gillis, D.; Webber, C.; Lemon, J.A.; Dayes, I.; Dolling, J.A.; Gulenchyn, K.; Boreham, D.R. Biological Response of Positron Emission Tomography Scan Exposure and Adaptive Response in Humans. Dose Response 2015, 13, 1559325815611904. [Google Scholar] [CrossRef]
- Prasad, A.; Visweswaran, S.; Kanagaraj, K.; Raavi, V.; Arunan, M.; Venkatachalapathy, E.; Paneerselvam, S.; Jose, M.T.; Ozhimuthu, A.; Perumal, V. 18F-FDG PET/CT scanning: Biological effects on patients: Entrance surface dose, DNA damage, and chromosome aberrations in lymphocytes. Mutat. Res. 2019, 838, 59–66. [Google Scholar] [CrossRef]
- Nautiyal, A.; Mondal, T.; Mukherjee, A.; Mitra, D.; Kaushik, A.; Goel, H.C.; Goel, A.; Dey, S.K. Quantification of DNA damage in patients undergoing non-contrast and contrast enhanced whole body PET/CT investigations using comet assay and micronucleus assay. Int. J. Radiat. Biol. 2019. [Google Scholar] [CrossRef]
- Beels, L.; Werbrouck, J.; Thierens, H. Dose response and repair kinetics of gamma-H2AX foci induced by in vitro irradiation of whole blood and T-lymphocytes with X- and gamma-radiation. Int. J. Radiat. Biol. 2010, 86, 760–768. [Google Scholar] [CrossRef] [PubMed]
- Beels, L.; Bacher, K.; De Wolf, D.; Werbrouck, J.; Thierens, H. gamma-H2AX foci as a biomarker for patient X-ray exposure in pediatric cardiac catheterization: Are we underestimating radiation risks? Circulation 2009, 120, 1903–1909. [Google Scholar] [CrossRef] [PubMed]
- Beels, L.; Bacher, K.; Smeets, P.; Verstraete, K.; Vral, A.; Thierens, H. Dose-length product of scanners correlates with DNA damage in patients undergoing contrast CT. Eur. J. Radiol. 2012, 81, 1495–1499. [Google Scholar] [CrossRef] [PubMed]
- Vandevoorde, C.; Franck, C.; Bacher, K.; Breysem, L.; Smet, M.H.; Ernst, C.; De Backer, A.; Van De Moortele, K.; Smeets, P.; Thierens, H. gamma-H2AX foci as in vivo effect biomarker in children emphasize the importance to minimize x-ray doses in paediatric CT imaging. Eur. Radiol. 2015, 25, 800–811. [Google Scholar] [CrossRef] [PubMed]
- Waldren, C.A. Classical radiation biology dogma, bystander effects and paradigm shifts. Hum. Exp. Toxicol. 2004, 23, 95–100. [Google Scholar] [CrossRef]
- Rothkamm, K.; Löbrich, M. Evidence for a lack of DNA double-strand break repair in human cells exposed to very low x-ray doses. Proc. Natl. Acad. Sci. USA 2003, 100, 5057–5062. [Google Scholar] [CrossRef]
- Grudzenski, S.; Raths, A.; Conrad, S.; Rübe, C.E.; Löbrich, M. Inducible response required for repair of low-dose radiation damage in human fibroblasts. Proc. Natl. Acad. Sci. USA 2010, 107, 14205–14210. [Google Scholar] [CrossRef]
- Lengert, N.; Mirsch, J.; Weimer, R.N.; Schumann, E.; Haub, P.; Drossel, B.; Lobrich, M. AutoFoci, an automated high-throughput foci detection approach for analyzing low-dose DNA double-strand break repair. Sci. Rep. 2018, 8, 17282. [Google Scholar] [CrossRef]
- Harbron, R.; Ainsbury, E.A.; Bouffler, S.D.; Tanner, R.J.; Eakins, J.S.; Pearce, M.S. Enhanced radiation dose and DNA damage associated with iodinated contrast media in diagnostic X-ray imaging. Br. J. Radiol. 2017, 90, 20170028. [Google Scholar] [CrossRef]
- Jost, G.; Golfier, S.; Pietsch, H.; Lengsfeld, P.; Voth, M.; Schmid, T.E.; Eckardt-Schupp, F.; Schmid, E. The influence of X-ray contrast agents in computed tomography on the induction of dicentrics and gamma-H2AX foci in lymphocytes of human blood samples. Phys. Med. Biol. 2009, 54, 6029–6039. [Google Scholar] [CrossRef]
- Grudzenski, S.; Kuefner, M.A.; Heckmann, M.B.; Uder, M.; Löbrich, M. Contrast medium-enhanced radiation damage caused by CT examinations. Radiology 2009, 253, 706–714. [Google Scholar] [CrossRef] [PubMed]
- Pathe, C.; Eble, K.; Schmitz-Beuting, D.; Keil, B.; Kaestner, B.; Voelker, M.; Kleb, B.; Klose, K.J.; Heverhagen, J.T. The presence of iodinated contrast agents amplifies DNA radiation damage in computed tomography. Contrast Media Mol. Imaging 2011, 6, 507–513. [Google Scholar] [CrossRef] [PubMed]
- Deinzer, C.K.; Danova, D.; Kleb, B.; Klose, K.J.; Heverhagen, J.T. Influence of different iodinated contrast media on the induction of DNA double-strand breaks after in vitro X-ray irradiation. Contrast Media Mol. Imaging 2014, 9, 259–267. [Google Scholar] [CrossRef] [PubMed]
- Gould, R.; McFadden, S.L.; Horn, S.; Prise, K.M.; Doyle, P.; Hughes, C.M. Assessment of DNA double-strand breaks induced by intravascular iodinated contrast media following in vitro irradiation and in vivo, during paediatric cardiac catheterization. Contrast Media Mol. Imaging 2016, 11, 122–129. [Google Scholar] [CrossRef]
- Piechowiak, E.I.; Peter, J.F.; Kleb, B.; Klose, K.J.; Heverhagen, J.T. Intravenous Iodinated Contrast Agents Amplify DNA Radiation Damage at CT. Radiology 2015, 275, 692–697. [Google Scholar] [CrossRef]
- Wang, L.; Li, Q.; Wang, X.M.; Hao, G.Y.; Jie, B.; Hu, S.; Hu, C.H. Enhanced radiation damage caused by iodinated contrast agents during CT examination. Eur. J. Radiol. 2017, 92, 72–77. [Google Scholar] [CrossRef]
- Harbron, R.W.; Ainsbury, E.A.; Bouffler, S.D.; Tanner, R.J.; Pearce, M.S.; Eakins, J.S. The impact of iodinated contrast media on intravascular and extravascular absorbed doses in X-ray imaging: A microdosimetric analysis. Phys. Med. 2018, 46, 140–147. [Google Scholar] [CrossRef]
- Chronis, F.; Rogakou, E.P. Interplay Between γH2AX and 53BP1 Pathways in DNA Double-Strand Break Repair Response. In Apoptosis, Senescence, and Cancer. Cancer Drug Discovery and Development; Gewirtz, D.A., Holt, S.E., Grant, S., Eds.; Humana Press: Totowa, NJ, USA, 2007; pp. 243–263. [Google Scholar] [CrossRef]
- Bolch, W.E.; Eckerman, K.F.; Sgouros, G.; Thomas, S.R. MIRD pamphlet No. 21: A generalized schema for radiopharmaceutical dosimetry—Standardization of nomenclature. J. Nucl. Med. 2009, 50, 477–484. [Google Scholar] [CrossRef]
- Eckerman, K.F.; Endo, A. MIRD: Radionuclide Data and Decay Schemes, 2nd ed.; Society of Nuclear Medicine: Reston, VA, USA, 2008. [Google Scholar]
- Stabin, M.G.; Sparks, R.B.; Crowe, E. OLINDA/EXM: The second-generation personal computer software for internal dose assessment in nuclear medicine. J. Nucl. Med. 2005, 46, 1023–1027. [Google Scholar]
- Lamkowski, A.; Forcheron, F.; Agay, D.; Ahmed, E.A.; Drouet, M.; Meineke, V.; Scherthan, H. DNA damage focus analysis in blood samples of minipigs reveals acute partial body irradiation. PLoS ONE 2014, 9, e87458. [Google Scholar] [CrossRef]
- Rothkamm, K.; Barnard, S.; Moquet, J.; Ellender, M.; Rana, Z.; Burdak-Rothkamm, S. DNA damage foci: Meaning and significance. Environ. Mol. Mutagen. 2015, 56, 491–504. [Google Scholar] [CrossRef]


© 2020 by the authors. Licensee MDPI, Basel, Switzerland. This article is an open access article distributed under the terms and conditions of the Creative Commons Attribution (CC BY) license (http://creativecommons.org/licenses/by/4.0/).
Share and Cite
Schumann, S.; Scherthan, H.; Frank, T.; Lapa, C.; Müller, J.; Seifert, S.; Lassmann, M.; Eberlein, U. DNA Damage in Blood Leukocytes of Prostate Cancer Patients Undergoing PET/CT Examinations with [68Ga]Ga-PSMA I&T. Cancers 2020, 12, 388. https://doi.org/10.3390/cancers12020388
Schumann S, Scherthan H, Frank T, Lapa C, Müller J, Seifert S, Lassmann M, Eberlein U. DNA Damage in Blood Leukocytes of Prostate Cancer Patients Undergoing PET/CT Examinations with [68Ga]Ga-PSMA I&T. Cancers. 2020; 12(2):388. https://doi.org/10.3390/cancers12020388
Chicago/Turabian StyleSchumann, Sarah, Harry Scherthan, Torsten Frank, Constantin Lapa, Jessica Müller, Simone Seifert, Michael Lassmann, and Uta Eberlein. 2020. "DNA Damage in Blood Leukocytes of Prostate Cancer Patients Undergoing PET/CT Examinations with [68Ga]Ga-PSMA I&T" Cancers 12, no. 2: 388. https://doi.org/10.3390/cancers12020388
APA StyleSchumann, S., Scherthan, H., Frank, T., Lapa, C., Müller, J., Seifert, S., Lassmann, M., & Eberlein, U. (2020). DNA Damage in Blood Leukocytes of Prostate Cancer Patients Undergoing PET/CT Examinations with [68Ga]Ga-PSMA I&T. Cancers, 12(2), 388. https://doi.org/10.3390/cancers12020388