Non-Invasive Early Detection of Oral Cancers Using Fluorescence Visualization with Optical Instruments

 , and
, and
Simple Summary
Abstract
1. Introduction
2. Results
2.1. Patients Characteristics
2.2. Conditions
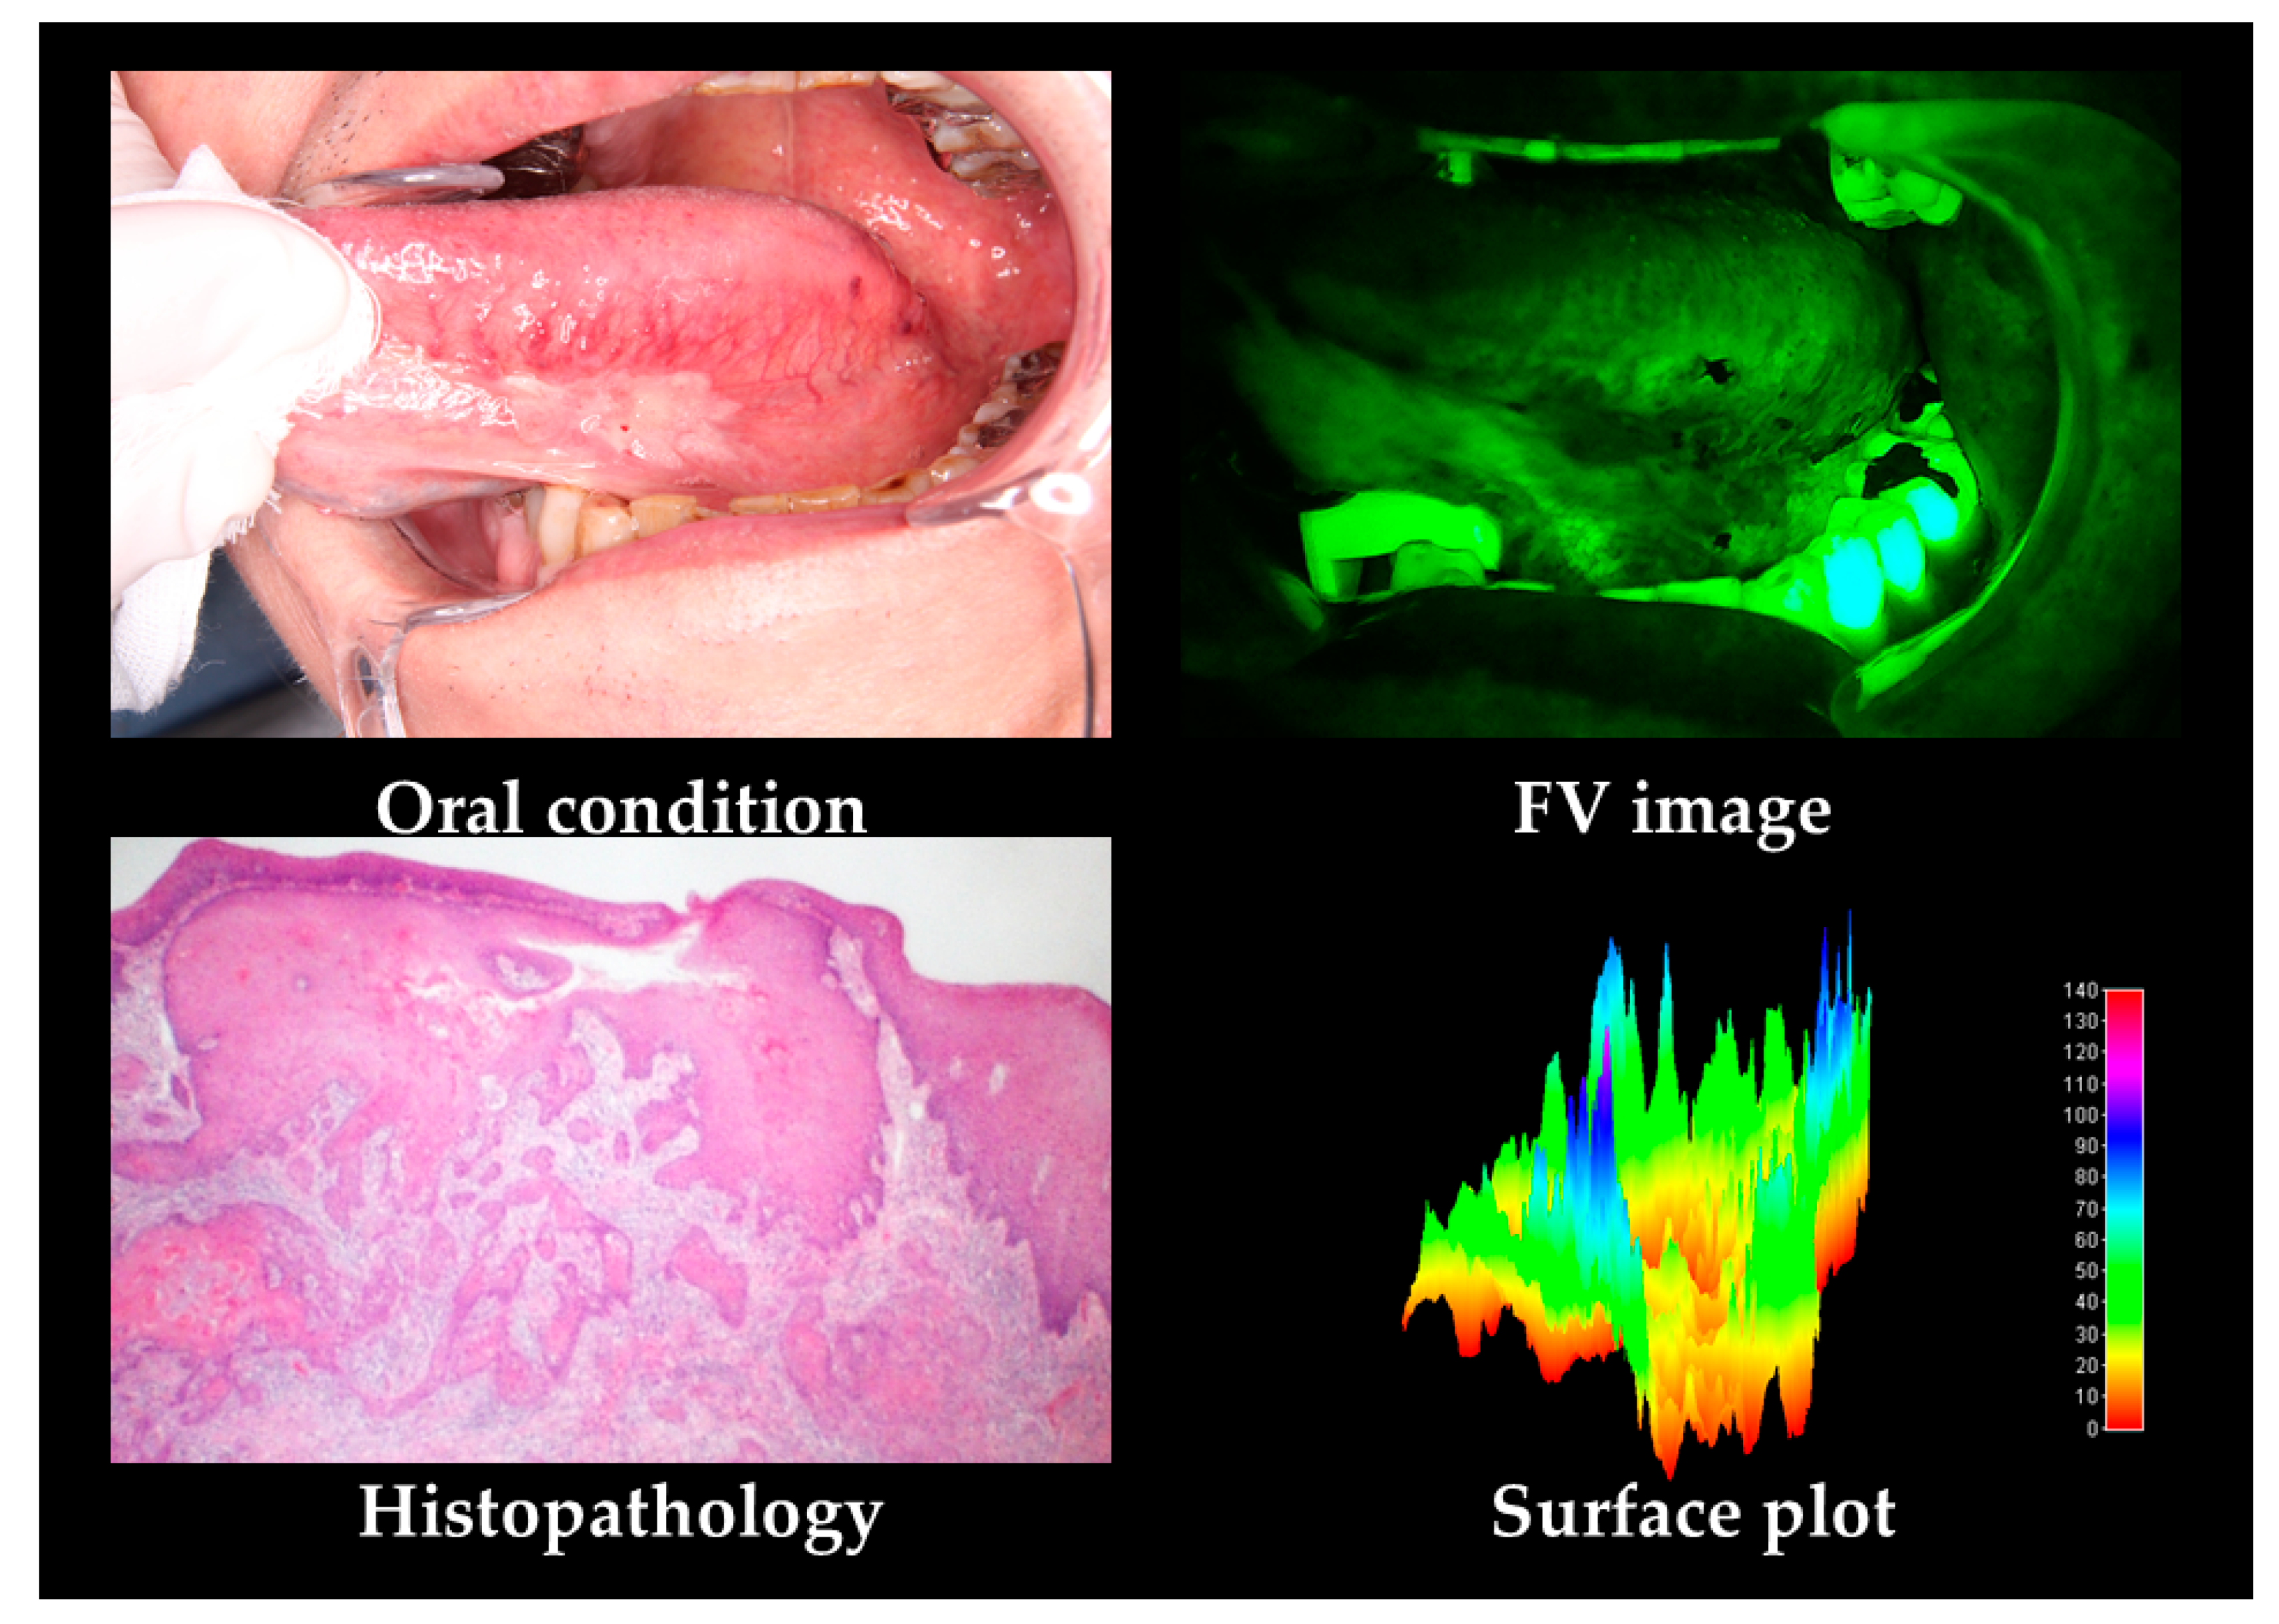
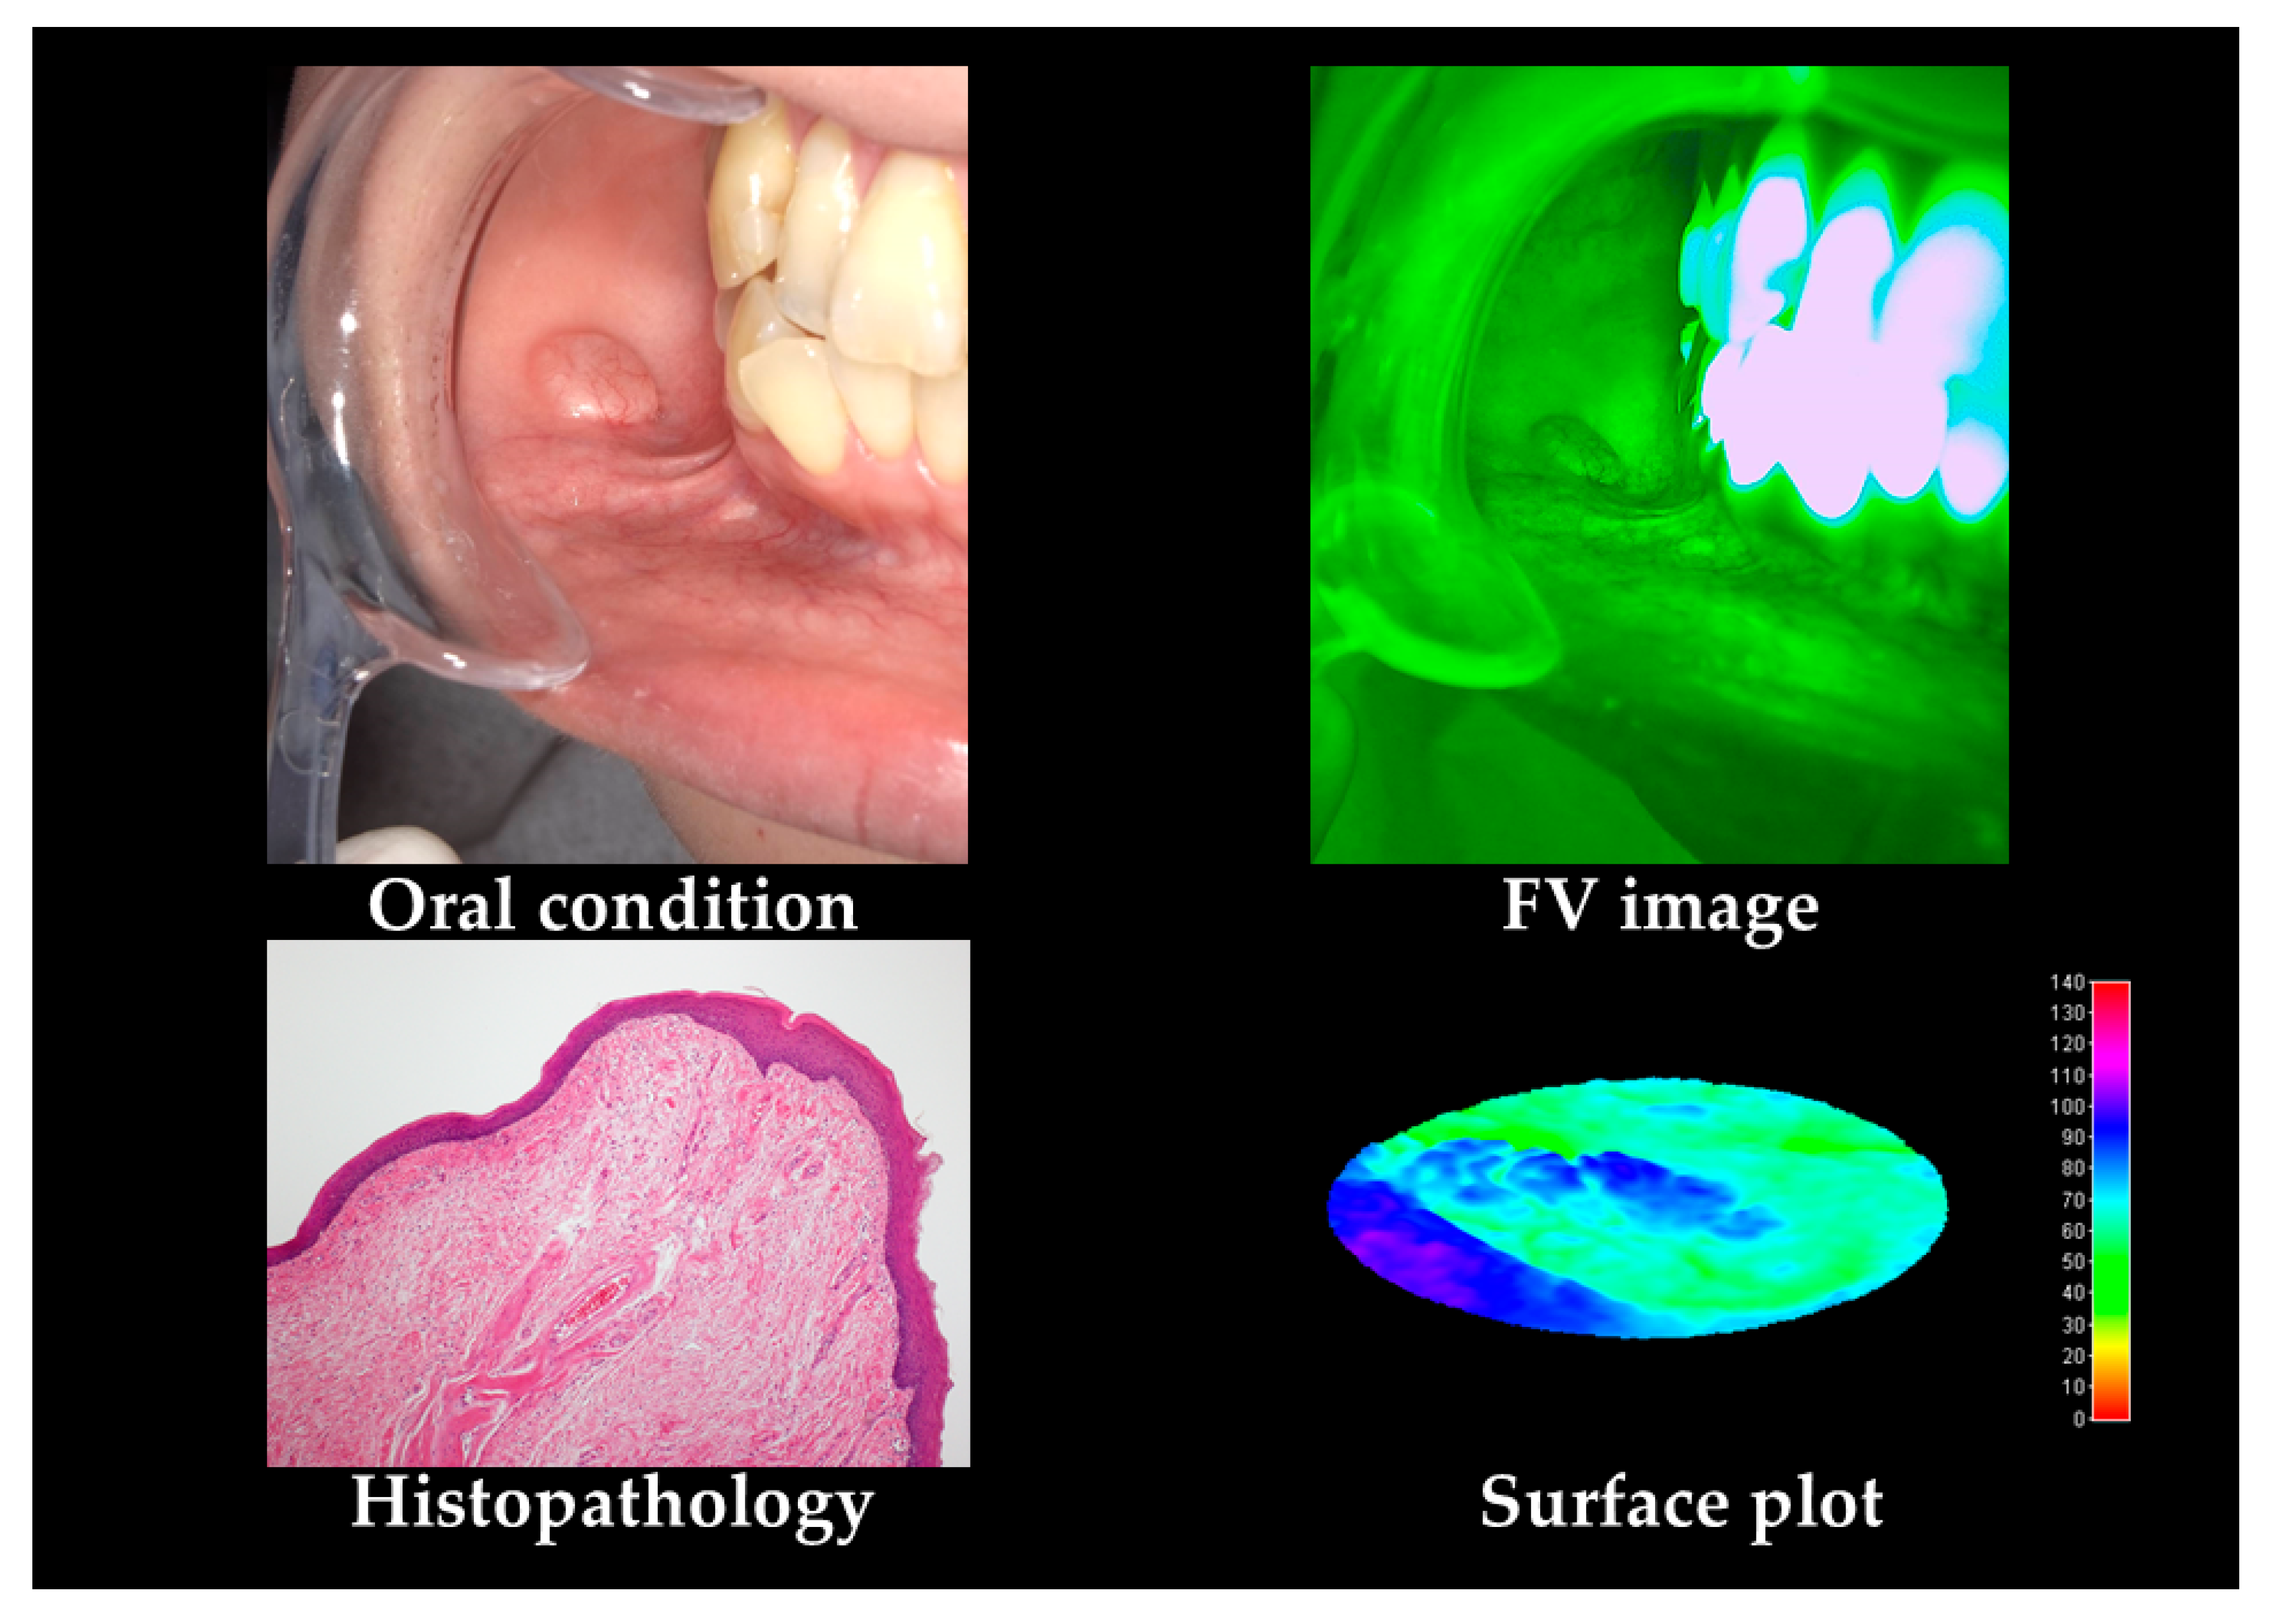
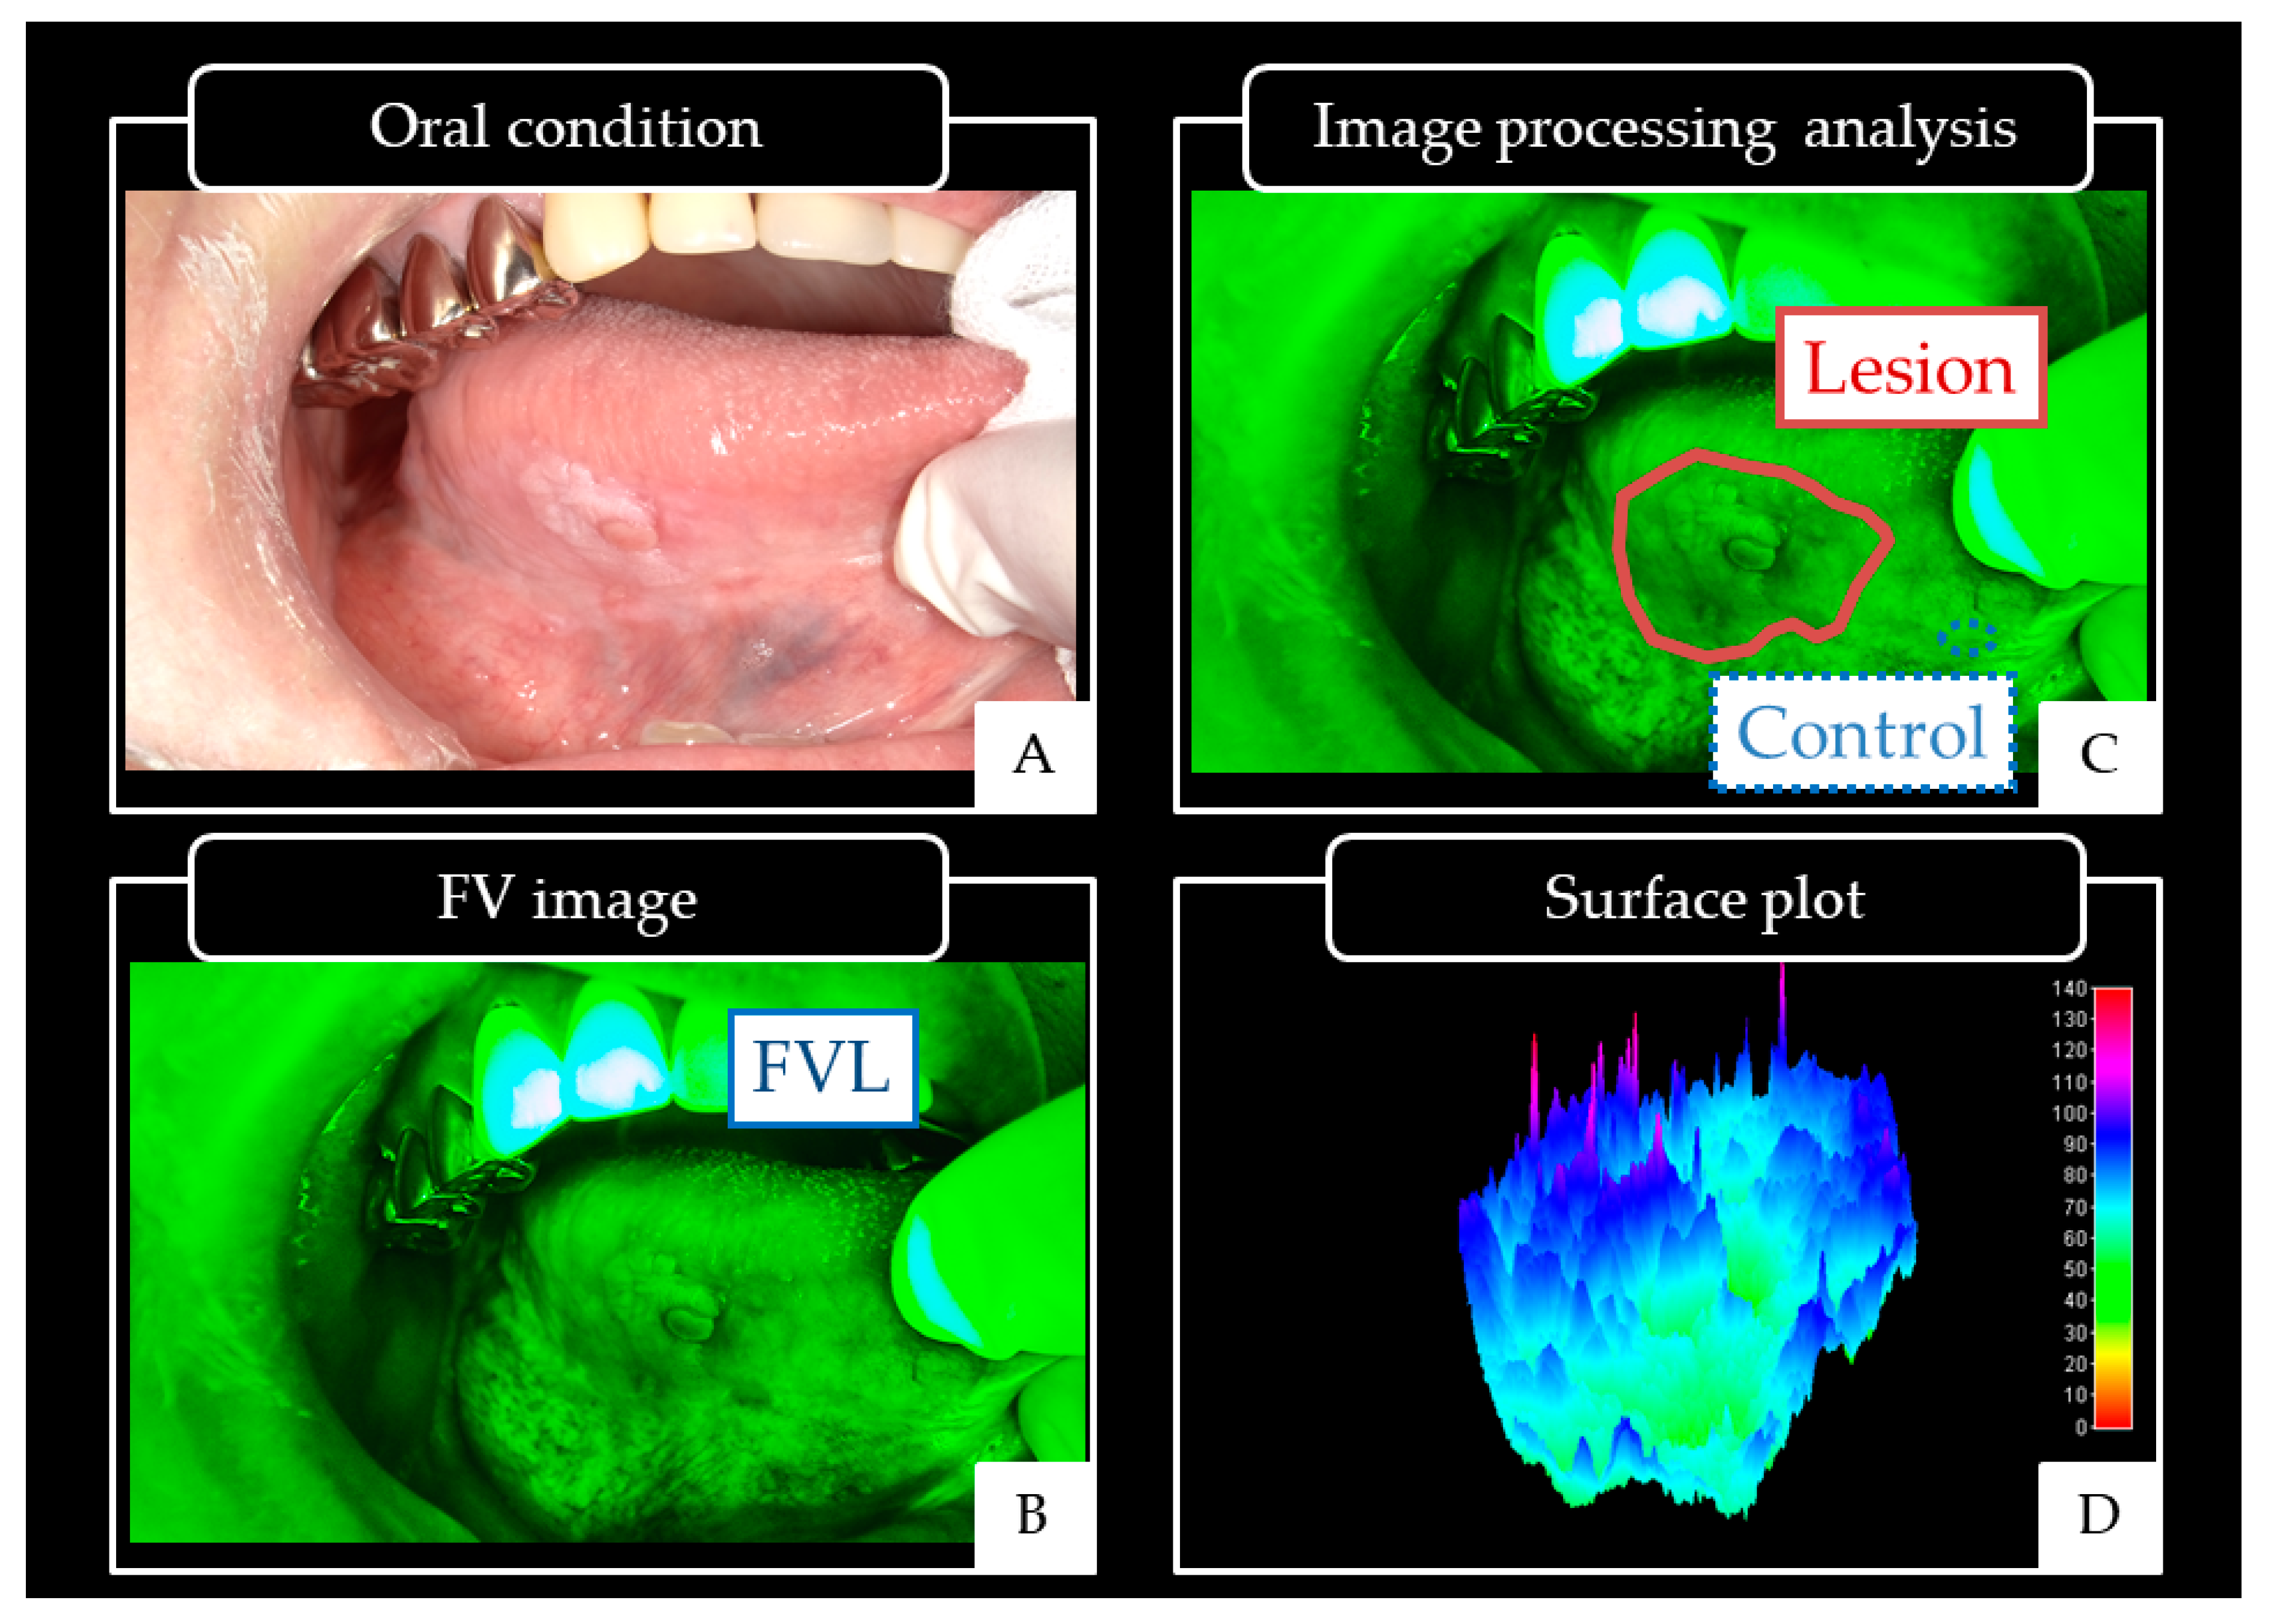
2.2.1. Oral Cancers
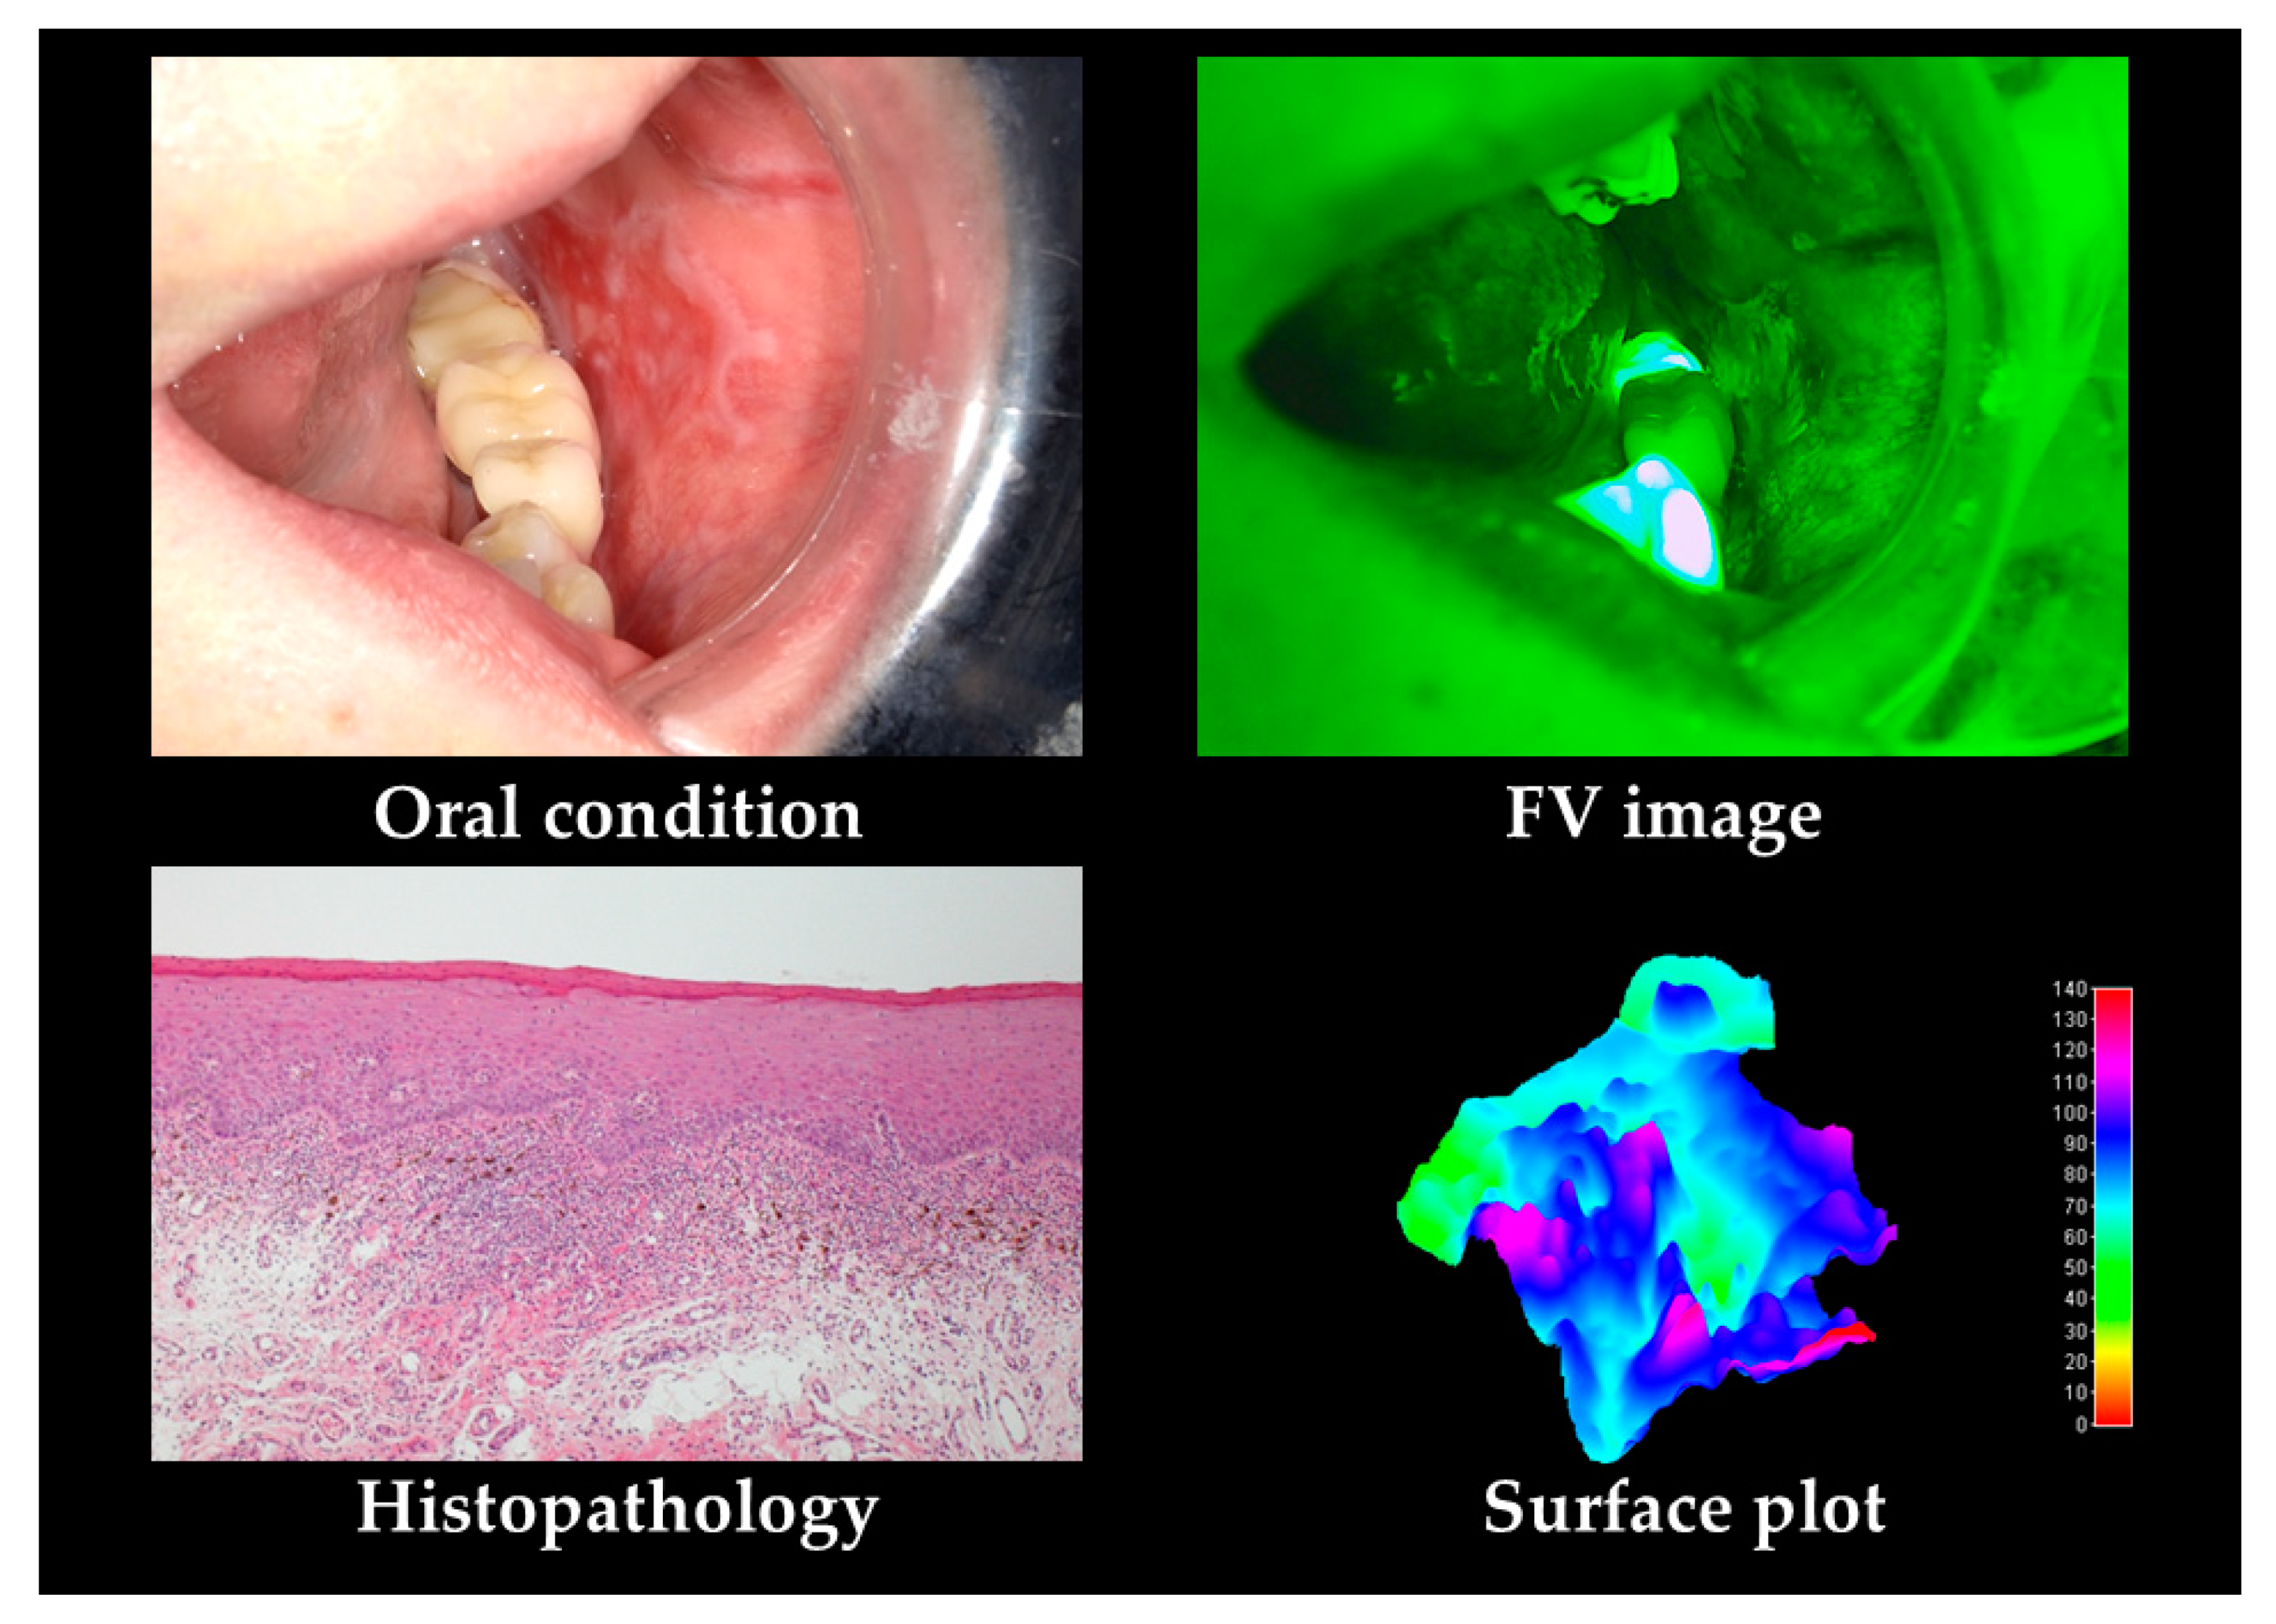
2.2.2. OPMDs
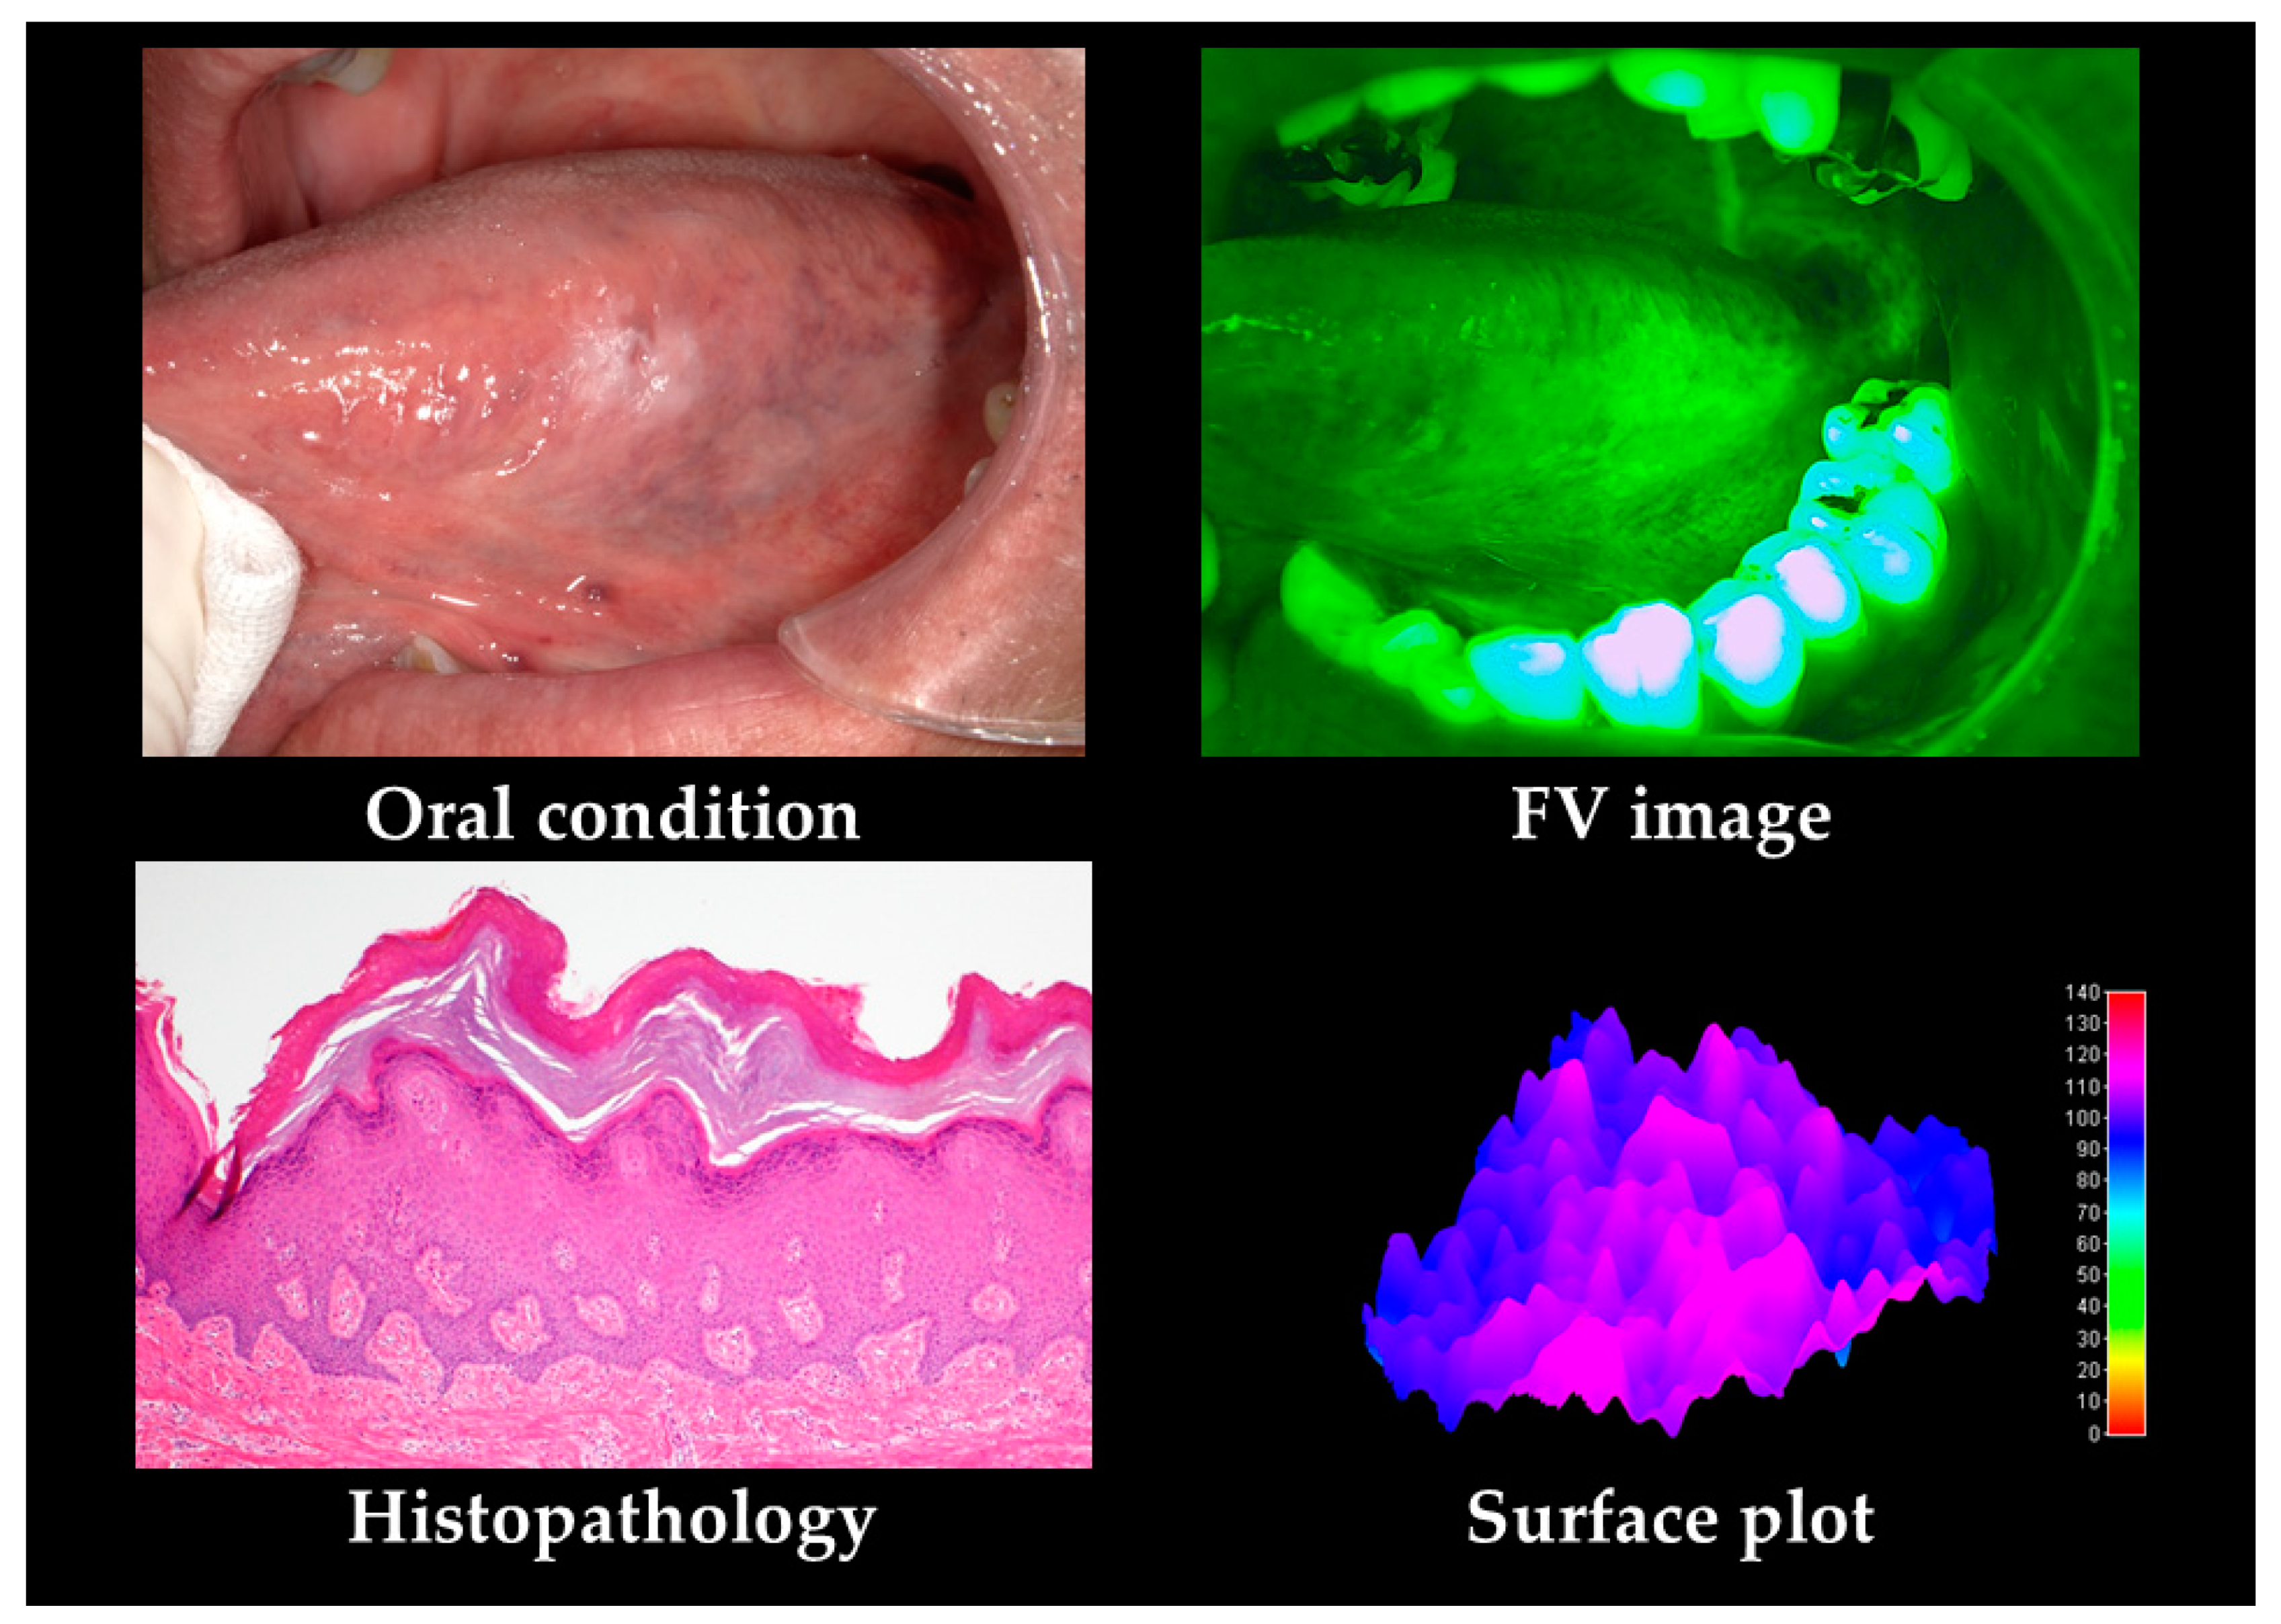
2.2.3. Others
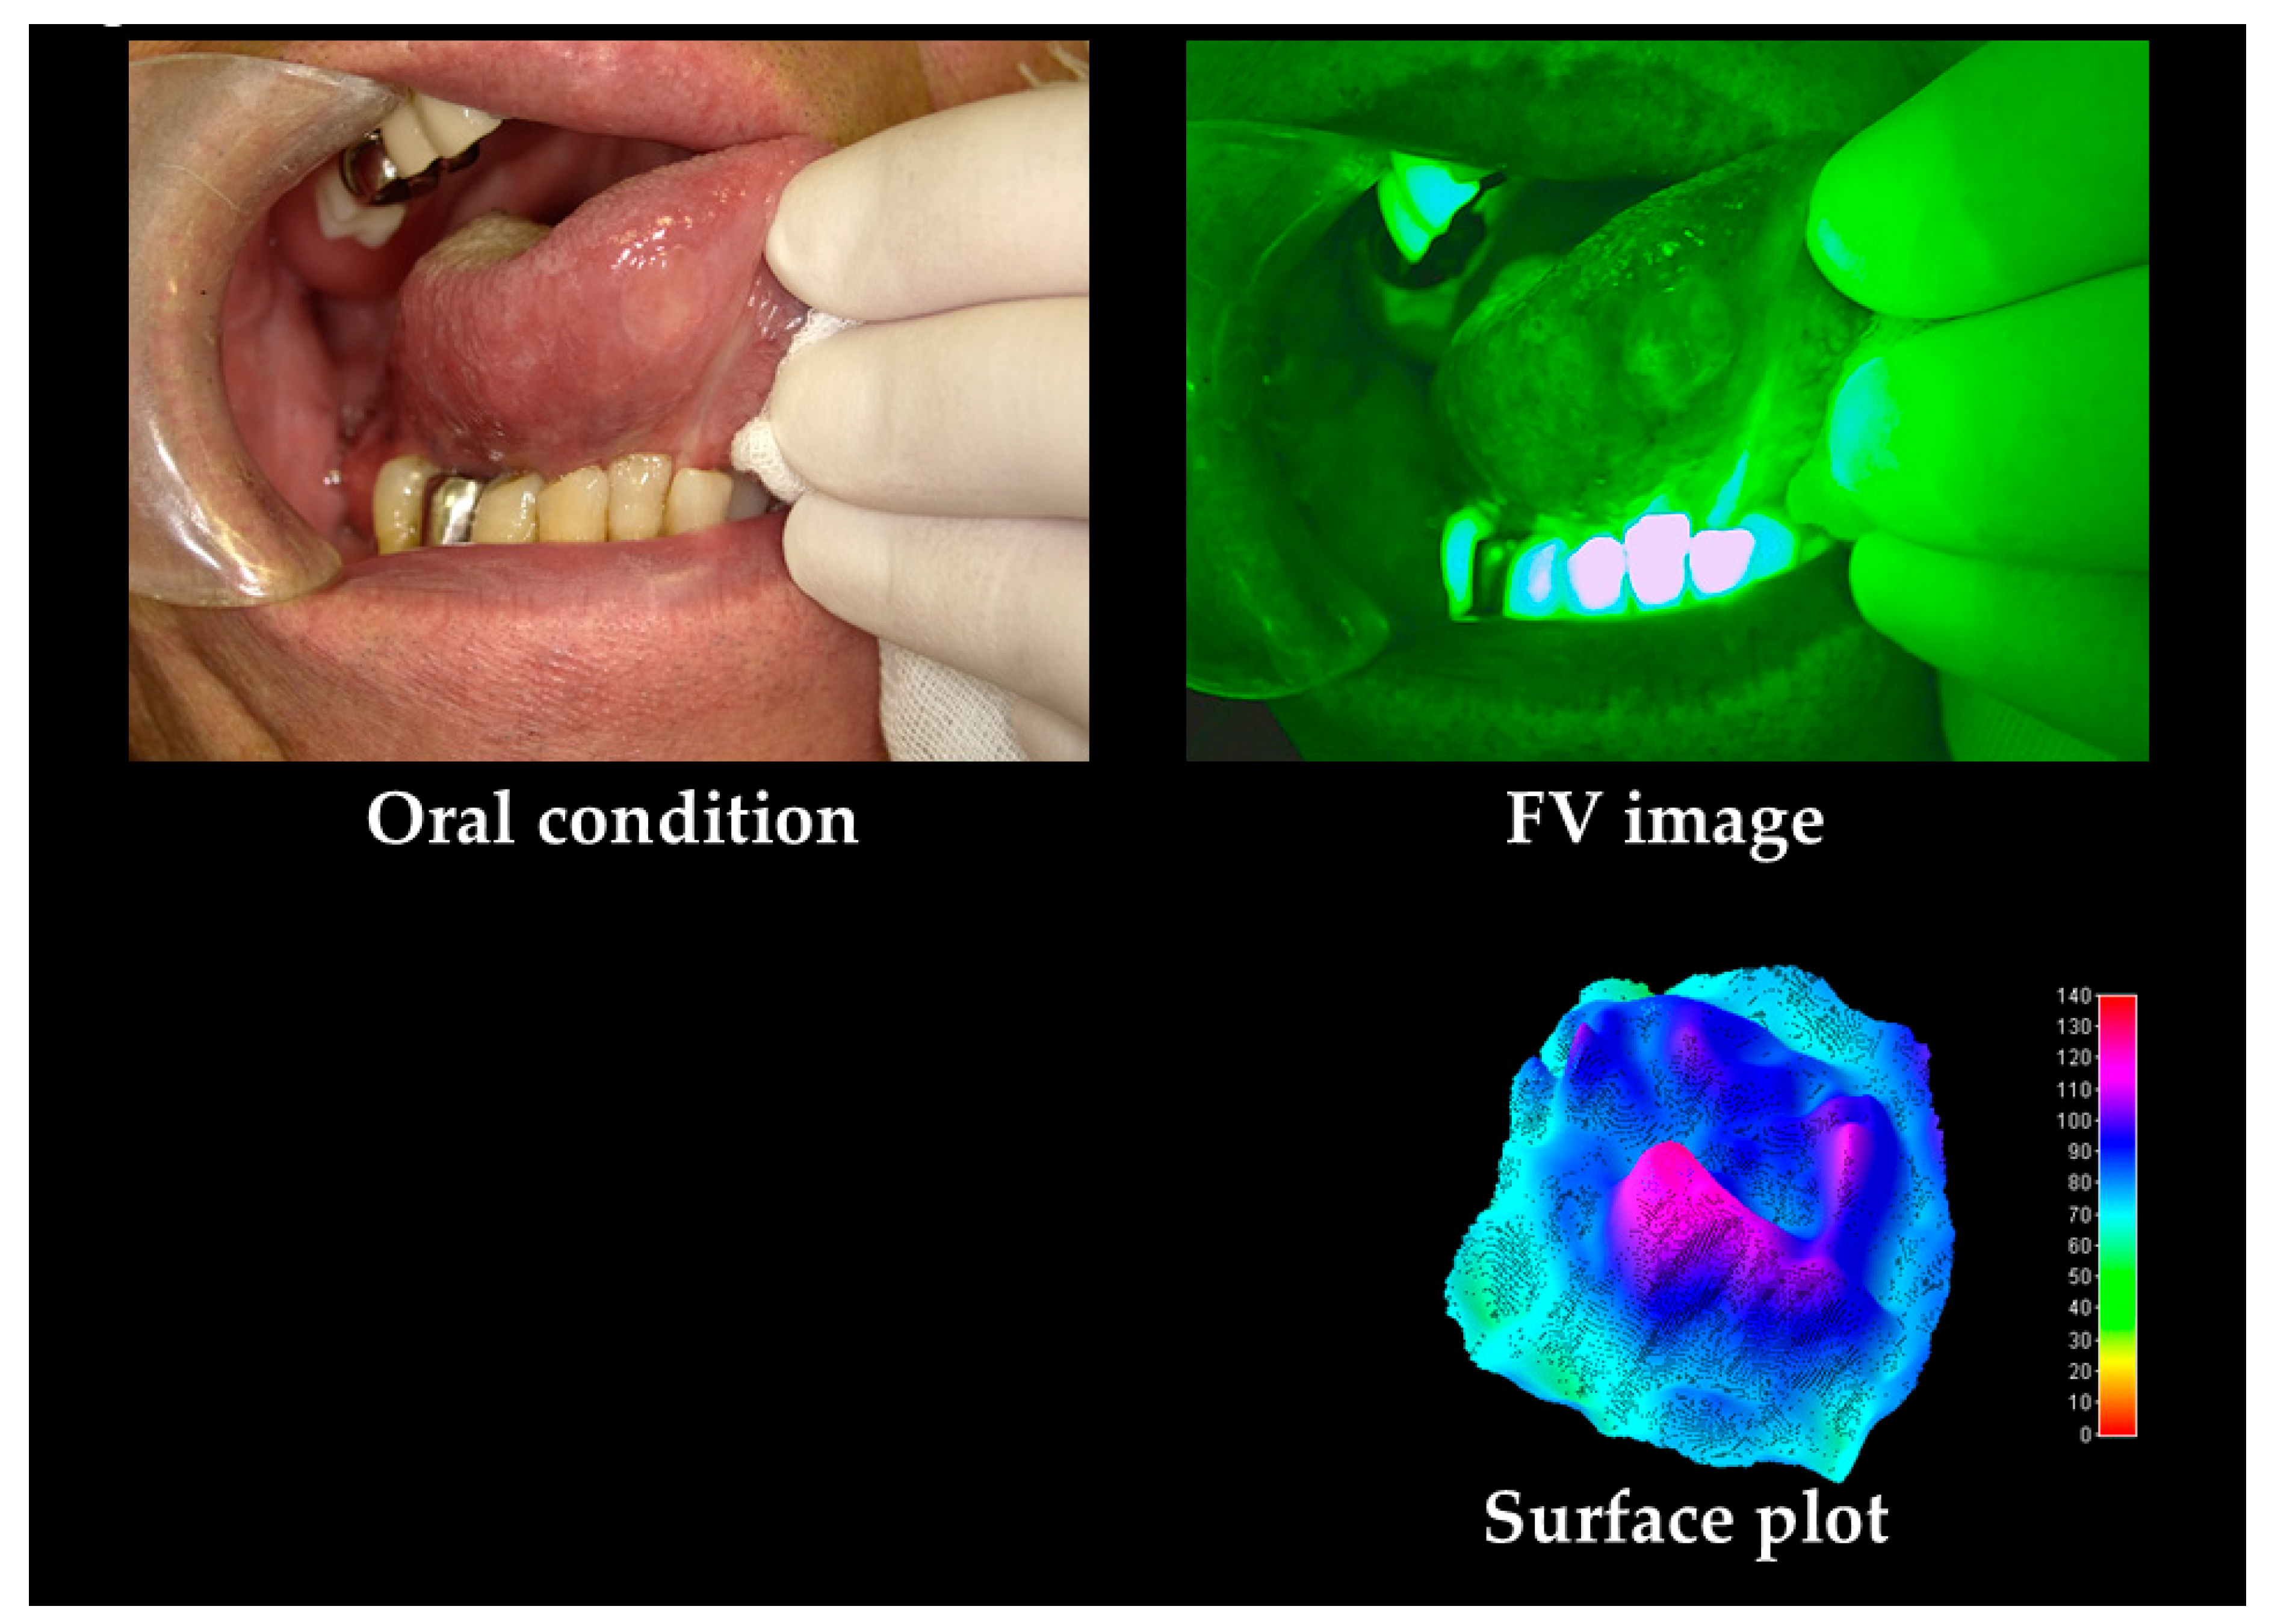
2.3. Analysis
2.3.1. Comparison between Each Group
2.3.2. Detection of Oral Cancers
2.3.3. Combination of Each Factor for Detection of Oral Cancer
2.3.4. Detection of OPMDs
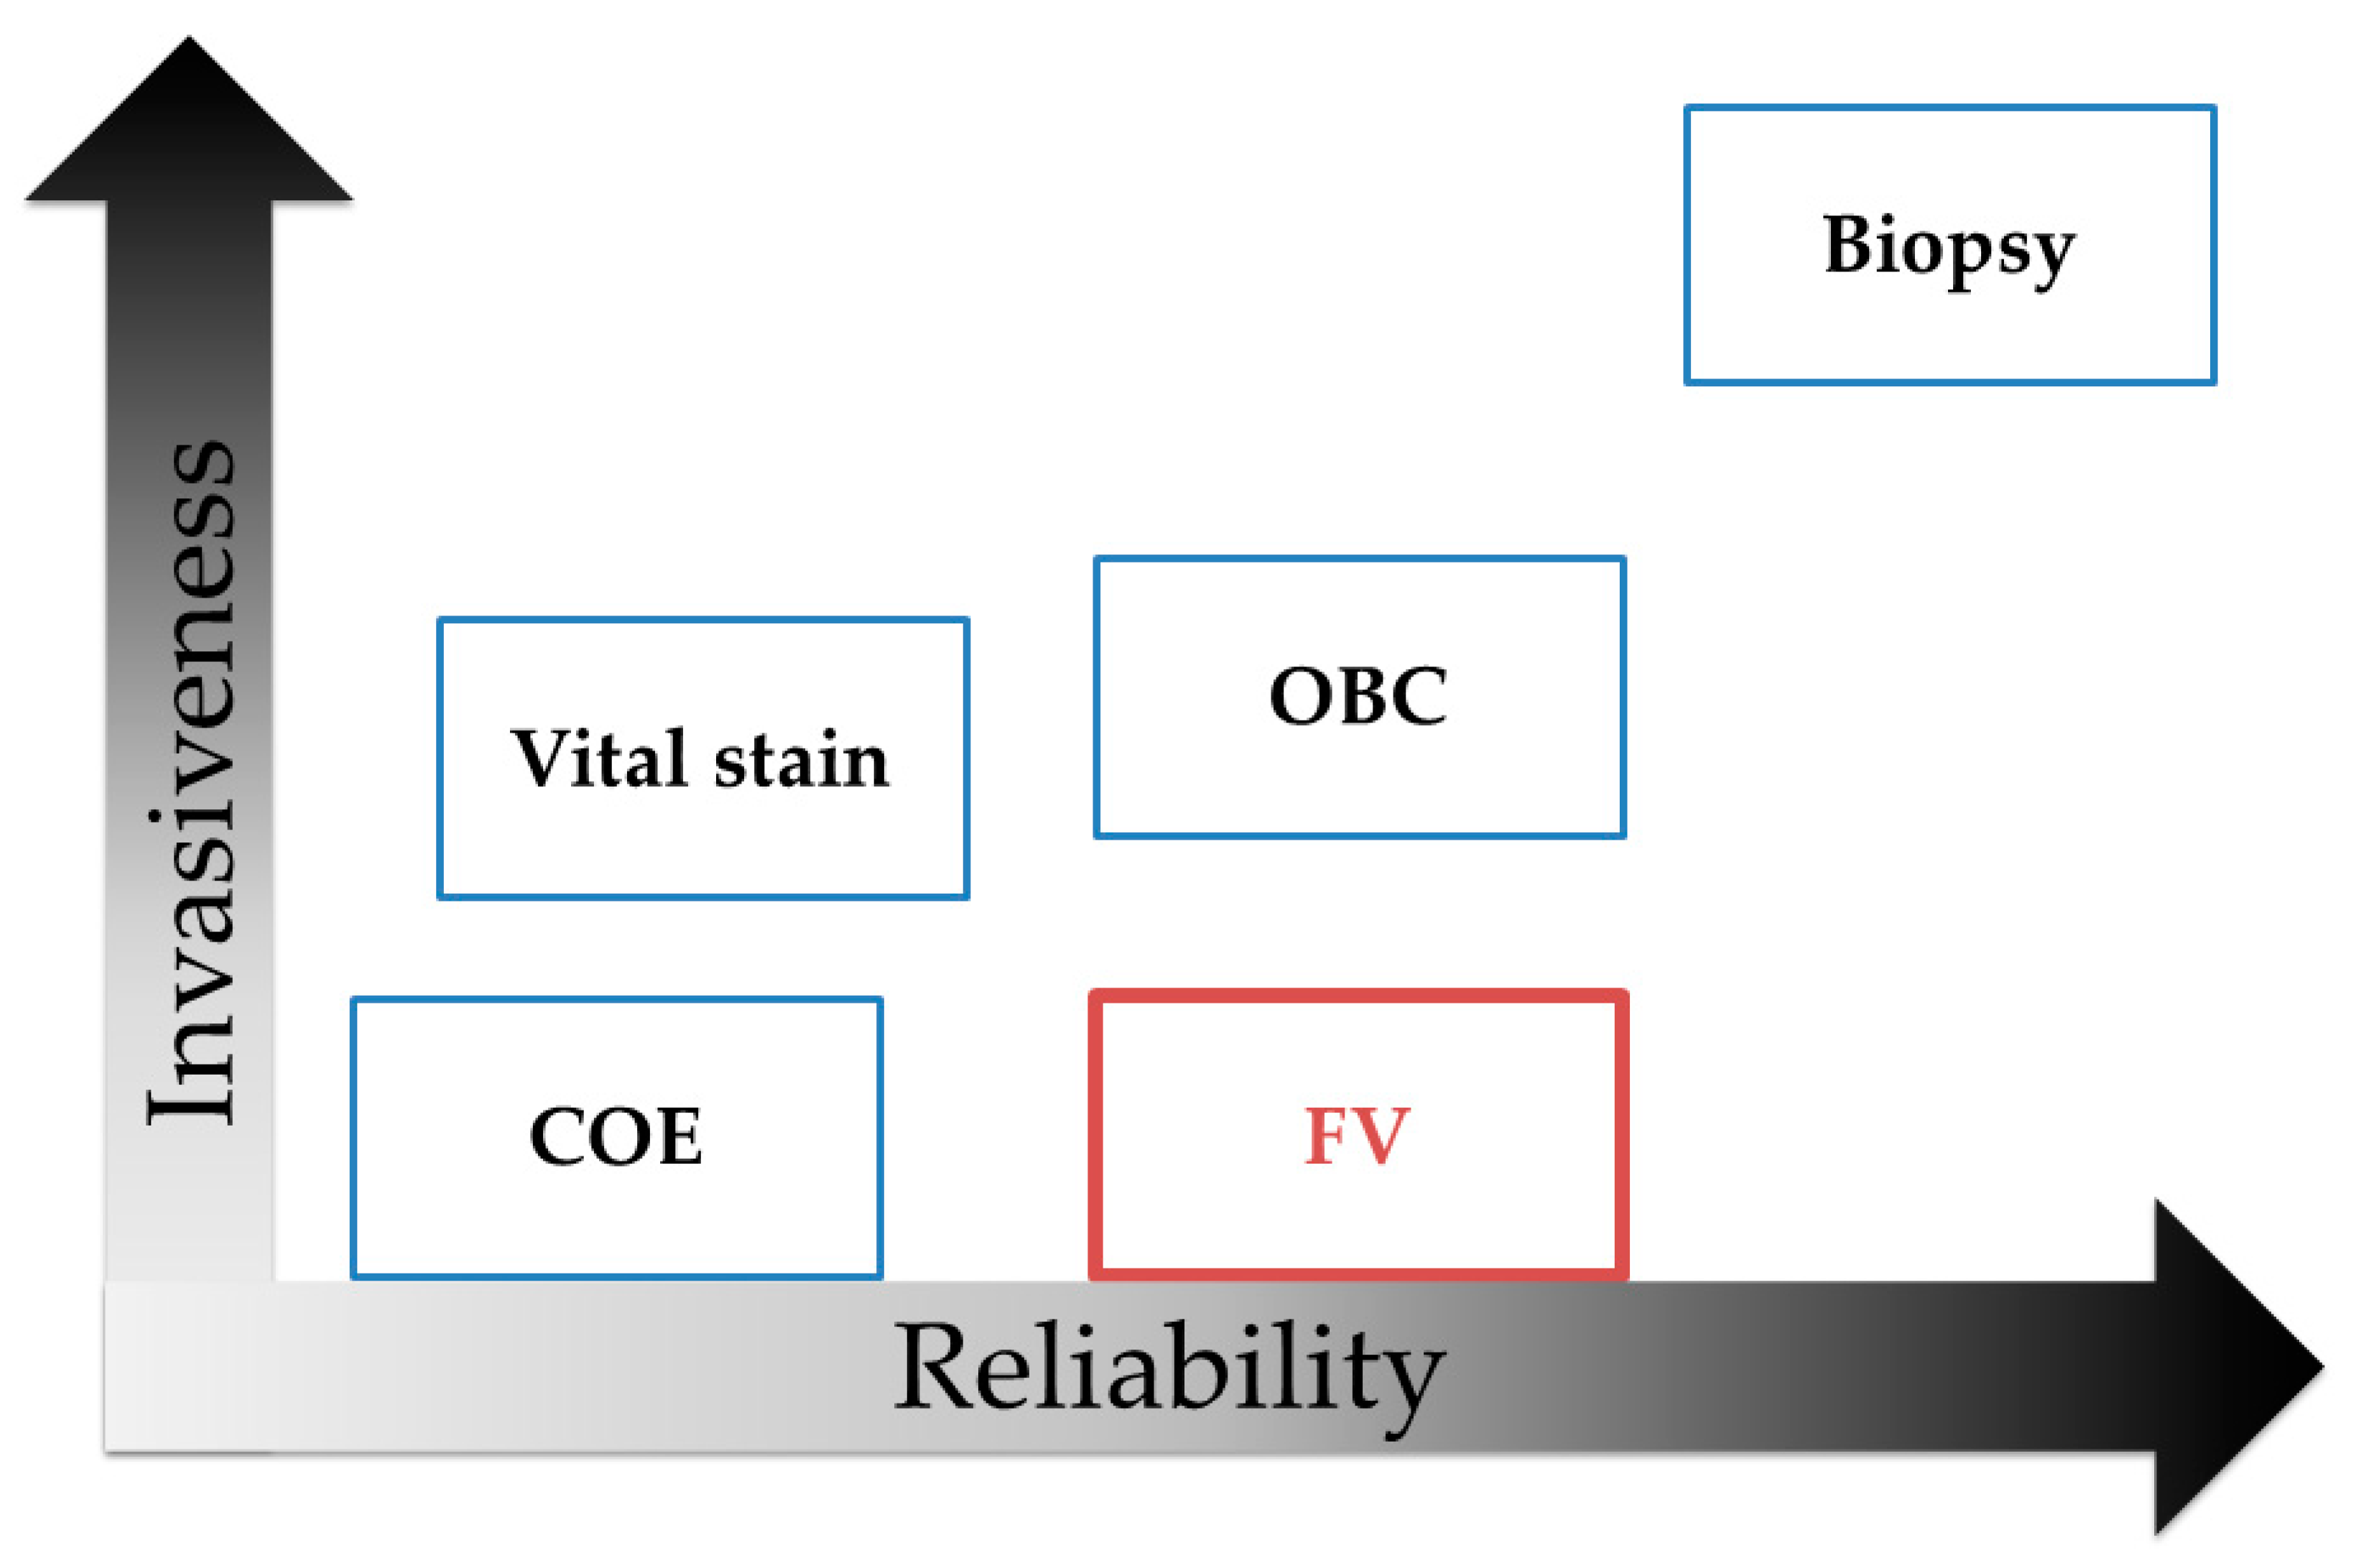
3. Discussion
4. Materials and Methods
5. Conclusions
Supplementary Materials
Author Contributions
Funding
Acknowledgments
Conflicts of Interest
Abbreviations
| OSCC | Oral squamous cell carcinoma |
| WHO | World Health Organization |
| COE | Conventional oral examination |
| GP | General dental practitioner |
| OPMDs | Oral potentially malignant disorders |
| OLP | Oral lichen planus |
| OED | Oral epithelial dysplasia |
| HRL | High-risk lesions |
| CIS | Cancer in situ |
| FV | Fluorescence visualization |
| OI | Optical instrument |
| FAD | Flavin adenine dinucleotide |
| NADH | Nicotinamide adenine dinucleotide |
| CCL | Collagen cross-links |
| FVR | Fluorescence visualization retention |
| FVL | Fluorescence visualization loss |
| MeanV | Mean G value |
| MediV | Median G value |
| SD | Standard deviation |
| CV | Coefficient of variation |
| VRatio | Value ratio |
| UICC | Union for international cancer control |
| FVA | Fluorescence visualization acceleration |
| ROC | Receiver operating characteristic |
| AUC | Area under the curve |
| OR | Odds ratio |
| CI | Confidence interval |
| OLBC | Oral liquid-based brush cytology |
| IS | Iodine solution |
| TB | Toluidine blue |
| IU | Iodine unstained |
References
- Cheraghlou, S.; Schettino, A.; Zogg, C.K.; Judson, B.L. Changing prognosis of oral cancer: An analysis of survival and treatment between 1973 and 2014. Laryngoscope 2018, 128, 2762–2769. [Google Scholar] [CrossRef]
- Japan Society for Head and Neck Cancer, Cancer Registry Committee. Report of Head and Neck Cancer Registry of Japan. Five-Year Prognosis of Patients Registered in 2011. Available online: http://www.jshnc.umin.ne.jp/pdf/2011syourei_yogo.pdf (accessed on 25 September 2020).
- Japan Society for Head and Neck Cancer, Cancer Registry Committee. Report of Head and Neck Cancer Registry of Japan Clinical Statistics of Registered Patients. 2016. Available online: http://www.jshnc.umin.ne.jp/pdf/2016syourei_houkoku.pdf (accessed on 6 April 2020).
- World Health Organization. Oral Cancer. Available online: https://www.who.int/cancer/prevention/diagnosis-screening/oral-cancer/en/ (accessed on 6 April 2020).
- El-Naggar, A.K.; Chan, J.; Takata, T.; Grandis, J.; Blootweg, P. Pathology and Genetics of Head and Neck Tumors. In WHO Classification of Tumours; IARC Press: Lyon, France, 2017. [Google Scholar]
- Ho, P.; Wang, W.C.; Huang, Y.T.; Yang, Y.H. Finding an oral potentially malignant disorder in screening program is related to early diagnosis of oral cavity cancer—Experience from real world evidence. Oral Oncol. 2019, 89, 107–114. [Google Scholar] [CrossRef] [PubMed]
- Morikawa, T.; Kosugi, A.; Shibahara, T. The Utility of Optical Instrument “ORALOOK®” in the Early Detection of High-risk Oral Mucosal Lesions. Anticancer Res. 2019, 39, 2519–2525. [Google Scholar] [CrossRef] [PubMed]
- International Union against Cancer. TNM Classification of Malignant Tumours, 8th ed.; WILEY-Blackwell: New York, NY, USA, 2017. [Google Scholar]
- Scully, C.; Bagan, J.V.; Hopper, C.; Epstein, J.B. Oral cancer: Current and future diagnostic techniques. Am. J. Dent. 2008, 21, 199–209. [Google Scholar] [PubMed]
- Chakraborty, D.; Natarajan, C.; Mukherjee, A. Advances in oral cancer detection. Adv. Clin. Chem. 2019, 91, 181–200. [Google Scholar]
- Abdulhameed, H.A.; Omar, K.; Camile, S.; Farah, C.S. The utility of oral brush cytology in the early detection of oral cancer and oral potentially malignant disorders: A systematic review. J. Oral Pathol. Med. 2018, 47, 104–116. [Google Scholar]
- Takano, M.; Kakizawa, T.; Takasaki, Y.; Seta, S.; Noma, H.; Yajima, Y.; Nomura, S. Clinical classification to indicate stage of oral precancerous lesions and early cancer with iodine and toluideine bleu staining test. Head Neck Cancer. 2002, 28, 41–46. [Google Scholar] [CrossRef]
- Mascitti, M.; Orsini, G.; Tosco, V.; Monterubbianesi, R.; Balercia, A.; Putignano, A.; Procaccini, M.; Santarelli, A. An Overview on Current Non-invasive Diagnostic Devices in Oral Oncology. Front Physiol. 2018, 25, 1510. [Google Scholar] [CrossRef] [PubMed]
- Nagi, R.; Reddy-Kantharaj, Y.B.; Rakesh, N.; Janardhan-Reddy, S.; Sahu, S. Efficacy of light based detection systems for early detection of oral cancer and oral potentially malignant disorders: Systematic review. Med. Oral Patol. Oral Circ. Bucal 2016, 21, 447–455. [Google Scholar] [CrossRef]
- Morikawa, M.; Kosugi, A.; Bessho, H.; Nomura, T.; Katakura, A.; Shibahara, T. Analysis of tongue squamous cell carcinoma and leukoplakia by optical instrument. J. Jpn. Stomatol. Soc. 2017, 66, 273–282. [Google Scholar] [CrossRef]
- Morikawa, M.; Bessho, H.; Kozakai, A.; Kosugi, A.; Shibahara, T. Analysis of oral squamous cell carcinoma and oral lichen planus using the “IllumiScan®” optical instrument. Shikwa Gakuho 2017, 117, 383–392. [Google Scholar] [CrossRef]
- Morikawa, T.; Kozakai, A.; Kosugi, A.; Bessho, H.; Shibahara, T. Image processing analysis of oral cancer, oral potentially malignant disorders, and other oral diseases using optical instruments. Int. J. Oral Maxillofac. Surg. 2020, 49, 515–521. [Google Scholar] [CrossRef] [PubMed]
- Katakura, A.; Ukiti, K.; Takeda, S.; Kin, M.; Nomura, T.; Yakushiji, T.; Takagi, R.; Shibahara, T. Application of fluorescence visualization Technology to the screening of oral mucosal diseases. J. Jpn. Soc. Laser. Dent. 2012, 23, 142–146. [Google Scholar] [CrossRef]
- Guidelines for handling tongue cancer. Japanese Society of Oral Oncology. J. Jpn. Soc. Oral Tumors. 2005, 17, 13–85. [Google Scholar] [CrossRef]
- Kusukawa, J.; Suefuji, Y.; Ryu, F.; Noguchi, R.; Iwamoto, O.; Kameyama, T. Dissemination of cancer cells into circulation occurs by incisional biopsy of oral squamous cell carcinoma. J. Oral Pathol. Med. 2000, 29, 303–307. [Google Scholar] [CrossRef]
- Dyavanagoudar, S.; Kale, A.; Bhat, K.; Hallikerimath, S. Reverse transcriptase polymerase chain reaction study to evaluate dissemination of cancer cells into circulation after incision biopsy in oral squamous cell carcinoma. Indian J. Dent Res. 2008, 19, 315–319. [Google Scholar] [CrossRef]
- Alsarraf, A.; Kujan, O.; Farah, C.S. Liquid-based oral brush cytology in the diagnosis of oral leukoplakia using a modified Bethesda Cytology system. J. Oral Pathol. Med. 2018, 47, 887–894. [Google Scholar] [CrossRef]
- Lena, D.; Kristin, G.; Heinrich, N.; Torsten, W.R. Evaluation of the Accuracy of Liquid-Based Oral Brush Cytology in Screening for Oral Squamous Cell Carcinoma. Cancers 2019, 11, 1813. [Google Scholar] [CrossRef]
- Kujan, O.; Pemberton, M.N.; Schwarz, M.; Sloan, P. Evaluation of an innovative oral brush for potential applications using liquid based cytology. J. Oral Sci. 2018, 24, 45–50. [Google Scholar] [CrossRef]
- Jajodia, E.; Raphael, V.; Shunyu, N.B.; Ralte, S.; Pala, S.; Jitani, A.K. Brush cytology and AgNOR in the diagnosis of oral squamous cell carcinoma. Acta Cytol. 2017, 61, 62–70. [Google Scholar] [CrossRef]
- Navone, R.; Pentenero, M.; Gandolfo, S. Liquid-based cytology in oral cavity squamous cell cancer. Curr. Opin. Otolaryngol. Head Neck Surg. 2011, 19, 77–81. [Google Scholar] [CrossRef] [PubMed]
- Epstein, J.B.; Scully, C.; Spinelli, J. Toluidine blue and Lugol’s iodine application in the assessment of oral malignant disease and lesions at risk of malignancy. J. Oral Pathol. Med. 1992, 21, 160–163. [Google Scholar] [CrossRef] [PubMed]
- Elimairi, I.; Altay, M.A.; Abdoun, O.; Elimairi, A.; Tozoglu, S.; Baur, D.A.; Quereshy, F. Clinical relevance of the utilization of vital Lugol’s iodine staining in detection and diagnosis of oral cancer and dysplasia. Clin. Oral Investig. 2017, 21, 589–595. [Google Scholar] [CrossRef] [PubMed]
- Petruzzi, M.; Lucchese, A.; Baldoni, E.; Grassi, F.R.; Serpico, R. Use of Lugol’s iodine in oral cancer diagnosis: An overview. Oral Oncol. 2010, 46, 811–813. [Google Scholar] [CrossRef]
- Epstein, J.B.; Sciubba, J.; Silverman, S., Jr.; Sroussi, H.Y. Utility of toluidine blue in oral premalignant lesions and squamous cell carcinoma: Continuing research and implications for clinical practice. Head Neck. 2007, 29, 948–958. [Google Scholar] [CrossRef]
- Chen, Y.W.; Lin, J.S.; Wu, C.H.; Lui, M.T.; Kao, S.Y.; Fong, Y. Application of in vivo stain of methylene blue as a diagnostic aid in the early detection and screening of oral squamous cell carcinoma and precancer lesions. J. Chin. Med. Assoc. 2007, 70, 497–503. [Google Scholar] [CrossRef]
- Chhabra, N.; Chhabra, S.; Sapra, N. Diagnostic Modalities for Squamous Cell Carcinoma: An Extensive Review of Literature-Considering Toluidine Blue as a Useful Adjunct. J. Maxillofac. Oral Surg. 2015, 14, 188–200. [Google Scholar] [CrossRef]
- Mojsa, I.; Kaczmarzyk, T.; Zaleska, M.; Stypulkowska, J.; Zapala-Pospiech, A.; Sadecki, D. Value of the ViziLite Plus System as a diagnostic aid in the early detection of oral cancer/premalignant epithelial lesions. J. Craniofac. Surg. 2012, 23, e162–e164. [Google Scholar] [CrossRef]
- Onofre, M.A.; Sposto, M.R.; Navarro, C.M. Reliability of toluidine blue application in the detection of oral epithelial dysplasia and in situ and invasive squamous cell carcinomas. Oral Surg. Oral Med. Oral Pathol. Oral Radiol. Endod. 2001, 91, 535–540. [Google Scholar] [CrossRef]
- Nomura, T.; Shibahara, T. Detection of field alterations using useful tools for oral squamous cell carcinoma. Jpn Dent Sci Rev. 2013, 49, 106–115. [Google Scholar] [CrossRef]
- Farah, C.S.; McIntosh, L.; Georgiou, A.; McCullough, M.J. Efficacy of tissue autofluorescence imaging (VELScope) in the visualization of oral mucosal lesions. Head Neck. 2012, 34, 856–862. [Google Scholar] [CrossRef]
- Brookner, C.K.; Follen, M.; Boiko, I.; Galvan, J.; Thomsen, S.; Malpica, A.; Suzuki, S.; Lotan, R.; Richards-Kortum, R. Autofluorescence patterns in short-term cultures of normal cervical tissue. Photochem. Photobiol. 2000, 71, 730–736. [Google Scholar] [CrossRef]
- Richards-Kortum, R.; Sevick-Muraca, E. Quantitative optical spectroscopy for tissue diagnosis. Annu. Rev. Phys. Chem. 1996, 47, 555–606. [Google Scholar] [CrossRef]
- Wagnières, G.A.; Star, W.M.; Wilson, B.C. In vivo fluorescence spectroscopy and imaging for oncological applications. Photochem. Photobiol. 1998, 68, 603–632. [Google Scholar] [CrossRef] [PubMed]
- Harada, K.; Ferdous, T.; Harada, T.; Ueyama, Y. Metformin in combination with 5fluorouracil suppresses tumor growth by inhibiting the Warburg effect in human oral squamous cell carcinoma. Int. J. Oncol. 2016, 49, 276–284. [Google Scholar] [CrossRef] [PubMed]
- Sekine, R.; Takushiji, T.; Tanaka, Y.; Shibahara, T. A study on the intrapapillary capillary loop detected by narrow band imaging system in early oral squamous cell carcinoma. J. Oral Maxillofac. Surg. Med. Pathol. 2015, 27, 624–630. [Google Scholar] [CrossRef]
- Marioni, G.; Staffieri, A.; Fasanaro, E.; Stramare, R.; Giacomelli, L.; Bernardi, E. The role of angiogenin in pT1-T2 tongue carcinoma neo-angiogenesis and cell proliferation: An exploratory study. J. Oral Pathol. Med. 2013, 42, 606–611. [Google Scholar] [CrossRef]
- Scheer, M.; Fuss, J.; Derman, M.A.; Kreppel, M.; Neugebauer, J.; Rothamel, D.; Drebber, U.; Zoeller, J.E. Autofluorescence imaging in recurrent oral squamous cell carcinoma. Oral Maxillofac. Surg. 2016, 20, 27–33. [Google Scholar] [CrossRef]
- Scheer, M.; Neugebauer, J.; Derman, A.; Fuss, J.; Drebber, U.; Zoeller, J.E. Autofluorescence imaging of potentially malignant mucosa lesions. Oral Surg. Oral Med. Oral Pathol. Oral Radiol. Endod. 2011, 111, 568–577. [Google Scholar] [CrossRef]
- Uchida, H.; Vaidyanathan, J.; Viswanadhan, T.; Vaidyanathan, T.K. Color stability of dental composites as a function of shade. J. Prosthet. Dent. 1998, 79, 372–377. [Google Scholar] [CrossRef]
- Rogers, D.F. Procedural Elements for Computer Graphics; McGraw-Hill Inc.: New York, NY, USA, 1988; pp. 383–410. [Google Scholar]
- International Commission on Illumination. Available online: http://cie.co.at/ (accessed on 27 April 2020).
- Kikuta, S.; Iwanaga, J.; Todoroki, K.; Shinozaki, K.; Tanoue, R.; Nakamura, M.; Kusukawa, J. Clinical Application ofthe IllumiScan Fluorescence Visualization Device in Detecting Oral Mucosal Lesions. Cureus. 2018, 6, e3111. [Google Scholar] [CrossRef]
- Kozakai, A.; Ono, K.; Nomura, T.; Takano, T.; Shibahara, T. Usefulness of objective evaluations by fluorescence visualization device for differentiating between superficial oral squamous cell carcinoma and oral lichen planus. J. Oral Maxillofac. Surg. Med. Pathol. 2020, 32, 26–32. [Google Scholar] [CrossRef]
- Kwon, S.H.; Yoon, J.K.; An, Y.S.; Shin, Y.S.; Kim, C.H.; Lee, D.H.; Jo, K.S.; Lee, S.J. Prognostic significance of the intratumoral heterogeneity of (18) F-FDG uptake in oral cavity cancer. J. Surg. Oncol. 2014, 110, 702–706. [Google Scholar] [CrossRef]
- Morikawa, T.; Futoo, E.; Bessho, H.; Yakushiji, T.; Nomura, T.; Onodera, S.; Uchino, Y.; Takano, N.; Shibahara, T. 18F-FDG PET/CT parameters as imaging biomarker is useful in oral squamous cell carcinoma patients. J. Jpn. Soc. Oral Tumor J. Jpn. Soc. Oral Oncol. 2017, 29, 23–35. [Google Scholar] [CrossRef]
- Kosugi, A.; Kasahara, M.; Yang, L.; Nakamura-takahashi, A.; Shibahara, T.; Mori, T. Method for diagnosing neoplastic lesions by quantitative fluorescence value. Sci. Rep. 2019, 24, 7833. [Google Scholar] [CrossRef]
- Güneri, P.; Epstein, J.B.; Ergün, S.; Boyacioğlu, H. Toluidine blue color perception in identification of oral mucosal lesions. Clin. Oral Investig. 2011, 15, 337–345. [Google Scholar] [CrossRef]
- Morikawa, T.; Kosugi, A.; Kozakai, A.; Marumo, T.; Bessho, H.; Shibahara, T. Image Analysis using Squamous Cell Carcinoma and Leukoplakia by Optical Instrument. J. Jpn. Soc. Laser Dent. 2019, 29, 131–140. [Google Scholar]
- Kar, A.; Wreesmann, V.B.; Shwetha, V.; Thakur, S.; Rao, V.U.S.; Arakeri, G.; Brennan, P.A. Improvement of oral cancer screening quality and reach: The promise of Artificial Intelligence. J. Oral Pathol. Med. 2020, 11. in press. [Google Scholar] [CrossRef]
- Sugahara, K.; Futoo, E.; Bessho, H.; Riyo, S.; Ohno, K.; Katakura, A.; Shibahara, T. Fluorescence Visualization for Oral Mucosa Using an Auto-fluorescence Imaging Analysis Software. Jpn. J. Oral Diag. 2017, 30, 168–175. [Google Scholar]
- NIH U.S. National Library of Medicine Clinical Trials. Gov. Direct Visual Fluorescence in Finding Oral Cancer in High-Risk Patients and Patients Undergoing Routine Dental Care. ClinicalTrials.gov Identifier: NCT01816841. Available online: http://cie.co.at/ (accessed on 24 September 2020).
- NIH U.S. National Library of Medicine Clinical Trials. Gov. Efficacy of Optically-guided Surgery in the Management of Early-staged Oral Cancer—COOLS TRIAL. ClinicalTrials.gov Identifier: NCT01039298. Available online: http://cie.co.at/ (accessed on 24 September 2020).
- Rasband, W.S. ImageJ, U.S. National Institutes of Health: Bethesda, Maryland, USA, 1997–2012. Available online: http://imagej.nih.gov/ij/ (accessed on 6 April 2020).
- Schneider, C.A.; Rasband, W.S.; Eliceiri, K.W. NIH Image to ImageJ: 25 years of image analysis. Nat. Methods 2012, 9, 671–675. [Google Scholar]


| Oral Cancers | OPMDs | Others | p-Value | |
|---|---|---|---|---|
| n = 161 | n = 235 | n = 106 | ||
| Sex, men/women | 86/75 | 134/101 | 56/50 | |
| Age, mean | 62.5 | 62.1 | 59.9 | |
| Site Tongue Buccal mucosa Gingiva Plate Others | 109 20 22 7 3 | 101 89 37 6 2 | 49 15 14 20 8 | |
| Control site, mean FVL rate, (%) Area, (pixels) MeanV MediV SD CV Skewness Kurtosis | 0% 927 81.9 80.2 2.9 0.05 16.8 −599 | 0% 967 81.7 80.2 2.9 0.04 78.1 −621 | 0% 962 80.9 80.1 2.8 0.04 55.9 −689 | 1.000 0.804 0.224 0.896 0.383 0.700 0.780 0.829 |
| Lesion site, mean FVL rate, (%) Area, (pixels) MeanV MediV SD CV Skewness Kurtosis VRatio, (%) | 96.9% 215,408 60.9 58.4 12.6 0.21 0.87 2.6 68.9% | 61.7% 160,045 72.1 69.8 9.5 0.14 0.28 3.3 93.8% | 32.1% 129,048 68.7 68.0 10.1 0.15 0.36 6.3 95.8% | 1.6 × 10⁻¹⁰ 9.9 × 10⁻⁹ 0.005 0.007 9.0 × 10⁻⁹ 5.2 × 10⁻¹² 0.107 0.082 2.6 × 10⁻¹⁷ |
| AUC | p-Value | Cut-off | Sensitivity | Specificity | 95% CI | |
|---|---|---|---|---|---|---|
| Area | 0.578 | 0.066 | - | - | - | 0.494, 0.663 |
| MeanV | 0.651 | 5.0 × 10⁻⁴ | 52.5 | 43.7 | 84.6 | 0.570, 0.732 |
| MediV | 0.633 | 0.002 | 60.0 | 55.2 | 67.0 | 0.551, 0.715 |
| SD | 0.512 | 0.779 | - | - | - | 0.427, 0.597 |
| CV | 0.820 | 8.4 × 10⁻⁵ | 0.15 | 82.1 | 69.4 | 0.782, 0.858 |
| Skewness | 0.651 | 4.2 × 10⁻⁴ | 0.71 | 59.6 | 63.0 | 0.589, 0.747 |
| Kurtosis | 0.513 | 0.707 | - | - | - | 0.570, 0.731 |
| VRatio | 0.827 | 5.3 × 10⁻¹⁴ | 87.5 | 85.1 | 75.8 | 0.763, 0.890 |
| Univariate | Multivariate | |||
|---|---|---|---|---|
| p-Value | p-Value | OR | 95% CI | |
| Subjective evaluation | 1.4 × 10⁻²³ | 0.004 | 13.866 | 3.098, 62.084 |
| MeanV | 5.0 × 10⁻⁴ | 0.329 | 1.066 | 0.814, 1.071 |
| MediV | 0.002 | 0.321 | 1.073 | 0.933, 1.233 |
| CV | 8.4 × 10⁻⁵ | 0.005 | 5.454 | 2.871, 10.360 |
| Skewness | 4.2 × 10⁻⁴ | 0.357 | 1.238 | 0.788, 1.938 |
| VRatio | 5.3 × 10⁻¹⁴ | 0.001 | 5.642 | 2.928, 10.871 |
| AUC | p-Value | Cut-off | Sensitivity | Specificity | 95% CI | |
|---|---|---|---|---|---|---|
| Area | 0.450 | 0.063 | - | - | - | 0.397, 0.502 |
| MeanV | 0.602 | 1.7 × 10⁻⁵ | 80.0 | 39.9 | 74.8 | 0.551, 0.653 |
| MediV | 0.601 | 0.020 | 50.0 | 81.3 | 36.8 | 0.518, 0.684 |
| SD | 0.632 | 1.0 × 10⁻⁶ | 12.9 | 83.5 | 38.1 | 0.580, 0.683 |
| CV | 0.740 | 7.5 × 10⁻¹⁹ | 0.17 | 80.2 | 56.7 | 0.695, 0.786 |
| Skewness | 0.632 | 0.002 | 0.56 | 68.8 | 64.8 | 0.551, 0.713 |
| Kurtosis | 0.523 | 0.585 | - | - | - | 0.440, 0.607 |
| VRatio | 0.767 | 1.4 × 10⁻¹⁰ | 74.5 | 82.7 | 55.7 | 0.619, 0.712 |
| Univariate | Multivariate | |||
|---|---|---|---|---|
| p-Value | p-Value | OR | 95% CI | |
| Subjective evaluation | 3.3 × 10⁻⁴ | 1.6 × 10⁻⁴ | 0.089 | 0.025, 0.314 |
| MeanV | 1.7 × 10⁻⁴ | 0.249 | 1.078 | 0.949, 1.225 |
| MediV | 0.020 | 0.214 | 0.926 | 0.821, 1.045 |
| SD | 1.0 × 10⁻⁶ | 0.933 | 1.012 | 0.764, 1.341 |
| CV | 7.5 × 10⁻¹⁹ | 0.012 | 0.001 | 0.000001, 0.188 |
| Skewness | 0.0024 | 0.700 | 0.933 | 0.656, 1.327 |
| VRatio | 1.4 × 10⁻¹⁰ | 0.031 | 1.024 | 1.002, 1.046 |
© 2020 by the authors. Licensee MDPI, Basel, Switzerland. This article is an open access article distributed under the terms and conditions of the Creative Commons Attribution (CC BY) license (http://creativecommons.org/licenses/by/4.0/).
Share and Cite
Morikawa, T.; Shibahara, T.; Nomura, T.; Katakura, A.; Takano, M. Non-Invasive Early Detection of Oral Cancers Using Fluorescence Visualization with Optical Instruments. Cancers 2020, 12, 2771. https://doi.org/10.3390/cancers12102771
Morikawa T, Shibahara T, Nomura T, Katakura A, Takano M. Non-Invasive Early Detection of Oral Cancers Using Fluorescence Visualization with Optical Instruments. Cancers. 2020; 12(10):2771. https://doi.org/10.3390/cancers12102771
Chicago/Turabian StyleMorikawa, Takamichi, Takahiko Shibahara, Takeshi Nomura, Akira Katakura, and Masayuki Takano. 2020. "Non-Invasive Early Detection of Oral Cancers Using Fluorescence Visualization with Optical Instruments" Cancers 12, no. 10: 2771. https://doi.org/10.3390/cancers12102771
APA StyleMorikawa, T., Shibahara, T., Nomura, T., Katakura, A., & Takano, M. (2020). Non-Invasive Early Detection of Oral Cancers Using Fluorescence Visualization with Optical Instruments. Cancers, 12(10), 2771. https://doi.org/10.3390/cancers12102771