Abstract
Melanoma patients carrying an oncogenic NRAS mutation represent 20% of all cases and present worse survival, relapse rate and therapy response than patients with wild type NRAS or with BRAF mutations. Nevertheless, no efficient targeted therapy has emerged so far for this group of patients in comparison with the classical combination of BRAF and MEK inhibitors for the patient group carrying a BRAF mutation. NRAS key downstream actors should therefore be identified for drug targeting, possibly in combination with MEK inhibitors. Here, we investigated the influence of different melanoma-associated NRAS mutations (codon 12, 13 or 61) on several parameters such as oncogene-induced senescence, cell proliferation, migration or colony formation in immortalized melanocytes and in melanoma cell lines. We identified AXL/STAT3 axis as a main regulator of NRASQ61–induced oncogene-induced senescence (OIS) and observed that NRASQ61 mutations are not only more tumorigenic than NRASG12/13 mutations but also associated to STAT3 activation. In conclusion, these data bring new evidence of the potential tumorigenic role of STAT3 in NRAS-mutant melanomas and will help improving current therapy strategies for this particular patient group.
1. Introduction
Malignant melanoma, which originates from melanocytes, has the highest mortality rate (48%) among skin cancers because of its very early and aggressive formation of metastasis [1,2,3]. Its mutational status harbors the most genetic mutations compared to other cancer types, which has an impact both on understanding tumor biology and treatment options [4]. The most common mutation is found in the oncogene BRAF (50%) followed by mutations in the NRAS gene (20%) [5,6]. NRAS-mutant melanomas form thicker tumors and have a higher mitotic rate than NRAS-wildtype melanomas [7,8,9]. Interestingly, NRAS-mutant melanoma patients show worse survival, relapse rate and therapy response than patients with wild type NRAS or with BRAF mutations [9].
Whereas BRAF mutated melanomas have efficient targeted treatment options with BRAF-inhibitors (vemurafenib, dabrafenib and encorafenib) in combination with MEK-inhibitors (cobimetinib, trametinib and binimetinib), NRAS was thought to be an “undruggable” target due to missing FDA-approved targeted therapies available [10,11,12,13,14,15,16]. As targeting NRAS directly is not yet possible, there are different promising approaches with MEK inhibitors combined with other drugs targeting downstream and upstream signalings. A phase III trial (NEMO) comparing binimetinib to dacarbazine therapy on NRAS-mutated patients showed promising results with an increased median progression-free survival of 2.8 months (95% CI 2.8–3.6) in the binimetinib group compared to 1.5 months (1.5–1.7) in the dacarbazine group (hazard ratio 0.62 (95% CI 0.47–0.80); one-sided p < 0.001) but not in overall survival [17]. Recently, a preclinical study has described a new combination strategy involving BET inhibitors with MEK inhibitors to overcome drug resistance in NRAS-mutant melanoma [18]. More recently, new oncogene-targeting chemotherapeutic agents have shown promising effects especially in tumors mutated on KRAS, NRAS and BRAF including melanoma [19].
Mechanistically, most NRAS mutations lead to a constitutively active form of this GTPase, altering downstream signaling pathways and influencing cellular proliferation, differentiation and survival [20]. At the NRAS locus site, mutations are found in codon 61 almost exclusively rather than in codon 12 or 13 although they all possess an oncogenic activity [21]. The reason why such a discrepancy in mutations’ frequency exists is not yet fully understood, but codon mutational status throughout diverse cancer entities has clearly important clinical implications, e.g., different therapy responses to cetuximab therapy in colorectal cancer or prognostic relevance in non-small-cell lung cancer [22,23,24]. For instance, NRASQ61 mutations were described to induce greater melanoma formation than NRASG12 mutations in murine cells but the underlying mechanism is not quite clear [25].
Mutations in oncogenes such as RAS are known to induce a prolonged and irreversible arrest in primary mammalian cells, so called oncogene-induced senescence (OIS) as a mechanism of tumor suppression [26,27,28,29]. The induction of OIS is usually marked by senescence-associated heterochromatin foci (SAHF), which are alterations in the chromatin structure, repressing the expression of genes involved in proliferation as a result of distinct histone modifications [30]. OIS can also be visualized by the senescence-associated-β-galactosidase activity (SA-β-Gal). Therefore further cooperating genetic alterations are needed to override OIS and induce tumor formation [31]. Indeed, a cooperation between NF1 mutations and BRAF mutations was described to overcome OIS and to affect the melanoma response to targeted therapies [32,33].
More recently, NRAS secondary mutations were described to be responsible for the development of drug resistance in BRAF-mutated patients [12,34].
Therefore, it is of crucial importance to determine what signaling pathways in addition to MAPK are specifically involved in NRAS-mutated tumors. In this study, we focused on comparing the impact of NRAS mutations on codon 61 with these on codon 12/13 in the melanocytic lineage. We found that NRASG12/13 mutants induce a stronger OIS-associated phenotype than NRASQ61 mutants in melanocytes. We also identified AXL/STAT3 axis as a key regulator of NRASQ61–induced OIS. Moreover, we showed that NRASQ61 mutations have greater tumorigenic potential than NRASG12/13 both in immortalized melanocytes and in human melanoma cell lines through activation of the STAT3 pathway.
2. Results
2.1. NRASG12/13 Mutants Induce a Stronger OIS-Associated Phenotype than NRASQ61 Mutants in Normal Human Melanocytes (NHM)
We first investigated the effect of NRAS mutations on the induction of OIS in normal human melanocytes (NHMs). The expression of mutated NRAS led to different intensity of OIS when compared to control conditions with an empty vector or with NRASWT, as shown by flattened cell morphology and accumulation of OIS-associated heterochromatin foci (SAHF; Figure 1A,B). Indeed, the quantification of senescence-associated-β-galactosidase activity (SA-β-Gal) showed up to 69% positive cells by day 10 after transduction with NRASG12V, NRASG12D and NRASG13D but only up to 46% positive cells after transduction with NRASQ61K, NRASQ61L and NRASQ61H (Figure 1A,C). Similarly, the quantification of vacuolized cells showed up to 90% in the group of mutations NRASG12/13 but only up to 51% in the group of mutations NRASQ61 (Figure 1D). To investigate the mechanisms lying behind the observed OIS, we analyzed the secretome in the cells’ supernatants, as well as the activity of a set of kinases. Indeed, previous studies described the senescence-associated secretome as a set of cytokines, which can regulate the senescence via an auto and paracrine loop [35,36]. In addition, several kinases including AXL were described to be involved in the OIS [37]. In our experiments, we observed a significant upregulation of a cytokine panel (including IL-8, IL-24 and IL-1β) in a gene expression profiling of these cells, which was verified by elevated protein secretion in the supernatants (Figure 1E and Figure 2B). On top of that, increased tyrosine kinase activity (including INSR, IGFR1, VEGFR and AXL) in NRASQ61 cells compared to NRASG12/13 cells was visible (Figure 1F).
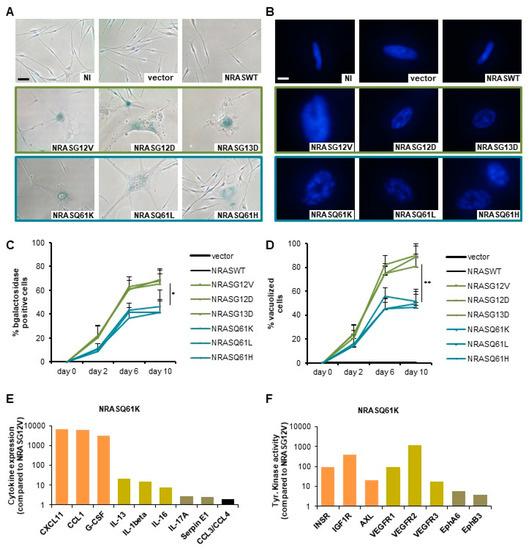
Figure 1.
NRASG12/13 mutants induce a stronger oncogene-induced senescence (OIS)-associated phenotype than NRASQ61 mutants in normal human melanocytes (NHMs). (A) Normal human melanocytes (NHM) expressing indicated NRAS mutants were subjected to SA-β-Gal staining after 9 days. NI: non infected, vector: empty vector. Scale bar: 100 µm. (B) DAPI nuclear staining of NHM expressing indicated NRAS mutants shows an accumulation of OIS-associated heterochromatin foci (SAHF) with enlarged punctuated nuclei. Scale bar: 20 μm. (C) Quantification of senescence-associated SA-β-Gal positive cells in percent. (D) Quantification of vacuolized cells in percent. (E) Protein expression of OIS-associated cytokines as a fold change to NRASG12V. (F) Tyrosine kinase activity as a fold change to NRASG12V. p values from three independent experiments by two-tailed, unpaired sample t test (* p < 0.05, ** p < 0.01, *** p < 0.005).
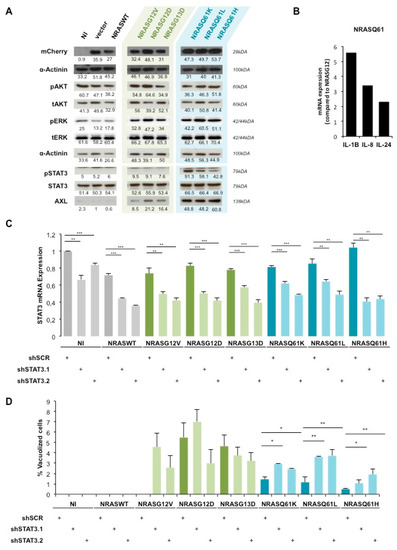
Figure 2.
AXL/STAT3 axis is a key regulator of NRASQ61—induced OIS in NHM. (A) Western Blot analysis of AKT, ERK and STAT3 activation status in NHM expressing indicated NRAS mutants. NI: non infected, vector: empty vector. (B) qPCR analysis of IL-24, IL-1B and IL-8 mRNA levels in NHM expressing indicated NRAS mutants. Values were normalized to NRASG12/13 and shown as fold change. (C) mRNA analysis of STAT3 in NHM after double transduction with shSTAT3 (shSTAT3.1, shSTAT3.2) and NRAS mutants. (D) Quantification of vacuolized cells in percent in the same conditions as in (C). * p < 0.05, ** p < 0.01. *** p < 0.001.
Therefore, these data show that NRASG12/13 mutants induce a stronger OIS-associated phenotype than NRASQ61 mutants in NHM, which is associated with specific cytokines expression and kinases activation.
2.2. AXL/STAT3 Axis Is a Key Regulator of NRASQ61—Induced OIS in NHM
To unravel the underlying signaling pathways involved in the occurrence of mutant NRAS-induced OIS, we first analyzed the activation status of MAPK and PI3K signaling by western blot (Figure 2A).
ERK was weakly phosphorylated in the non-infected (NI), empty vector (vector) and NRASWT conditions. Interestingly, this phosphorylation increased in a similar manner among all NRAS mutants whereas the total ERK expression was unchanged in all conditions. AKT phosphorylation as well as total AKT expression was also unchanged in all conditions. α-Actinin was used as a loading control and mCherry expression allowed us to verify equal NRAS transgenes expression.
Therefore, to identify other involved pathways we performed a global gene expression analysis between NRASG12/13 and NRASQ61 NHM. Among the top regulated genes, we identified several STAT3-inducing interleukins such as IL-8, IL-24 and IL-1β [38,39]. We confirmed a two-fold upregulation of IL-24, a five-fold upregulation of IL-1β and a three-fold upregulation of IL-8 in NRASQ61 cells compared to NRASG12/13 cells by qPCR (Figure 2B). In addition, the western blot analysis showed high phosphorylation of STAT3, specifically in NRASQ61 cells when compared to NRASG12/13 cells. As a control, we observed no changes in the total expression of STAT3 (Figure 2A). Moreover, the expression of STAT3-inducer tyrosine kinase AXL was highly increased in NRASQ61 cells when compared to NRASG12/13. These findings strongly suggest an activation of STAT3 signaling, specifically by NRASQ61 mutations.
To confirm the involvement of STAT3 in mutant NRAS-induced OIS, we performed loss-of-function experiments. For this purpose, we double transduced NHM with NRAS mutants and with two shRNAs against STAT3 (shSTAT3.1 and shSTAT3.2). The silencing led to a significant decrease of STAT3 mRNA expression in all conditions (Figure 2C). Indeed, STAT3 silencing efficiency reached an average of 40% mRNA reduction with both shRNAs.
Further, the quantification of vacuolized cells indicated that STAT3 silencing in NRASG12/13 cells induced non reproducible and therefore non-significant variations compared to the respective non-targeting shRNA control sample (shSCR). However, we observed a significant 2 to 3-fold change increase of vacuolization in NRASQ61 cells under STAT3 silencing (Figure 2D).
Taken together, our data demonstrate a specific activation of AXL-STAT3 signaling by NRASQ61 leading to lower occurrence of OIS compared to NRASG12/13 in NHM.
2.3. STAT3 Is Involved in NRAS-Driven Migration and Colony Formation of Immortalized Melanocytes (MelSTV)
Next, we used immortalized melanocytes MelSTV to further study the role of STAT3 in the transforming effects of NRAS mutants. After stable transduction with NRASWT, NRASG12V or NRASQ61H, the cells were enriched for the expression of reporter gene mCherry by FACS. The first functional assays showed a significantly enhanced proliferation rate, enhanced migration rate and enhanced colony formation ability of NRASQ61H MelSTV compared to NRASWT and NRASG12V MelSTV (Figure S1). These cells were then transfected for 48 h with siSTAT3 (siSTAT3.1 and siSTAT3.2) or a control siRNA (siSCR). The silencing efficiency at the mRNA level reached around 90% with both siRNAs in all three NRAS conditions (Figure 3A). Accordingly, STAT3 silencing with either siRNA also led to a strong reduction of STAT3 protein expression (62% and 42% respectively; Figure 3B). Of note, in this cell line like in NHM, NRASQ61H strongly increased STAT3 phosphorylation level compared to NRASG12V or to NRASWT. However, STAT3 silencing significantly reduced STAT3 phosphorylation to a similar basal level in all three NRAS conditions.
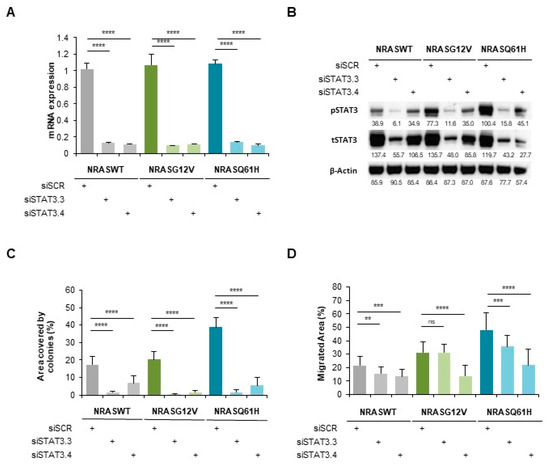
Figure 3.
STAT3 is involved in NRAS-driven migration and colony formation of immortalized melanocytes MelSTV. (A) mRNA expression of STAT3 in immortalized melanocytes MelSTV expressing either NRASWT, NRASG12V or NRASQ61H, after 48 h transfection with siSTAT3 (siSTAT3.3 and siSTAT3.4). (B) Phospho-STAT3 and STAT3 levels shown by Western Blot in the same conditions as in A. (C) Colony formation assay of MelSTV in the same conditions as in A. (D) Migration of MelSTV in the same conditions as in A. ** p < 0.01, *** p < 0.001, **** p < 0.0001.
A colony formation assay indicated that NRASQ61H-induced colony increase (two-times more when compared to NRASG12V) was mostly abolished by STAT3 silencing. This effect was also observed with NRASG12V and NRASWT (Figure 3C).
Moreover, we performed a scratch-like experiment on these cells, which presented a higher migration rate of NRASQ61H cells than that of NRASG12V and NRASWT cells (Figure 3D). However, and in accordance to the colony formation assay, STAT3 silencing strongly reduced the migration rate in all three NRAS conditions. Nevertheless, STAT3 silencing indicated a similar involvement of STAT3 in both NRASQ61H and NRASG12V phenotypes.
These data show that STAT3 is a key actor of NRAS-driven migration and colony formation of MelSTV, independently of their NRAS mutational status.
2.4. NRASQ61H is more Tumorigenic than NRASG12V and Activates STAT3
Interestingly, STAT3 targets MMP2 and cMYC, were upregulated in NRASQ61H cells compared to NRASG12V or NRASWT cells, concordant with STAT3 activation specifically by this mutant (Figure 4A).
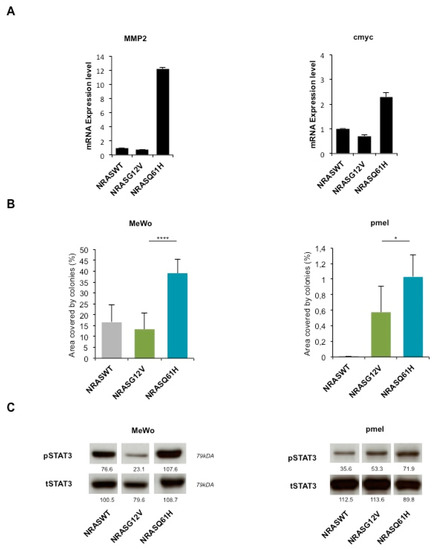
Figure 4.
NRASQ61H is more tumorigenic than NRASG12V and activates STAT3. (A) mRNA expression levels of STAT3 target genes MMP2 and cMYC in MelSTV. (B) Colony formation assay of melanoma cell lines Mewo, and immortalized melanocytes pmel expressing either NRASWT, NRASG12V or NRASQ61H. (C) Western blot shows respective expression of P-STAT3 and total STAT3. * p < 0.05, **** p < 0.0001.
Furthermore, we tested the colony formation ability after transduction with NRASQ61H, NRASG12V or NRASWT (Figure 4B). As in MelSTV, the colony formation of melanoma cell line MeWo and immortalized melanocytes pmel was higher with NRASQ61H than with the two other conditions. This effect correlated with an increased STAT3 phosphorylation (as a control, total STAT3 expression was unchanged) as observed by western blot (Figure 4C).
These results indicate that NRASQ61H induces a stronger tumorigenic phenotype in immortalized melanocytes and melanoma cell lines when compared with NRASG12V, and this effect correlates to an increased STAT3 phosphorylation status.
3. Discussion
In this study, we showed that NRASG12/13 mutants induce a stronger OIS-associated phenotype than NRASQ61 mutants in primary human melanocytes. This difference may not be caused by variation in protein expression levels (equivalent reporter gene expression) and is unlikely due to RAS activity variations (equal phosphorylation levels of classical RAS downstream targets, ERK and AKT; Figure 2A). Thus, this result strongly suggests a mutant-specific activation of an additional NRAS downstream pathway.
In line with our results, a previous study comparing NRASQ61R mutant and NRASG12D mutant in a transgenic mouse model of melanoma described little differences in the activation of downstream PI3K or RAF targets. They could establish via biochemical approaches based on nucleotide binding and hydrolysis, a higher activation of NRASQ61R protein compared to NRASG12D [25]. Additional players such as guanine nucleotide exchange factors (GEF) enhance the GTP-bound active state of NRAS. Conversely, GTPase-activating proteins (GAPs) accelerate the GTP-hydrolysis and favor NRAS GDP-bound inactive state. These regulators of RAS activity may therefore also play a role in the differential phenotype of the NRAS mutants. For example, PREX2 GEF activity was activated by mutations found in NRAS-mutant melanoma [40]. Moreover, other molecular mechanisms such as posttranslational or epigenetic modifications could also affect the outcome of NRAS mutations. Indeed, it was described that mutation-induced epigenetic remodeling cooperates with NRAS-mutations to drive myeloid transformation [41].
More recently, another study focused on the proteome of human melanocytes bearing NRAS mutations. The authors identified an increased PI3K/AKT activation by NRASG12V and an increased MAPK activation with NRASG61L [42]. These apparent conflicting data may be explained by different transduction kinetics.
Our data on NRASQ61-induced OIS in melanocytes also revealed an association with a specific set of cytokine expression and with specific tyrosine kinase activation (Figure 1E,F). These proinflammatory cytokines are part of the secretome produced by senescent cells. Of note, some of these cytokines are known activators of STAT3 signaling (IL-8, IL-1β and IL-24), which is protumorigenic and favors melanoma reprogramming towards a tumor-initiating phenotype [36]. Thus, this increased production of cytokines could account for the observed lower NRASQ61-induced OIS level when compared to NRASG12 via a paracrine mechanism in vitro. The tyrosine kinase profiling results suggest that a discrete number of kinases is specifically activated by NRASQ61, which may lead to protumorigenic signaling and contribute to a reduction of OIS.
In particular, AXL, IGF1R and VEGFR are described as activators of STAT3 [43,44]. The observed increased activity of these kinases together with STAT3 activation may suggest a molecular link in NRASQ61 expressing cells (Figure 1F and Figure 2A).
Interestingly, a computer-based prediction model for kinases in a previous study identified an upregulation of CK2α by NRASQ61-melanocytes [42]. CK2α being a serine/threonine protein kinase, it could play an additional role in NRASQ61-induced senescence. Noticeably, another study linked phosphorylation of STAT3 to activation of CK2α as an upstream event in human glioma cells [45]. The exact role of CK2α in the activation of STAT3 and OIS requires more investigation.
We found that STAT3 silencing leads to a significant increase in NRASQ61–induced OIS whereas no significant differences were observed with NRASG12. These data confirm the key role of STAT3 specifically in NRASQ61 melanocytes, which is associated with AXL activation. Further studies are needed to fully understand, which kinase directly phosphorylates STAT3 during NRASQ61-induced OIS.
In the context of immortalized melanocytes or human melanoma cell lines, we found that NRASQ61 had a greater ability to induce proliferation, migration and colony formation than NRASG12. This phenotypical difference was associated with a stronger STAT3 activation (and with an upregulation of STAT3 targets MMP2 and cMYC), when compared to NRASG12 (Figure 4A). In line with our findings cMYC overexpression is able to impair OIS in NRASQ61R-mutated melanocytes or by its negative regulator PP2A-B56α [46,47]. These observations confirm the nature of NRASQ61 mutants to be more oncogenic as well as in vivo data that showed higher nevus and melanoma formation in NRASQ61R expressing p16INK4a-deficient mice [25].
However, although both STAT3 expression and phosphorylation were greatly impaired by its gene silencing, the reduced effect on migration and colony formation capacities of MelSTV was not different in NRASG12V and NRASQ61H mutant conditions. This indicates that although this particular STAT3 phosphorylation (Tyr705) is required for these cells’ tumorigenicity, additional factors could play a role in the NRASQ61-specific phenotype.
In contrast to a high mutation burden of BRAF in common acquired nevi, NRAS mutations were found most frequently in congenital nevi (80%). When characterizing the NRAS mutations in detail, there are exclusively mutations in the codon 61 [48]. The absence of lesions carrying G12/13 NRAS mutations may support our findings that NRASQ61 has a stronger tumorigenic effect and less susceptibility to OIS than NRASG12/13. In contrast, another study comparing the mutational status of melanoma and their precursor nevi concludes that there is no significant difference in the frequency of NRAS mutations between nevi and melanoma stating that NRAS mutational status itself is not a prognostic factor for melanoma formation [49]. However, more investigation is needed to understand the selection of NRASQ61 mutants in benign primary lesions and their transformative development to malignant melanoma.
As mentioned before, NRAS mutations in melanoma tumors are responsible for the development of drug resistance in BRAF-mutated patients. Since several reports have shown an effectiveness of STAT3 inhibition cells resistant to BRAF inhibitor, it could be of importance to test the effect of STAT3 inhibitors in NRAS mutation-driven drug resistance [50,51,52,53].
4. Materials and Methods
4.1. Cell Lines
Human primary melanocytes were isolated from patient’s foreskin biopsies according to the ethical regulation (2010-318N-MA, Ethics committee II, University Medical Center Manheim, Germany). Isolated melanocytes were cultured in 254 Medium (Gibco™, ThermoFisher Scientific, Waltham, MA, USA, M254500) supplemented with Human Melanocyte Growth Supplement (Gibco™, ThermoFisher Scientific, S0025) and 20 μg/mL G418 in the first passages to avoid fibroblast growth. Immortalized Melanocytes MelSTV [54], HEK293 and melanoma cell line MeWo were cultured in DMEM Medium (High Glucose, GlutaMax, Gibco™, ThermoFisher Scientific, 31966047) supplemented with 10% fetal bovine serum (Merck, Darmstadt, Germany, S0115), MEM Non-essential Amino Acid Solution (Sigma-Aldrich®, St. Louis, MO, USA, M7145), 1% β-mercaptoethanol, 1% penicillin (100 units/mL) and streptomycin (100 μg/mL). Immortalized melanocytes pmel [55], gift from Prof. Hans R. Widlund, Department of Dermatology, Brigham and Women’s Hospital, Boston, MA, USA, were cultured in Ham’s F10 (Gibco™, ThermoFisher Scientific, 11550043) supplemented with 7% FBS, 1% penicillin-streptomycin (100 units/mL penicillin and 10 mg/mL streptomycin, Sigma-Aldrich®, P4333), 0.1 mM IBMX (Sigma-Aldrich®, I5879), 50 ng/mL TPA (Sigma-Aldrich®, P1585), 1 µM Na3VO4 (Sigma-Aldrich®, S6508) and 1 µM dbcAMP (Sigma-Aldrich®, D0260). All cells were maintained at 37 °C in a humid incubator with 5% CO2.
4.2. Lentiviral Transduction
DNA encoding for NRAS wildtype and each mutated in either codon 12/13 (G12V, G12D and G13D) or codon 61 (Q61K, Q61L and Q61H) was cloned into a plasmid under control of an EF1α-Promoter. The NRAS gene was coupled with the fluorescent reporter-protein mCherry linked with an internal ribosome entry site (IRES). Lentivirus particles were produced using X-tremeGENE™ 9 DNA Transfection Reagent (Roche Applied Science, Mannheim, Germany, XTG9-RO) in HEK293 cells according to the manufacturer’s instructions. Therefore, the virus containing supernatant was collected three times after 12 h each. Cells were transduced with virus supernatant and 4 µg/mL Polybren two times for each 24 h and then cultured in the corresponding culturing medium. Cells were then sorted for mCherry positive cells by flow cytometry.
4.3. siRNA/shRNA
siRNA transfection of cells was performed using Lipofectamine RNAiMAX Transfection Reagent (ThermoFisher Scientific, 13778100) resolved in OptiMEM (Gibco™, ThermoFisher Scientific, 31985062) according to the manufacturer’s protocol for 48 h. The sequences of the used siRNA are: AllStars Negative Control siRNA (Qiagen, Germantown, MD, USA, 1027280) siSTAT3.3 (Qiagen, SI00048377) siSTAT3.4 (Qiagen, SI00048384).
Primary melanocytes were transduced with two STAT3 shRNAs two times for each 12 h followed by two times transduction with NRAS mutants. The sequence of shRNAs used are: shRNA non targeting Control—(Dharmacon, Horizon Discovery, Lafayette, CO, USA, RHS4346), shSTAT3.1—TACCTAAGGCCATGAACTT (Dharmacon, V2LHS_88502), shSTAT3.2—ATAGTTGAAATCAAAGTCA (Dharmacon, V3LHS_376016).
4.4. Senescence Quantification
Transduced primary melanocytes were stained using Senescence β-Galactosidase Staining Kit (Cell Signaling Technology, Danvers, MA, USA, 9860) according to the manufacturer’s instructions. Number of β-Galactosidase positive cells was quantified and related to total number of cells by manual counting using brightfield micrographs after 0, 2, 6 and 10 days. The number of vacuolized cells was also quantified independently using brightfield micrographs.
For detection of senescence-associated heterochromatin foci (SAHF) cells were fixed with 4% paraformaldehyde for 8 min. After three washes with PBS fixed cells were permeabilized with 0.1% Triton-X100 for 10 min, washed and stained with DAPI (Roche Diagnostics, Mannheim, Germany, 10 236 276 001, 1:2000, in TBST) for 5 min. Before imaging cells were washed 3 times with PBS. SAHF were quantified with ImageJ integrated cell counter and manual counting.
4.5. qPCR
Quantitative PCR was performed using SYBR™ Green PCR Master Mix (Applied Biosystems™, Foster City, CA, USA, 4309155) and 7500 Fast Real-Time PCR System (Applied Biosystems™). RNA from samples was isolated with RNeasy Mini Kit (Qiagen, 74106) and cDNA was synthesized. CT values were normalized to 18S as a housekeeping gene and relative expression of genes was quantified by calculating ΔΔCT. Primers were designed and validated with melting curve analysis. Following primer sequences were used: 18S FWD: GAGGATGAGGTGGAACGTGT, 18S REV: TCTTCAGTCGCTCCAGGTCT, IL1B FWD: TGTGAAATGCCACCTTTTGA, IL1B: GGTCAAAGGTTTGGAAGCAG, IL24 FWD: GACTTTAGCCAGCAGACCCTT, IL24 REV: GGTTGCAGTTGTGACACGAT, MMP2 FWD: TACAGGATCATTGGCTACACACC, MMP2 REV: GGTCACATCGCTCCAGACT, cMYC FWD: CTCCTCCTCGTCGCAGTAGA, cMYC REV: GCTGCTTAGACGCTGGATTT.
4.6. Western Blot
Cells were lysed and scraped with 10% Triton-10X, cOmplete™ Mini Protease Inhibitor Cocktail (Roche, Applied Science, Mannheim, Germany, 11836153001) and PhosSTOP™ (Roche, PHOSS-RO). Protein concentration was measured using Pierce™ BCA Protein Assay Kit (ThermoScientific™, Rockford, IL, USA, 23225) and 30 µg protein was loaded and separated on an SDS-PAGE Gel, then wet blotted on a 0.45 µm PVDF membrane (Merck, IEVH00010). The membranes were blocked and incubated in primary antibodies followed by an HRP-linked secondary antibody. The protein bands were visualized using Immobilon Forte Western HRP substrate (Merck, WBLUF) and Hyperfilm ECL (GE Healthcare, Chicago, IL, USA, 10607665), according to the manufacturer’s protocol. The primary antibodies used are: P-Stat3 (Y705, M9C6; CST 4113, 1:500 in 5% BSA), Stat3 (124 H6; CST 9139, 1:6000 in 5% BSA), β-Actin (13E5; CST 5125, 1:10 000 in 5% BSA), Phospho-p44/42 MAPK (T202/Y204, E10; CST 9106, 1:2000 in 5% Milk), p44/42 MAPK (Erk1/2,137F5; CST 4695, 1:4000 in 5% Milk), Phospho-Akt (Ser473, 193H12; CST 4058, 1:2000 in 5% Milk), Akt (40D4, CST 2920, 1:5000 in 5% Milk), mCherry (1C51; abcam, ab125096, 1:10000 in 5% Milk), α-Actinin (H-2; Santa Cruz, sc17829, 1:50000 in 5% Milk) and Axl (C44G1; CST 4566S, 1:1000 in 5% Milk).
4.7. Proliferation
To measure proliferative ability, cells were plated at a density of 500 cells in a 96-well plate. After 0 and 9 days alamarBlue™ Cell Viability Reagent (Invitrogen™, ThermoFisher Scientific, DAL1100) was added and after 4 h of incubation at 37 °C, fluorescence was measured with excitation wavelength at 530–560 nm and emission wavelength at 590 nm with the Tecan Infinite 200 Pro plate reader. The fold increase of fluorescence intensity between day 0 and day 9 was calculated and plotted.
4.8. Colony Formation
200 cells were each plated in a 6 well-plate. Culture medium was changed every 2–3 days. After 11 days cells were fixed and stained with 0.05% Crystal Violet (1% formaldehyde (37%), 1% Methanol in PBS) for 20 min at room temperature. Cells were gently washed twice with tap water and air-dried. Area of the plate covered by stained colonies was quantified using the ImageJ Plugin ColonyArea [56].
4.9. Migration
To analyze the migratory potential, 35,000 cells were plated in each well of a 2-well-culture-insert (Ibidi, Planegg, Germany, 80209) with MEF-Medium. After cells attached to the plate 4 h later medium was incubated with FBS-free MEF-Medium overnight in the cell incubator. Inserts were removed the day after and cells were washed with PBS and 10% FBS MEF-Medium with 1 µg/mL Aphidicolin (Sigma-Aldrich®, A4487) was added. Cell migration was monitored after 8 h. TScratch Software was used for quantitative analysis of the closing gap.
4.10. Proteome Profiler Array
Protocol followed manual instructions from R&D Systems Europe, Ltd, Human Phospho-RTK Array Kit (#ARY001B) and Human Cytokine Array (#ARY005B). Briefly, cell lysates were diluted and incubated overnight with either array. The array was washed to remove unbound proteins followed by incubation with a cocktail of biotinylated detection antibodies and with streptavidin-HRP antibodies. Captured signal corresponded to the amount of bound phosphorylated protein.
4.11. Statistical Analyses
The statistical analyses of experiments were performed using the student’s t-test with a two-tailed distribution and homoscedasticity [57]. Data analysis was performed with GraphPad Prism (GraphPad Software Inc., San Diego, CA, USA). All experiments were performed at least in three biological replicates. Differences were considered as significant with a value of p < 0.05 (marked with *), p < 0.01 (marked with **), p < 0.001 (marked with ***) and p < 0.0001 (marked with ****).
5. Conclusions
In conclusion, we showed a clear contrast in the phenotypical behavior between NRASG12/13 and NRASQ61-mutated melanocytic cells. In primary melanocytes NRASQ61 is able to override OIS through activation of the STAT3 pathway, whereas in immortalized melanocytes and melanoma cell lines, NRASQ61 promotes a more tumorigenic behavior. Moreover, we identified in melanocytes a specific NRASQ61-driven senescence mechanism associated with the production of a set of cytokines and with the activation of kinases.
Furthermore, our study gives novel insights into molecular and cellular mechanisms, which are activated in response to NRAS oncogenic insult. For example, these results strongly suggest an implication of STAT3 in the context of the vast majority of NRAS-mutated melanoma patients who carry a codon 61 mutation and will help further validation of potential drug targets for this subgroup of patients.
Supplementary Materials
The following are available online at https://www.mdpi.com/2072-6694/12/1/119/s1, Figure S1: (A) Cell proliferation assessed by alamar blue staining on MelSTV expressing NRASWT, NRASG12V, or NRASQ61H over 9 days. (B) Cell migration assay of MelSTV expressing NRASWT, NRASG12V, or NRASQ61H. (C) Colony formation assay of MelSTV expressing NRASWT, NRASG12V, or NRASQ61H. n = 3, p < 0.0001.
Author Contributions
Conceptualization, Validation and Formal Analysis, J.K. and L.L.; Methodology, J.K. and D.N.; Writing—Original Draft Preparation, J.K.; Writing—Review and Editing, J.K., L.L., C.S. and J.U.; Funding Acquisition, J.U. All authors have read and agreed to the published version of the manuscript.
Funding
This work was funded by the Deutsche Forschungsgemeinschaft (DFG, German Research Foundation)—Project number 259332240/RTG 2099.
Acknowledgments
We wish to thank Jennifer Dworacek, and Sayran Arif-Said for excellent technical assistance, and the DKFZ Flow Cytometry Core Facility for helpful services. This work is part of the MD thesis of James Kim.
Conflicts of Interest
The authors declare no conflict of interest.
References
- Garbe, C.; Leiter, U. Melanoma epidemiology and trends. Clin. Dermatol. 2009, 27, 3–9. [Google Scholar] [CrossRef]
- Bray, F.; Ferlay, J.; Soerjomataram, I.; Siegel, R.L.; Torre, L.A.; Jemal, A. Global cancer statistics 2018: GLOBOCAN estimates of incidence and mortality worldwide for 36 cancers in 185 countries. CA. Cancer J. Clin. 2018, 68, 394–424. [Google Scholar] [CrossRef]
- Adler, N.R.; Wolfe, R.; Kelly, J.W.; Haydon, A.; McArthur, G.A.; McLean, C.A.; Mar, V.J. Tumour mutation status and sites of metastasis in patients with cutaneous melanoma. Br. J. Cancer 2017, 117, 1026–1035. [Google Scholar] [CrossRef] [PubMed]
- Lawrence, M.S.; Stojanov, P.; Polak, P.; Kryukov, G.V.; Cibulskis, K.; Sivachenko, A.; Carter, S.L.; Stewart, C.; Mermel, C.H.; Roberts, S.A.; et al. Mutational heterogeneity in cancer and the search for new cancer-associated genes. Nature 2013, 499, 214–218. [Google Scholar] [CrossRef] [PubMed]
- Xia, J.; Jia, P.; Hutchinson, K.E.; Dahlman, K.B.; Johnson, D.; Sosman, J.; Pao, W.; Zhao, Z. A meta-analysis of somatic mutations from next generation sequencing of 241 melanomas: A road map for the study of genes with potential clinical relevance. Mol. Cancer Ther. 2014, 13, 1918–1928. [Google Scholar] [CrossRef] [PubMed]
- Akbani, R.; Akdemir, K.C.; Aksoy, B.A.; Albert, M.; Ally, A.; Amin, S.B.; Arachchi, H.; Arora, A.; Auman, J.T.; Ayala, B.; et al. Genomic Classification of Cutaneous Melanoma. Cell 2015, 161, 1681–1696. [Google Scholar] [CrossRef] [PubMed]
- Devitt, B.; Liu, W.; Salemi, R.; Wolfe, R.; Kelly, J.; Tzen, C.Y.; Dobrovic, A.; Mcarthur, G. Clinical outcome and pathological features associated with NRAS mutation in cutaneous melanoma. Pigment Cell Melanoma Res. 2011, 24, 666–672. [Google Scholar] [CrossRef]
- Fedorenko, I.V.; Gibney, G.T.; Smalley, K.S.M. NRAS mutant melanoma: Biological behavior and future strategies for therapeutic management. Oncogene 2012, 32, 3009–3018. [Google Scholar] [CrossRef]
- Muñoz-Couselo, E.; Zamora Adelantado, E.; Ortiz Vélez, C.; Soberino-García, J.; Perez-Garcia, J.M.J.; Adelantado, Z.; Ortiz, C.; Soberino García, J.; Perez-Garcia, J.M.J. NRAS-mutant melanoma: Current challenges and future prospect. Onco Targets Ther. 2017, 10, 3941. [Google Scholar] [CrossRef]
- Boespflug, A.; Caramel, J.; Dalle, S.; Thomas, L. Treatment of NRAS—Mutated advanced or metastatic melanoma: Rationale, current trials and evidence to date. Ther. Adv. Med. Oncol. 2017, 9, 481–492. [Google Scholar] [CrossRef]
- Mandalà, M.; Merelli, B.; Massi, D. Nras in melanoma: Targeting the undruggable target. Crit. Rev. Oncol. Hematol. 2014, 92, 107–122. [Google Scholar] [CrossRef] [PubMed]
- Johnson, D.B.; Menzies, A.M.; Zimmer, L.; Eroglu, Z.; Ye, F.; Zhao, S.; Rizos, H.; Sucker, A.; Scolyer, R.A.; Gutzmer, R.; et al. Acquired BRAF inhibitor resistance: A multicenter meta-analysis of the spectrum and frequencies, clinical behaviour, and phenotypic associations of resistance mechanisms. Eur. J. Cancer 2015, 51, 2792–2799. [Google Scholar] [CrossRef] [PubMed]
- Long, G.V.; Flaherty, K.T.; Stroyakovskiy, D.; Gogas, H.; Levchenko, E.; de Braud, F.; Larkin, J.; Garbe, C.; Jouary, T.; Hauschild, A.; et al. Dabrafenib plus trametinib versus dabrafenib monotherapy in patients with metastatic BRAF V600E/K-mutant melanoma: Long-term survival and safety analysis of a phase 3 study. Ann. Oncol. 2017, 28, 1631–1639. [Google Scholar] [CrossRef] [PubMed]
- Long, G.V.; Stroyakovskiy, D.; Gogas, H.; Levchenko, E.; De Braud, F.; Larkin, J.; Garbe, C.; Jouary, T.; Hauschild, A.; Grob, J.J.; et al. Combined BRAF and MEK inhibition versus BRAF inhibition alone in melanoma. N. Engl. J. Med. 2014, 371, 1877–1888. [Google Scholar] [CrossRef] [PubMed]
- Rizos, H.; Menzies, A.M.; Pupo, G.M.; Carlino, M.S.; Fung, C.; Hyman, J.; Haydu, L.E.; Mijatov, B.; Becker, T.M.; Boyd, S.C.; et al. BRAF Inhibitor Resistance Mechanisms in Metastatic Melanoma: Spectrum and Clinical Impact. Clin. Cancer Res. 2014, 20, 1965–1978. [Google Scholar] [CrossRef]
- Cox, A.D.; Fesik, S.W.; Kimmelman, A.C.; Luo, J.; Der, C.J. Drugging the undruggable RAS: Mission Possible? Nat. Rev. Drug Discov. 2014, 13, 828–851. [Google Scholar] [CrossRef]
- Dummer, R.; Schadendorf, D.; Ascierto, P.A.; Arance, A.; Dutriaux, C.; Di Giacomo, A.M.; Rutkowski, P.; Del Vecchio, M.; Gutzmer, R.; Mandala, M.; et al. Binimetinib versus dacarbazine in patients with advanced NRAS-mutant melanoma (NEMO): A multicentre, open-label, randomised, phase 3 trial. Lancet Oncol. 2017, 18, 435–445. [Google Scholar] [CrossRef]
- Echevarría-Vargas, I.M.; Reyes-Uribe, P.I.; Guterres, A.N.; Yin, X.; Kossenkov, A.V.; Liu, Q.; Zhang, G.; Krepler, C.; Cheng, C.; Wei, Z.; et al. Co-targeting BET and MEK as salvage therapy for MAPK and checkpoint inhibitor-resistant melanoma. EMBO Mol. Med. 2018, 10. [Google Scholar] [CrossRef]
- Nastasa, C.; Tamaian, R.; Oniga, O.; Tiperciuc, B. 5-arylidene(Chromenyl-methylene)-thiazolidinediones: Potential new agents against mutant oncoproteins K-Ras, N-Ras and B-Raf in colorectal cancer and melanoma. Medicina 2019, 55, 85. [Google Scholar] [CrossRef]
- Downward, J. Targeting RAS signalling pathways in cancer therapy. Nat. Rev. Cancer 2003, 3, 11–22. [Google Scholar] [CrossRef]
- Li, S.; Balmain, A.; Counter, C.M. A model for RAS mutation patterns in cancers: Finding the sweet spot. Nat. Rev. Cancer 2018, 18, 767–777. [Google Scholar] [CrossRef] [PubMed]
- Haigis, K.M.; Kendall, K.R.; Wang, Y.; Cheung, A.; Haigis, M.C.; Glickman, J.N.; Niwa-Kawakita, M.; Sweet-Cordero, A.; Sebolt-Leopold, J.; Shannon, K.M.; et al. Differential effects of oncogenic K-Ras and N-Ras on proliferation, differentiation and tumor progression in the colon. Nat. Genet. 2008, 40, 600–608. [Google Scholar] [CrossRef] [PubMed]
- Ihle, N.T.; Byers, L.A.; Kim, E.S.; Saintigny, P.; Lee, J.J.; Blumenschein, G.R.; Tsao, A.; Liu, S.; Larsen, J.E.; Wang, J.; et al. Effect of KRAS oncogene substitutions on protein behavior: Implications for signaling and clinical outcome. J. Natl. Cancer Inst. 2012, 104, 228–239. [Google Scholar] [CrossRef] [PubMed]
- De Roock, W.; Jonker, D.J.; Di Nicolantonio, F.; Sartore-Bianchi, A.; Tu, D.; Siena, S.; Lamba, S.; Arena, S.; Frattini, M.; Piessevaux, H.; et al. Association of KRAS p.G13D Mutation With Outcome in Patients With Chemotherapy-Refractory Metastatic Colorectal Cancer Treated With Cetuximab. JAMA 2010, 304, 1812–1820. [Google Scholar] [CrossRef]
- Burd, C.E.; Liu, W.; Huynh, M.V.; Waqas, M.A.; Gillahan, J.E.; Clark, K.S.; Fu, K.; Martin, B.L.; Jeck, W.R.; Souroullas, G.P.; et al. Mutation-specific RAS oncogenicity explains NRAS codon 61 selection in melanoma. Cancer Discov. 2014, 4, 1418–1429. [Google Scholar] [CrossRef]
- Serrano, M.; Lin, A.W.; McCurrach, M.E.; Beach, D.; Lowe, S.W. Oncogenic ras provokes premature cell senescence associated with accumulation of p53 and p16(INK4a). Cell 1997, 88, 593–602. [Google Scholar] [CrossRef]
- Di Micco, R.; Fumagalli, M.; d’Adda di Fagagna, F. Breaking news: High-speed race ends in arrest—How oncogenes induce senescence. Trends Cell Biol. 2007, 17, 529–536. [Google Scholar] [CrossRef]
- Michaloglou, C.; Vredeveld, L.C.W.W.; Soengas, M.S.; Denoyelle, C.; Kuilman, T.; van der Horst, C.M.; Majoor, D.M.; Shay, J.W.; Mooi, W.J.; Peeper, D.S. BRAFE600-associated senescence-like cell cycle arrest of human naevi. Nature 2005, 436, 720–724. [Google Scholar] [CrossRef]
- Denoyelle, C.; Abou-Rjaily, G.; Bezrookove, V.; Verhaegen, M.; Johnson, T.M.; Fullen, D.R.; Pointer, J.N.; Gruber, S.B.; Su, L.D.; Nikiforov, M.A.; et al. Anti-oncogenic role of the endoplasmic reticulum differentially activated by mutations in the MAPK pathway. Nat. Cell Biol. 2006, 8, 1053–1063. [Google Scholar] [CrossRef]
- Narita, M.; Nuñez, S.; Heard, E.; Narita, M.; Lin, A.W.; Hearn, S.A.; Spector, D.L.; Hannon, G.J.; Lowe, S.W. Rb-Mediated Heterochromatin Formation and Silencing of E2F Target Genes during Cellular Senescence State University of New York at Stony Brook. Cell 2003, 113, 703–716. [Google Scholar] [CrossRef]
- Land, H.; Parada, L.F.; Weinberg, R.A. Tumorigenic conversion of primary embryo fibroblasts requires at least two cooperating oncogenes. Nature 1983, 304, 596–602. [Google Scholar] [CrossRef] [PubMed]
- Maertens, O.; Johnson, B.; Hollstein, P.; Frederick, D.T.; Cooper, Z.A.; Messiaen, L.; Bronson, R.T.; Mcmahon, M.; Granter, S.; Flaherty, K.; et al. Elucidating distinct roles for NF1 in melanomagenesis. Cancer Discov. 2013, 3, 338–349. [Google Scholar] [CrossRef] [PubMed]
- Whittaker, S.R.; Theurillat, J.; Van Allen, E.; Wagle, N.; Hsiao, J.; Cowley, G.S.; Schadendorf, D.; Root, D.E.; Garraway, L.A. RESEARCH ARTICLE A Genome-Scale RNA Interference Screen Implicates NF1 Loss in Resistance to RAF Inhibition. Cancer Discov. 2013, 3, 350–362. [Google Scholar] [CrossRef] [PubMed]
- Van Allen, E.M.; Wagle, N.; Sucker, A.; Treacy, D.J.; Johannessen, C.M.; Goetz, E.M.; Place, C.S.; Taylor-Weiner, A.; Whittaker, S.; Kryukov, G.V.; et al. The genetic landscape of clinical resistance to RAF inhibition in metastatic melanoma. Cancer Discov. 2014, 4, 94–109. [Google Scholar] [CrossRef]
- Kuilman, T.; Michaloglou, C.; Vredeveld, L.C.W.; Douma, S.; van Doorn, R.; Desmet, C.J.; Aarden, L.A.; Mooi, W.J.; Peeper, D.S. Oncogene-Induced Senescence Relayed by an Interleukin-Dependent Inflammatory Network. Cell 2008, 133, 1019–1031. [Google Scholar] [CrossRef]
- Ohanna, M.; Cheli, Y.; Bonet, C.; Bonazzi, V.F.; Allegra, M.; Giuliano, S.; Bille, K.; Bahadoran, P.; Giacchero, D.; Lacour, J.P.; et al. Secretome from senescent melanoma engages the STAT3 pathway to favor reprogramming of naive melanoma towards a tumor-initiating cell phenotype. Oncotarget 2013, 4, 2212–2224. [Google Scholar] [CrossRef]
- Kuilman, T.; Peeper, D.S. Senescence-messaging secretome: SMS-ing cellular stress. Nat. Rev. Cancer 2009, 9, 81–94. [Google Scholar] [CrossRef]
- Wang, M.; Tan, Z.; Zhang, R.; Kotenko, S.V.; Liang, P. Interleukin 24 (MDA-7/MOB-5) signals through two heterodimeric receptors, IL-22R1/IL-20R2 and IL-20R1/IL-20R2. J. Biol. Chem. 2002, 277, 7341–7347. [Google Scholar] [CrossRef]
- Novakova, Z.; Hubackova, S.; Kosar, M.; Janderova-Rossmeislova, L.; Dobrovolna, J.; Vasicova, P.; Vancurova, M.; Horejsi, Z.; Hozak, P.; Bartek, J.; et al. Cytokine expression and signaling in drug-induced cellular senescence. Oncogene 2010, 29, 273–284. [Google Scholar] [CrossRef]
- Deribe, Y.L.; Shi, Y.; Rai, K.; Nezi, L.; Amin, S.B.; Wu, C.C.; Akdemir, K.C.; Mahdavi, M.; Peng, Q.; Chang, Q.E.; et al. Truncating PREX2 mutations activate its GEF activity and alter gene expression regulation in NRAS-mutant melanoma. Proc. Natl. Acad. Sci. USA. 2016, 113, E1296–E1305. [Google Scholar] [CrossRef]
- Kunimoto, H.; Meydan, C.; Nazir, A.; Whitfield, J.; Shank, K.; Rapaport, F.; Maher, R.; Pronier, E.; Meyer, S.C.; Garrett-Bakelman, F.E.; et al. Cooperative Epigenetic Remodeling by TET2 Loss and NRAS Mutation Drives Myeloid Transformation and MEK Inhibitor Sensitivity. Cancer Cell 2018, 33, 44–59. [Google Scholar] [CrossRef] [PubMed]
- Posch, C.; Sanlorenzo, M.; Vujic, I.; Oses-Prieto, J.A.; Cholewa, B.D.; Kim, S.T.; Ma, J.; Lai, K.; Zekhtser, M.; Esteve-Puig, R.; et al. Phosphoproteomic Analyses of NRAS(G12) and NRAS(Q61) Mutant Melanocytes Reveal Increased CK2α Kinase Levels in NRAS(Q61) Mutant Cells. J. Investig. Dermatol. 2016, 136, 2041–2048. [Google Scholar] [CrossRef] [PubMed]
- Paccez, J.D.; Vasques, G.J.; Correa, R.G.; Vasconcellos, J.F.; Duncan, K.; Gu, X.; Bhasin, M.; Libermann, T.A.; Zerbini, L.F. The receptor tyrosine kinase Axl is an essential regulator of prostate cancer proliferation and tumor growth and represents a new therapeutic target. Oncogene 2013, 32, 689–698. [Google Scholar] [CrossRef] [PubMed]
- Xu, L.; Zhou, R.; Yuan, L.; Wang, S.; Li, X.; Ma, H.; Zhou, M.; Pan, C.; Zhang, J.; Huang, N.; et al. IGF1/IGF1R/STAT3 signaling-inducible IFITM2 promotes gastric cancer growth and metastasis. Cancer Lett. 2017, 393, 76–85. [Google Scholar] [CrossRef] [PubMed]
- Mandal, T.; Bhowmik, A.; Chatterjee, A.; Chatterjee, U.; Chatterjee, S.; Ghosh, M.K. Reduced phosphorylation of Stat3 at Ser-727 mediated by casein kinase 2—Protein phosphatase 2A enhances Stat3 Tyr-705 induced tumorigenic potential of glioma cells. Cell. Signal. 2014, 26, 1725–1734. [Google Scholar] [CrossRef] [PubMed]
- Zhuang, D.; Mannava, S.; Grachtchouk, V.; Tang, W.H.; Patil, S.; Wawrzyniak, J.A.; Berman, A.E.; Giordano, T.J.; Prochownik, E.V.; Soengas, M.S.; et al. C-MYC overexpression is required for continuous suppression of oncogene-induced senescence in melanoma cells. Oncogene 2008, 27, 6623–6634. [Google Scholar] [CrossRef]
- Mannava, S.; Omilian, A.R.; Wawrzyniak, J.A.; Fink, E.E.; Zhuang, D.; Miecznikowski, J.C.; Marshall, J.R.; Soengas, M.S.; Sears, R.C.; Morrison, C.D.; et al. PP2A-B56α controls oncogene-induced senescence in normal and tumor human melanocytic cells. Oncogene 2012, 31, 1484–1492. [Google Scholar] [CrossRef][Green Version]
- Bauer, J.; Curtin, J.A.; Pinkel, D.; Bastian, B.C. Congenital melanocytic nevi frequently harbor NRAS mutations but no BRAF mutations. J. Investig. Dermatol. 2007, 127, 179–182. [Google Scholar] [CrossRef]
- Tschandl, P.; Berghoff, A.S.; Preusser, M.; Burgstaller-Muehlbacher, S.; Pehamberger, H.; Okamoto, I.; Kittler, H. NRAS and BRAF Mutations in Melanoma-Associated Nevi and Uninvolved Nevi. PLoS ONE 2013, 8, e69639. [Google Scholar] [CrossRef]
- Liu, F.; Cao, J.; Wu, J.; Sullivan, K.; Shen, J.; Ryu, B.; Xu, Z.; Wei, W.; Cui, R. Stat3-targeted therapies overcome the acquired resistance to vemurafenib in melanomas. J. Investig. Dermatol. 2013, 133, 2041–2049. [Google Scholar] [CrossRef]
- Becker, T.M.; Boyd, S.C.; Mijatov, B.; Gowrishankar, K.; Snoyman, S.; Pupo, G.M.; Scolyer, R.A.; Mann, G.J.; Kefford, R.F.; Zhang, X.D.; et al. Mutant B-RAF-Mcl-1 survival signaling depends on the STAT3 transcription factor. Oncogene 2014, 33, 1158–1166. [Google Scholar] [CrossRef] [PubMed]
- Girotti, M.R.; Pedersen, M.; Sanchez-Laorden, B.; Viros, A.; Turajlic, S.; Niculescu-Duvaz, D.; Zambon, A.; Sinclair, J.; Hayes, A.; Gore, M.; et al. Inhibiting EGF receptor or SRC family kinase signaling overcomes BRAF inhibitor resistance in melanoma. Cancer Discov. 2013, 3, 158–167. [Google Scholar] [CrossRef] [PubMed]
- Hüser, L.; Sachindra, S.; Granados, K.; Federico, A.; Larribère, L.; Novak, D.; Umansky, V.; Altevogt, P.; Utikal, J. SOX2-mediated upregulation of CD24 promotes adaptive resistance towards targeted therapy in melanoma. IJC 2018, 143, 3131–3142. [Google Scholar]
- Gupta, P.B.; Kuperwasser, C.; Brunet, J.P.; Ramaswamy, S.; Kuo, W.L.; Gray, J.W.; Naber, S.P.; Weinberg, R.A. The melanocyte differentiation program predisposes to metastasis after neoplastic transformation. Nat. Genet. 2005, 37, 1047–1054. [Google Scholar] [CrossRef] [PubMed]
- Garraway, L.A.; Widlund, H.R.; Rubin, M.A.; Getz, G.; Berger, A.J.; Ramaswamy, S.; Beroukhim, R.; Milner, D.A.; Granter, S.R.; Du, J.; et al. Integrative genomic analyses identify MITF as a lineage survival oncogene amplified in malignant melanoma. Nature 2005, 436, 117–122. [Google Scholar] [CrossRef]
- Bagga, M.; Kaur, A.; Westermarck, J.; Abankwa, D. ColonyArea: An ImageJ Plugin to Automatically Quantify Colony Formation in Clonogenic Assays. PLoS ONE 2014, 9, e92444. [Google Scholar]
- de Winter, J.C.F. Using the student’s t-test with extremely small sample sizes. Pract. Assess. Res. Eval. 2013, 18, 1–12. [Google Scholar]
© 2020 by the authors. Licensee MDPI, Basel, Switzerland. This article is an open access article distributed under the terms and conditions of the Creative Commons Attribution (CC BY) license (http://creativecommons.org/licenses/by/4.0/).