Abstract
Chromosomal instability (CIN) of gastric cancer is correlated with distinct outcomes. This study aimed to investigate the role of computed tomography (CT) imaging traits in predicting the CIN status of gastric cancer. We screened 443 patients in the Cancer Genome Atlas gastric cancer cohort to filter 40 patients with complete CT imaging and genomic data as the training cohort. CT imaging traits were subjected to logistic regression to select independent predictors for the CIN status. For the validation cohort, we prospectively enrolled 18 gastric cancer patients for CT and tumor genomic analysis. The imaging predictors were tested in the validation cohort using receiver operating characteristic curve (ROC) analysis. Thirty patients (75%) in the training cohort and 9 patients (50%) in the validation cohort had CIN subtype gastric cancers. Smaller tumor diameter (p = 0.017) and acute tumor transition angle (p = 0.045) independently predict CIN status in the training cohort. In the validation cohort, acute tumor transition angle demonstrated the highest accuracy, sensitivity, and specificity of 88.9%, 88.9%, and 88.9%, respectively, and areas under ROC curve of 0.89. In conclusion, this pilot study showed acute tumor transition angle on CT images may predict the CIN status of gastric cancer.
1. Introduction
Gastric cancer is one of the most common and aggressive solid malignancies worldwide, with the highest incidence in Asia [1,2]. Patients undergoing standard treatment (i.e., surgical resection plus adjuvant chemotherapy or radiochemotherapy) have high rates of tumor recurrence (20%–40%) [3,4]. The heterogeneity in clinical outcomes in gastric cancer is consistent with other solid tumors, and genomic analysis has repeatedly shown that tumors are molecularly diverse [5]. Therapies specifically targeting key molecular features can have clinical outcomes beyond those of traditional standard therapies [5,6]. Conventional Lauren [7] and World Health Organization [8] classifications are based on histopathologic features and have limited implications in guiding personalized therapy for gastric cancer patients [9]. More recently, the Cancer Genome Atlas (TCGA) research group developed a molecular classification system based on gene expression profiling for gastric cancer. It emphasizes a molecular pathogenesis perspective, providing a potential roadmap for targeted therapy [9]. Among the four TCGA subtypes—Epstein–Barr virus (EBV)-positive, microsatellite unstable, chromosomal instability (CIN), and genomically stable—CIN subtype gastric cancer accounts for nearly half of all gastric cancer cases [9]. The CIN status is defined as a high degree of somatic copy number variation by gaining or losing chromosomes [10]. Traditionally, the CIN status of tumors are detected by molecular cytogenetic techniques such as comparative genomic hybridization, polymerase chain reaction, flow cytometry, or single nucleotide polymorphism arrays-based methods [11]. In daily clinical practice, these complex genomic analysis techniques may not provide timely information for decision making in cancer treatment, and tumor specimen is not always available. Besides, CIN is a complex, heterogenous, and ongoing process that initiates and drives oncogenesis, and the profile of CIN may not be completely delineated by traditional methods. If CIN subtype gastric cancer could be predicted using clinical, imaging, or histopathologic data collected in the routine evaluation and work-up of gastric cancer patients, they may provide rapid and complementary information before genomic analysis results [12].
Radiogenomics (the science of multiscale data fusion) is a powerful, robust, and scalable tool that has been applied across different tumor types and imaging modalities to address many crucial questions in oncology [13]. It has been used to create “association maps” between large-scale multilevel genomic data and image features from clinical imaging to identify clinically significant prognostic and predictive biomarkers. It has also been used to define molecular patterns associated with particular image phenotypes in different imaging modalities and tumor types. Radiogenomics links and validates associations between imaging signatures, clinical findings, and molecular pathogenesis [14]. Computed tomography (CT) is a routine preoperative evaluation modality in gastric cancer patients. With the development of isotropic imaging and multiplanar reconstruction, early gastric cancer can now be detected through multidetector CT, with a reported detection rate of 90% [15]. The TNM staging system is a widely used cancer staging system based on the tumor extent, the lymph node spread, and the presence of metastasis [16]. Studies have mainly focused on the key components of the TNM staging system to improve diagnostic accuracy. Little attention has been paid to other imaging traits such as tumor morphology, texture, or contrast enhancement pattern, which do not contribute to the TNM staging system. Through radiogenomic analysis, imaging traits that provide additional information can be extracted during routine imaging examination without additional costs. No study has investigated the radiological phenotypes associated with clinically significant genomic signatures in gastric cancer. Whether radiogenomic features from CT imaging can be used to identify CIN subtype gastric cancer remains a critical and unaddressed question.
In this study, we aimed to investigate the role of CT imaging traits in predicting the CIN status of gastric cancer.
2. Results
2.1. Training Cohort and Imaging Predictors
We screened 443 patients in the TCGA gastric cancer cohort and selected 43 patients with complete CT imaging, genomic, and clinical data. We further excluded three patients from the training cohort: two for small tumor diameter (<1 cm) and one for predominant distal esophageal tumor. Thus, the final training cohort comprised 40 patients: 35 men and 5 women (Table 1). The median age was 68 years (range, 36–79). The median tumor diameter was 5.4 cm (range, 2.8–12.5). None of the patients had early gastric cancer, defined as tumor limited to the mucosa or submucosa regardless of lymph node status, according to the Japanese Gastric Cancer Association [17]. Of the 40 patients, 30 (75%) had CIN subtype gastric cancer, and the other 10 (25%) had non-CIN subtype gastric cancer (2 EBV-positive, 5 microsatellite unstable, and 3 genomically stable subtype). Of the 30 CIN subtype gastric cancers, 21 tumors (70%) were categorized as Borrmann type I or II in tumor shape. No significant association was found between the Borrmann classification and CIN status (p = 0.135). From the training cohort, two CT imaging traits independently predicted the CIN status of gastric cancer: smaller tumor diameter (odds radio [OR]: 0.54, p = 0.017) and acute tumor transition angle (OR: 7.41, p = 0.045) (Table 2).

Table 1.
Clinical and histopathologic data of training and validation cohorts.
Table 2.
Univariate and multivariate logistic regression analysis of predictors of chromosomal instability subtype gastric cancer.
2.2. Validation Cohort
The validation cohort included 18 patients, consisting of 11 men and 7 women (Table 1). The median age was 68 years (range, 47–87). The median tumor diameter was 3.7 cm (range, 1.7–11.6). The tumor diameter of the validation cohort was significantly smaller than that of training cohort (p = 0.01). No significant differences were observed in TNM staging between the validation and training cohorts. Using the Lauren system, the histologic type of gastric cancer was classified as intestinal type in 7, diffuse type in 6, and mixed type in 5 patients. In the validation cohort, 9 patients had CIN subtype gastric cancer (Figure 1). The CIN subtype gastric cancer was predominantly of the Lauren intestinal type, and the non-CIN subtype gastric cancer was predominantly of the Lauren diffuse type. Variance in the degree of aneuploidy (i.e., copy number loss or gain) was observed in the CIN subtype gastric cancers. The median number of aneuploidy genes was 63 (range, 25 to 200).
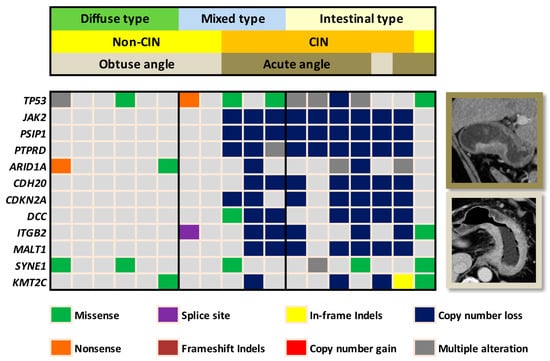
Figure 1.
Heatmap demonstrates the correlation of the chromosomal instability (CIN) status and tumor transition angle on computed tomography (CT) in the validation cohort. Eight out of the 9 non-CIN gastric cancers presented with obtuse angle whereas 8 out of the 9 CIN gastric cancers presented with acute angle on CT. In the Lauren mixed type tumors, transition angle on CT clearly defined the CIN versus non-CIN status. For the interest of space, only the leading 12 out of the 409 gene mutations were demonstrated on the heatmap.
2.3. Diagnostic Accuracy of Imaging Predictors
The imaging predictors identified from the training cohort were tested in the validation cohort. A tumor diameter cutoff value of ≤7.2 cm was obtained from the training cohort using receiver operating characteristic curve (ROC) analysis. The diagnostic accuracy of imaging predictors was evaluated by ROC analysis in the validation cohort. The areas under the receiver operating characteristic curve (AUC) were 0.89 (95% CI, 0.72–1.00) for acute tumor transition angle and 0.67 (95% CI, 0.41–0.93) for tumor diameter ≤7.2 cm in the validation cohort (Figure 2). As the more accurate imaging predictor of the CIN status of gastric cancer, acute tumor transition angle achieved an accuracy, sensitivity, and specificity of 88.9%, 88.9%, and 88.9% in the validation cohort as detailed in Table 3. Examples of imaging traits analysis of CIN and non-CIN gastric cancers are demonstrated in Figure 3 and Figure 4, respectively.
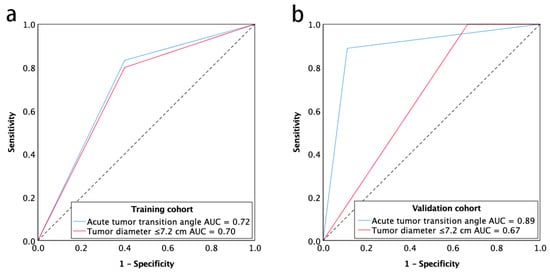
Figure 2.
Receiver operating characteristic curve for the chromosomal instability status of gastric cancer with acute tumor transition angle and tumor diameter ≤7.2 cm for training cohort (a) and validation cohort (b). Note—AUC, areas under the receiver operating characteristics curve.
Table 3.
Diagnostic accuracy of the imaging predictors of chromosomal instability subtype gastric cancer.
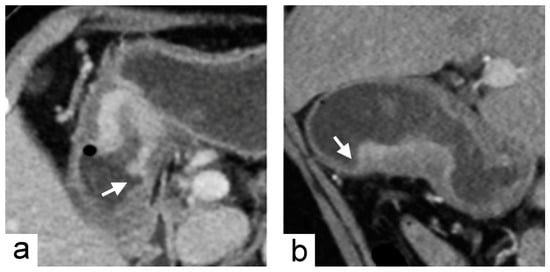
Figure 3.
Chromosomal instability subtype gastric cancer in a 79-year-old female who underwent preoperative contrast-enhanced computed tomography. (a) portal venous phase axial and (b) arterial phase sagittal images showed focal wall thickening of the greater curvature side of the stomach with the largest diameter of 3.1 cm. In the imaging traits evaluation, the tumor morphology was defined to be acute tumor transition angle (arrows in (a,b)), well-defined margin and polypoid shape.
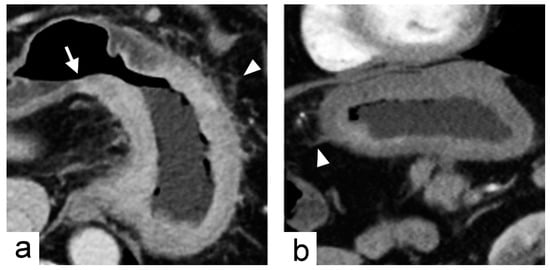
Figure 4.
Non-chromosomal instability subtype gastric cancer in a 68-year-old male who underwent preoperative contrast-enhanced computed tomography. (a) portal venous phase axial and (b) arterial phase sagittal images showed extensive circumferential wall thickening involving the gastric fundus, cardia and body with the largest diameter of 6.6 cm. The tumor had obtuse tumor transition angle (arrow in (a)), ill-defined margin and infiltrative shape in morphology. Because of the peri-gastric stranding densities, the lesion was also defined to have “serosal invasion” imaging trait (arrowheads in (a,b)), which was later confirmed by histopathology analysis.
3. Discussion
Our study showed that the two imaging traits—smaller tumor diameter and acute tumor transition angle—independently predicted the CIN status of gastric cancer in the training cohort. In the independent validation cohort, the imaging trait of acute tumor transition angle was the more accurate imaging predictor, with sensitivity and specificity of 88.9% and 88.9%, respectively; this trait may noninvasively predict the CIN status of gastric cancer. Consistent with the findings for our prospective validation cohort, CIN subtype gastric cancer accounted for approximately 50% of the study cohort of TCGA classification study [9]. The CIN subtype has better responses to adjuvant chemotherapy, whereas the microsatellite unstable and genomically stable subtype have only moderate benefits and no benefits from adjuvant chemotherapy, respectively [18]. By knowing the CIN status of gastric cancer, a personalized adjuvant treatment strategy including conventional chemotherapy and target therapy could potentially be tailored for gastric cancer patients based on their radiogenomic CT profile.
The Borrmann classification system is a morphologic classification of advanced gastric cancer based on endoscopy or macroscopic pathology examination; it provides a simple and valuable prediction of lymph node metastasis and survival [19,20]. The CIN subtype gastric cancers in the present study were predominantly of the intestinal type according to Lauren classification, which is in line with the literature data [9]. Although the Lauren intestinal type had been reported to be associated with less advanced Borrmann morphology (i.e., more likely acute tumor transition angle) [9,21], the association of Borrmann classification with CIN subtype gastric cancer could not be demonstrated in our study. Besides, it remains unaddressed whether the transition angle changes as the tumor grows, because our training and validation cohorts comprised mostly advanced gastric cancers. The only one CIN subtype gastric cancer showing obtuse tumor transition angle had a relatively low number of aneuploidy genes of 34. However, we could not exclude the patient from the validation cohort because the patient was not an outliner in degree of aneuploidy. The relationship between the degree of aneuploidy and tumor transition angle was undetermined due to limited sample size of this study. On the other hand, the Lauren diffuse type gastric cancer is enriched in the genomically stable subtype gastric cancer of TCGA classification system [9]. Zhou et al. had demonstrated that abnormal expression of E-cadherin, which is a major adhesion molecule in the cell-cell junction, correlated with the Lauren diffuse type gastric cancer and more infiltrative morphology (Borrmann type III and IV) [22].
EBV-associated gastric cancers account for approximately 9% of all gastric cancers [23]. They are characterized by high EBV burden and DNA promoter hypermethylation [9]. A study of 10 EBV-associated gastric cancer patients showed that location in the upper gastric region, large thickness-to-width ratio, or bulky mass projecting from the wall were CT features of EBV-associated gastric cancer [24]. In our TCGA training cohort, two patients had EBV-positive subtype gastric cancer, and both of the tumors were located in the upper gastric body. However, further CT imaging feature analysis of EBV-positive subtype gastric cancer was precluded due to limited patient number.
To accurately extract imaging traits from CT images, the patients with smaller tumor diameter (<1 cm) were excluded from this study, which may account for the relatively large cutoff value of 7.2 cm obtained from the training cohort by ROC analysis. The diagnostic accuracy was unsatisfactory based on tumor diameter in the validation cohort, plausibly because of the significant difference in tumor diameter between the training and validation cohort. Future study of larger sample size may provide a more optimal cutoff value for tumor diameter in predicting the CIN status of gastric cancer.
Tsurumaru et al. demonstrated the association between gastric cancer histopathologic types and the contrast enhancement pattern on dynamic contrast-enhanced CT images [25,26]. In our study, no association was observed between the double-layered enhancement pattern and CIN status. Consistent with our result, Lauren diffuse type gastric cancer (usually non-CIN subtype gastric cancer) frequently showed a double-layered pattern on arterial phase images and a single-layered pattern on delayed phase images [25].
The novel concept of radiogenomics provides a connection between imaging traits and genetic information of cancers [13]. In the era of precision medicine, there is an increasing need to classify and treat cancers on a molecular basis because the clinical outcomes and treatment response may vary even if the cancers are histologically similar [27]. Although the advancement of high-throughput analysis has facilitated more rapid and lower cost genomics data acquirement [14], the inherent limitation is three-fold. First, genomic profiles require adequate tumor tissue, specialized equipment, and technical expertise. Second, surgical or image-guided tumor biopsy is not always feasible in cancer patients due to risks and possible complications associated with the biopsy procedure. Third and most importantly, a tumor may have different internal components with distinct gene expression patterns (i.e., intratumoral heterogeneity) [28]. Thus, tumor specimens only represent a small portion of the tumor rather than the whole tumor. Noninvasive imaging examinations, which are routinely performed for clinical staging, have the potential to provide overall perspectives of the tumor and demonstrate intratumoral heterogeneity. It will be helpful if we can correlate imaging traits (i.e., imaging phenotype or radiophenotype) to certain genetic subtypes or gene expression patterns of cancers [29]. Radiogenomic features have been demonstrated to be associated with the luminal B subtype of breast cancer [30] or the VHL gene mutation in clear cell renal cell carcinoma [31].
Serum biomarker is another potential approach to predict the CIN status of gastric cancer. CIN in plasma or serum cell-free DNA has been used to detect ovarian cancer or prostate cancer [32,33]. In gastric cancer, a study had demonstrated plasma DNA concentration as diagnostic biomarker by quantifying plasma cell-free DNA [34]. However, it is still unclear whether CIN in serum cell-free DNA correlates with the CIN subtype gastric cancer of TCGA classification, and it may be a feature direction of research. The potential serum biomarker may be a complement to our CT imaging predictor and enhance the accuracy in predicting CIN subtype gastric cancer.
This study has several limitations. First, although a prospective validation cohort was included, a retrospective cohort was used for training, and both cohorts have small sample sizes. The preliminary results of this study warrant further validation in a larger gastric cancer cohort with surrogate profiles of CIN, such as an immunohistochemistry panel of MLH1, p53, and EBER staining [35], or CIN70 signature—70 genes that correlate with high levels of aneuploidy [36,37]. Second, the majority of enrolled patients had resectable advanced gastric cancers in the current report. Further study should include more patients with more unresectable tumors or early gastric cancers, or even in CIN animal models, to test the generalizability of this pilot finding. Third, we determined tumor morphology on multiplanar reconstruction images. Although these images allow radiologists to evaluate target lesions in different orientations, the partial volume effect may still lead to the incorrect interpretation of morphologic imaging traits. Future CT studies with three-dimensional reformatted virtual gastroscopy may provide more precise and global views of gastric cancer when interpreting imaging traits. Lastly, although CT texture features might correlate with immunochemical biomarkers such as E-cadherin, Ki67, VEGFR2, and EGFR in gastric cancer [38], the large feature numbers might cause false-discovery in our limited sample sizes. Nevertheless, our initial report is the first study utilizing the radiogenomic approach to analyze the molecular subtype of gastric cancer. Radiogenomic analysis of gastric cancer including the analysis of CT texture features may be a future research direction.
4. Materials and Methods
4.1. Study Patients and Data Collection
This study was designed as a disease landscape study with no prespecified hypothesis. The institutional review board approved the protocol of this study (project number: 201601916B0C601), which had both retrospective and prospective components. A waiver of consent was obtained for the retrospective phase, which involved the extraction of imaging traits from a publicly available database. For the prospective phase, informed consent was obtained from participants in a tertiary referral center. For patient enrolment, a dedicated gastric cancer interdisciplinary team screened patents through image examination and molecular analysis of tissue specimens, as described herein.
4.2. Training Cohort
The public data portal of the TCGA provides public data of a cohort of gastric cancer patients containing complete genomic sequencing and clinical data (https://cancergenome.nih.gov). The Cancer Imaging Archive data set contains publicly available CT images of a subset of TCGA cohort patients (http://www.cancerimagingarchive.net). We selected gastric cancer patients with preoperative CT images from the TCGA cohort as the training cohort. To accurately extract imaging traits from CT images, the patients with tumor diameter <1 cm on CT images were excluded.
4.3. Imaging Traits Evaluation
Fourteen qualitative and two quantitative imaging traits were defined and analyzed for their association with the CIN status of gastric cancer (Table 4 and Figure 5). The “tumor shape” imaging trait was defined according to the Borrmann classification system (a morphologic classification of advanced gastric cancer) [20]. Two radiologists (Ying-Chieh Lai and Gigin Lin with 3 and 12 years of oncology imaging experience, respectively) independently reviewed CT images of all patients and were blinded to their clinical variables and genomic analysis results. Imaging traits extracted from CT images were evaluated on the picture archiving and communication system. In case of discrepancy in interpretation, the final results of imaging traits were based on a consensus between the two radiologists.
Table 4.
Definition of imaging traits.
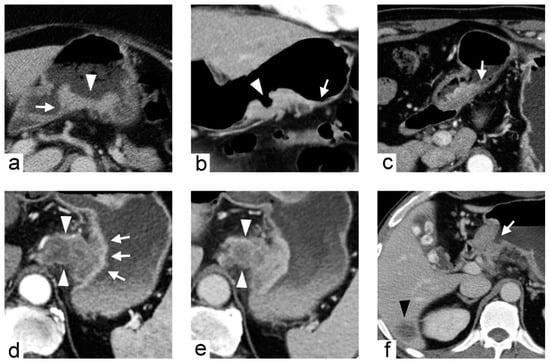
Figure 5.
Imaging traits of gastric cancers demonstrated in different patients. (a) 71-year-old female with gastric cancer at posterior wall of gastric body. Contrast-enhanced computed tomography (CT) during portal venous phase axial image demonstrates the tumor with fungating shape (arrowhead), well-defined margin and acute tumor transition angle (arrow). (b) 61-year-old female with gastric cancer at greater curvature of gastric body. Contrast-enhanced CT during arterial phase coronal image demonstrates the tumor with ulcerative shape (arrowhead), ill-defined margin and obtuse tumor transition angle (arrow). (c) 66-year-old male with gastric cancer at antrum. Contrast-enhanced CT during arterial phase axial image demonstrates the tumor with polypoid shape, ill-defined margin and obtuse tumor transition angle (arrow). (d,e) 73-year-old male with gastric cancer at cardia. Contrast-enhanced CT during arterial phase (d) and portal venous phase (e) axial images demonstrate the tumor with an inner layer of higher contrast enhancement (arrows in (d)) and an outer extra-gastric portion of heterogeneously lower contrast enhancement (arrowheads in (d,e)). (f) 56-year-old male with gastric cancer at antrum. Contrast-enhanced CT during arterial phase axial image demonstrates the tumor with luminal obstruction (arrow) and liver metastasis (arrowhead).
4.4. Validation Cohort
From May 2016–April 2017, consecutive gastric cancer patients from our center were screened and included in the validation cohort. The inclusion criteria were (1) age of 20–80 years; (2) histologically confirmed adenocarcinoma of the stomach; and (3) tumors considered resectable by gastric cancer interdisciplinary team. The exclusion criteria were (1) tumor diameter <1 cm on CT images; (2) prior gastric surgery; and (3) prior neoadjuvant chemotherapy or chemoradiotherapy. The patients underwent preoperative CT images within 14 days of surgery in accordance with the institutional CT protocol for gastric cancer. Histopathologic and genomic analysis of the gastric cancer specimens obtained via surgical resection was performed.
4.5. Imaging Analysis
All CT examinations of validation cohort were performed using 320-detector row CT (Aquilion ONE; Toshiba Medical Systems, Otawara, Japan). Oral contrast medium of 500 mL water was administered before imaging to distend the stomach, and intravenous contrast medium of 100 mL iohexol (350 mg iodine per millilitre, Omnipaque 350; GE Healthcare, Princeton, NJ, USA) was administrated using a power injector, with an injection rate of 3 mL/s. Multiphase (arterial and portal venous phases) contrast-enhanced CT imaging was performed as per the institutional standard CT protocol for gastric cancer. Multiphase CT imaging was performed after an empirical delay from initiation of contrast medium injection. The delay time was 25 and 70 s for arterial and portal venous phase imaging, respectively. The arterial phase scan focused on the stomach, and portal venous phase imaging was performed from the abdomen to pelvis. Coronal and sagittal multiplanar reconstruction images were used for more precise tumor detection and invasion depth evaluation. CT scan parameters were as follows: 120 kVp and automatic tube current modulation and image reconstruction to 5-mm thickness and at 5-mm intervals for viewing on a picture archiving and communication system. Two radiologists (Ying-Chieh Lai and Gigin Lin) who were blinded to the genomic analysis results independently tested predictors of CIN subtype gastric cancer on the validation cohort. The final results were based on a consensus between the two radiologists.
4.6. Histopathologic and Genomic Analysis
A gastrointestinal pathology specialist (Ren-Chin Wu, 12 years of experience) evaluated all haematoxylin and eosin-stained tissue slides of the validation cohort and provided information on the Lauren histologic type and the local invasion and lymph node metastasis status. Patients were classified to CIN subtype and non-CIN subtype according to the TCGA system [9], independent to the clinical information and CT imaging results. Genomic DNA was extracted from Formalin-fixed paraffin-embedded (FFPE) tumor samples using the QIAamp DNA FFPE Tissue Kit (Qiagen, Hilden, Germany); DNA was quantified using the Quant-iT dsDNA HS Assay (Invitrogen, Waltham, MA, USA). Genomic DNA (80 ng) was amplified using four pools of 15,992 primer pairs (Ion AmpliSeq Comprehensive Cancer Panel, Life Technologies, Carlsbad, CA, USA) to target the coding exon regions of 409 cancer-related genes, which covered the TP53/cell cycle, JAK/STAT, Ras/PI3K, Wnt, receptor tyrosine kinase, chromatin remodelling, DNA repair, TGFβ, and cadherin signaling. We classified gastric cancer patients by tumor based on whether the proportion of altered genes was high or low. The 409 genes (including both oncogenes and tumor suppressor genes) in gastric cancer tumor tissue were sequenced (Appendix Table A1).
4.7. Statistical Analysis
All data were analyzed using SPSS version 25 (Armonk, NY, USA). Categorical variables were compared between groups using the chi-square or Fisher’s exact test, and continuous variables were compared using non-parametric Mann-Whitney U test. Univariate and multivariate logistic regression with stepwise procedure was used to identify the independent imaging predictors of CIN subtype gastric cancer. The tumor diameter was dichotomized by cutoff values obtained from a ROC analysis. AUC were calculated to evaluate diagnostic accuracy of each imaging predictor. Two-tailed p < 0.05 was considered statistically significant.
5. Conclusions
This pilot study of radiogenomic analysis revealed that CT imaging traits may noninvasively predict the TCGA subtype of gastric cancer. In our study, the acute tumor transition angle is the most accurate predictor of the CIN status of gastric cancer, which may provide a preliminary roadmap for personalized medicine.
Author Contributions
Conceptualization, T.-S.Y., R.-C.W., G.L. and M.D.K.; Data curation, Y.-C.L., R.-C.W., C.-K.T., L.-Y.Y. and G.L.; Formal analysis, Y.-C.L., R.-C.W., C.-K.T., L.-Y.Y. and G.L.; Funding acquisition, T.-S.Y., C.-K.T. and G.L.; Investigation, Y.-C.L., T.-S.Y. and G.L.; Methodology, Y.-C.L., R.-C.W., C.-K.T., L.-Y.Y. and G.L.; Project administration, T.-S.Y. and G.L.; Resources, T.-S.Y., R.-C.W., C.-K.T. and G.L.; Software, Y.-C.L. and C.-K.T.; Supervision, G.L. and M.D.K.; Validation, R.-C.W., C.-K.T., G.L. and M.D.K.; Visualization, Y.-C.L.; Writing—original draft, Y.-C.L., G.L. and M.D.K.; Writing—review & editing, Y.-C.L., T.-S.Y., R.-C.W., C.-K.T., G.L. and M.D.K.
Funding
This research was funded by the Ministry of Science and Technology Taiwan grant MOST 106-2314-B-182A-019-MY3; the Chang Gung Foundation CMRPG3E1321-2 and IRB201601916B0, IRB103-7448B.
Conflicts of Interest
The authors declare no conflict of interest.
Abbreviations
| AUC | Areas under the receiver operating characteristics curve |
| CI | Confidence interval |
| CIN | Chromosomal instability |
| CT | Computed tomography |
| EBV | Epstein–Barr virus |
| OR | Odds ratio |
| ROC | Receiver operating characteristic curve |
| TCGA | The Cancer Genome Atlas |
Appendix A
Table A1.
List of studied 409 oncogenes and tumor suppressor genes.
Table A1.
List of studied 409 oncogenes and tumor suppressor genes.
| Gene Names | ||||||||||
|---|---|---|---|---|---|---|---|---|---|---|
| ABL1 | BIRC2 | COL1A1 | ERCC4 | GDNF | JUN | MDM4 | NOTCH4 | PMS1 | SDHD | TLR4 |
| ABL2 | BIRC3 | CRBN | ERCC5 | GNA11 | KAT6A | MEN1 | NPM1 | PMS2 | 9-Sep | TLX1 |
| ACVR2A | BIRC5 | CREB1 | ERG | GNAQ | KAT6B | MET | NRAS | POT1 | SETD2 | TNFAIP3 |
| ADAMTS20 | BLM | CREBBP | ESR1 | GNAS | KDM5C | MITF | NSD1 | POU5F1 | SF3B1 | TNFRSF14 |
| AFF1 | BLNK | CRKL | ETS1 | GPR124 | KDM6A | MLH1 | NTRK1 | PPARG | SGK1 | TNK2 |
| AFF3 | BMPR1A | CRTC1 | ETV1 | GRM8 | KDR | MLLT10 | NTRK3 | PPP2R1A | SH2D1A | TOP1 |
| AKAP9 | BRAF | CSF1R | ETV4 | GUCY1A2 | KEAP1 | MMP2 | NUMA1 | PRDM1 | SMAD2 | TP53 |
| AKT1 | BRD3 | CSMD3 | EXT1 | HCAR1 | KIT | MN1 | NUP214 | PRKAR1A | SMAD4 | TPR |
| AKT2 | BRIP1 | CTNNA1 | EXT2 | HIF1A | KLF6 | MPL | NUP98 | PRKDC | SMARCA4 | TRIM24 |
| AKT3 | BTK | CTNNB1 | EZH2 | HLF | KMT2A | MRE11A | PAK3 | PSIP1 | SMARCB1 | TRIM33 |
| ALK | BUB1B | CYLD | FANCA | HNF1A | KMT2C | MSH2 | PALB2 | PTCH1 | SMO | TRIP11 |
| AMER1 | CARD11 | CYP2C19 | FANCC | HOOK3 | KMT2D | MSH6 | PARP1 | PTEN | SMUG1 | TRRAP |
| APC | CASC5 | CYP2D6 | FANCD2 | HRAS | KRAS | MTOR | PAX3 | PTGS2 | SOCS1 | TSC1 |
| AR | CBL | DAXX | FANCF | HSP90AA1 | LAMP1 | MTR | PAX5 | PTPN11 | SOX11 | TSC2 |
| ARID1A | CCND1 | DCC | FANCG | HSP90AB1 | LCK | MTRR | PAX7 | PTPRD | SOX2 | TSHR |
| ARID2 | CCND2 | DDB2 | FAS | ICK | LIFR | MUC1 | PAX8 | PTPRT | SRC | UBR5 |
| ARNT | CCNE1 | DDIT3 | FBXW7 | IDH1 | LPHN3 | MUTYH | PBRM1 | RAD50 | SSX1 | UGT1A1 |
| ASXL1 | CD79A | DDR2 | FGFR1 | IDH2 | LPP | MYB | PBX1 | RAF1 | STK11 | USP9X |
| ATF1 | CD79B | DEK | FGFR2 | IGF1R | LRP1B | MYC | PDE4DIP | RALGDS | STK36 | VHL |
| ATM | CDC73 | DICER1 | FGFR3 | IGF2 | LTF | MYCL | PDGFB | RARA | SUFU | WAS |
| ATR | CDH1 | DNMT3A | FGFR4 | IGF2R | LTK | MYCN | PDGFRA | RB1 | SYK | WHSC1 |
| ATRX | CDH11 | DPYD | FH | IKBKB | MAF | MYD88 | PDGFRB | RECQL4 | SYNE1 | WRN |
| AURKA | CDH2 | DST | FLCN | IKBKE | MAFB | MYH11 | PER1 | REL | TAF1 | WT1 |
| AURKB | CDH20 | EGFR | FLI1 | IKZF1 | MAGEA1 | MYH9 | PGAP3 | RET | TAF1L | XPA |
| AURKC | CDH5 | EML4 | FLT1 | IL2 | MAGI1 | NBN | PHOX2B | RHOH | TAL1 | XPC |
| AXL | CDK12 | EP300 | FLT3 | IL21R | MALT1 | NCOA1 | PIK3C2B | RNASEL | TBX22 | XPO1 |
| BAI3 | CDK4 | EP400 | FLT4 | IL6ST | MAML2 | NCOA2 | PIK3CA | RNF2 | TCF12 | XRCC2 |
| BAP1 | CDK6 | EPHA3 | FN1 | IL7R | MAP2K1 | NCOA4 | PIK3CB | RNF213 | TCF3 | ZNF384 |
| BCL10 | CDK8 | EPHA7 | FOXL2 | ING4 | MAP2K2 | NF1 | PIK3CD | ROS1 | TCF7L1 | ZNF521 |
| BCL11A | CDKN2A | EPHB1 | FOXO1 | IRF4 | MAP2K4 | NF2 | PIK3CG | RPS6KA2 | TCF7L2 | |
| BCL11B | CDKN2B | EPHB4 | FOXO3 | IRS2 | MAP3K7 | NFE2L2 | PIK3R1 | RRM1 | TCL1A | |
| BCL2 | CDKN2C | EPHB6 | FOXP1 | ITGA10 | MAPK1 | NFKB1 | PIK3R2 | RUNX1 | TET1 | |
| BCL2L1 | CEBPA | ERBB2 | FOXP4 | ITGA9 | MAPK8 | NFKB2 | PIM1 | RUNX1T1 | TET2 | |
| BCL2L2 | CHEK1 | ERBB3 | FZR1 | ITGB2 | MARK1 | NIN | PKHD1 | SAMD9 | TFE3 | |
| BCL3 | CHEK2 | ERBB4 | G6PD | ITGB3 | MARK4 | NKX2-1 | PLAG1 | SBDS | TGFBR2 | |
| BCL6 | CIC | ERCC1 | GATA1 | JAK1 | MBD1 | NLRP1 | PLCG1 | SDHA | TGM7 | |
| BCL9 | CKS1B | ERCC2 | GATA2 | JAK2 | MCL1 | NOTCH1 | PLEKHG5 | SDHB | THBS1 | |
| BCR | CMPK1 | ERCC3 | GATA3 | JAK3 | MDM2 | NOTCH2 | PML | SDHC | TIMP3 | |
References
- Bray, F.; Ferlay, J.; Soerjomataram, I.; Siegel, R.L.; Torre, L.A.; Jemal, A. Global cancer statistics 2018: GLOBOCAN estimates of incidence and mortality worldwide for 36 cancers in 185 countries. CA Cancer J. Clin. 2018, 68, 394–424. [Google Scholar] [CrossRef] [PubMed]
- Nagini, S. Carcinoma of the stomach: A review of epidemiology, pathogenesis, molecular genetics and chemoprevention. World J. Gastrointest. Oncol. 2012, 4, 156–169. [Google Scholar] [CrossRef]
- Cunningham, D.; Allum, W.H.; Stenning, S.P.; Thompson, J.N.; van de Velde, C.J.; Nicolson, M.; Scarffe, J.H.; Lofts, F.J.; Falk, S.J.; Iveson, T.J.; et al. Perioperative chemotherapy versus surgery alone for resectable gastroesophageal cancer. N. Engl. J. Med. 2006, 355, 11–20. [Google Scholar] [CrossRef]
- Macdonald, J.S.; Smalley, S.R.; Benedetti, J.; Hundahl, S.A.; Estes, N.C.; Stemmermann, G.N.; Haller, D.G.; Ajani, J.A.; Gunderson, L.L.; Jessup, J.M.; et al. Chemoradiotherapy after surgery compared with surgery alone for adenocarcinoma of the stomach or gastroesophageal junction. N. Engl. J. Med. 2001, 345, 725–730. [Google Scholar] [CrossRef] [PubMed]
- An, F.Q.; Matsuda, M.; Fujii, H.; Tang, R.F.; Amemiya, H.; Dai, Y.M.; Matsumoto, Y. Tumor heterogeneity in small hepatocellular carcinoma: Analysis of tumor cell proliferation, expression and mutation of p53 AND beta-catenin. Int. J. Cancer 2001, 93, 468–474. [Google Scholar] [CrossRef]
- Cortez, E.; Gladh, H.; Braun, S.; Bocci, M.; Cordero, E.; Bjorkstrom, N.K.; Miyazaki, H.; Michael, I.P.; Eriksson, U.; Folestad, E.; et al. Functional malignant cell heterogeneity in pancreatic neuroendocrine tumors revealed by targeting of PDGF-DD. Proc. Natl. Acad. Sci. USA 2016, 113, E864–E873. [Google Scholar] [CrossRef]
- Lauren, P. The Two Histological Main Types of Gastric Carcinoma: Diffuse and So-Called Intestinal-Type Carcinoma. An Attempt at a Histo-Clinical Classification. Acta Pathol. Microbiol. Scand. 1965, 64, 31–49. [Google Scholar] [CrossRef] [PubMed]
- Bosman, F.T.; Carneiro, F.; Hruban, R.H.; Theise, N.D. WHO Classification of Tumours of the Digestive System, 4th ed.; International Agency for Research on Cancer: Lyon, France, 2010; pp. 48–58. [Google Scholar]
- The Cancer Genome Atlas Research Network. Comprehensive molecular characterization of gastric adenocarcinoma. Nature 2014, 513, 202–209. [Google Scholar] [CrossRef]
- Nowak, M.A.; Komarova, N.L.; Sengupta, A.; Jallepalli, P.V.; Shih Ie, M.; Vogelstein, B.; Lengauer, C. The role of chromosomal instability in tumor initiation. Proc. Natl. Acad. Sci. USA 2002, 99, 16226–16231. [Google Scholar] [CrossRef] [PubMed]
- Geigl, J.B.; Obenauf, A.C.; Schwarzbraun, T.; Speicher, M.R. Defining ‘chromosomal instability’. Trends Genet. 2008, 24, 64–69. [Google Scholar] [CrossRef]
- Maleki, S.S.; Rocken, C. Chromosomal Instability in Gastric Cancer Biology. Neoplasia 2017, 19, 412–420. [Google Scholar] [CrossRef] [PubMed]
- Mazurowski, M.A. Radiogenomics: What it is and why it is important. J. Am. Coll. Radiol. 2015, 12, 862–866. [Google Scholar] [CrossRef]
- Rutman, A.M.; Kuo, M.D. Radiogenomics: Creating a link between molecular diagnostics and diagnostic imaging. Eur. J. Radiol. 2009, 70, 232–241. [Google Scholar] [CrossRef] [PubMed]
- Yang, D.M.; Kim, H.C.; Jin, W.; Ryu, C.W.; Kang, J.H.; Park, C.H.; Kim, H.S.; Jung, D.H. 64 multidetector-row computed tomography for preoperative evaluation of gastric cancer: Histological correlation. J. Comput. Assist. Tomogr. 2007, 31, 98–103. [Google Scholar] [CrossRef] [PubMed]
- Amin, M.B.; Byrd, D.R.; Edge, S.B.; Greene, F.L. AJCC Cancer Staging Manual, 8th ed.; Springer International Publishing AG: Cham, Switzerland, 2016; pp. 203–220. [Google Scholar]
- Saragoni, L. Upgrading the definition of early gastric cancer: better staging means more appropriate treatment. Cancer Biol. Med. 2015, 12, 355–361. [Google Scholar] [CrossRef] [PubMed]
- Sohn, B.H.; Hwang, J.E.; Jang, H.J.; Lee, H.S.; Oh, S.C.; Shim, J.J.; Lee, K.W.; Kim, E.H.; Yim, S.Y.; Lee, S.H.; et al. Clinical Significance of Four Molecular Subtypes of Gastric Cancer Identified by The Cancer Genome Atlas Project. Clin. Cancer Res. 2017, 23, 4441–4449. [Google Scholar] [CrossRef] [PubMed]
- Li, C.; Oh, S.J.; Kim, S.; Hyung, W.J.; Yan, M.; Zhu, Z.G.; Noh, S.H. Macroscopic Borrmann type as a simple prognostic indicator in patients with advanced gastric cancer. Oncology 2009, 77, 197–204. [Google Scholar] [CrossRef] [PubMed]
- Kajitani, T. The general rules for the gastric cancer study in surgery and pathology. Part I. Clinical classification. Jpn. J. Surg. 1981, 11, 127–139. [Google Scholar] [CrossRef]
- Chen, Y.C.; Fang, W.L.; Wang, R.F.; Liu, C.A.; Yang, M.H.; Lo, S.S.; Wu, C.W.; Li, A.F.; Shyr, Y.M.; Huang, K.H. Clinicopathological Variation of Lauren Classification in Gastric Cancer. Pathol. Oncol. Res. 2016, 22, 197–202. [Google Scholar] [CrossRef]
- Zhou, Y.N.; Xu, C.P.; Han, B.; Li, M.; Qiao, L.; Fang, D.C.; Yang, J.M. Expression of E-cadherin and beta-catenin in gastric carcinoma and its correlation with the clinicopathological features and patient survival. World J. Gastroenterol. 2002, 8, 987–993. [Google Scholar] [CrossRef]
- Murphy, G.; Pfeiffer, R.; Camargo, M.C.; Rabkin, C.S. Meta-analysis shows that prevalence of Epstein-Barr virus-positive gastric cancer differs based on sex and anatomic location. Gastroenterology 2009, 137, 824–833. [Google Scholar] [CrossRef]
- Maeda, E.; Akahane, M.; Uozaki, H.; Kato, N.; Hayashi, N.; Fukayama, M.; Ohtomo, K. CT appearance of Epstein-Barr virus-associated gastric carcinoma. Abdom. Imaging 2009, 34, 618–625. [Google Scholar] [CrossRef] [PubMed]
- Tsurumaru, D.; Miyasaka, M.; Muraki, T.; Asayama, Y.; Nishie, A.; Oki, E.; Hirahashi, M.; Hida, T.; Honda, H. Diffuse-type gastric cancer: Specific enhancement pattern on multiphasic contrast-enhanced computed tomography. Jpn. J. Radiol. 2017, 35, 289–295. [Google Scholar] [CrossRef]
- Tsurumaru, D.; Miyasaka, M.; Muraki, T.; Nishie, A.; Asayama, Y.; Oki, E.; Oda, Y.; Honda, H. Histopathologic diversity of gastric cancers: Relationship between enhancement pattern on dynamic contrast-enhanced CT and histological type. Eur. J. Radiol. 2017, 97, 90–95. [Google Scholar] [CrossRef]
- Collins, F.S.; Varmus, H. A new initiative on precision medicine. N. Engl. J. Med. 2015, 372, 793–795. [Google Scholar] [CrossRef]
- Gerlinger, M.; Rowan, A.J.; Horswell, S.; Math, M.; Larkin, J.; Endesfelder, D.; Gronroos, E.; Martinez, P.; Matthews, N.; Stewart, A.; et al. Intratumor heterogeneity and branched evolution revealed by multiregion sequencing. N. Engl. J. Med. 2012, 366, 883–892. [Google Scholar] [CrossRef]
- Jaffe, C.C. Imaging and genomics: Is there a synergy? Radiology 2012, 264, 329–331. [Google Scholar] [CrossRef] [PubMed]
- Mazurowski, M.A.; Zhang, J.; Grimm, L.J.; Yoon, S.C.; Silber, J.I. Radiogenomic analysis of breast cancer: Luminal B molecular subtype is associated with enhancement dynamics at MR imaging. Radiology 2014, 273, 365–372. [Google Scholar] [CrossRef] [PubMed]
- Karlo, C.A.; Di Paolo, P.L.; Chaim, J.; Hakimi, A.A.; Ostrovnaya, I.; Russo, P.; Hricak, H.; Motzer, R.; Hsieh, J.J.; Akin, O. Radiogenomics of clear cell renal cell carcinoma: Associations between CT imaging features and mutations. Radiology 2014, 270, 464–471. [Google Scholar] [CrossRef]
- Vanderstichele, A.; Busschaert, P.; Smeets, D.; Landolfo, C.; Van Nieuwenhuysen, E.; Leunen, K.; Neven, P.; Amant, F.; Mahner, S.; Braicu, E.I.; et al. Chromosomal Instability in Cell-Free DNA as a Highly Specific Biomarker for Detection of Ovarian Cancer in Women with Adnexal Masses. Clin. Cancer Res. 2017, 23, 2223–2231. [Google Scholar] [CrossRef]
- Schutz, E.; Akbari, M.R.; Beck, J.; Urnovitz, H.; Zhang, W.W.; Bornemann-Kolatzki, K.; Mitchell, W.M.; Nam, R.K.; Narod, S.A. Chromosomal instability in cell-free DNA is a serum biomarker for prostate cancer. Clin. Chem. 2015, 61, 239–248. [Google Scholar] [CrossRef] [PubMed]
- Sai, S.; Ichikawa, D.; Tomita, H.; Ikoma, D.; Tani, N.; Ikoma, H.; Kikuchi, S.; Fujiwara, H.; Ueda, Y.; Otsuji, E. Quantification of plasma cell-free DNA in patients with gastric cancer. Anticancer Res. 2007, 27, 2747–2751. [Google Scholar] [CrossRef] [PubMed]
- Gonzalez, R.S.; Messing, S.; Tu, X.; McMahon, L.A.; Whitney-Miller, C.L. Immunohistochemistry as a surrogate for molecular subtyping of gastric adenocarcinoma. Hum. Pathol. 2016, 56, 16–21. [Google Scholar] [CrossRef] [PubMed]
- Carter, S.L.; Eklund, A.C.; Kohane, I.S.; Harris, L.N.; Szallasi, Z. A signature of chromosomal instability inferred from gene expression profiles predicts clinical outcome in multiple human cancers. Nat. Genet. 2006, 38, 1043–1048. [Google Scholar] [CrossRef] [PubMed]
- Birkbak, N.J.; Eklund, A.C.; Li, Q.; McClelland, S.E.; Endesfelder, D.; Tan, P.; Tan, I.B.; Richardson, A.L.; Szallasi, Z.; Swanton, C. Paradoxical relationship between chromosomal instability and survival outcome in cancer. Cancer Res. 2011, 71, 3447–3452. [Google Scholar] [CrossRef] [PubMed]
- Liu, S.; Shi, H.; Ji, C.; Guan, W.; Chen, L.; Sun, Y.; Tang, L.; Guan, Y.; Li, W.; Ge, Y.; et al. CT textural analysis of gastric cancer: Correlations with immunohistochemical biomarkers. Sci. Rep. 2018, 8, 11844. [Google Scholar] [CrossRef]
© 2019 by the authors. Licensee MDPI, Basel, Switzerland. This article is an open access article distributed under the terms and conditions of the Creative Commons Attribution (CC BY) license (http://creativecommons.org/licenses/by/4.0/).