Abstract
Marble is widely used in the field of construction and home decoration because of its high strength, high hardness and good wear resistance. Diamond wire sawing has been applied in marble cutting in industry due to its features such as low material loss, high cutting accuracy and low noise. The sawing surface quality directly affects the subsequent processing efficiency and economic benefit of marble products. The surface quality is affected by multiple parameters such as process parameters and workpiece sizes, making it difficult to accurately predict through traditional empirical equations or linear models. To improve prediction accuracy, this paper proposes a prediction model based on backpropagation (BP) neural network. Firstly, through the experiments of sawing marbles with the diamond wire saw, the datasets of surface roughness and waviness under different process parameters were obtained. Secondly, a BP neural network model was established, and the mixed-strategy-improved whale optimization algorithm (IWOA) was used to optimize the initial weight and threshold of the network, and established the IWOA-BP neural network model. Finally, the performance of the model was verified by comparison with the traditional models. The results showed that the IWOA-BP neural network model demonstrated the optimal prediction performance in both the surface roughness Ra and waviness Wa. The minimum predicted values of the root mean square error (RMSE), mean absolute error (MAE), and mean absolute percentage error (MAPE) were 0.0342%, 0.0284% and 1.5614%, respectively, which proved that the model had higher prediction accuracy. This study provides experimental basis and technical support for the prediction of the surface quality of marble material cut by diamond wire saw.
1. Introduction
As an important natural decorative material, marble is widely used in the field of architectural decoration, such as indoor and outdoor decoration, floor pavement, etc., because of its unique texture, rich colors, high compressive strength and good processability [1,2]. With the development of the high-end trend of marble decoration, the processing quality and cost are strictly controlled, which poses severe challenges to the processing technology [3].
The production process of marble slabs covers many procedures such as mining, cutting, grinding and polishing. The cutting process is particularly critical, because it directly determines the feasibility and cost of subsequent processing [4]. Traditional marble cutting methods such as circular sawing and frame sawing have many problems such as low processing accuracy, environmental pollution, high energy consumption and serious material waste [5,6,7,8]. Diamond wire sawing technology is gradually replacing the traditional processing methods and becoming an advanced method for cutting marbles due to its advantages such as low material loss, high processing accuracy, less dust and low energy consumption [9]. Diamond wire sawing uses wires with diamond abrasive grains consolidated on their surfaces as cutting tools. And the driving wheels drive the wire to make high-speed reciprocating or unidirectional movement, while the workpiece is fed toward the diamond saw wire at a certain speed through the feed system. Diamond-abrasive particles come into contact with the material and remove it through extrusion and scratching [10].
As a typical hard and brittle material, marble has high hardness, low plasticity and weak impact resistance, and it is prone to brittle failure. It often leads to poor surface quality during the cutting process. Therefore, in the research of cutting marble, relevant scholars still focus on the surface quality of marble slices. Yan et al. [11] conducted theoretical analysis and experimental research on different cutting forces and processing parameters during the milling of natural marble, established mathematical models and empirical equations, and analyzed the influences on material removal efficiency and surface quality. Yin et al. [12] conducted a white marble milling experiment using the Box–Behnken design method of the response surface method (RSM), established a multiple nonlinear regression model, and analyzed the influence of various processing parameters on the processing quality of white marble. Pham et al. [13] studied the influence of cutting parameters on the surface roughness of marble processed by diamond saw blade. They conducted a regression analysis using experiments and an analysis of variance. The results indicated that the cutting parameters had a significant impact on surface roughness. Dong et al. [14] studied the sawing performance and blade instability of diamond frame saw in granite processing through sawing experiments. The research found that long contact arcs and continuous long thin chips would lead to the instability of the saw blade, thereby reducing the slice flatness. Liu et al. [15] studied the influence of parameters such as wire speed on the surface quality of marble when a circular electroplated diamond wire saw was used to cut marble through orthogonal experiments, and optimized the process parameters. In summary, the surface quality of marble slices is influenced by various parameters such as process parameters and workpiece size parameters, which makes it difficult to accurately predict the surface quality through traditional empirical equations or linear models. In the actual production, it is necessary to adjust the process parameters through repeated trial cutting, which makes it hard to ensure the stability of processing quality [16,17]. Moreover, there are currently few studies on the surface quality prediction of marble cut by diamond wire saws. Therefore, establishing a model that can accurately predict the surface quality of marble cut by diamond wire saws is of great significance and practical application value for achieving the optimal configuration of processing parameters, improving production efficiency, reducing costs and ensuring product quality.
In recent years, a variety of innovative methods have been developed for predicting the surface quality of machining. For example, Eaysin et al. [18] applied models such as support vector regression (SVR) and gradient boosting regression tree (GBRT) to predict the removal rate and surface roughness of W70Cu30 material. Guo et al. [19] integrated a convolutional neural network (CNN) and multi-head self-attention (MHA) model and proposed a surface roughness prediction method based on a hybrid neural network. Huang et al. [20] developed a combined prediction system for two materials based on artificial neural networks (ANNs). Liu et al. [21] established a surface roughness prediction model with strong generalization ability by using a backpropagation (BP) neural network optimized by genetic algorithm (GA-BP). Research has found that many scholars have conducted extensive work in the field of surface prediction, and prediction methods have evolved from traditional empirical formulas and linear regression methods to data-driven nonlinear model methods.
In particular, a BP neural network has been widely used in the field of industrial prediction due to its powerful self-learning and adaptability [22,23]. A BP neural network induces implicit rules in data through self-training and adjustment, and can capture the complex correspondence between the input and output. However, the BP neural network also has some limitations, such as weak global search ability and being prone to getting stuck in local extremums, resulting in insufficient prediction accuracy [24,25]. To solve these problems, researchers proposed to use intelligent optimization algorithms to optimize BP neural networks to improve global optimization capabilities and prediction accuracy [26]. The whale optimization algorithm (WOA), as a novel swarm intelligence optimization method, simulates the hunting behavior of humpback whales and demonstrates strong search potential. It has been applied in multiple fields such as neural network training and engineering optimization [27,28]. However, when dealing with complex optimization problems, WOA has some limitations such as lagging convergence speed and insufficient local extremum escape capability. In recent years, researchers have significantly improved the performance of WOA by improving the spiral update position model, introducing elite reverse learning strategies, chaotic mapping and other methods [29,30,31]. For example, An et al. [32] introduced particle swarm optimization (PSO) to optimize a BP neural network and predict the cutting quality of silicon wafers. The results showed that the possibility of getting stuck in local minimum was significantly reduced. Wu et al. [33] proposed an improved whale optimization algorithm (IMWOA), which significantly enhanced the convergence accuracy and speed of the algorithm by optimizing the spiral update position model and combining multiple strategies, as well as its stability and ability to solve ultra-large-scale optimization problems. The improved whale optimization algorithm (TIWOA) proposed by Huang [34] significantly improved the global search ability and convergence speed of the algorithm by optimizing initialization strategy and introducing mutation operator and other improvement measures. Ji et al. [35] proposed a prediction model based on the improved whale optimization algorithm (CIWOA) combined with a BP neural network, which significantly enhanced the prediction accuracy and stability. These studies show that the improved whale optimization algorithm can more effectively optimize the parameters of the BP network and enhance its prediction performance.
In this paper, Ra and Wa were taken as the surface quality parameters of the slices. Through single-factor experiments, orthogonal experiments and response surface experiments of cutting marble with diamond wire saw, surface quality datasets under different process parameters were obtained. The whale optimization algorithm (IWOA) improved by the hybrid strategy was adopted to optimize the BP neural network model, and the improved IWOA-BP neural network model was established. The performance of the model was verified by comparing it with the traditional models. The research results provide more reliable theoretical support and technical reference for the intelligent optimization of the cutting process parameters of diamond wire saw, and offer important practical guidance and reference value for actual processing.
2. Materials and Methods
2.1. Experimental Materials
The experiments took marble as the research object. Its main chemical component is calcium magnesium carbonate (CaMg(CO3)2), and the mineral composition is mainly dolomite, with a small amount of mica and trace amounts of quartz and argillaceous impurities, as shown in Figure 1.
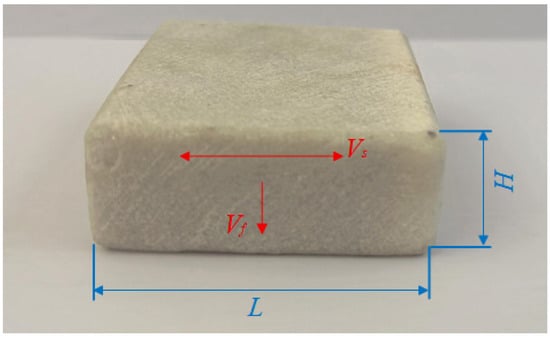
Figure 1.
Experimental marble sample.
The experimental process is shown in Figure 2. Firstly, the diamond wire sawing machine (SH300, Guangzhou Shenghai Electronic Technology Co., Ltd., Guangzhou, China) was used to cut the marble workpiece, and the experimental parameters are shown in Table 1. After ultrasonic cleaning, the surface morphology of the slices was observed using the VK-X200K laser confocal microscope (Keyence Corporation, Osaka, Japan), and quality indicators such as Ra and Wa were obtained. After the completion of data collection, combined with the sawing process parameters and the collected surface quality data, the neural network prediction model was established by using data analysis and modeling methods to achieve the accurate prediction of marble cutting surface quality. The cutting principle of the experiment is shown in Figure 3b. The workpiece was fixed on the loading platform. After the machine started, the wire saw moved back and forth at the wire speed Vs. at the same time, the loading platform drove the workpiece to move at a constant feed speed Vf to complete the sawing. The installation of the marble sample in the sawing experiment is shown in Figure 3c,d.
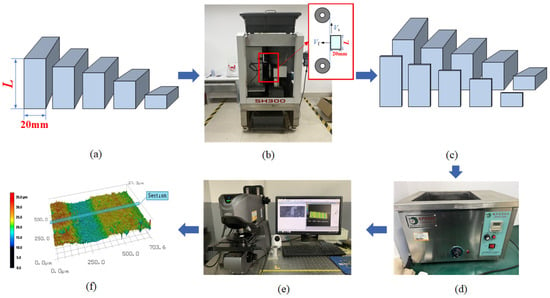
Figure 2.
Experimental process diagram. (a) Marble workpieces for experiment; (b) wire sawing; (c) marble slices; (d) ultrasonic cleaning; (e) observation by laser confocal microscopy; (f) data processing.

Table 1.
Parameters of the wire sawing and workpiece.
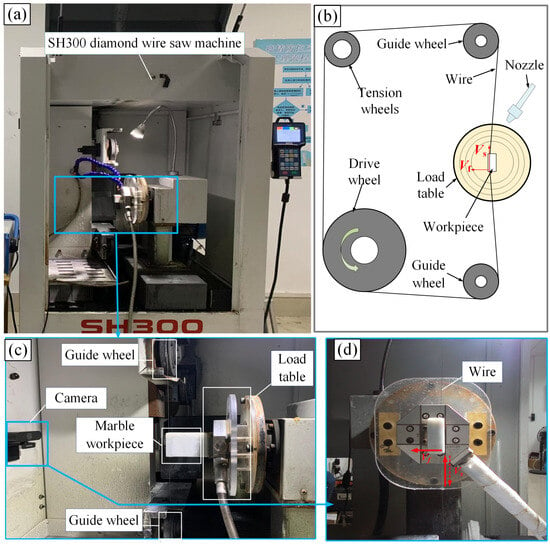
Figure 3.
Experimental setup diagram. (a) Wire sawing equipment diagram; (b) wire sawing principle diagram; (c) main view of processing; (d) left view of processing.
2.2. Experimental Methods
To establish an effective prediction model, this study collected data by designing sawing experiments. The experimental design included single factor experiments, orthogonal experiments and response surface experiments. The experiment results together formed the dataset for model training and testing. Previous research indicated that the feed speed Vf and wire speed Vs of diamond wire saw had a significant impact on the surface Ra of the sawn surface [36,37,38,39]. In addition, the variation in the length L of the sawing would affect the cooling, lubrication and chips removal during the sawing, and influence the quality of the sawed surface [40,41]. Therefore, in this paper, the feed speed Vf, wire speed Vs, and sawing length L were selected as three experimental factors for experimental design. After the slicing was completed, each group of slices was cleaned and observed. Five positions were randomly selected in the central area of each slice to measure the Ra and Wa, and the average value was taken as the characterization index.
The single factor experiments can reflect the influence of a single sawing factor on the surface quality of marble. Each experimental parameter factor selected for the experiment was set at five levels. A total of 13 parameter combinations were selected after removing duplicates, as shown in numbers 1 to 13 in Table 2.

Table 2.
Parameter combinations.
The orthogonal experiment also set five levels for each factor, forming a set of three-factor and five-level orthogonal experiments. After removing the duplicates, a total of 24 parameter combinations were selected, as shown in numbers 14 to 37 in Table 2.
The response surface experiments were designed based on the Box-Behnken design (BBD) response surface experiment, with each factor set at low, medium, and high levels respectively. This level setting not only comprehensively covered the influence range of each factor on Ra and Wa, but also fully reflected the interaction among the factors. Based on the above level settings and the characteristics of the BBD design, 10 parameter combinations were selected. Each combination contained the interaction of three levels, as shown in numbers 38 to 47 in Table 2. Table 2 summarizes all the parameter combinations of the sawing experiments; the repetitive parameter combinations in the three experimental designs were removed.
2.3. Evaluation Method of Slices Surface Quality
As shown in Figure 4, after obtaining the three-dimensional surface topography images of the slices using the laser confocal microscope, detailed measurements and analyses were conducted on the Ra and Wa. Figure 4a–c, respectively, presents the cross-sectional contour curve, waviness curve, and roughness curve. The calculation equation of the waviness profile arithmetic mean deviation is as follows [41]:
where lw is the sampling length of waviness, and Z(x) is the distance between the point on the waviness contour and the centerline of waviness.
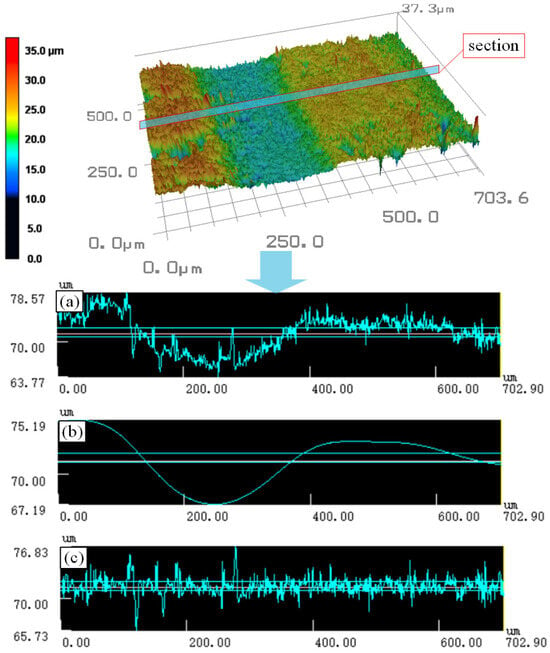
Figure 4.
Three-dimensional topography of the slice surface and the data measurement diagram. (a) Cross-sectional contour curve; (b) waviness curve; (c) roughness curve.
2.4. Experimental Results
The experimental data were sorted out, as shown in Table 3. This dataset covered all the sawing parameter combinations designed in this study and their corresponding Ra and Wa values, which were used for the training and prediction of neural networks.

Table 3.
Experimental data.
3. Surface Quality Prediction Model of Diamond Wire Sawing Marble Based on the IWOA-BP Neural Network
3.1. The Structure and Parameter Selection of a BP Neural Network
A BP neural network is a multi-layer feedforward neural network based on the error backpropagation algorithm, consisting of an input layer, a hidden layer and an output layer. Information is passed layer by layer from the input layer to the output layer, and the prediction results are generated through weight connection and activation function processing. The network optimizes performance by calculating the output error and backpropagating the weights and thresholds [42]. Hornik et al. [43] discovered that by choosing the appropriate activation function and the number of hidden layer nodes, a three-layer neural network can approximate any function. Therefore, this paper adopted a three-layer neural network structure to establish a prediction model, and the network structure is shown in Figure 5.
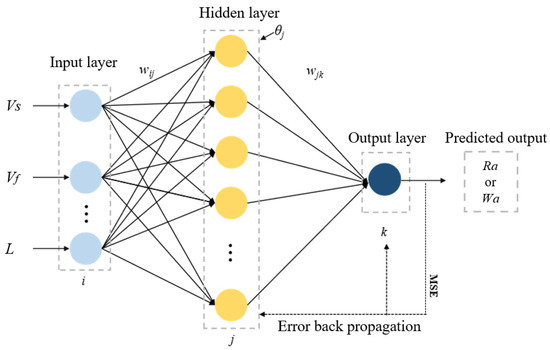
Figure 5.
Structure diagram of the three-layer BP neural network.
After determining the structure of the BP neural network, the parameters of the neural network were set. Through the previous analysis, the influencing factors of the surface quality of marble slices cut by diamond wire saw included the feed speed, wire speed and sawing length. Therefore, the number of input layer nodes was set to 3. The number of output layer nodes was set to 1, and the Ra and Wa were separately trained and predicted. According to the empirical Equation (2), it could be determined that the selection range of the number of nodes was [3,12]. This paper determined and selected the best number of hidden layer nodes by calculating RMSE value of the model corresponding to different hidden layer nodes, and applied it to the subsequent training and prediction.
where m, h and n are the number of nodes in the input layer, hidden layer and output layer, respectively. It is a regulating constant and the value range is between 1 and 10.
Activation function is the output function of neurons, which enables neural networks to learn and fit complex function relationships. Sigmoid function has smooth gradient and good derivative properties, so it was used as the activation function of the hidden layer. In this paper, the learning rate was selected as 0.01, the error objective function of the model was the mean square error (MSE), the training target accuracy was set as 0.00001, and the maximum training times was set as 1000 times.
3.2. Whale Optimization Algorithm Improved by Hybrid Strategy
Although WOA has a strong optimization ability, it constantly changes the position of the population leader in the search space, which can easily lead to premature convergence of the algorithm when it gets stuck in the local optimal solution, thereby affecting the global optimization performance [44]. To enhance the optimization capability of WOA, the following improvements were made to WOA in this section:
- (1).
- Population initialization based on sine chaotic mapping and quasi-reverse learning strategy:
WOA initializes the population individuals using a random method, which may lead to an uneven initial distribution of the population and thereby affect the optimization accuracy. To solve this problem, this paper introduced sine chaotic initialization and quasi-inverse learning initialization. These two methods could generate initial feasible solutions with good diversity, and their equation is as follows:
where xn is the n-th chaotic number and n is the number of iterations in sine chaotic map. β is a randomly selected constant. In this paper, β is selected as 4.
To further improve the quality of the initial population, a quasi-reverse learning strategy was added on the basis of the sine chaotic mapping to enhance the distribution uniformity and exploration ability of the population. Suppose the size of the whale population is N and the search space is q-dimensional, then the position of the i-th whale could be expressed as (, , , ⋯, ) (i = 1, 2, ⋯, N), where the value of each position coordinate (j = 1, 2, ⋯, q) is between [, ], and represent the lower and upper bounds of respectively. The mathematical equations of quasi-inverse solution are as follows:
- (2).
- Nonlinear convergence factor improvement strategy:
In original WOA, it is assumed that the optimal individual in the current population represents the prey, and other whale individuals in the population then surround the position of the optimal individual to update their own positions. This position update process is achieved through Equations (6) and (7):
where D represents the distance between the current individual and the optimal solution. t represents the number of iterations. A and C are coefficient vectors. X*(t) is the optimal position vector of the population when iterating to the t-th generation. X(t) is the position vector of the current population.
In the process of optimization, WOA will face the problem of imbalance between global search ability and local development ability [28]. In WOA, the parameter |A| determines the switch between global search and local development. When |A| ≥ 1, the algorithm will perform random global search; when |A| < 1, the algorithm will develop locally. The trend of the system variable A is affected by the linear convergence factor a. In this paper, an improved nonlinear convergence factor was proposed, and its calculation equation is as follows:
where Max_iter is the maximum number of iterations. Based on the improved nonlinear convergence factor, the update equation of the system variable A becomes
The equation for the coefficient vector C is as follows:
where r1 and r2 are random numbers within the range of [0, 1].
The changing trend of system variable A with the number of iterations before and after improvement is shown in Figure 6. The time when the improved system variable A enters the interval [−1, 1] is earlier than that of the unimproved A, and the rate of decline in the later stage is slower. This indicates that the improved A has a strong global search ability in the early stage, more stable local development in the later stage, it can better balance the global and local aspects.
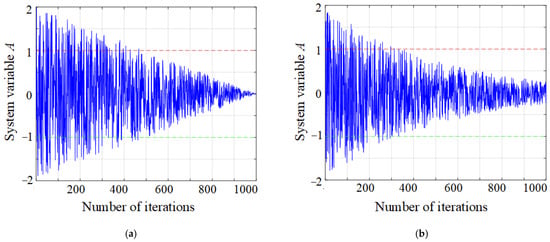
Figure 6.
Comparison of system variable A before and after improvement. (a) Before improvement; (b) after improvement.
- (3).
- Adaptive weighting strategy:
WOA did not have the function of adjusting weights through updating equations during later partial development. With the deepening of the search, individual whales may wander around the theoretical position, or even fall into local extremum. Therefore, this paper used the concept of inertia weight in particle swarm optimization algorithm for reference, and applies the adaptive weight w to WOA to optimize the search process. The calculation equation is as follows:
where wmin = 0.4 and wmax = 0.9, and the values refer to the common parameter settings in particle swarm optimization algorithm.
Therefore, the position update strategy of the algorithm is adjusted as follows:
where b represents a constant in the spiral motion equation of the whale herd. It is a constant and is usually set to 1. l is a random number with the range [−1, 1]. p is a random number within the range [0, 1]. In this paper, p was selected as 0.5, which can not only maintain the global search ability but also avoid falling into local optimum too early [29].
- (4).
- Improved spiral position update strategy:
The original WOA algorithm uses the logarithmic spiral to update the position model in the hunting stage, which is easy to make the population gather. Therefore, this paper replaced the logarithmic spiral in the original equation with the archimedian spiral, and the polar image comparison is shown in Figure 7. It can be seen that the archimedian spiral can effectively reduce the step interval of individual whales, expand the search range, and avoid algorithm premature convergence. Combined with the adaptive weight strategy, the new spiral position update model is shown in Equation (14).
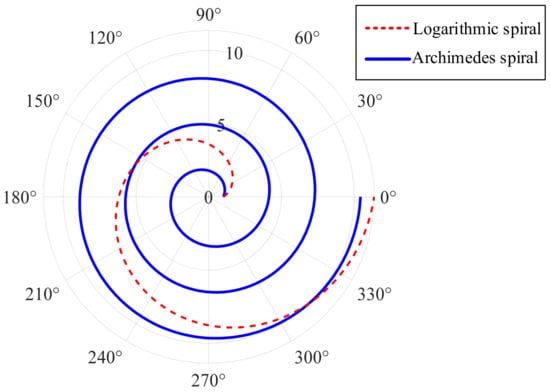
Figure 7.
Comparison of the polar coordinate diagrams of the logarithmic spiral and the archimedian spiral.
- (5).
- Random differential mutation strategy:
Using the idea of differential evolution algorithm for reference, the current whale individual, the optimal individual and other randomly selected individuals are used for differential calculation. After each iteration, the population is disturbed to generate new individuals, so as to enhance the diversity of the population and avoid search stagnation. The mathematical equation is as follows:
where ρ1 and ρ2 are random numbers within the range [0,1], and X’(t) is the individual whale randomly selected from the population.
Combining the above five hybrid strategies to improve WOA, the improved algorithm is called IWOA (improved whale optimization algorithm), and its flowchart is shown in Figure 8.
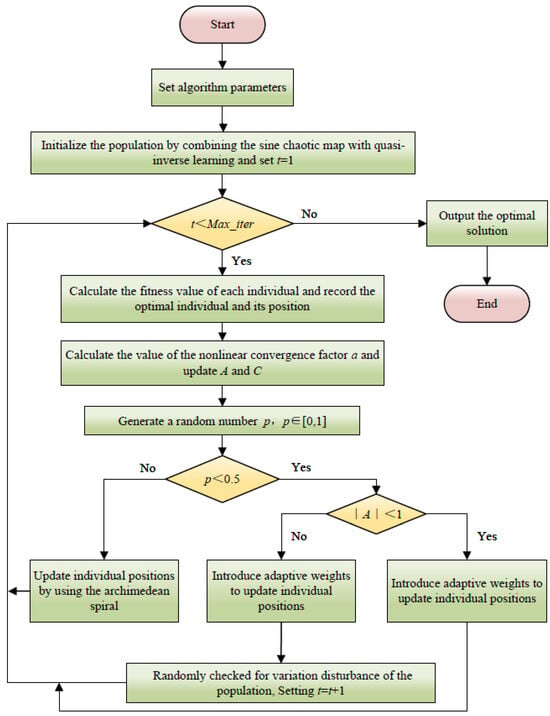
Figure 8.
Flowchart of the IWOA algorithm.
3.3. Algorithm Performance Testing and Result Analysis
- (1).
- Parameter settings and test function sets:
To verify the superiority of IWOA performance, this paper conducted performance comparison tests with algorithms include PSO, GWO (Grey Wolf Optimizer), WOA, TIWOA and IMWOA. In the experiment, all algorithms adopted the same general condition settings, with a population size of 30 and a maximum number of iterations of 1000. This paper selected six commonly used test functions [29] for testing. The specific functions are shown in Table 4.

Table 4.
Test functions.
- (2).
- Comparative analysis of algorithm convergence curves:
The algorithm convergence curves of the six test functions are shown in Figure 9, where the horizontal axis represents the number of iterations and the vertical axis represents the fitness objective function value. The smaller the value, the better the optimization performance of the algorithm. It can be seen from the results that IWOA demonstrated significant advantages on almost all test functions and was clearly superior to other algorithms. IWOA could quickly obtain a relatively low fitness value in the early stage of iteration and continuously optimize it in subsequent iterations, eventually convergent to a better objective function value. It indicates that IWOA has a superior convergence speed and global search ability compared to other algorithms.
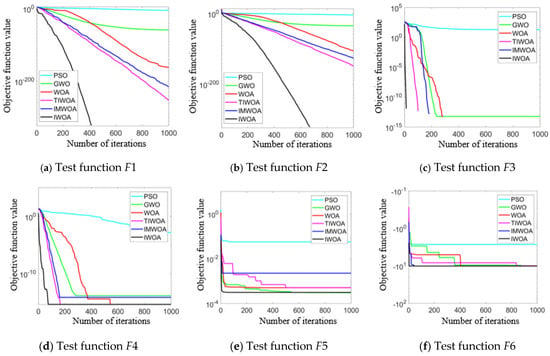
Figure 9.
Algorithm convergence curve.
- (3).
- Comparison of test results of each algorithm:
To avoid deviations in a single result, 30 independent simulation tests were conducted for each test function to obtain the best value (Best), standard value (Std), and average value (Avg) of the objective function. The Best, Std and Avg, respectively, reflect the best performance, stability and average performance of the algorithm in multiple runs. In this section, all the test functions are minimization problems. Therefore, the smaller the values of these indicators, the better the performance of the algorithm. The optimization results of the six different algorithms are shown in Table 5. The numbers marked in black bold in the table are the best results. The analysis of the data show that among the six groups of test functions, all the indicators calculated by IWOA are superior to those of the other algorithms. Especially in the F1 and F3 test functions, the IWOA have reached the theoretical optimal solutions of the test functions, which fully demonstrates that IWOA has higher convergence accuracy and stronger robustness.

Table 5.
The comparison results of each algorithm on the test functions.
3.4. The IWOA Algorithm Optimizes BP Neural Networks
Although a BP neural network has strong fitting ability, it is easy to getting stuck in local extremum and has weak global search ability [44]. The improved whale optimization algorithm (IWOA) has a powerful global search capability, which can effectively avoid local optima and quickly converge to the global optimal solution. Therefore, combining IWOA with a BP neural network and using IWOA to optimize the initial weights and thresholds of the BP neural network can enhance the prediction accuracy and generalization ability of the model. This combined model is called the IWOA-BP neural network model, and its flowchart is shown in Figure 10.
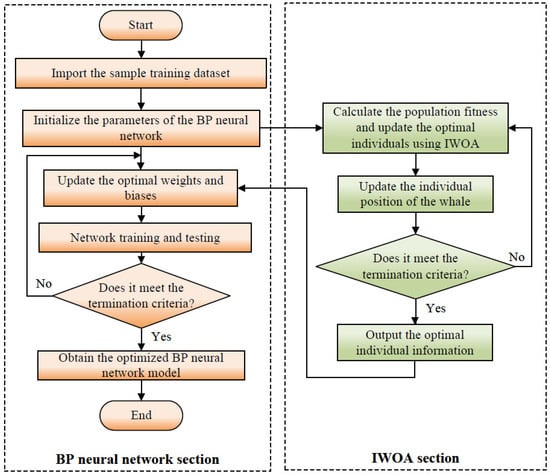
Figure 10.
Flowchart of the IWOA-BP algorithm.
3.5. Comparison of Neural Network Prediction Effects
To verify the prediction accuracy of the IWOA-BP neural network model, this paper conducted a comparative analysis with the traditional BP neural network, included the WOA-BP, TIWOA, TIWOA-BP and IMWOA-BP neural networks. The fitness function of neural networks is the root mean square error. Based on the dataset organized in Table 3, 10 groups were randomly selected as the test set, and the remaining 37 groups of data are used as the training set. The numbers marked with “a” in Table 3 represent the test set data of the model. The training and testing of these five neural network models were completed. The gap between the predicted values and the true values on the test set was compared, and the prediction errors were calculated to evaluate the prediction accuracy of each model.
Taking the Wa as an example, the neural network model had three nodes in the input layer and one node in the output layer. In the training process, RMSE corresponding to the number of nodes in different hidden layers was compared after multiple training, and the optimal number of nodes in hidden layers was selected. As shown in Table 6, when the number of hidden layer nodes is 6, RMSE is the smallest (0.0342), so 6 was selected as the optimal number of hidden layer nodes. In addition, the effect of the model was evaluated by correlation analysis. As shown in Figure 11, the correlation coefficient R of the training set, test set and total set were all greater than 0.99, indicating that the model had a high fitting degree and ideal training effect. The neural network model was saved for subsequent prediction. The establishment process of the neural network prediction model of Wa was the same as that of Ra.

Table 6.
Determination of the number of hidden layer nodes.
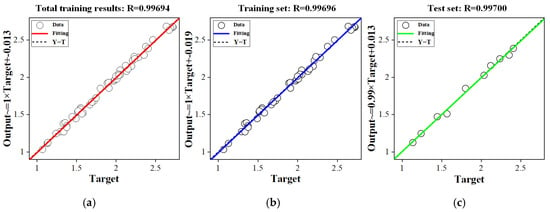
Figure 11.
Training results of neural network model. (a) Total training results; (b) training set results; (c) test set results.
BP, WOA-BP, IMWOA-BP, TIWOA-BP and IWOA-BP neural networks were used to train and predict the experimental data of Ra and Wa, and the prediction results were compared and analyzed. Table 7 and Table 8 show the prediction results of these five models. To present the differences among various models more intuitively, the columnar comparison diagrams of the prediction absolute errors of Ra and Wa by different neural network models are drawn, as shown in Figure 12 and Figure 13. It can be seen that the predicted values of the IWOA-BP model were the closest to the true values, and absolute prediction errors were significantly lower than that of other models. This indicates that the IWOA-BP model performs well in the prediction of surface Ra and Wa of marble cut by diamond wire saw in this paper, and has higher accuracy.

Table 7.
Prediction results of Ra by different neural network models.

Table 8.
Prediction results of Wa by different neural network models.
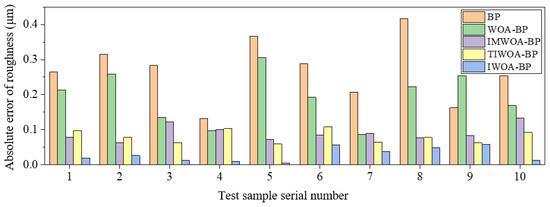
Figure 12.
Comparison of absolute errors in Ra prediction by different neural network models.
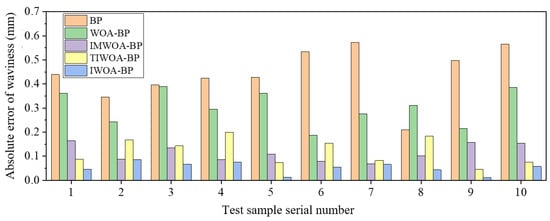
Figure 13.
Comparison of absolute errors in the prediction of Wa by different neural network models.
To comprehensively evaluate the regression prediction performance of the optimized neural network model, this paper adopted three commonly used prediction performance evaluation indicators: RMSE, MAE and MAPE. These three indicators could reflect the accuracy of the model’s prediction results from different perspectives, avoiding the limitations brought by a single indicator.
The test results are shown in Table 9. The Ra prediction results showed that the RMSE, MAE and MAPE values of the IWOA-BP neural network model were 0.0342, 0.0284 and 1.5614%, respectively, all of which were lower than the corresponding error values of the other four models. The Wa prediction results showed that the RMSE, MAE and MAPE of the IWOA-BP neural network model were 0.0570, 0.0520 and 1.7028%, respectively, which were also lower than the corresponding error values of the other four models. This indicated that the IWOA-BP neural network model demonstrated the optimal prediction performance in both Ra and Wa predictions.

Table 9.
Evaluation indicators of the prediction performance of different neural network models.
4. Conclusions
This paper established an IWOA-BP neural network model for predicting the surface quality of marble cut by diamond wire saw based on the BP neural network model optimized by the IWOA. Through single factor experiments, orthogonal experiments and response surface experiments, the datasets of Ra and Wa under different sawing parameters were collected systematically. The results were used for model training and testing. Finally, the performance of various models was compared. The research reached the following conclusions:
- (1).
- Through multiple trainings on Ra, the RMSE corresponding to different numbers of hidden layer nodes was compared. When the number of hidden layer nodes is 6, the RMSE is the smallest (0.0342). The correlation coefficients of the training set, test set, and total set were all greater than 0.99, indicating that the model had a high degree of fitting and an ideal training result.
- (2).
- The comparison of the prediction results showed that the Ra prediction error (RMSE = 0.0342, MAE = 0.0284, MAPE = 1.5614%) and Wa prediction error (RMSE = 0.0570, MAE = 0.0520, MAPE = 1.7028%) of the IWOA-BP neural network were all lower than those of the traditional BP, WOA-BP and IMWOA-BP and IMWOA-BP neural network models.
The results show that the IWOA-BP neural network model has certain advantages in predicting the surface quality of marble cut by diamond wire saw. The research results not only enrich the prediction method of cutting surface quality of hard and brittle materials, but also provide a theoretical basis and practical reference for the surface quality control of diamond wire sawing.
Author Contributions
H.D.: investigate, data curation, writing—original draft preparation. F.C.: investigate, data curation, methodology, writing—original draft preparation. Z.H.: conceptualization. Y.G.: conceptualization, writing—review and editing, project administration, funding acquisition. All authors have read and agreed to the published version of the manuscript.
Funding
This research was funded by the Natural Science Foundation of Shandong Province (no. ZR2023ME145).
Data Availability Statement
The original contributions presented in this study are included in the article. Further inquiries can be directed to the corresponding author.
Conflicts of Interest
The authors declare no conflicts of interest.
Abbreviations
The following abbreviations are used in this manuscript:
| BP | Backpropagation |
| BBD | Box–Behnken design |
| WOA | Whale optimization algorithm |
| IWOA | Improved whale optimization algorithm |
| TIWOA | Threshold improved whale optimization algorithm |
| IMWOA | Improved multi-objective whale optimization algorithm |
| CIWOA | Chaotic improved whale optimization algorithm |
| WOA-BP | Whale optimization algorithm backpropagation |
| IWOA-BP | Improved whale optimization algorithm backpropagation |
| TIWOA-BP | Threshold improved whale optimization algorithm backpropagation |
| IMWOA-BP | Improved multi-objective whale optimization algorithm backpropagation |
| RMSE | Root mean square error |
| MSE | Mean square error |
| MAE | Mean absolute error |
| MAPE | Mean absolute percentage error |
References
- Gencel, O.; Nodehi, M.; Yavuz Bayraktar, O.; Kaplan, G.; Benli, A.; Koksal, F.; Bilir, T.; Siddique, R.; Ozbakkaloglu, T. The use of waste marble for cleaner production of structural concrete: A comprehensive experimental study. Constr. Build. Mater. 2022, 361, 129612. [Google Scholar] [CrossRef]
- Oweh, S.O.; Aigba, P.A.; Samuel, O.D.; Oyekale, J.; Abam, F.I.; Veza, I.; Enweremadu, C.C.; Der, O.; Ercetin, A.; Sener, R. Improving productivity at a marble processing plant through energy and exergy analysis. Sustainability 2024, 16, 361. [Google Scholar] [CrossRef]
- Özkaynak, U.; Ercan, S.; Ispir, F.B.; Gençoghu, M.T.; Tanyildizi, E. Artificial intelligence-based marble block analysis system for sustainable green transformation. In Proceedings of the 2024 32nd Signal Processing and Communications Applications Conference (SIU), Mersin, Turkiye, 15–18 May 2024; pp. 1–4. [Google Scholar]
- Samarakoon, K.G.A.U.; Chaminda, S.P.; Jayawardena, C.L.; Dassanayake, A.B.N.; Kondage, Y.S.; Kannangara, K.A.T.T. A review of dimension stone extraction methods. Mining 2023, 3, 516–531. [Google Scholar] [CrossRef]
- Fazio, J.C.; Viragh, K.; Houlroyd, J.; Gandhi, S.A. A review of silicosis and other silica-related diseases in the engineered stone countertop processing industry. J. Occup. Med. Toxicol. 2025, 20, 004558. [Google Scholar] [CrossRef] [PubMed]
- Sodha, D.S.; Mali, H.S.; Singh, A.K. An AHP and BEES model-based sustainability assessment of small-scale marble processing industries: Indian prospects. Min. Technol. 2025, 134, 30–50. [Google Scholar] [CrossRef]
- Hussain, S.; Ahmad, I.; Khan, F.A.; Ahmad, W.; Khan, B.J. Effects of marble waste on shear strength and pullout resistance of sand reinforced with Glass Fiber-Reinforced Polymer (GFRP) bars. Case Stud. Constr. Mat. 2025, 22, e04244. [Google Scholar] [CrossRef]
- Salehi, E.; Faramarzi, L.; Mirsayar, M. Mixed-mode fracture behavior of a marble exposed to acidic environments. Rock Mech. Rock Eng. 2025, 58, 3955–3972. [Google Scholar] [CrossRef]
- Konstanty, J.S. The mechanics of sawing granite with diamond wire. Int. J. Adv. Manuf. Tech. 2021, 116, 2591–2597. [Google Scholar] [CrossRef]
- Wu, S.J. Research progress of wire saw machining technology. Integr. Ferroelectr. 2022, 228, 202–219. [Google Scholar] [CrossRef]
- Yan, G.Y.; Wu, Y.H.; Wang, H.; Zhao, D.H.; Lu, F. Research on mathematical model and cutting characteristics in machining of natural marble by diamond coated tool. Mechanika 2019, 25, 165–171. [Google Scholar] [CrossRef]
- Yin, F.C.; Zhang, H.Y. Contouring error prediction and optimization of stone relief for robotic milling. Sci. Iran. 2024, 31, 1431–1449. [Google Scholar] [CrossRef]
- Pham, Q.; Thuat, M.; Phuoc, T.N. Effects of cutting parameters on surface roughness of machining marble with diamond disc. Tra Vinh Univ. J. Sci. 2024, 14, 111. [Google Scholar]
- Dong, P.Y.; Zhang, J.S.; Wu, J.J.; Wang, J.K. Performance investigation of traditional diamond frame saw in processing granite. Int. J. Refract. Met. Hard Mater. 2021, 99, 105601. [Google Scholar] [CrossRef]
- Liu, Y.; Wang, J.B.; Chen, C. Experimental study on cutting marble with circular diamond wire saw. Superhard Mater. Eng. 2011, 23, 1–4. [Google Scholar]
- Jain, S.C.; Rathore, S.S. Role of cut size area on the performance of diamond wire saw machine in quarrying of marble. Int. J. Min. Reclam. Environ. 2009, 23, 79–91. [Google Scholar] [CrossRef]
- Wang, S.S.; Zhang, Q.; Luo, H.; Lin, Z.N. Experimental and constitutive modeling investigations on marble in Jinping Underground Laboratory. Deep Undergr. Sci. Eng. 2025, 2, 12149. [Google Scholar] [CrossRef]
- Eaysin, A.; Zinnah, M.A.; Nayem, M.; Begum, H.A.; Protyai, M.I.H.; Ashrafi, S.; Bin Rashid, A. Prediction and optimization of surface quality and material removal rate in wire-EDM cutting of tungsten-copper alloy (W70Cu30). Results Surf. Interfaces 2025, 18, 100409. [Google Scholar] [CrossRef]
- Guo, M.X.; Wei, S.H.; Han, C.T.; Guo, W.C.; Huang, Z.W. Prediction of surface roughness based on multi-input CNN-MHA in milling. Int. J. Adv. Manuf. Tech. 2025, 25, 4559–4574. [Google Scholar] [CrossRef]
- Huang, P.B.; Inderawati, M.M.W.; Rohmat, R.; Sukwadi, R. The development of an ANN surface roughness prediction system of multiple materials in CNC turning. Int. J. Adv. Manuf. Tech. 2023, 125, 1193–1211. [Google Scholar] [CrossRef]
- Liu, G.S.; Xia, K.Y.; Li, Z.W.; Chen, Y.L. Prediction of surface roughness in single-point diamond turning by combining machine tool internal signals and deep learning method. Precis. Eng. 2025, 94, 113–129. [Google Scholar] [CrossRef]
- Liu, P.F.; Liu, P.Y. Study on the abrasive belt grinding removal mechanism and surface roughness prediction of DD6 single crystal superalloy. Int. J. Adv. Manuf. Tech. 2025, 139, 175–195. [Google Scholar] [CrossRef]
- Yang, H.G.; Zheng, H.; Zhang, T.H. A review of artificial intelligent methods for machined surface roughness prediction. Tribol. Int. 2024, 199, 109935. [Google Scholar] [CrossRef]
- Zhou, W.; Kang, M.; Guo, H.Y. Development of a surface roughness prediction model for slow tool servo turning machining. Manuf. Technol. 2022, 22, 111–122. [Google Scholar] [CrossRef]
- Rumelhart, D.E.; Hinton, G.E.; Williams, R.J. Learning representations by Back-Propagating errors. Nature 1986, 323, 533–536. [Google Scholar] [CrossRef]
- Cheng, Y.N.; Jin, Y.B.; Gai, X.Y.; Guan, R.; Lu, M.D. Prediction of tool wear in milling process based on BP neural network optimized by firefly algorithm. Proc. Inst. Mech. Eng. Part E J. Process Mech. Eng. 2024, 238, 2387–2403. [Google Scholar] [CrossRef]
- Jia, Z.; Dong, H.L.; Ruan, Y.; Wang, Y.; Zhang, Y.Q.; Ma, J.; Miao, Y.X.; Tan, Q.L. Dynamic response testing based on pulsed laser and WOA-BP neural network. IEEE Trans. Instrum. Meas. 2025, 74, 7002512. [Google Scholar] [CrossRef]
- Zhang, L.W.; Yang, C.; Yang, H.; Wang, J.C.; Zhang, J.C. Interface reliability modeling of coaxial through silicon via based on WOA-BP neural network. J. Electron. Packag. 2024, 146, 031003. [Google Scholar] [CrossRef]
- Mirjalili, S.; Lewis, A. The whale optimization algorithm. Adv. Eng. Softw. 2016, 95, 51–67. [Google Scholar] [CrossRef]
- Nadimi-Shahraki, M.H.; Zamani, H.; Varzaneh, Z.; Mirjalili, S. A systematic review of the whale optimization algorithm: Theoretical foundation, improvements, and hybridizations. Arch. Comput. Method. Eng. 2023, 30, 4113–4159. [Google Scholar] [CrossRef]
- Ji, X.; Zhang, H.H.; Han, S.Y. A merging approach for hole identification with the NMM and WOA-BP cooperative neural network in heat conduction problem. Eng. Anal. Bound. Elem. 2024, 169, 106042. [Google Scholar] [CrossRef]
- An, N. Research on Optimization of Key Parameters of Silicon Multi-Wire Cutting Based on PSO-BP Neural Network. Master’s Thesis, Zhengzhou University, Zhengzhou, China, 2021. [Google Scholar]
- Wu, Z.Z.; Song, F. Whale optimization algorithm based on improved spiral update position model. Syst. Eng. Theory Pract. 2019, 39, 2928–2944. [Google Scholar]
- Huang, F.; Wu, Z.Z. An improved whale optimization algorithm based on threshold control. Syst. Eng. 2020, 38, 133–148. [Google Scholar]
- Ji, B.; Cui, M.; Mao, J.; Qian, B. A quality prediction method for dual-nozzle fdm molded parts based on CIWOA–BP. Fibers Polym. 2024, 25, 1913–1923. [Google Scholar] [CrossRef]
- Pala, U.; Kuster, F.; Wegener, K. Characterization of electroplated diamond wires and the resulting workpiece quality in silicon sawing. J. Mater. Process. Tech. 2020, 276, 116390. [Google Scholar] [CrossRef]
- Gao, P.C.; Tan, B.M.; Yang, F.; Li, H.; Bian, N.; Sun, X.Q.; Liu, M.R.; Wang, R. Influence of diamond wire saw slicing parameters on (010) lattice plane beta-gallium oxide single crystal wafer. Mat. Sci. Semicon. Proc. 2021, 133, 105939. [Google Scholar] [CrossRef]
- Costa, E.C.; Weingaertner, W.L.; Xavier, F.A. Influence of single diamond wire sawing of photovoltaic monocrystalline silicon on the feed force, surface roughness and micro-crack depth. Mat. Sci. Semicon. Proc. 2022, 143, 106525. [Google Scholar] [CrossRef]
- Yin, Y.K.; Gao, Y.F.; Li, X.Y.; Pu, T.Z.; Wang, L.Y. Experimental study on slicing photovoltaic polycrystalline silicon with diamond wire saw. Mat. Sci. Semicon. Proc. 2020, 106, 104779. [Google Scholar] [CrossRef]
- Li, G.Z.; Zhang, X.C.; Gao, Y.F.; Cui, F.; Shi, Z.Y. Surface topography analysis and surface roughness prediction model of diamond wire-sawed NdFeB magnet based on optimized back propagation neural network. Processes 2025, 13, 546. [Google Scholar] [CrossRef]
- Peng, C.W.L.; Li, G.Z.; Zhang, X.C.; Gao, Y.F. Process Parameters Analysis in Diamond Wire Saw Cutting NdFeB Magnet. Materials 2025, 18, 1173. [Google Scholar] [CrossRef]
- Li, X.F.; Xiang, S.Y.; Zhu, P.F.; Wu, M. Establishing a dynamic self-adaptation learning algorithm of the BP neural network and its applications. Int. J. Bifurcat. Chaos 2015, 25, 1540030. [Google Scholar] [CrossRef]
- Hornik, K. Approximation Capabilities of Multilayer Feedforward Networks. Neural Netw. 1991, 4, 251–257. [Google Scholar] [CrossRef]
- Tian, Y.L.; Fu, D.Y.; Li, G.Z. Research on the generalization problem of BP neural network. IEEE Access 2024, 12, 125416–125426. [Google Scholar] [CrossRef]
Disclaimer/Publisher’s Note: The statements, opinions and data contained in all publications are solely those of the individual author(s) and contributor(s) and not of MDPI and/or the editor(s). MDPI and/or the editor(s) disclaim responsibility for any injury to people or property resulting from any ideas, methods, instructions or products referred to in the content. |
© 2025 by the authors. Licensee MDPI, Basel, Switzerland. This article is an open access article distributed under the terms and conditions of the Creative Commons Attribution (CC BY) license (https://creativecommons.org/licenses/by/4.0/).