Article

Thermal Limitations in Ultrafast Laser Direct Writings in Dielectric Solids

Institut de Chimie Moléculaire et des Matériaux d’Orsay, CNRS, Université Paris-Saclay, 91405 Orsay, France
*
Author to whom correspondence should be addressed.
Micromachines 2025, 16(9), 970; https://doi.org/10.3390/mi16090970 (registering DOI)
Submission received: 22 July 2025 / Revised: 14 August 2025 / Accepted: 18 August 2025 / Published: 22 August 2025
(This article belongs to the Special Issue Ultrafast Laser Micro- and Nanoprocessing, 3rd Edition)

Abstract

In the context of an ultrafast laser interacting with solids, temperature plays a special role in the transformation processes. Some of these processes can be thermally activated, while others can be either solely driven or constrained by temperature—such as refractive index change (fictive temperature), nanopore erasure, micro-bubble formation, and phase transition-like crystallization. The objective of this paper is to use a recently developed analytic approximation to understand the limitations imposed by the spatial temperature distribution and its evolution over the writing time, based on the key laser parameter combinations, and subsequently determine the boundary conditions of these parameters.

1. Introduction

Where and When Does the Temperature Play a Role in the Processes?

The femtosecond (fs) pulsed laser has been recently shown to be an efficient tool for inducing glass modifications that result in significant refractive index changes, or the introduction of non-linear properties. In industrial applications, there is a strong need to write as fast as possible. However, since the searched properties usually depend on the pulse density (see for instance [1,2,3])—which, like the deposited energy density, decreases as the beam-scanning speed increases—the pulse energy (Ep) and/or the repetition rate (RR) are often increased to compensate for this. Performing this action, however, leads to an increase in local temperature, which can ultimately destroy the desired modifications. On the contrary, in some cases, a sufficiently high temperature is required to activate certain modifications, such as laser-induced density changes. There are thus thermal limitations that must be carefully evaluated, and they have not been studied clearly, taking into account the temperature oscillations produced by the pulsed laser irradiation and the thermal accumulation. The purpose of the present paper is to clarify this aspect. Note that all parameters and variables used in this paper are listed in Table A1 in the Appendix A.
In the ultrafast laser–matter interaction process, energy from a laser pulse with an extremely short duration (10−11–10−14 s) is partially deposited into a small focal volume of transparent dielectric solids. This intense laser pulse, with high irradiance (>1013 Wcm−2), initiates a series of complex dynamic processes within an ultrashort timescale, including multiphoton ionization, tunneling ionization, inverse bremsstrahlung absorption, and avalanche ionization [4]. These interactions generate high-density electron excitations in the conduction band and above, creating a quasi-free electron plasma. These excitations weaken the chemical bonds, leading to rapid expansion in the focal zone and resulting in structural modifications. Subsequently, the electron energy dissipates through electron–phonon interactions [5,6], causing a rise in the material temperature. However, as discussed in [7] (based on work from [8] and proved in [9,10]), the light energy is not deposited uniformly. Light tends to concentrate around structural inhomogeneities in the glass within the incident beam area, and it also undergoes scattering with high intensity, leading to a considerable broadening of the irradiated area where the light is also absorbed (see the Appendix C, Figure A2). These inhomogeneities, acting as energy concentrators, form hot spots that lead to nanoplasma generation and eventually nanocavitation. Pending bonds and point defects with reduced bandgap can be produced after only a few pulses [11,12,13]. According to the proposed “memory effects” involved in the non-linear ionization mechanism, these defects give rise to new inhomogeneities with each successive pulse, enhancing multiple scattering. The scattering becomes so efficient that the same process can occur beyond the focal area and expand progressively.
At low incident pulse intensity (<1012 W/cm2 for 0.1 NA in silica), almost no stable structural nanomodification occurs. The energy is dissipated first through electron–phonon coupling (within a few ps), and then through thermal diffusion over the thermal diffusion timescale (corresponding to 65% of out-diffusion from the irradiated area of the deposited energy, typically a few μs in silicate). This process leads to the thermal treatment of the glass, affecting both the irradiated area and its surroundings. Such thermal effects may change the medium-range order of the glass structure, leading to fictive temperature change [14]. At the same time, the shock wave generated by rapid thermal expansion and electronic excitation leads to change in fictive pressure [15]. This pressure is determined by the cooling time, which in turn depends on the evolving spatial thermal curve [16]. As a result, this mechanism may provide an additional contribution to the refractive index change. All these effects lead to an isotropic refractive index change, commonly referred to type I modification [17,18,19,20,21]. Laser-induced crystallization in many multicomponent glasses can also produce similar isotropic changes. Moreover, due to non-linear absorption, such writing can be performed in the bulk of the material, typically a few hundred nm below the surface [22]. Notably, it is not necessary to use fs lasers to induce such processes. Isotropic crystallization has also been demonstrated using a YAG laser [23,24] and other sources [25].
At higher incident pulse intensities (>1013 W/cm2), spherical nanopores (a few nm in diameter) can form as result of high excited electron density nanoplasma generation, triggered by the concentration of light energy at pre-existing or laser-induced inhomogeneities within the glass. Under linear polarization, these nanopores rapidly become oblate after only a few pulses, due to local field enhancement, as described in [26]. In contrast, circular polarization preserves the symmetry of the nanoplasma hot spots, resulting in spherical nanopores, as observed in the so-called type X regime [27], with exhibits low optical scattering and low birefringence [28]. As the number of pulses increases, the nanopores begin to self-organize under the combined influence of the incident light polarization, multiple light scattering, and the viscosity of the glass [29]. This process leads to what is referred to as Type IIp modification [30] where ‘p’ denotes porosity to distinguish it from type IIc, where ‘c’ stands for crystallization, typically involving partial crystallization in multiple component glasses [17,31,32]. Type IIp structures exhibit strong form birefringence due to the aligned nanoporous architecture [33,34]. It is also likely that electric charge distribution plays a role in this structuring process [3,35].
Regardless of the specific type II mechanism, there exist limitations on the choice of laser parameters—mainly Ep and RR—due to the thermal stability of either the induced modification or its spatial organization. In nanopores-based type II modifications, stability is constrained by the viscosity of the glass [36], which decreases significantly when the laser-induced temperature increases. While their formation is also likely viscosity-dependent (and thus temperature-dependent), it occurs directly under the laser beam, where additional forces—especially those involved in the nanocavitation process—play a dominant role. In contrast, crystal-based type II modifications involve a more complex temperature dependence. Recent studies have shown that nanogratings are formed through a light-induced chemical separation process, involving element migration driven by thermal and/or electric potential gradients. This chemical rearrangement is then stabilized by subsequent crystallization, a thermally activated process. In this case, the thermal limitation lies in preventing bulk crystallization [31], which would destroy the anisotropic nanostructure and thus eliminate the desired form birefringence.
As the laser intensity increases further—approaching the 1021 W/m2—nanovoids can be generated through Coulomb explosion [37], a mechanism that is independent of material inhomogeneities. The thermal limitations in this regime are fundamentally similar to those for nanopores formation [38], except that the large void size (approximately ten times greater) leads to enhanced thermal stability (see Equation (1)).
More generally, if the stability of a given modification follows the behavior described by an activation energy distribution—as outlined in the VAREPA framework [39]—then the corresponding writing limitations can be directly inferred.
To explore these thermal limitations in practical contexts, we have conducted numerical simulations for several representative cases mentioned above, with silica as a model material. For this purpose, we compare the thermal stability of each considered modification to the evolution of material temperature during the writing process. The temperature evolution is evaluated using the simplified thermal model described in [40].

2. The Treatment Curve in Scanning Pulsed Laser Mode

We aim to estimate the material temperature a few nanoseconds after the complex processes described in the previous section—specifically, after the light energy deposition and local thermalization via electron–phonon coupling, but before the beginning of thermal diffusion. The key feature of the fs pulsed lasers is that, at any given distance from the focal center, the temperature oscillates between a maximum T m a x and a minimum T m i n within each pulse period. These temperatures depend on both the pulse energy (Ep) and the pulse repetition rate (RR). The main parameters of this problem is the ratio between the diffusion time and the pulse period. The thermal diffusion time is given by: τ D = w ( E p , R R ) 2 4 D t h , where   w E p , R R   is the effective beam waist radius at 1/e intensity (see Appendix C, Figure A2), and D t h is the thermal diffusivity of the material. The pulse period is τ R R = 1 R R . Note that the effective beam width (w) has been defined in [41] as the width of the form birefringent written lines.
When τ R R τ D , the temperature around the focus center has sufficient time to return to room temperature before the arrival of the next pulse—no significant heat accumulation occurs. On the contrary, when τ R R < τ D heat does not completely dissipate between pulses, it leads to cumulative heating and an increase in both T m a x and T m i n over time. This behavior can be characterized by the dimensionless ratio R τ = τ R R τ D = 4 D t h R R · w ( E p , R R ) 2 . The system approaches a quasi-steady state after a certain number of pulses (denoted N s s ), where the temperature oscillations stabilize. The time to reach this steady state is a fraction of ms in silica, regardless of RR (see Appendix B, Equation (A1)). All temperature-related quantities and oscillation behaviors were computed in [40] using a simplified model based on a spherical Gaussian focus. This model is not meant to be quantitatively exact, but rather to provide physical insights. Notably, the correct criterion for assessing heat accumulation is not simply the repetition rate, but rather the parameter R τ , which incorporates both the laser parameters and the material’s thermal properties. From the analysis in [40], we find the following:
  • When R τ is large (ca. ≳ 7), heat accumulation is negligible.
  • When R τ 1 , cumulative heating becomes significant, and T m i n cannot be neglected. The temperature oscillations are relatively smaller.
This relationship is illustrated clearly in Figure 1, extracted from [40].
When R τ < 1 , Tmin approaches Tmax regardless of the distance from the focal center. In this case, the stationary temperature distribution tends to follow a Lorentzian profile, characterized by a broad pedestal. Under this condition, using a mean temperature, which has a simpler analytical expression, is appropriate. Conversely, for R τ > 7 , the temperature distribution is closer to a Gaussian shape, exhibiting a narrow pedestal. It is interesting to note that for intermediate values of R τ , temperature oscillations can be neglected at a relative distance rw = r/w greater than 2, as shown in Figure 1. Considering these previous observations, we can generalize that the oscillations are negligible for rw = r/w > 2, regardless of the value of R τ . Therefore, the mean temperature can be expressed as π R τ .   r w erf r w (see Equation (A5)).

2.1. The Regime of Low Repetition Rate

The low repetition rate regime shows the advantages of minimizing thermal collateral damage and the heat-affected zone [42]. Consequently, ultrafast laser direct writing (ULDW) is widely regarded as an effective technique for inducing highly localized modifications and fabricating optical structures within/near the focal volume of various transparent solids [17,27,43,44,45,46]. In this non-thermal ULDW regime, where the repetition rate (RR) is typically in the order of a few kilohertz, the overall fabrication efficiency is limited by the relatively low pulse RR.

2.2. The Regime of High Repetition Rate

In contrast to the low RR regime, heat diffusion at high RR can extend thermal effects beyond the focal volume over longer time scales. This regime, referred to as thermal ULDW, is characterized by more extensive heat-affected regions. However, the size of this region does not increase significantly if the rise in T00/Rτ is counterbalanced by appropriate control of the pulse energy.
While non-thermal ULDW has found widespread applications, localized thermal accumulation plays an important role in the ULDW by enabling the formation of diverse structural modifications in transparent solids and enhancing the performance of fabricated devices. For example, thermal accumulation can lead to a higher symmetry of waveguide cross-section, reduce propagation loss by self-annealing, and increase the fabrication efficiency [47,48,49]. Moreover, it can induce elemental redistribution and local crystallization, which are nearly unachievable in the non-thermal ULDW [27,50,51,52,53,54]. In thermal ULDW regime, the temperature gradient can act as a driving force to redistribute the elements of the material or reorganize the structures within the heat-affected zone [27].

3. Comparison of Thermal Treatment Curve with Transformation/Stability Curves According to the Mechanism

To demonstrate the practical significance of the aforementioned calculations, below, we discuss several problems where these equations can be applied to analyze temperature effects.

3.1. Type I

The refractive index at the origin of the type I is based on several contributions: the formation of point defects (molecular-level change, [55]), and a change in fictive temperature [56], equivalent to a change in the medium-range order of the glass that induces a local density change [55], which itself induces a stress–strain field (non-local).
The temperature dependence of these contributions are not the same. The thermal stability of the point defects is monitored by an activation energy distribution of VAREPA type ([39], studied at the end of this paper). The stress–strain field is initially proportional to the inhomogeneity of the density change produced by the irradiation. However, because it is non-local and the viscosity may be sufficiently low, another deformation field from the surrounding medium can screen the original deformation caused by the inhomogeneities. This viscosity-based deformation is governed by the relaxation time (η(T)/G, where η is viscosity and G is the shear modulus), similar to the fictive temperature Tf responsible for the density change. Therefore, it is not possible to isolate the density-change-related index contribution without additional laser treatment over larger spatial and temporal scales. Consequently, the density change cannot be erased during the writing time in type I modification as the fictive temperature change can. The objective, then, is to achieve the greatest possible change in Tf.
This quantity, defined by Tool [57], depends on the thermal treatment according to the following equation: d T f d t = T ( r w d , t ) T f τ T r w d , t , T f , where T( r w d ,t) is the local thermal treatment curve, and τ   T r w d , t , T f is the relaxation time η (   T r w d , t , T f )/G, which is dependent on both the local temperature and prior thermal history that was previously established, Tf, when the glass was out of thermal equilibrium [58]. Although there can be an effect of fictive pressure change [15] due to rapid thermal/Coulomb expansion, we neglect internal pressure changes for the sake of clarity and only consider the external temperature. We see from the equation that Tf changes and follows the actual temperature only when the relaxation time is sufficiently short. During the cooling period, as the relaxation time increases, Tf stops evolving. Therefore, computing Tf requires prior knowledge of the thermal curve during ULDW treatment, for which an analytical expression of the temperature curve is available in [40]. However, the temperature oscillates between Tmax and Tmin during each pulse period, which complicates the direct solution of the differential equation. Therefore, instead of solving it explicitly, we compare T( r w d ,t) with the local relaxation temperature. The relaxation fraction xR is classically defined as x R = 1 e x p ( t τ T ) . For t = τ or 2τ, this corresponds to relaxation fractions of approximately 63 or 87%, respectively. By inverting this relation t = τ or 2τ = η ( T )/G or 2η ( T )/G, we obtain Tr or Tr2, representing the temperature corresponding to a given relaxation time. These values are plotted in Figure 2, Figure 3, Figure 4, Figure 5 and Figure 6 and are found to be closely aligned. Let us compare now this relaxation temperature with the treatment curve at any point of the material. Given a specific relaxation time τ, for t = τ or =2τ, if T( r w d ,t) > Tr(τ) or Tr2(τ) then Tf = T( r w d ,t). Conversely, if T( r w d ,t) < Tr(τ) or Tr2(τ), Tf is frozen at the value Tf = Tr(τ) or Tr2(τ). Since Tr and Tr2 are decreasing functions of τ, if T( r w d , t) > Tf for t < τ, then upon cooling, Tf = Tr(τ) or Tr2(τ). This is the last value of the fictive temperature and stands for a given β. One difficulty lies in estimating the total treatment duration before determining the final value of Tf. Owing to the radial symmetry of T( r w d ,t) around r = 0, the full treatment time is twice the scanning time from the center to a given radius. On the other hand, the temperature oscillates between Tmax and Tmin. Therefore, if Tmax is smaller than Tr or Tr2, Tf will not change, regardless of the duration. This defines a threshold condition: a minimum temperature is required to induce an increase of Tf. This is particularly relevant because the initial fictive temperature of the glass is typically much lower than the final one in the heat-affected region (ca. 500–700 °C against 1300–1500 °C), along with the corresponding density change [59] and refractive index [60]. In contrast, if Tmin exceeds Tr or Tr2, the change would be completed—this may occur under conditions of heat accumulation alone. Consequently, a significant refractive index change cannot be achieved at a high (i.e., low RR). This reasoning can be applied whatever the coordinates of the material point (α,β,γ). In such a way, as we know the thermal treatment curve for any point, we obtain the distribution of the fictive temperature according to β (or the center of the written line) for a given set of parameters v (the scanning speed), Ep, and RR. A few examples are shown for silica in Figure 3, Figure 4, Figure 5 and Figure 6, deducing the following.
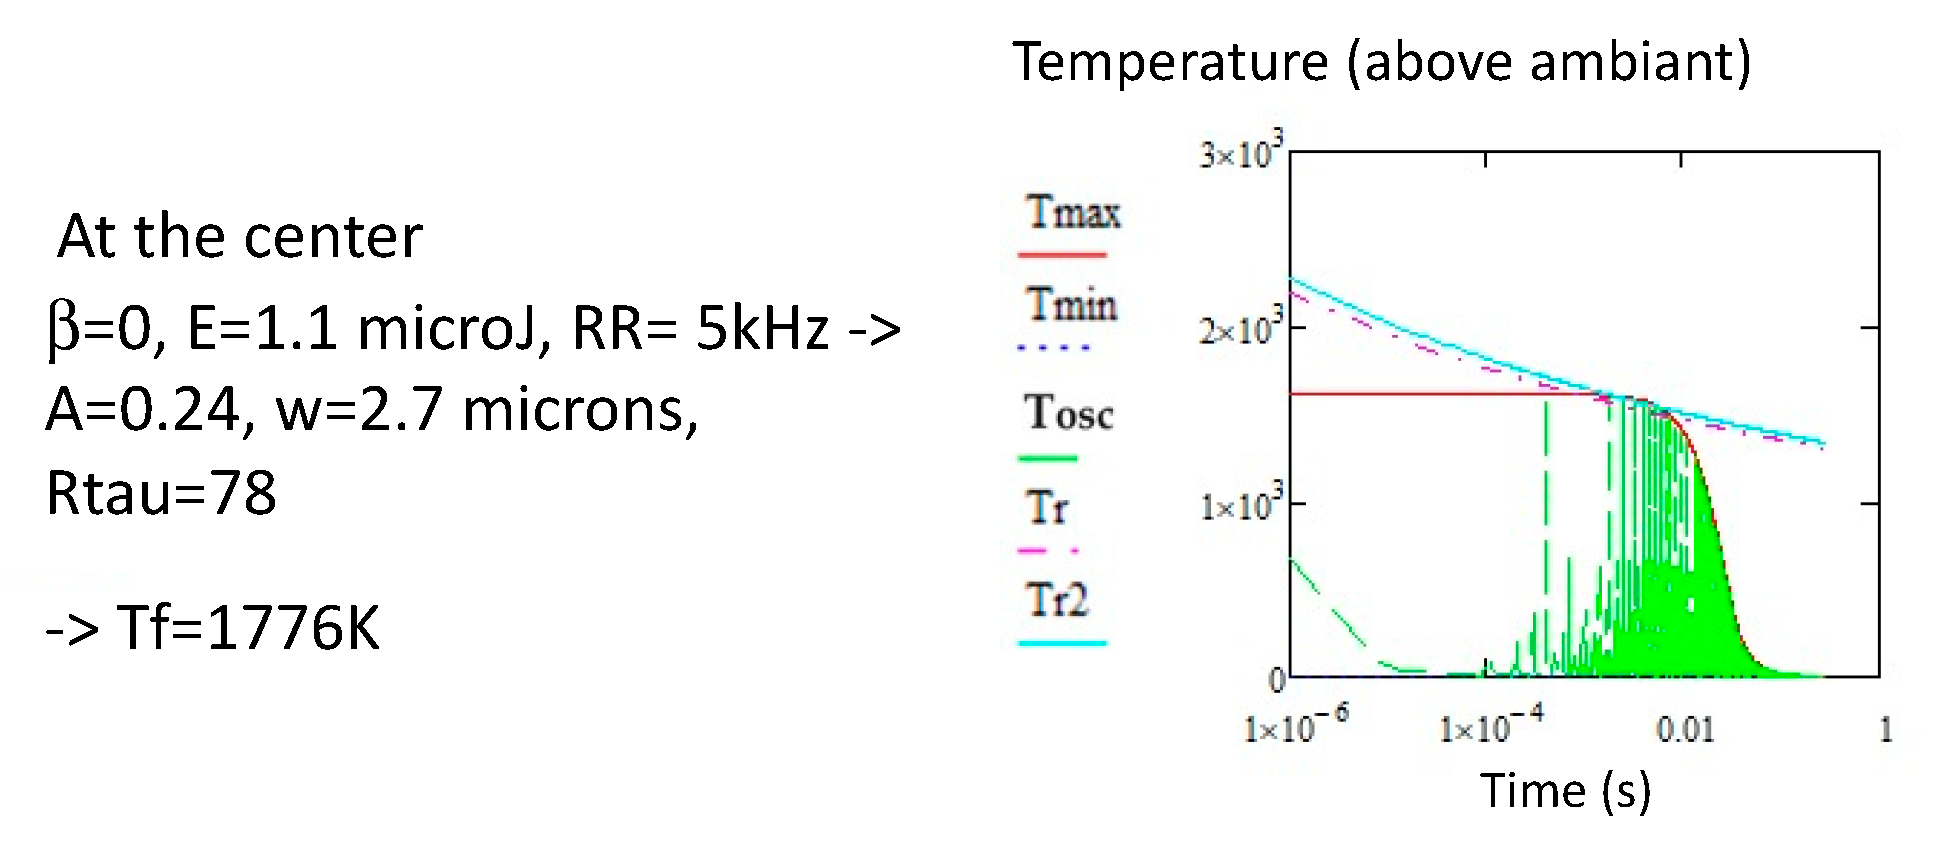
Figure 2a show the evolution of the temperature of a point at the center of the line. Tmax crosses the Tr2 at 1668 K, defining the Tf for a total efficiency. However, this is not the case, as Tmin is largely below Tr2 for the laser parameters used (12 µJ, 5 kHz, 100 µm/s). Tf is therefore slightly larger.
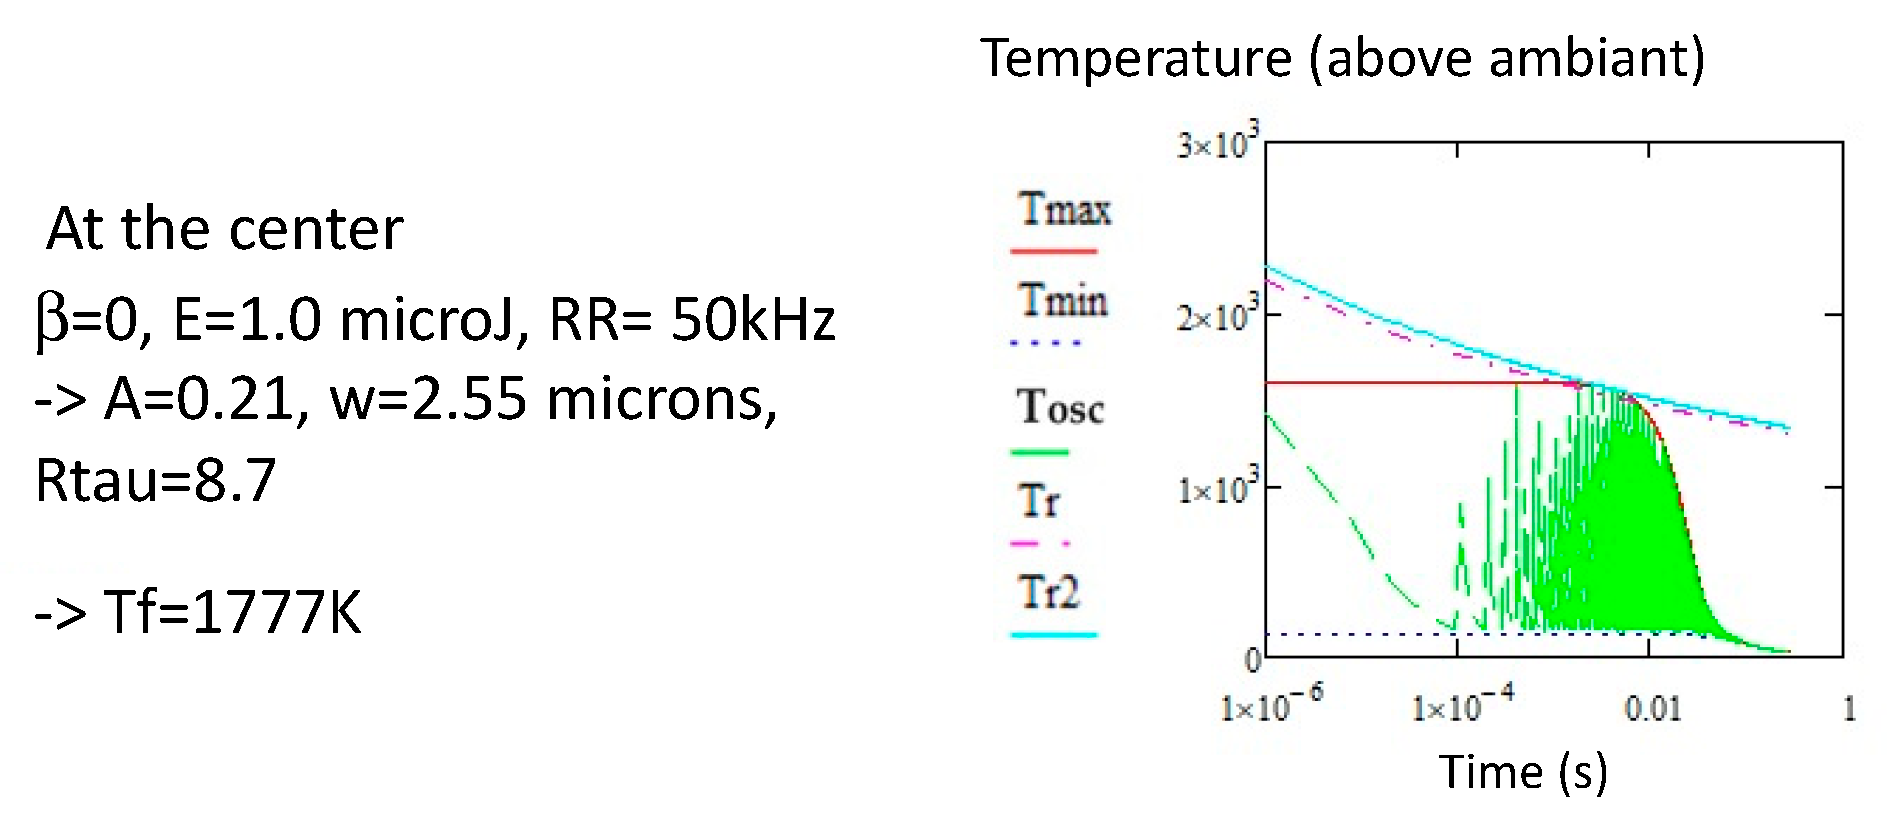
Comparing Figure 2a,b leads us to see that Tf has a tendency to increase at the edge of the heat-affected region. β = 0 means the center of the line, and β = 1.13 means that beyond 1.13 w, the Tf will not change anymore and stay at the initial value. The same observation can be achieved from Figure 4a,b obtained from 4 µJ, 50 kHz, 100 µm/s, and thus with some heat accumulation.
Increasing Ep leads to a decrease in Tf of a hundred of K, as shown in Figure 2a and Figure 3 for 5 kHz or Figure 4a and Figure 5 for 20 kHz. The variation depends on Ep (about −110 K for 11 µJ increase at 5 kHz or −100 K for 3 µJ at 50 kHz); this variation increases in RR due to heat accumulation.
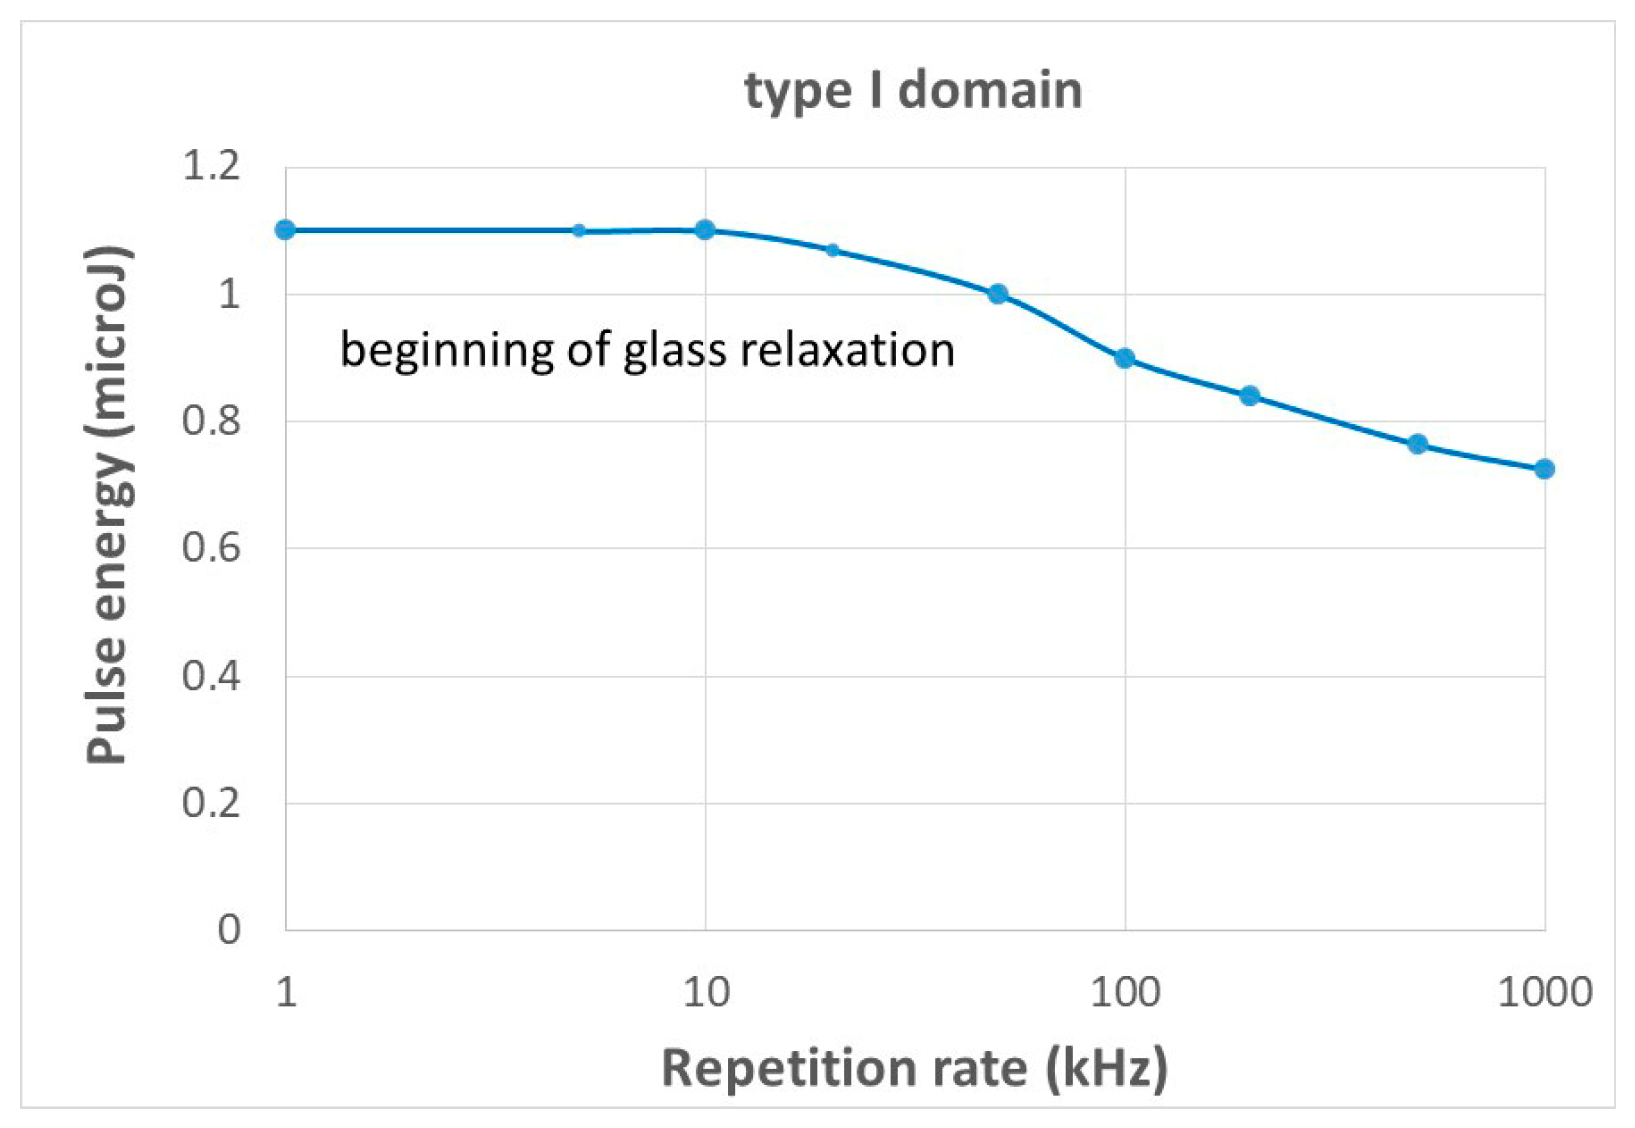
Varying Ep and RR, we can also plot a limit below which the modification is not possible (see Figure 6). We see that the limit is weakly dependent on RR as it is experimentally observed [18]. However, the pulse energy values are slightly larger than the experimental ones (exp. ca. 0.5–0.7). We also note that the width of the modified region can be larger than w if the pulse energy is large enough (Figure 3, 1.13 w for 5 kHz or Figure 4, 1.3 w for 50 kHz), but the most sensitive parameter is the beam scanning speed. At increasing speeds, the width of the modified region is narrower if the pulse energy is not increased, but in this case, Tf will be significantly smaller so the refractive index, especially at large RR (small Rτ). At constant speed, Tf is Ep-dependent (−10 K/µJ at 5 kHz, or −33 K/µJ at 50 kHz). This is due to the fact that the pulse period becomes smaller than the thermal diffusion time; thus, there is no interest in increasing these parameters, except to widen the heat-affected zone. On the contrary, the most active parameter is the scanning speed. Tf increases with it, and is roughly proportional to ln(v), as we can see in Figure 2, Figure 3, Figure 4 and Figure 5. Thus, both density change and refractive index also increase in silica [61] with the scanning speed.

3.2. Type II

In the case of pNG writing, the industrial objective is to write a large-form birefringence (retardance) as fast as possible. However, their amplitudes are dependent on lineic deposited energy density, i.e., proportional to Ep.RR/v or the pulse energy density (Ep.RR.2 w(Ep)/v) ([3,62,63]). Therefore, if v is increased, Ep or RR should be increased at the same time. In such a way, the thermal effect, which is mainly monitored by Ep and RR, increases and may destroy the previously written modifications (at least partially). It is thus necessary to have an approach for modeling the parameters. Therefore, we have to compare the thermal treatment applied during scanning with the stability curve of the pNG. This is defined from the RP model [36], and it is the stability of the nanopores at the base of type IIp.

3.2.1. Thermal Stability of Type II (pNG)

The erasure temperature of the pNG for, e.g., 30 min (T30mn (pNG)) is demonstrated to be based on Rayleigh–Plesset (RP) equation [36], taking into account the erasure of nanopores that compose the pNG structure. The associated optical response, which is the birefringence normalized relative to its initial value before any thermal treatment (Bnorm), is proportional to Rnorm6. Here, Rnorm is the pore radius, and it is normalized with respect to its initial value (Rini) as for Bnorm. Consequently, it has been shown that one obtains the following expression for isothermal treatment:
R n o r m = 1 σ . t 2 . η T . R i n i σ . t 2 . 1 B n o r m 1 6 . R i n i = η T T B n o r m , t = T 0 + B A + l o g σ . t 2 . 1 B n o r m 1 6 . R i n i
where σ = 0.3 J/m2 (surface tension); Rini = 70 nm, we can define the temperature limit according to Δt with Bnorm = 5% and 99%; and η is the glass viscosity (A, B, and T0 are fitting coefficients reported in Appendix A). The corresponding curves are reported in Figure 7, Figure 8 and Figure 9 in the next section (blue and red dashed lines, respectively). The corresponding temperature is noted as Te and corresponds to isothermal treatment.

3.2.2. Limitation of the Processing Window of Type II

We intend to establish an Ep-RR landscape for the pNG, i.e., what can be the pulse energies accessible according to the repetition rate [34] (see Figure 2 in Xie et al.’s study). For that purpose, as we know, the erasure temperature (Te) of such a structure as a function of annealing time using Equation (1). Now, this temperature limit can be compared to the given thermal treatment the material undergoes during laser irradiation when it is no longer irradiated. This means that when a point in the material, after having been irradiated, leaves the beam, it then experiences only the temperature distribution. For that, we have considered that the time of in situ annealing during writing begins when a given point of the material exits from the beam, so when rwd begins to be larger than w after crossing the beam.
This defines the origin of time of the treatment. There are three related curves for each given value of β. For the figure, we have considered β = 0 (the center of the line). The temperature oscillations are in green. They are located between Tmax and Tmin, the red and blue dashed curves, respectively.
As we can see, with the laser parameters we have chosen (6 microJ, 20 kHz, Figure 7), the temperature oscillations at the center progress below the erasure temperature until they approach the curves Te and possibly cross them. It is not exactly an isothermal process, and this decreases the efficiency of the treatment. Note that for Rτ small (small oscillations) or for a radius distance larger than 2 w, a mean temperature can be used, simplifying the analysis. Of course, Tmax and Tmin only decrease as the point leaves the beam and we look for its survival. This approach is similar to the one for type I, but for different finality.
There are three particular points to allow for precision.
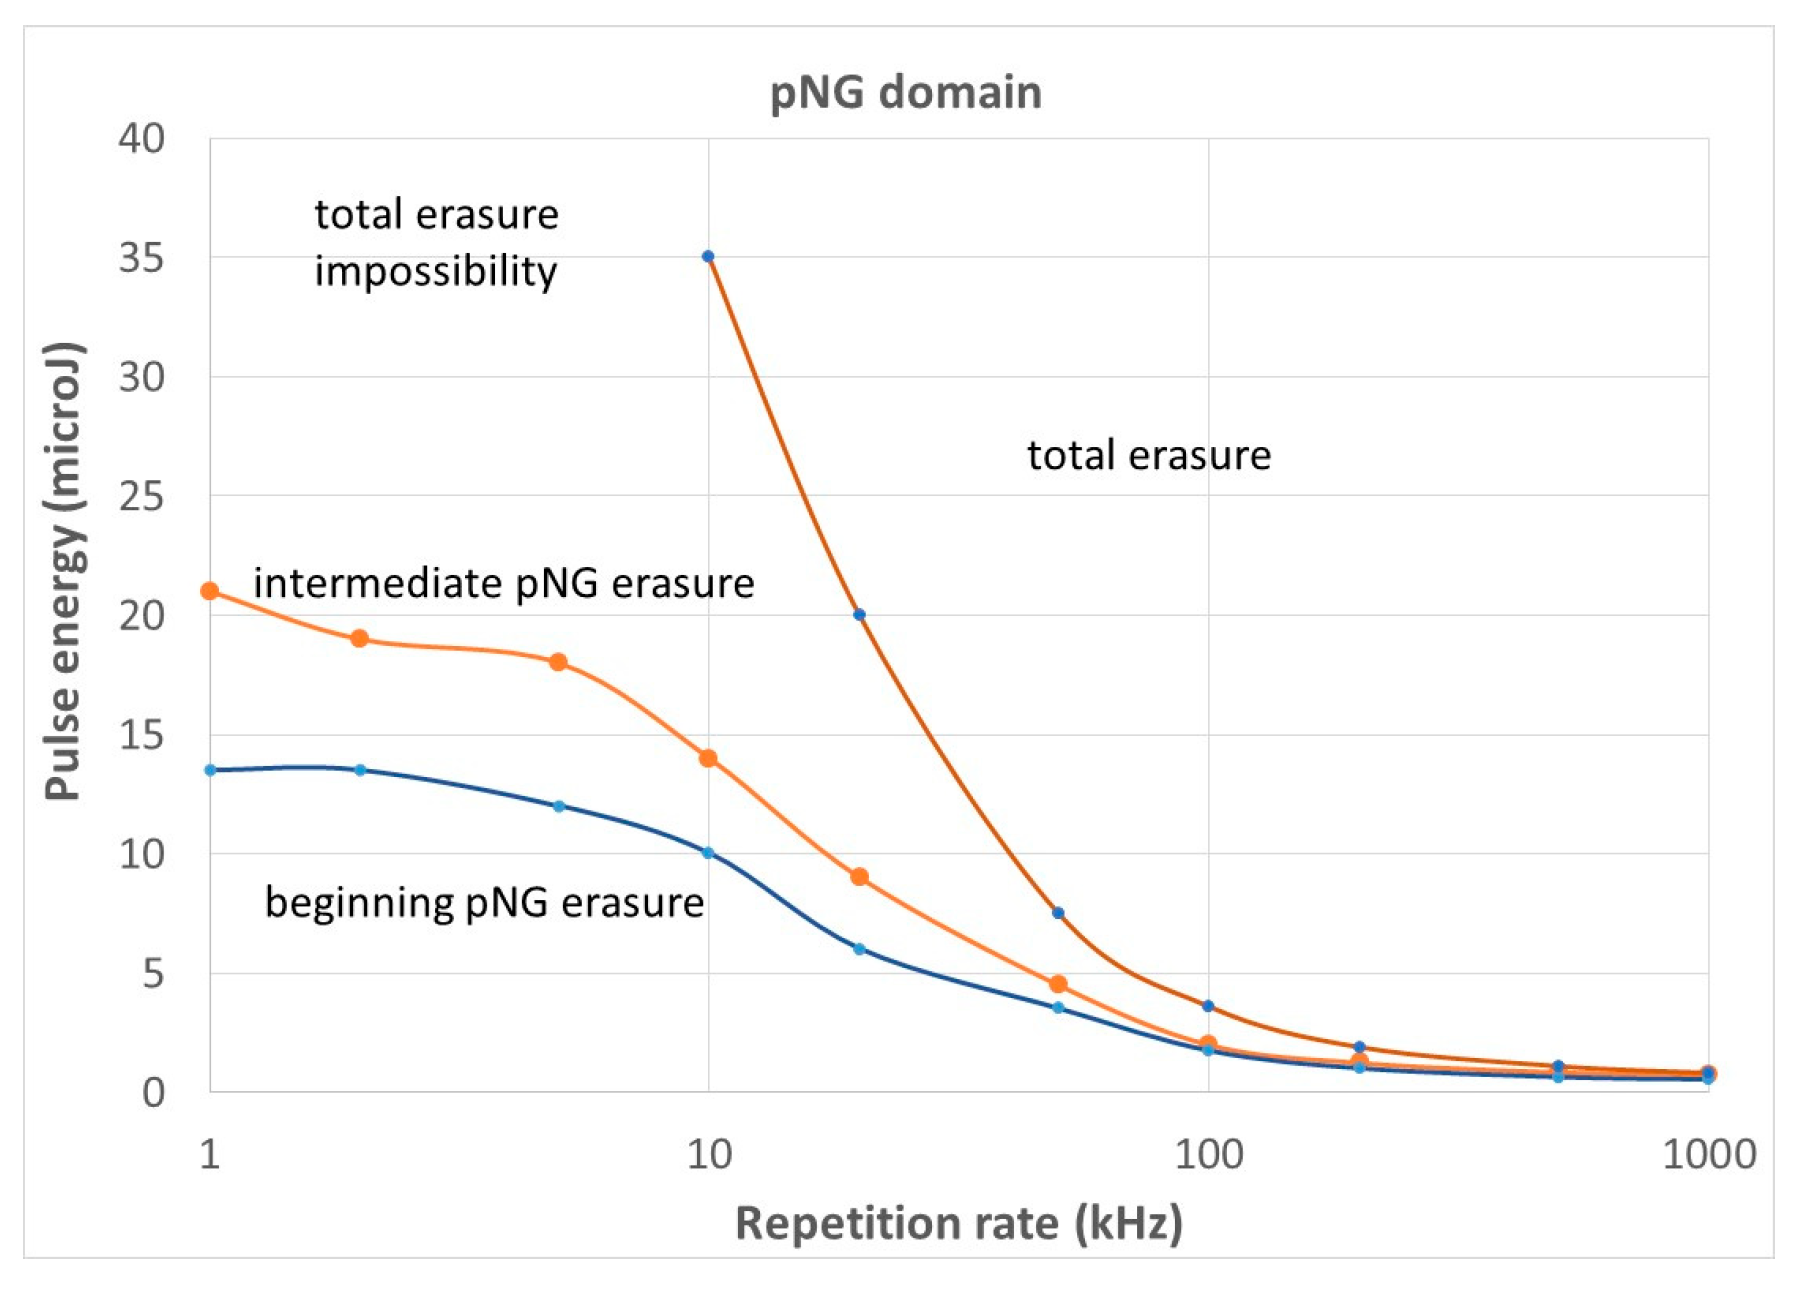
We note that it is possible that Tmax only touches the annealing curve corresponding to 5% erasure of the nanopores (Figure 9 above). In such a way, we obtain a couple (Ep, RR) of the limit below which pNG is not significantly erased, even partially. This leads to plot the blue curve in Figure 7. If this curve is overcome, the pNG will be partially destroyed and Tmax may meet the stability curve for 99% erasure (Figure 7 below). This does not mean that pNG will be completely erased, as a part of the oscillations are below this curve. It is just an intermediate destruction of the pNG (this curve is shown in Figure 7, the red dashed curve). For a complete erasure of the gratings, Tmin needs to overcome Te (99%). This is shown in Figure 9 by the blue dashed curve. The striking feature is that it needs a quite strong increase in Ep for low RR, and we can even say that at a low repetition rate, the written pNG cannot be totally erased. Indeed, for total erasure during writing, when Tmin is close to zero (Figure 8), the oscillations are so large that the annealing will never be efficient. Finally, the curve for 5% compares rather well in shape with the experiment [34].
The limit at low RR becomes independent of the RR. Then, decreasing at larger RR for showing that with heat accumulation, it is almost impossible not to erase the nanopores during the scanning, and even in the course of the irradiation by a fast scanning that preserves the minimum number of pulses for a significant retardance (at least 10 pulses [64]). A figure of 10 kHz appears to be a good compromise.
For comparison with experimental results, we have chosen the parameters in the experiment in [34]. They used pulses of 800 fs, and they wrote at 100 microns/s. In this, it is important to note that the maximum value for the pulse energy is at a low frequency and reaches about 12 microJ whereas it is published at 5 microJ.
The shape of the curve in Figure 10 for the beginning of erasure (Tmax reaches the curve for 5% erasure) agrees with the experiment with a plateau at low RR and a decrease as long as RR is increased. However, there are some discrepancies: the value at the plateau is higher than in the experiment (14µJ instead of 5 microJ), and the RR at the inflection point is too low (20 kHz instead of ca. 200 kHz). The temperature is ruled by T00 at a low RR (no heat accumulation), T 00 = A ( E p ) · E p π 3 2 ρ   C p w   ( E p , R R ) 3 . For a constant temperature of Te (5%), an excessively large Ep means an excessively large beam width in the model. On the other hand, the position of the inflection point is defined by the appearance of heat accumulation, i.e., at R τ = 7 [40], since R τ = 4 D t h R R   w ( E p , R R ) 2 , and an excessively small RR also means an excessively large beam width for the fixed R τ considered here. On the other hand, a test with the model suggested that a reduction of about 40% is enough for explaining the discrepancy. This point will be discussed in the Section 4.
We also note that, for low RR, it is not possible for Tmin to overcome the 99% stability curve, and thus it is not possible to erase completely the nanograting. What is, thus, the limitation given in [34]? It is a level off of the retardance on pulse energy, i.e., the increase in the volume of NG is probably counterbalanced by a partial erasure.
Moreover, with the model we have used, the properties at the edge (β = 1) are the same as in the middle of the NG (β = 0). The erasure rate is the same.
Comparing the spatial extend of type I and type II, the last one is limited by the beam, so it has half the width of w, whereas for type I, the maximal radius is defined with the same laser conditions that lead to an excessively lower treatment curve for Tf change (βmax). When βmax > w, it is possible to see a contrast in phase shift that overflows the birefringent area. βmax can be larger or smaller than w, as they do not originate from the same mechanism. w is defined by direct optical effect, whereas βmax is a thermal effect [65].
The landscape in Figure 10 allows us to explain that an increase in RR with constant Ep leads to a decrease in the size of the porosity and in the number of nanoplans’ coalescence [66].

3.3. Type III, the Same Approach as Above (Comparison of Stability and Thermal Treatmentl Curve)

The modification called type III is mainly a hole or nanobubble. The formation mechanism can be decomposed into four stages. Stage 1 is the energy deposition when the hole is not yet formed (electron excitation, etc.). Basically, it is the same problem than the previous type, except that the pulse energy is slightly larger. There is ionization and weakening of the chemical bonding within a radius w1. In Stage 2, there is local thermalization in a couple of ps; the local temperature increases and the matter expands on the effects of the phonon population and Coulombian repulsion [10] in a few ns [67]. The beam radius w1 increases suddenly until w2. In Stage 3, the phase transformation occurs and the bubble forms after a time corresponding to the stress propagation, also evaluated to a few ns. A densified shell surrounds the bubble due to matter conservation. A part of the deposited energy is used in this transformation. w2 evolves into w3. In Stage 4 (final), if the temperature around the bubble is large enough, the hole can decrease in size until disappearance, totally or partially depending on the laser parameters used, the gaz contained in the bubbles (internal pressure), and its size. This is the definition of a limitation for type III if a well-defined hole is necessary for the application.
Stage 4 can be thus modeled on the basis of w3, and the matter dynamics is driven by the RP equation, as we have seen above with type II. The initial radius alone is much larger (two-order larger) and thus the stability is higher than those in Figure 7, Figure 8 and Figure 9, and thus may lead to a higher maximum pulse energy. Above this energy limit, the hole may collapse, but the nanobubble size being not negligible in front of w may modify the problem of homogeneous absorption.
Another limitation appears in this scheme: for lower pulse energy, the phase transformation may not be achieved, and therefore there may not be a hole. This is a low-energy limitation of type III.

3.4. On VAREPA Systems

A system that follows the VAREPA approach [39] has its thermal stability that can be described by a master curve (the relevant normalized quantity like the Bragg diffraction efficiency or the retardance of UV-induced Bragg gratings or points defects), i.e., time and temperature can be gather in a unique variable called demarcation energy (Ed) with the most frequent expression Ed = kbTln (k0t) [39]. The master curve can be written as MC (Ed). On this, one can be decided that any thermal treatment should not erase more than a fraction of the related quantity to MC (Ed). To this limit corresponds a demarcation energy limit that one not to overcome. Let us call this the last Edlimit, which leads to T = Edlimit/kbln (k0t) that can be considered as the stability curve.
Now, consider our thermal treatment during writing (Tmax (rwd,t) and Tmin (rwd,t)) with a relevant time origin t0 from the active period, like it was for description of the other types. By comparison of the two curves, like it has been performed in Figure 6, Figure 7, Figure 8 and Figure 9, we can deduce a landscape such as that in Figure 10 for the related modification.

4. Conclusions

In this paper, we have considered the thermal dependence of several modifications induced by an fs laser. We have compared the thermal treatment curve at any point of the material that crosses the beam (using previous simple analytical description) with the transformation/stability curve of modifications. In such a way, we have shown the effect of laser parameters.
For type I, it needs to maximize the fictive temperature as the phase shift or index change vary from this quantity. Tf dependence on RR is weak without heat accumulation. It decreases with Ep; therefore, there is no interest in this direction. The most sensitive parameter is the scanning speed, which increases the cooling. Tf rules approximately with ln(v).
For type II, its total erasure is not possible without heat accumulation. Therefore, the largest retardance can be obtained at low RR, for which Rτ > 7 and where Ep can be maximized.
For type III, we only forecast that stability is larger than type II, so the erasure limit is higher than this last one, with the problem being the light absorption of an inhomogeneous structure.
The approach described in this paper is applicable to any other transformation, providing the thermal transformation/stability curve is known.
However, the values of the limits that we have obtained appear too large compared to the experiment by about 40%. This arises probably by a description of the beam distribution too simple (one Gaussian shape). We suggest that the effective beam is composed of at least two components: one narrower, from the optical beam, giving rise to thermal effect and another, much larger one, originating from the multiple scattering, which is therefore attenuated and gives rise to the NG organization. We can add also that a clamping effect of the excited electron density that limits the absorbed fraction of the pulse energy [68] has not been taken into account in the A (Ep) coefficient and may improve the agreement. As the Fourier equation is linear, the superposition of the two Gaussian sources will lead to the superposition of the two solutions, but this is a refinement that needs additional experiments that are not available at the moment. These are the future directions for an improved, simple model.

Author Contributions

Conceptualization, B.P.; investigation, R.Q. and B.P.; methodology, B.P.; project administration, B.P.; supervision, B.P.; validation, R.Q.; visualization, R.Q.; writing—original draft, B.P.; writing—review and editing, R.Q. and B.P. All authors have read and agreed to the published version of the manuscript.

Funding

This research was funded by Agence Nationale de la Recherche (ANR), FLAG-IR Project, award number ANR-18-CE08-0004-01, R.Q. acknowledges the China Scholarship Council (CSC) for the funding, no. 201808440317, of her PhD fellowship.

Data Availability Statement

Data is contained within the article.

Conflicts of Interest

The authors declare no conflicts of interest.

Appendix A

Table A1. Glossary of laser and material parameters for silica.
ParametersDefinitionsUnits
T00Temperature increment above room one produced by a single pulsesee equation below
TminMinimal temperature of the temperature oscillation at the steady statesee equation below
TmaxMaximal temperature of the temperature oscillation at the steady statesee equation below
ToscTemperature oscillation at the steady state°
TfFictive temperature (representative of medium-range order of the glass)K
Tr or Tr2Relaxation temperature according to relaxation time for 63 or 87% of relaxed glass fraction (tool definition, see text)K
T( r w d , t)Temperature increment above room one at the distance r w d ,t and at time t
This temperature can be either Tmax, Tmin or Tosc according to the discussion.
°
TeTemperature for erasing 5% or 99% of nanopores involved in type II modificationsK
 
E p Pulse energyJ
A Fraction of absorbed lightnone
 
τ R R Period of the pulsesμs
f Pulse repetition rateMHz
w Effective beam waist radius (at 1/e)μm
 
κ Thermal conductivity1.09 W/(m.K) (1)
ρ Density2200 kg/m3
C p Specific heat capacity703 J/(kg.K)
D T Thermal diffusivity D T = κ ρ . C p 7.06 × 10⁻⁷ m2/s
τ D Heat diffusion time τ D = w 2 4 D T μs
ηViscosity (2) l o g 10 ( η P a . s ) = 4.55 + 21254 K T K 139 K
 
R τ τ R R / τ D none
 
ε A small quantity of computational needsnone
rwNormalized radius (r/w)none
rwdNormalized dynamic distance to the focus center (see Equation (A4))none
(1) Using the empirical formula given in [69]. (2) From [70,71,72], Tg ≅ 1450 K, melting point around 1983 K.

Appendix B

Appendix B.1. Temperature Distribution Evolution During Laser Writing (Scanning Mode)
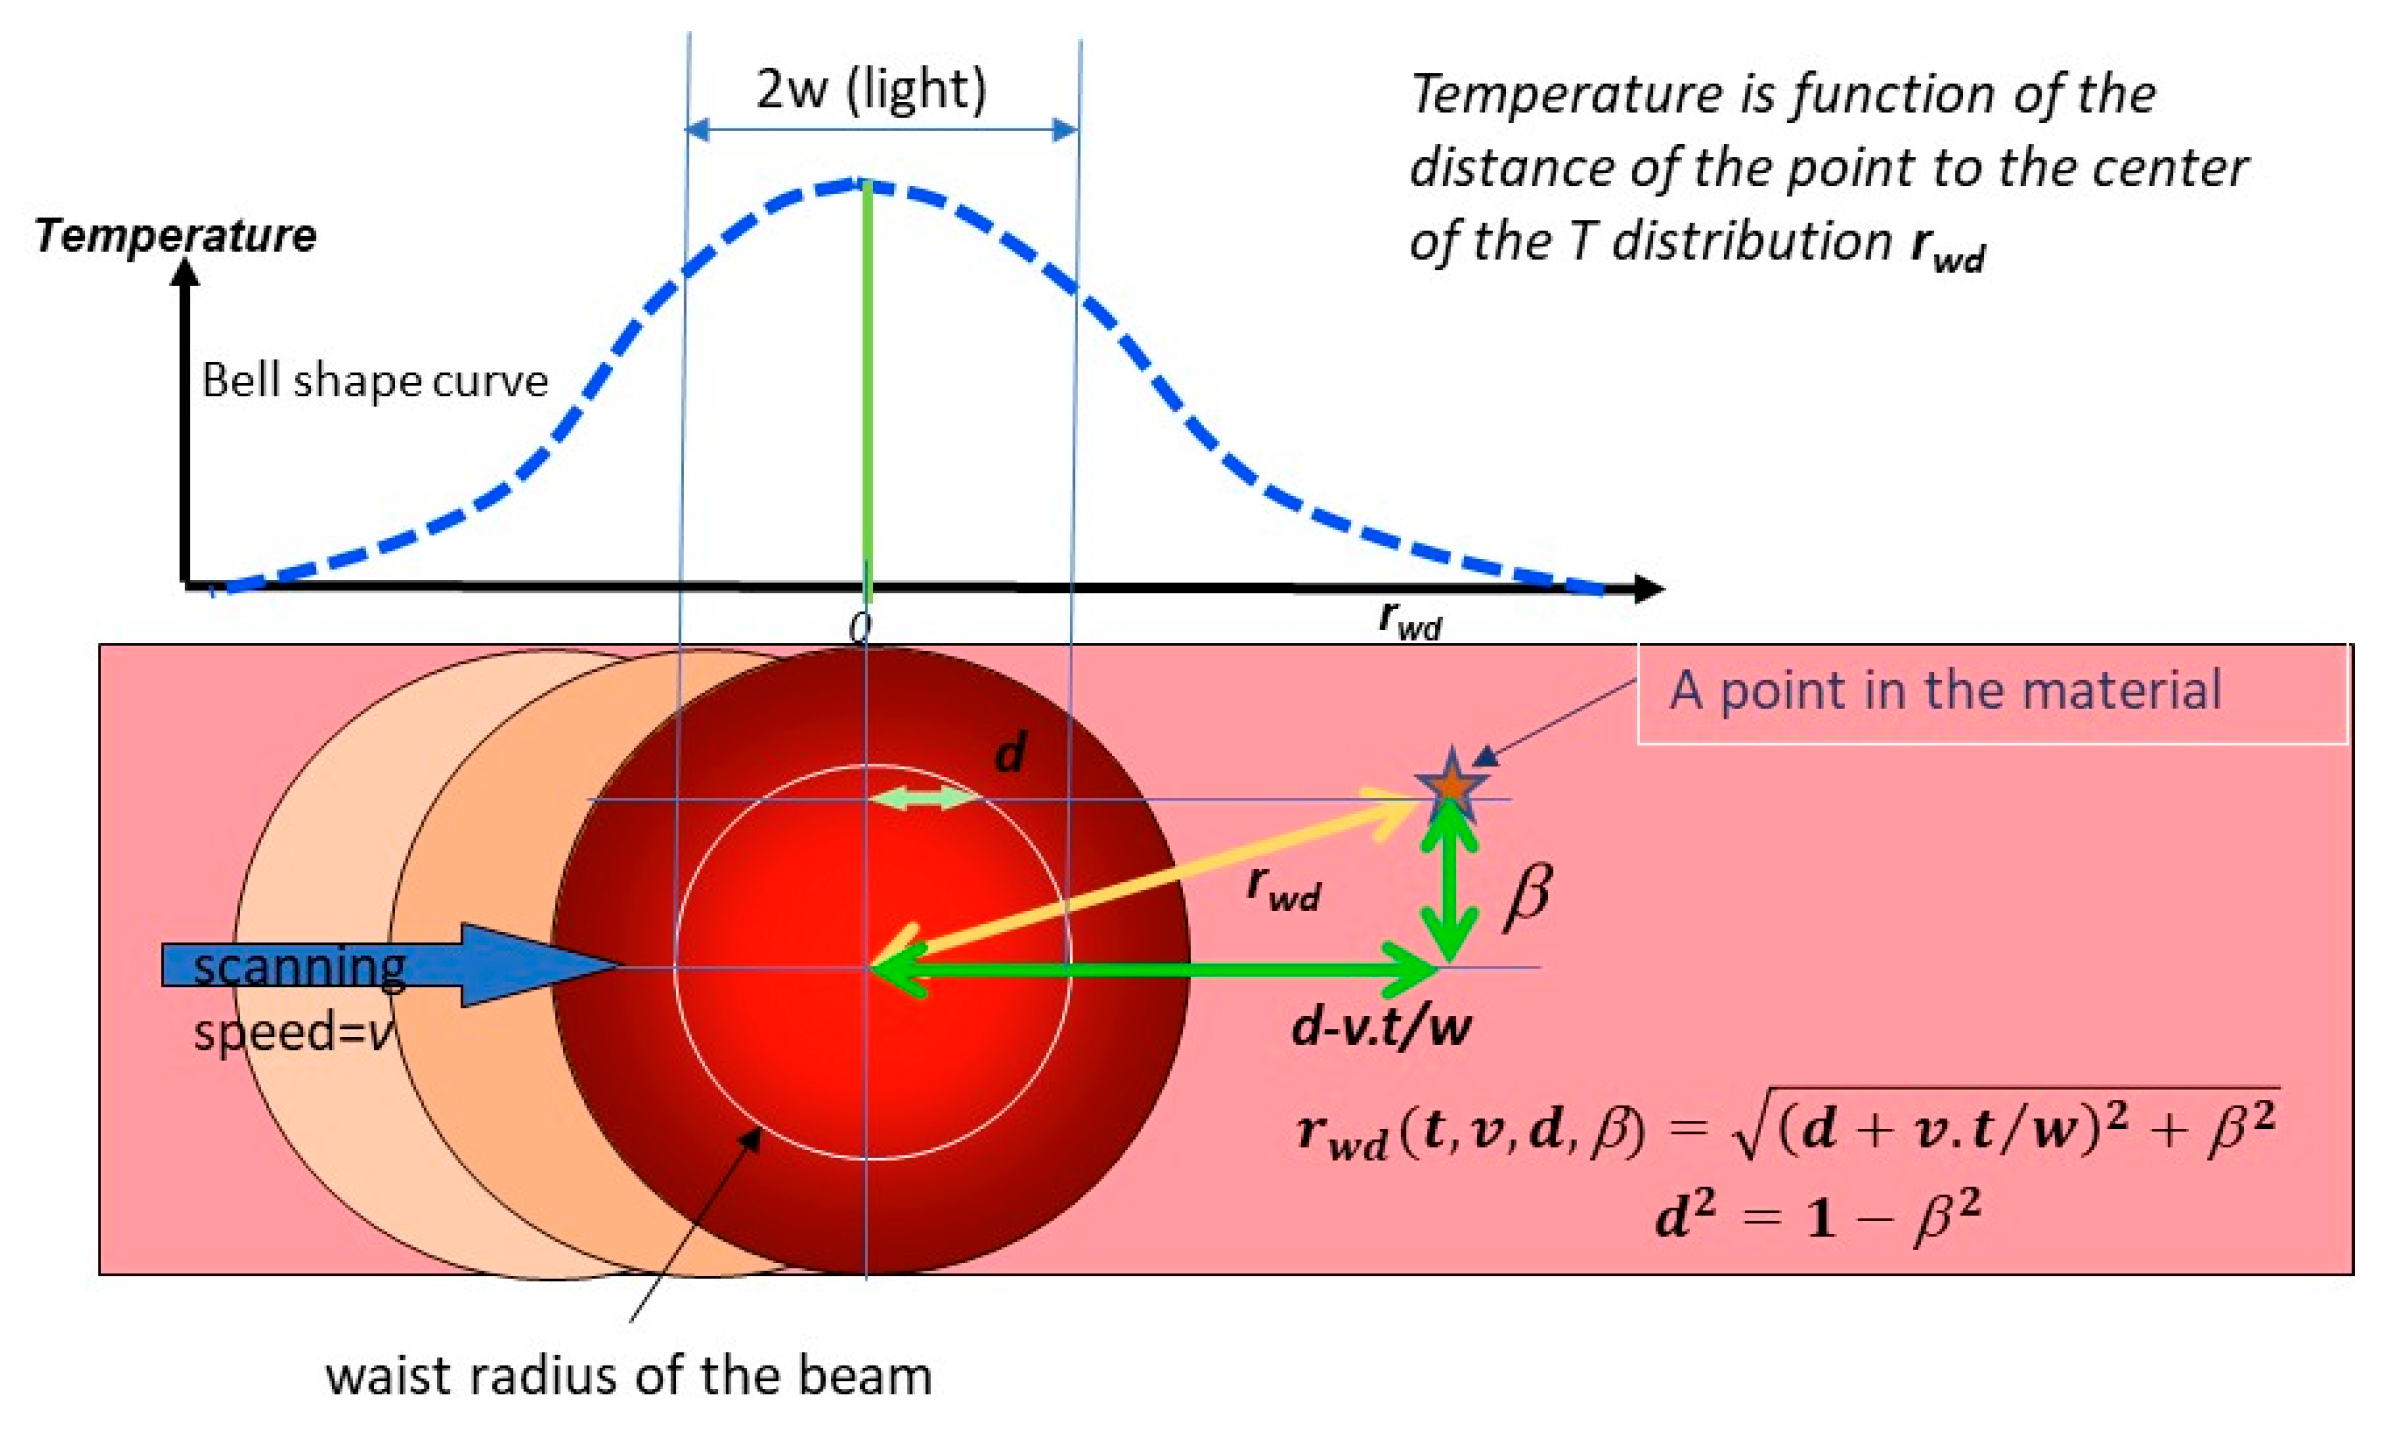
The formulae used in this paper were extracted from [40], and are recalled below. The numerical values of the required parameters are listed in Appendix A. It is also assumed that no endothermic reaction occurs in the dark that would consume a significant portion of the absorbed energy. The electronic band structure of the material and the non-linear absorption coefficient are assumed to remain unchanged during irradiation and considered temperature-independent. For better accuracy, the reference temperature should be chosen around the transformation temperatures of the relevant modification.
Consequently, the shape of the spatial temperature distribution is not time-dependent; the only time dependence is introduced by the beam scanning along the α direction and appears as α + v.t. The parameters β and γ are fixed, with the γ direction corresponding to the beam propagation axis. The origin of the coordinates is the focus center. The scanning speed (v) defines the number of pulses deposited immediately as Np = 2 w.RR/v. The laser pulse energy Ep defines the maximum temperature increment T00, introduced by a single pulse above the initial temperature, as T 00 = A · E p π 3 2 ρ C p w 3 , where A is the fraction of absorbed energy (previously defined); and ρ and Cp are the glass density and heat capacity, respectively. Additionally, a normalized radius rw = r/w is defined, where r is the radial distance from the center of the beam focus (see Table A1).
The temperature oscillations occur between a maximum (Tmax) and a minimum (Tmin), which vary according to the laser irradiation conditions. After a sufficient number of pulses (Nss), both Tmax and Tmin reach a steady-state regime. Achieving this steady state is governed by the ratio Rτ as previously defined, given by Rτ = 4 Dth/RR w2.
NSS corresponds to the minimum number of pulses necessary to reach the steady state. Its expression is given in Equation (A6) below. This calculation can be performed for either Tmin or Tmax. However, in this paper, it is specified that when rw > 2, the difference between Tmin and Tmax becomes negligible, as seen in [73]. Therefore, the conditions of rw and R τ for neglecting the temperature oscillations are deduced, making the use of an average temperature Tmean applicable (Equations (A7) and (A8)).
The static temperature distribution is mapped into the time domain to obtain thermal treatment curves. This is performed by replacing the static normalized radius r w by the coordinate r w d , which represents the position of the point in the moving material, taking the beam center as a reference (see Figure A1). The relative position r w d in the beam is related to relative time by the following relation: r w d ( t , v , d , β ) = ( d + v . t / w ) 2 + β 2 . The time origin of the treatment for each modification is defined as the moment when the point of the material either experiences a temperature larger than the final fictive one for type I (due to the symmetry of the problem around the center of the focus, the time is twice the one from the focus center, i.e., d = 0, r w d ( 0 , v , 0 , β ) = β ) or when the point moves out of the beam, causing the temperature to significantly decrease (i.e., r w d ( 0 , v , 1 β 2 , β ) = 1 for type II or III).
Figure A1. Scheme of the different variables used in the calculations. d is shown in the case of type II, for type I or III, d = 0.
Micromachines 16 00970 g0a1
While expressions are provided in this appendix, it is worth emphasizing that Tmax and Tmin are only function of parameters Rτ and T00. In turn, R τ = D t h R R w ( E p , R R ) 2 and T 00 A ( E p ) · E p w ( E p , R R ) 3 are functions of RR, Ep, A and w. The latter two parameters are themselves functions of Ep and possibly of RR: A (Ep) and w (Ep,RR), as reported in [31], but they are not precisely defined. This issue has been previously discussed in [40].

Appendix B.2. Tmin and Tmax

The temperature induced by laser pulses will not increase indefinitely but converge to a finite value. This defines a steady state that corresponds to the equilibrium between the energy supplied by the laser and the energy diffusing out of the irradiated voxel.
From Nssmax together with the laser pulse RR, we know the time needed to reach the steady state. Accordingly, the time for reaching the steady state   t s s 0 is (considering the effective number to reach the Tmax limit) as follows:
t s s 0 = N s s m a x 0 τ p = τ d 2 R τ . ε . T m a x 0 , 2 1
T m a x r w , R τ T 00 = exp r w 2 1   +   x m · R τ 1 + x m · R τ 3 2 + exp r w 2 1   +   ( 1   +   x m ) · R τ 2 1 + 1 + x m · R τ 3 2 + π R τ . r w e r f r w 1 + ( 1 + x m ) · R τ
With:
xm = 0 if r w 2 < 1.5 + 2 R τ or xm = 1 if x m = R τ 9 R τ + 32 r w 2 3 R τ 8 8 R τ > 1 ,
x m = R τ 9 R τ + 32 r w 2 3 R τ 8 8 R τ otherwise.
T m i n r w , R τ T 00 = exp r w 2 1 + ( 1 + x m ) · R τ 2 1 + 1 + x m · R τ 3 2 + π R τ . r w e r f r w 1 + R τ
With R τ = 4 D t h R R w ( E p , R R ) 2 , D t h = κ ρ · C P T 00 = A ( E p ) · E p π 3 2 ρ   C p   w ( E p , R R ) 3
In order to introduce the time (t) in the equations as the beam is progressively scanning and its distance to the point is changing, the rw previously provided is substituted by rwd, using the following relationship:
r w d t , v , d , β = d + v · t w 2 + β 2
T o s c r w d , x b i s , R τ T 00 · exp r w d 2 1 + x b i s . R τ 1 + x b i s . R τ 3 2 + π R τ . r w d e r f r w d 1 + 1 + x b i s . R τ e r f r w d 1 + R τ + T m i n
With x b i s , the floating value of t.RR (that is, it takes a value from 0 to 1 along one temporal period).
Note that the time is introduced in the formula by r w d which is a “moving” r w (as the beam is scanning) and in x by rendering it periodic, i.e., in taking only the floating value of t.RR.
The corresponding signification of each term are schematically illustrated in the drawing Figure A1. Note that the d value sets the initial position of the beam along the writing axis and corresponds to the initial time t = 0 of the treatment. This one depends on the modification we are considering, but it is not awkward. For instance, for fictive temperature, initial time can be taken when the point is penetrating the beam, and for nanopores, it is when the point is living the beam (rwd > 1) for crystallization it is when the temperature is overcoming the Tref. If a VAREPA approach is considered, the time origin has to be the same than in VAREPA framework, i.e., when the treatment begins to be active. On the other hand, since it is a function of β, an initial temperature reached by the position to set the initial treatment curve can be decided by solving Tmax (rwd(t = 0,v,d, β),Rτ) = (TrefTroom)/T00.
The number of pulses for reaching the steady state and use the above formula is as follows:
N s s m a x r > 1 R τ 2 R τ . ε . T m a x r w , 2 1
When the mean T can be used, T ¯ r , N = 1 τ R R p u l s e   p e r i o d a t   N T r , t d t ; the formula is even simpler to use after reaching the steady state. τRR is the period = 1/RR
T ¯ r w , R τ , = π R τ . r w erf r w
N s s m r r w = 1 R τ 2 . r w π . ε . e r f r w 2 1

Appendix C

The dependence of A (the absorbed fraction of pulse energy) and w (the half width of the beam at 1/e) with the laser parameters in our problem is already shown in [74]. It is shown that the theoretical computations are not able to predict these quantities with reliability, and thus only a comparison with experimental results allows us to estimate them. In particular, the information about w is from [74], considering that the birefringence width, arising mainly from NG, represents the beam width. These data are completed with measurements performed in our team on porous-based NG birefringence from other materials [11]. The results are provided in Figure A2b. On A values, the solutions obtained herein lead to a lower fraction than silica or LNS glasses (see Figure A2. On w, this glass confirms what it was shown previously in [41] that the beam width is much larger than the optical width defined by the Kerr effect [75] and the broadening effect of excited electron density. It also clearly highlights a strong dependence of w on RR in this glass, along with a Ep, more pronounced than the one of silica or LNS glass.
Figure A2. Critical parameters A (the absorbed energy) and w (the effective beam radius) for the estimation of the temperature for several glasses. Graphs are extracted from [41] and completed with line widths from our optical birefringence, SEM/TEM observations.
Micromachines 16 00970 g0a2
From the above compilation, and for the use of this paper restricted to silica, we have used the following fits:
For the absorbed energy fraction: A (Ep) = 0.171.ln(Ep(μJ) − 0.55μJ) + 0.345 for pulse duration around 800 fs. This fit applies for Ep > 0.7μJ.
For the effective beam radius (that seems not to be RR-dependent): w (Ep,RR) = w (Ep) = 1.43 μm ln(Ep(μJ)) + 2.55 μm.
For these constraints, applicable for a pulse duration of 800 fs for A and in silica, Ep is limited to be above 0.7 microJ.

References

  1. Shchedrina, N.; Cavillon, M.; Ari, J.; Ollier, N.; Lancry, M. Impact of Glass Free Volume on Femtosecond Laser-Written Nanograting Formation in Silica Glass. Materials 2024, 17, 502. [Google Scholar] [CrossRef]
  2. Zukerstein, M.; Zhukov, V.; Meshcheryakov, Y.; Bulgakova, N. From Localized Laser Energy Absorption to Absorption Delo- calization at Volumetric Glass Modification with Gaussian and Doughnut-Shaped Pulses. Photonics 2023, 10, 882. [Google Scholar] [CrossRef]
  3. Lei, Y.; Wang, H.; Skuja, L.; Kuehn, B.; Franz, B.; Svirko, Y.; Kazansky, P. Ultrafast Laser Writing in Different Types of Silica Glass. Laser Photonics Rev. 2023, 17, 2200978. [Google Scholar] [CrossRef]
  4. Schaffer, C.B.; Brodeur, A.; Mazur, E. Laser-induced breakdown and damage in bulk transparent materials induced by tightly focused femtosecond laser pulses. Meas. Sci. Technol. 2001, 12, 1784. [Google Scholar] [CrossRef]
  5. Bäuerle, D. Laser Processing and Chemistry; Springer Science & Business Media: Berlin/Heidelberg, Germany, 2013. [Google Scholar]
  6. Seuthe, T.; Mermillod-Blondin, A.; Grehn, M.; Bonse, J.; Wondraczek, L.; Eberstein, M. Structural relaxation phenomena in silicate glasses modified by irradiation with femtosecond laser pulses. Sci. Rep. 2017, 7, 43815. [Google Scholar] [CrossRef] [PubMed]
  7. Lancry, M.; Poumellec, B.; Canning, J.; Cook, K.; Poulin, J.-C.; Brisset, F. Ultrafast nanoporous silica formation driven by femtosecond laser irradiation. Laser Photonics Rev. 2013, 7, 953–962. [Google Scholar] [CrossRef]
  8. Cang, H.; Labno, A.; Lu, C.; Yin, X.; Liu, M.; Gladden, C.; Liu, Y.; Zhang, X. Probing the electromagnetic field of a 15-nanometre hotspot by single molecule imaging. Nature 2011, 469, 385–388. [Google Scholar] [CrossRef]
  9. Rudenko, A.; Ma, H.; Veiko, V.P.; Colombier, J.-P.; Itina, T.E. On the role of nanopore formation and evolution in multi-pulse laser nanostructuring of glasses. Appl. Phys. A 2017, 124, 63. [Google Scholar] [CrossRef]
  10. Rudenko, A.; Colombier, J.-P.; Höhm, S.; Rosenfeld, A.; Krüger, J.; Bonse, J.; Itina, T.E. Spontaneous periodic ordering on the surface and in the bulk of dielectrics irradiated by ultrafast laser: A shared electromagnetic origin. Sci. Rep. 2017, 7, 12306. [Google Scholar] [CrossRef]
  11. Grojo, D.; Gertsvolf, M.; Lei, S.; Barillot, T.; Rayner, D.M.; Corkum, P.B. Exciton-seeded multiphoton ionization in bulk SiO2. Phys. Rev. B 2010, 81, 212301. [Google Scholar] [CrossRef]
  12. Taylor, R.; Hnatovsky, C.; Simova, E. Applications of femtosecond laser induced self organized planar nanocracks inside fused silica glass. Laser Photonics Rev. 2008, 2, 26–46. [Google Scholar] [CrossRef]
  13. Richter, S.; Jia, F.; Heinrich, M.; Döring, S.; Peschel, U.; Tünnermann, A.; Nolte, S. The role of self-trapped excitons and defects in the formation of nanogratings in fused silica. Opt. Lett. 2012, 37, 482–484. [Google Scholar] [CrossRef] [PubMed]
  14. Lancry, M.; Regnier, E.; Poumellec, B. Fictive temperature in silica-based glasses and its application to optical fiber manufacturing. Prog. Mater. Sci. 2012, 57, 63–94. [Google Scholar] [CrossRef]
  15. Gupta, P.K. Fictive pressure effects in structural relaxation. J. Non-Cryst. Solids 1988, 102, 231–239. [Google Scholar] [CrossRef]
  16. Guerfa-Tamezait, D. Modifications D’une Couche Mince Sur Un Substrat, Induites Par L’irradiation Mono-Impulsionnelle UV ns. Ph.D. Thesis, Université Paris-Saclay, Bures-sur-Yvette, France, 2022. [Google Scholar]
  17. Shimotsuma, Y.; Kazansky, P.G.; Qiu, J.R.; Hirao, K. Self-organized nanogratings in glass irradiated by ultrashort light pulses. Phys. Rev. Lett. 2003, 91, 247405. [Google Scholar] [CrossRef]
  18. Poumellec, B.; Lancry, M.; Chahid-Erraji, A.; Kazansky, P. Modification thresholds in femtosecond laser processing of pure silica: Review of dependencies on laser parameters [Invited]. Opt. Mater. Express 2011, 1, 766–782. [Google Scholar] [CrossRef]
  19. Bressel, L.; de Ligny, D.; Sonneville, C.; Martinez, V.; Mizeikis, V.; Buividas, R.; Juodkazis, S. Femtosecond laser induced density changes in GeO2 and SiO2 glasses: Fictive temperature effect [Invited]. Opt. Mater. Express 2011, 1, 605–613. [Google Scholar] [CrossRef]
  20. Couairon, A.; Sudrie, L.; Franco, M.; Prade, B.; Mysyrowicz, A. Filamentation and damage in fused silica induced by tightly focused femtosecond laser pulses. Phys. Rev. B 2005, 71, 125435. [Google Scholar] [CrossRef]
  21. Sudrie, L. Propagation Non-Linéaire des Impulsions Laser Femtosecondes Dans la Silice. Université de Paris Sud XI Orsay. 2002. Available online: https://ensta.hal.science/ENSTA-PARIS/tel-01188199 (accessed on 21 July 2025).
  22. Li, P.; Yan, Z.; Wang, L.; Xu, Y.; Lu, P.; Zhang, J. Advanced Transparent Glass-Ceramics via Laser Anisotropic Nanocrystallization. Laser Photonics Rev. 2024, 18, 2301403. [Google Scholar] [CrossRef]
  23. Miura, K.; Qiu, J.; Mitsuyu, T.; Hirao, K. Space-selective growth of frequency-conversion crystals in glasses with ultrashort infrared laser pulses. Opt. Lett. 2000, 25, 408–410. [Google Scholar] [CrossRef]
  24. Dai, Y.; Ma, H.L.; Lu, B.; Yu, B.K.; Zhu, B.; Qiu, J.R. Femtosecond laser-induced oriented precipitation of Ba2TiGe2O8 crystals in glass. Opt. Express 2008, 16, 3912–3917. [Google Scholar] [CrossRef]
  25. Komatsu, T.; Honma, T. Laser patterning and characterization of optical active crystals in glasses. J. Asian Ceram. Soc. 2013, 1, 9–16. [Google Scholar] [CrossRef]
  26. Bhardwaj, V.; Simova, E.; Rajeev, P.; Hnatovsky, C.; Taylor, R.; Rayner, D.; Corkum, P. Optically produced arrays of planar nanostructures inside fused silica. Phys. Rev. Lett. 2006, 96, 57404. [Google Scholar] [CrossRef] [PubMed]
  27. Fernandez, T.T.; Sakakura, M.; Eaton, S.M.; Sotillo, B.; Siegel, J.; Solis, J.; Shimotsuma, Y.; Miura, K. Bespoke photonic devices using ultrafast laser driven ion migration in glasses. Prog. Mater. Sci. 2018, 94, 68–113. [Google Scholar] [CrossRef]
  28. Sakakura, M.; Lei, Y.; Wang, L.; Yu, Y.-H.; Kazansky, P.G. Ultralow-loss geometric phase and polarization shaping by ultrafast laser writing in silica glass. Light Sci. Appl. 2020, 9, 15. [Google Scholar] [CrossRef]
  29. Rudenko, A.; Colombier, J.P.; Itina, T.E. From random inhomogeneities to periodic nanostructures induced in bulk silica by ultrashort laser. Phys. Rev. B 2016, 93, 075427. [Google Scholar] [CrossRef]
  30. Bricchi, E.; Klappauf, B.G.; Kazansky, P.G. Form birefringence and negative index change created by femtosecond direct writing in transparent materials. Opt. Lett. 2004, 29, 119–121. [Google Scholar] [CrossRef]
  31. Ktafi, I.; Cavillon, M.; Lancry, M.; Poumellec, B. Relation between porosity-based and crystal-based femtosecond laser induced nanogratings in oxide glasses. J. Am. Ceram. Soc. 2025, 1–20. [Google Scholar]
  32. Muzi, E.; Cavillon, M.; Lancry, M.; Brisset, F.; Sapaly, B.; Janner, D.; Poumellec, B. Polarization-oriented LiNbO3 nanocrystals by femtosecond laser irradiation in LiO2-Nb2O5-SiO2-B2O3 glasses. Opt. Mater. Express 2021, 11, 1313–1320. [Google Scholar] [CrossRef]
  33. Yao, H.; Xie, Q.; Cavillon, M.; Neuville, D.R.; Pugliese, D.; Janner, D.; Dai, Y.; Poumellec, B.; Lancry, M. Volume nanogratings inscribed by ultrafast IR laser in alumino-borosilicate glasses. Opt. Express 2023, 31, 15449–15460. [Google Scholar] [CrossRef]
  34. Xie, Q.; Cavillon, M.; Pugliese, D.; Janner, D.; Poumellec, B.; Lancry, M. On the Formation of Nanogratings in Commercial Oxide Glasses by Femtosecond Laser Direct Writing. Nanomaterials 2022, 12, 2986. [Google Scholar] [CrossRef]
  35. Poumellec, B.; Cavillon, M.; Lancry, M. Electrostatic Interpretation of Phase Separation Induced by Femtosecond Laser Light in Glass. Crystals 2023, 13, 393. [Google Scholar] [CrossRef]
  36. Cavillon, M.; Wang, Y.; Poumellec, B.; Brisset, F.; Lancry, M. Erasure of nanopores in silicate glasses induced by femtosecond laser irradiation in the Type II regime. Appl. Phys. A 2020, 126, 876. [Google Scholar] [CrossRef]
  37. Glezer, E.N.; Milosavljevic, M.; Huang, L.; Finlay, R.J.; Her, T.H.; Callan, J.P.; Mazur, E. Three-dimensional optical storage inside transparent materials. Opt. Lett. 1996, 21, 2023–2025. [Google Scholar] [CrossRef] [PubMed]
  38. Sosa, M.; Cavillon, M.; Blanchet, T.; Lancry, M.; Laffont, G. Spectral and Microscopic Behavior of Type III Femtosecond Fiber Bragg Gratings at High Temperatures. Micromachines 2025, 16, 331. [Google Scholar] [CrossRef]
  39. Poumellec, B.; Lancry, M. Kinetics of Thermally Activated Physical Processes in Disordered Media. Fibers 2015, 3, 206–252. [Google Scholar] [CrossRef]
  40. Que, R.; Lancry, M.; Poumellec, B. Usable Analytical Expressions for Temperature Distribution Induced by Ultrafast Laser Pulses in Dielectric Solids. Micromachines 2024, 15, 196. [Google Scholar] [CrossRef]
  41. Que, R.; Lancry, M.; Cavillon, M.; Poumellec, B. How to Crystallize Glass with a Femtosecond Laser. Crystals 2024, 14, 606. [Google Scholar] [CrossRef]
  42. Chichkov, B.N.; Momma, C.; Nolte, S.; Von Alvensleben, F.; Tünnermann, A. Femtosecond, picosecond and nanosecond laser ablation of solids. Appl. Phys. A 1996, 63, 109–115. [Google Scholar] [CrossRef]
  43. Tan, D.; Sharafudeen, K.N.; Yue, Y.; Qiu, J. Femtosecond laser induced phenomena in transparent solid materials: Fundamentals and applications. Prog. Mater. Sci. 2016, 76, 154–228. [Google Scholar] [CrossRef]
  44. Gattass, R.R.; Mazur, E. Femtosecond laser micromachining in transparent materials. Nat. Photonics 2008, 2, 219–225. [Google Scholar] [CrossRef]
  45. Davis, K.M.; Miura, K.; Sugimoto, N.; Hirao, K. Writing waveguides in glass with a femtosecond laser. Opt. Lett. 1996, 21, 1729–1731. [Google Scholar] [CrossRef] [PubMed]
  46. Glezer, E.N.; Mazur, E. Ultrafast-laser driven micro-explosions in transparent materials. Appl. Phys. Lett. 1997, 71, 882–884. [Google Scholar] [CrossRef]
  47. Schaffer, C.B.; Brodeur, A.; García, J.F.; Mazur, E. Micromachining bulk glass by use of femtosecond laser pulses with nanojoule energy. Opt. Lett. 2001, 26, 93. [Google Scholar] [CrossRef] [PubMed]
  48. Eaton, S.M.; Zhang, H.; Herman, P.R.; Yoshino, F.; Shah, L.; Bovatsek, J.; Arai, A.Y. Heat accumulation effects in femtosecond laser-written waveguides with variable repetition rate. Opt. Express 2005, 13, 4708–4716. [Google Scholar] [CrossRef]
  49. Eaton, S.; Zhang, H.; Ng, M.; Li, J.; Chen, W.; Ho, S.; Herman, P. Transition from thermal diffusion to heat accumulation in high repetition rate femtosecond laser writing of buried optical waveguides. Opt. Express 2008, 16, 9443–9458. [Google Scholar] [CrossRef]
  50. Liu, Y.; Zhu, B.; Wang, L.; Qiu, J.; Dai, Y.; Ma, H. Femtosecond laser induced coordination transformation and migration of ions in sodium borate glasses. Appl. Phys. Lett. 2008, 92, 121113. [Google Scholar] [CrossRef]
  51. Liu, Y.; Shimizu, M.; Zhu, B.; Dai, Y.; Qian, B.; Qiu, J.; Shimotsuma, Y.; Miura, K.; Hirao, K. Micromodification of element distribution in glass using femtosecond laser irradiation. Opt. Lett. 2009, 34, 136–138. [Google Scholar] [CrossRef]
  52. Shimizu, M.; Sakakura, M.; Kanehira, S.; Nishi, M.; Shimotsuma, Y.; Hirao, K.; Miura, K. Formation mechanism of element distribution in glass under femtosecond laser irradiation. Opt. Lett. 2011, 36, 2161–2163. [Google Scholar] [CrossRef]
  53. Zhu, B.; Dai, Y.; Ma, H.; Zhang, S.; Lin, G.; Qiu, J. Femtosecond laser induced space-selective precipitation of nonlinear optical crystals in rare-earth-doped glasses. Opt. Express 2007, 15, 6069–6074. [Google Scholar] [CrossRef]
  54. Dai, Y.; Zhu, B.; Qiu, J.R.; Ma, H.L.; Lu, B.; Cao, S.X.; Yu, B.K. Direct writing three-dimensional Ba2TiSi2O8 crystalline pattern in glass with ultrashort pulse laser. Appl. Phys. Lett. 2007, 90, 181109. [Google Scholar] [CrossRef]
  55. Zoubir, A.; Rivero, C.; Grodsky, R.; Richardson, K.; Richardson, M.; Cardinal, T.; Couzi, M. Laser-induced defects in fused silica by femtosecond IR irradiation. Phys. Rev. B 2006, 73, 224117. [Google Scholar] [CrossRef]
  56. Anderson, O.L. Cooling time of strong glass fibers. J. Appl. Phys. 1958, 29, 9–12. [Google Scholar] [CrossRef]
  57. Tool, A. Relation between inelastic deformability and theram expansion of glass in its annealing range. J. Am. Ceram. Soc. 1946, 29, 240–253. [Google Scholar] [CrossRef]
  58. Zheng, Q.; Mauro, J.C. Viscosity of glass-forming systems. J. Am. Ceram. Soc. 2017, 100, 6–25. [Google Scholar] [CrossRef]
  59. Shelby, J.E. Density of vitreous silica. J. Non-Cryst. Solids 2004, 349, 331–336. [Google Scholar] [CrossRef]
  60. Ritland, H. Relation Between Refractive Index and Density of a Glass at Constant Temperature. J. Am. Ceram. Soc. 2006, 38, 86–88. [Google Scholar] [CrossRef]
  61. Kakiuchida, H.; Saito, K.; Ikushima, A.J. Refractive Index, Density and Polarizability of Silica Glass with Various Fictive Temperatures. Jpn. J. Appl. Phys. 2004, 43, L743–L745. [Google Scholar] [CrossRef]
  62. Lei, Y. Laser Modification of Materials at Micro- and Nanoscale for Photonics and Information Technology. Ph.D. Thesis, University of Southampton, Southampton, UK, 2023. [Google Scholar]
  63. Lei, Y.; Wang, H.; Shayeganrad, G.; Svirko, Y.; Kazansky, P. Controlling ultrafast laser writing in silica glass by pulse temporal contrast. Opt. Lett. 2024, 49, 2385. [Google Scholar] [CrossRef]
  64. Desmarchelier, R.; Poumellec, B.; Brisset, F.; Mazerat, S.; Lancry, M. In the Heart of Femtosecond Laser Induced Nanogratings: From Porous Nanoplanes to Form Birefringence. World J. Nano Sci. Eng. 2015, 5, 115–125. [Google Scholar] [CrossRef]
  65. Yang, W.; Bricchi, E.; Kazansky, P.; Bovatsek, J.; Arai, A. Self-assembled periodic sub-wavelength structures by femtosecond laser direct writing. Opt. Express 2006, 14, 10117–10124. [Google Scholar] [CrossRef] [PubMed]
  66. Lancry, M.; Zimmerman, F.; Desmarchelier, R.; Tian, J.; Brisset, F.; Nolte, S.; Poumellec, B. Nanogratings formation in multicomponent silicate glasses. Appl. Phys. B-Lasers Opt. 2016, 122, 66. [Google Scholar] [CrossRef]
  67. Xie, Q.; Cavillon, M.; Poumellec, B.; Pugliese, D.; Janner, D.; Lancry, M. Application and validation of a viscosity approach to the existence of nanogratings in oxide glasses. Opt. Mater. 2022, 130, 112576. [Google Scholar] [CrossRef]
  68. Liu, W.; Petit, S.; Becker, A.; Aközbek, N.; Bowden, C.M.; Chin, S.L. Intensity clamping of a femtosecond laser pulse in condensed matter. Opt. Commun. 2002, 202, 189–197. [Google Scholar] [CrossRef]
  69. van der Tempel, L.; Melis, G.P.; Brandsma, T.C. Thermal Conductivity of a Glass: I. Measurement by the Glass–Metal Contact. Glass Phys. Chem. 2000, 26, 606–611. [Google Scholar] [CrossRef]
  70. Nascimento, M.L.F.; Aparicio, C. Data classification with the Vogel–Fulcher–Tammann–Hesse viscosity equation using correspondence analysis. Phys. B Condens. Matter 2007, 398, 71–77. [Google Scholar] [CrossRef]
  71. Vogel, W. Glass Chemistry; Springer: Berlin/Heidelberg, Germany, 1994. [Google Scholar]
  72. Rault, J. Origin of the Vogel–Fulcher–Tammann law in glass-forming materials: The α–β bifurcation. J. Non-Cryst. Solids 2000, 271, 177–217. [Google Scholar] [CrossRef]
  73. Miyamoto, I.; Horn, A.; Gottmann, J. Local Melting of Glass Material and Its Application to Direct Fusion Welding by Ps-laser Pulses. J. Laser Micro Nanoeng. 2007, 2, 7–14. [Google Scholar] [CrossRef]
  74. Wang, Y. A Contribution to High Temperature Applications Using Femtosecond Laser Direct Writing in Silica-Based Glasses and Optical Fibers. Ph.D. Thesis, Université Paris-Saclay, Orsay, France, 2021. [Google Scholar]
  75. Ashcom, J.B.; Gattass, R.R.; Schaffer, C.B.; Mazur, E. Numerical aperture dependence of damage and supercontinuum generation from femtosecond laser pulses in bulk fused silica. J. Opt. Soc. Am. B 2006, 23, 2317–2322. [Google Scholar] [CrossRef]
Figure 1. Spatial distribution of dimensionless Tmin (blue dash, by Equation (A3)) and Tmax (red, by Equation (A2)) according to the relative radius rw when (a) R τ = 0.1 , (b) R τ = 1 , and (c) R τ = 10 . N.B. rw = r/w, Tmax and Tmin are relative to T 00 = A ( E p ) · E p π 3 2 ρ C p w ( E p , R R ) 3 , which is the absolute maximum induced by one pulse and depends only on Ep in silica. Figure extracted from [40].
Micromachines 16 00970 g001
Figure 2. Comparison of Tmin (blue dashed line), Tmax (red) and Tosc (green dashed line, see Appendix B for its expression) for RR = 5 kHz. (a) at the center of the beam, (b) at the edge of the heat affected region. We note that Tf is changing a bit with the radius (slightly larger at the edge of the modified region). Note also that Tmin remains clearly below the relaxation curve for this RR. N.B. the relaxation temperature Tr and Tr2 have been shifted by 300 K.
Micromachines 16 00970 g002
Figure 3. Computation with Ep = 1.1 µJ with the same RR. By comparison with Figure 2, we deduce the variation of Tf with Ep; here, about −110 K for 11 µJ increase at 5 kHz. N.B. the relaxation temperature Tr and Tr2 have been shifted by 300 K.
Micromachines 16 00970 g003
Figure 4. Computation with RR = 50 kHz. (a) at the center of the beam, (b) at the edge of the heat affected region. As for 5 kHz (Figure 2), Tf is slightly increasing at the edge of the modified region. Note that the width of the heat-affected region is 30% larger than the beam. N.B. the relaxation temperatures Tr and Tr2 have been shifted by 300 K.
Micromachines 16 00970 g004
Figure 5. By comparison with Figure 4a, we see the variation in Tf with Ep; a decrease of 100 K for an increase in Ep of 3 µJ. N.B. the relaxation temperature Tr and Tr2 have been shifted by 300 K.
Micromachines 16 00970 g005
Figure 6. Beginning of glass relaxation curve (Tmax is overcoming the relaxation time).
Micromachines 16 00970 g006
Figure 7. Erasure conditions for pNG at 20 kHz and v = 100 μ/s, at the center; (a) the solution for Tmax to reach the 5% erasure is 6.5 μJ, so with w = 5.2 μm, A = 0.65 and = 5. The time appears at 0.002 s. (b) The solution for Tmin to reach the 99% erasure is 9 μJ, so with w = 5.7 μm, A = 0.71, and = 4.3. The time appears at 0.004 s.
Micromachines 16 00970 g007
Figure 8. Conditions for complete erasure of pNG (Tmin overcomes the 99% stability curve) for 20 kHz, v = 100 μ/s, solution with 20 μJ, so with w = 6.8 μm, A = 0.85 and = 3. The erasure time appears at 0.01 s.
Micromachines 16 00970 g008
Figure 9. Erasure conditions for pNG at 2 kHz and v = 100 μ/s; the solution for Tmax to reach the 5% erasure is 14 μJ, so with w = 5.84 μm, A = 0.73 and = 41. The time appears at 0.002 s. Note that Tmin is no longer influenced by the pulse energy. Total erasure is never possible.
Micromachines 16 00970 g009
Figure 10. Landscape Ep-RR for type IIp according to the RP model and the thermal model. The curve at the lowest pulse energy is for the beginning of pNG erasure (Tmax is just touching the stability curve for 5% erasure). The curve at the highest pulse energy is for total pNG erasure (Tmin reaches the stability curve for 99% erasure). It is interrupted for RR lower than 10 kHz when pulse energy becomes too large to be applicable. In that case, it is considered that the total erasure is no longer possible. The curve for intermediate pNG erasure is for when Tmax reaches the stability curve for 99% erasure.
Micromachines 16 00970 g010
Disclaimer/Publisher’s Note: The statements, opinions and data contained in all publications are solely those of the individual author(s) and contributor(s) and not of MDPI and/or the editor(s). MDPI and/or the editor(s) disclaim responsibility for any injury to people or property resulting from any ideas, methods, instructions or products referred to in the content.