Article

Quantum Sensing of Local Magnetic Phase Transitions and Fluctuations near the Curie Temperature in Tm3Fe5O12 Using NV Centers

1
Department of Physics, University of Science and Technology of China, Hefei 230026, China
2
Key Laboratory of Strongly-Coupled Matter Physics, Chinese Academy of Sciences, Hefei 230026, China
*
Author to whom correspondence should be addressed.
Micromachines 2025, 16(6), 643; https://doi.org/10.3390/mi16060643
Submission received: 23 April 2025 / Revised: 18 May 2025 / Accepted: 26 May 2025 / Published: 28 May 2025

Abstract

:
Thulium iron garnet (Tm3Fe5O12, TmIG) is a promising material for next-generation spintronic and quantum technologies owing to its high Curie temperature and strong perpendicular magnetic anisotropy. However, conventional magnetometry techniques are limited by insufficient spatial resolution and sensitivity to probe local magnetic phase transitions and critical spin dynamics in thin films. In this study, we present the first quantitative investigation of local magnetic field fluctuations near the Curie temperature in TmIG thin films using nitrogen-vacancy (NV) center-based quantum sensing. By integrating optically detected magnetic resonance (ODMR) and NV spin relaxometry (T1 measurements) with macroscopic techniques such as SQUID magnetometry and Hall effect measurements, we systematically characterize both the static magnetization and dynamic spin fluctuations across the magnetic phase transition. Our results reveal a pronounced enhancement in NV spin relaxation rates near 360 K, providing direct evidence of critical spin fluctuations at the nanoscale. This work highlights the unique advantages of NV quantum sensors for investigating dynamic critical phenomena in complex magnetic systems and establishes a versatile, multimodal framework for studying local phase transition kinetics in high-temperature magnetic insulators.

1. Introduction

Recent advances in quantum materials have driven significant progress in spintronics and quantum technologies, with ferrite magnets like Tm3Fe5O12 (TmIG) attracting attention due to their high Curie temperatures and strong magnetic anisotropy [1,2,3,4]. These properties make TmIG an excellent platform for investigating high-temperature spintronic devices and magnetic memory systems [5,6,7,8]. However, characterizing such materials at the nanoscale remains challenging, as conventional techniques—including SQUID magnetometry and MFM—suffer from limited spatial resolution, thermal noise interference, and stringent operational conditions [9,10,11,12].
Solid-state quantum sensors, particularly nitrogen-vacancy (NV) centers in diamond, have emerged as transformative tools for nanoscale magnetism research [13,14,15]. Their unique advantages, such as ambient-temperature operation, noninvasive detection, and compatibility with extreme environments, enable precise mapping of both static and dynamic magnetic fields in complex systems [16,17,18]. Complementarily, Hall effect measurements provide critical insights into spin transport and magnetic phase transitions through electrical readouts [19].
Here, we integrate NV quantum magnetometry with Hall transport characterization to systematically investigate TmIG’s magnetic behavior across its Curie temperature. Importantly, this study represents the first quantitative investigation of dynamic magnetic field fluctuations in the critical region of the phase transition in TmIG thin films, providing new insights into local spin dynamics near TC. NV ensemble measurements reveal temperature-dependent magnetization dynamics, while Hall resistance analysis uncovers magnetic anomalies near the phase transition. This dual-modality approach not only resolves the limitations of traditional characterization methods but also establishes a universal framework for probing high Curie temperature materials, advancing both fundamental understanding and device engineering in quantum magnetism.

2. Materials and Methods

2.1. Sample and Diamond NV Sensor Preparation

Tm3Fe5O12 (TmIG) thin films were fabricated using an AJA RF magnetron sputtering system with a 3-inch diameter TmIG ceramic target (99.9% purity) onto 10 × 10 mm2 Gd3Ga5O12 (111) single-crystal substrates (lattice constant: 12.383 Å). Prior to deposition, the substrates were ultrasonically cleaned for 10 min sequentially in acetone, isopropanol, and deionized water, then dried with high-purity nitrogen and immediately loaded into the sputtering chamber, which was evacuated to a base pressure below 5 × 10⁻⁷ Torr. During deposition, the substrate temperature was maintained at 700 °C with an RF power of 100 W, a working pressure of 1.5 Pa, and an Ar/O2 flow ratio of 4:1. The target-to-substrate distance was set at 10 cm. The target was pre-sputtered for 20 min to remove surface contaminants and stabilize the sputtering conditions. The film growth rate was approximately 2.5 nm/min, resulting in a film thickness of approximately 20 nm. After deposition, the films were in situ annealed at 700 °C for 10 min and subsequently cooled to room temperature at a rate of 50 °C/min to enhance crystallinity and reduce oxygen vacancy concentration.
The diamond NV sensor was prepared by first growing high-purity single-crystal [100]-oriented diamond via chemical vapor deposition (CVD), followed by cutting and mechanical polishing to obtain a [111]-oriented substrate, thereby optimizing magnetic field sensitivity for subsequent measurements. Shallow NV centers were created by implanting 14N⁺ ions at an energy of 5 keV and a dose of 1013 ions/cm2, resulting in an NV layer located approximately 7 nm beneath the diamond surface. Post-implantation annealing was conducted at 800 °C for 2 h under a vacuum of 5 × 10⁻⁵ Pa to promote vacancy–nitrogen complex formation. Finally, the diamond was cleaned using a mixed acid solution of concentrated H2SO4, HNO3, and HClO4 (1:1:1 by volume) at 220 °C for 2 h to remove surface graphitic carbon and residual contaminants. The resulting [111]-oriented, shallow NV-doped diamond exhibited a uniform NV distribution, high optical quality, and excellent quantum magnetic sensing performance.

2.2. Magnetic Property and Electrical Transport Measurements

The magnetic and transport properties of the Tm3Fe5O12 films were systematically investigated under controlled and reproducible conditions.

2.2.1. Magnetometry Measurements

Magnetization hysteresis (M-H) loops were measured at 300 K using a Quantum Design MPMS3 system in vibrating sample magnetometer (VSM) mode. For M-H characterization, samples were mounted using plastic drinking straws and placed perpendicular to the applied magnetic field (out-of-plane geometry). The magnetic field was swept from −20,000 Oe to +20,000 Oe, with a 10 Oe step size near zero field for detailed coercivity resolution, and 100 Oe steps at higher fields. The magnetization signal at each field was recorded after stabilization (dwell time ≥ 2 s).
Temperature-dependent magnetization (M-T) curves were acquired on the same system in field-cooled (FC) mode, with the sample mounted on a clean quartz rod to minimize background. Measurements were performed under a constant out-of-plane field of 5 kOe from 300 K to 380 K in 0.5 K increments. At each temperature, the sample was stabilized for at least 2 min before measurement, and each data point was averaged over three independent runs to ensure reproducibility.

2.2.2. Electrical Transport Measurements

Hall bar devices (channeldimensions: 200 µm × 20 µm) were fabricated via photolithography and Ar ion milling. Longitudinal and transverse resistivities were measured in a Quantum Design PPMS system (five-probe configuration), with excitation currents of 100 µA unless otherwise specified. Resistivity and Hall data were collected from 2 K to 360 K at 1 K intervals; each point represents an average of three measurements. Hall voltages were recorded under alternating magnetic field polarities to suppress thermoelectric contributions. Prior to each measurement, thermal equilibration was ensured for at least 1 min. The resulting data were further processed using the Savitzky–Golay smoothing algorithm to enhance signal quality and resolution.

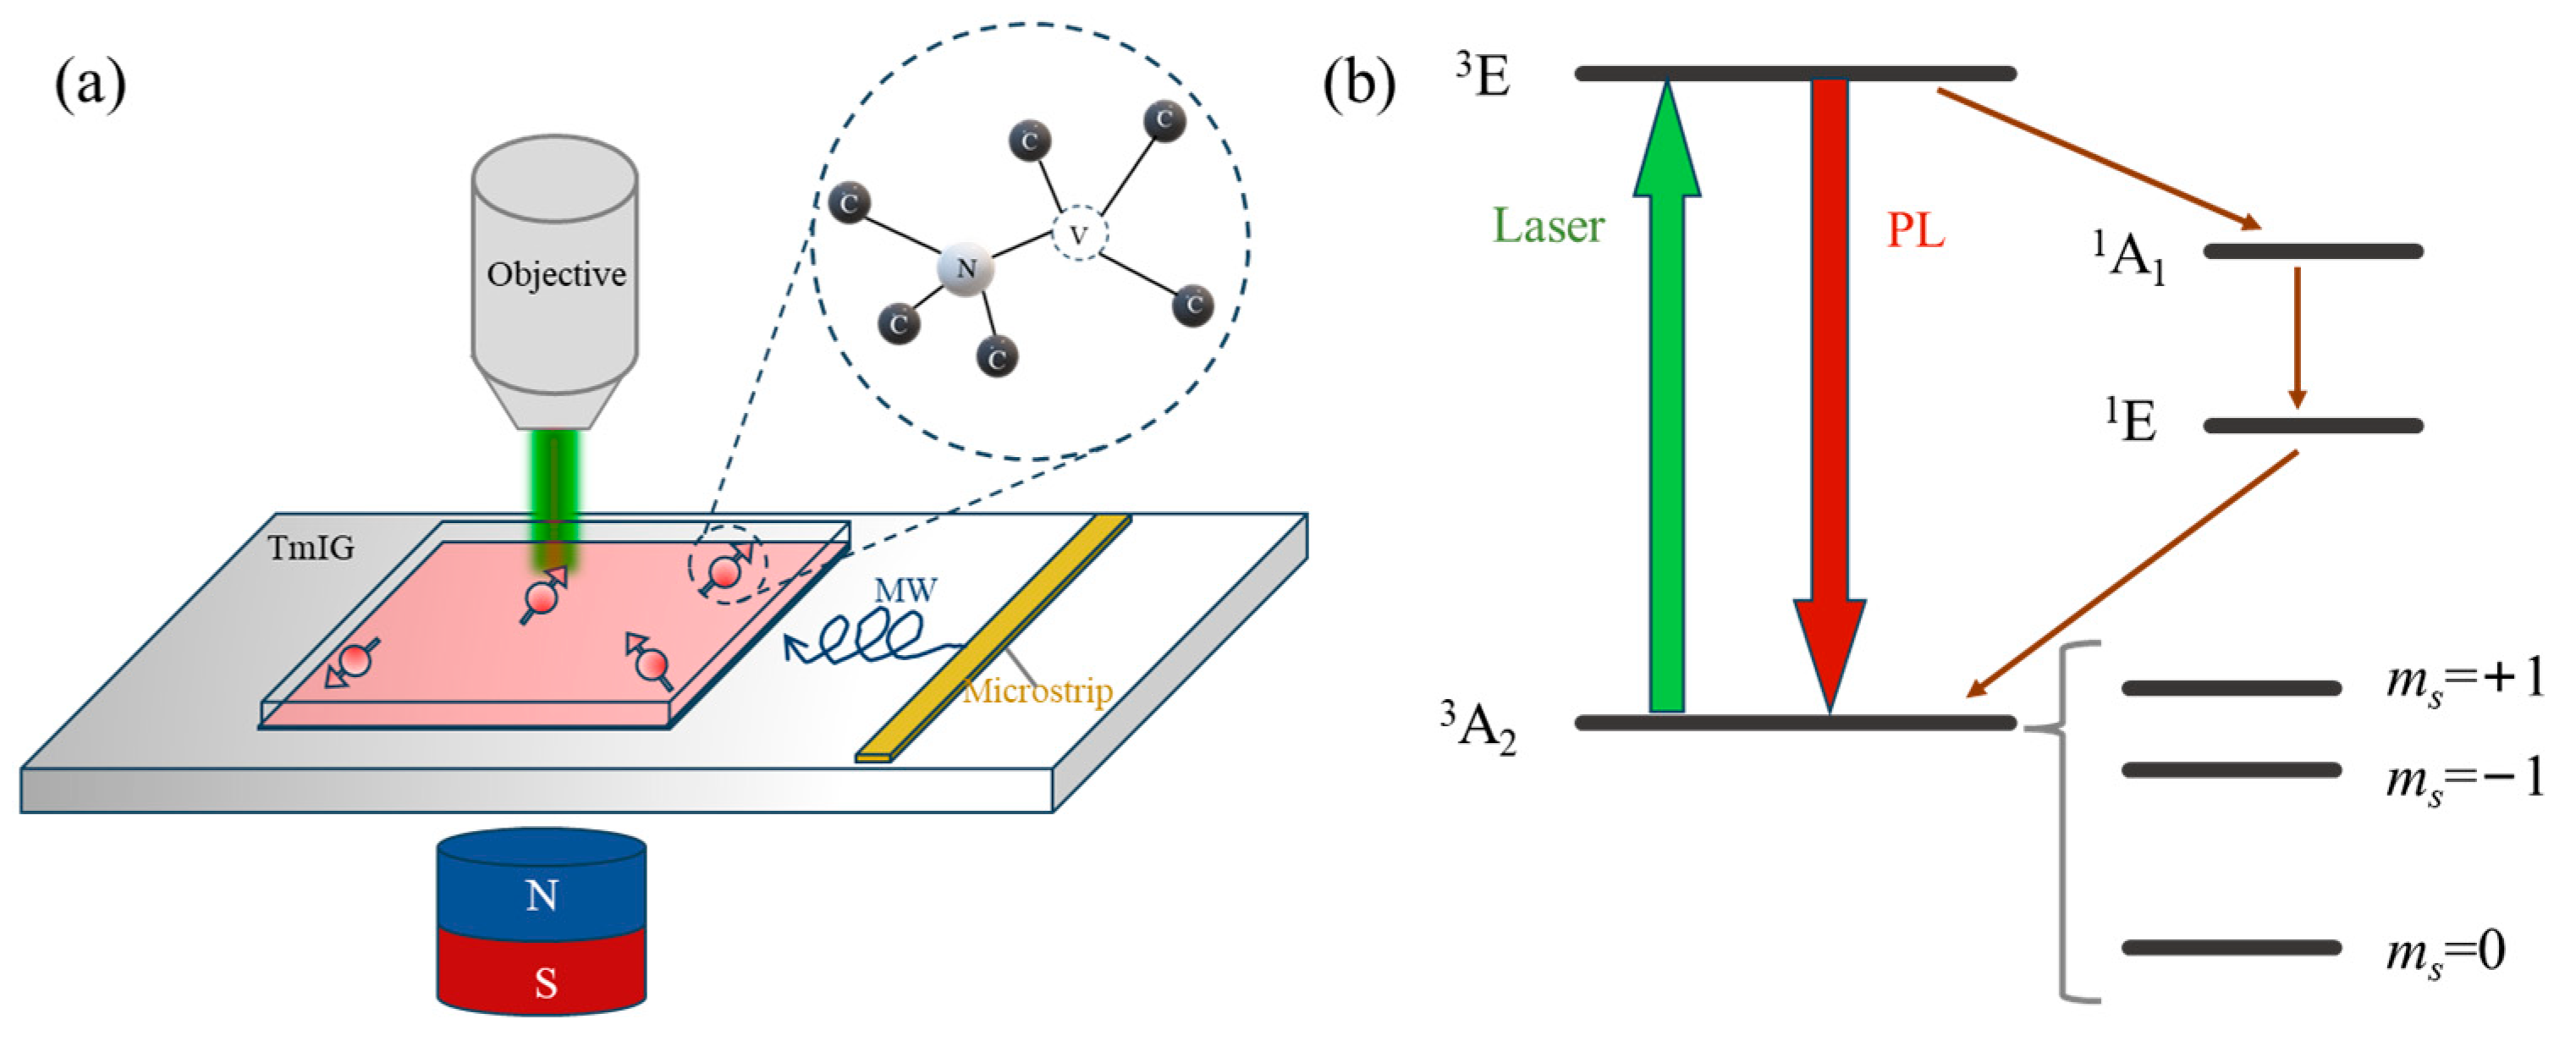
2.3. Diamond NV Magnetometry Experimental Platform

A custom diamond NV magnetometry platform was developed for high-sensitivity, noninvasive measurement of local magnetic fields in Tm3Fe5O12 thin films, as schematically shown in Figure 1a. The [111]-oriented diamond containing a shallow NV ensemble was placed in direct contact with the sample. Optical excitation (532 nm) and fluorescence detection were achieved via a high-numerical-aperture objective (NA = 0.9), which enables efficient collection of NV center fluorescence and provides submicron spatial resolution. Microwave (MW) fields were delivered via a 30 μm copper wire, and a tunable external magnetic bias was generated by a movable NdFeB permanent magnet. Laser excitation was delivered from the diamond backside to accommodate substrate thickness and maximize fluorescence collection efficiency.
In our confocal NV-based magnetometry setup, the lateral spatial resolution is determined by the optical diffraction limit of the objective (NA = 0.9, λ = 532 nm), yielding a spot size of approximately 360 nm. This means that each measurement probes the local magnetic field within a submicron-scale volume. The depth sensitivity is governed by the average NV implantation depth, which in this study is approximately 7 nm beneath the diamond surface. While the current experimental platform operates in a point-by-point mode without full 2D mapping or variable-depth profiling, this approach still provides substantial advantages for local magnetic characterization compared to conventional techniques.
The diamond NV center’s ground state spin triplet (S = 1) enables vector magnetic sensing by optically detected magnetic resonance (ODMR). The presence of an external magnetic field leads to Zeeman splitting of the ms = ±1 states, described by the following Hamiltonian (the energy levels and working principle are illustrated in Figure 1b) [20]:
H = D S z 2 + E S x 2 S y 2 + γ e B S
where D is the zero-field splitting, E denotes strain-induced splitting, γe = 2.8 MHz/G is the electron gyromagnetic ratio, B is the external magnetic field, and S is the electron spin operator. The spin states of the NV center can be optically initialized and read out, with spin-selective nonradiative decay processes leading to spin-state-dependent photoluminescence intensity, enabling spin-state discrimination (as shown in Figure 1b).
By applying a microwave field with a frequency resonant with the energy splitting between the ms = 0 and ms = ±1 spin states, ODMR enables determination of the static magnetic field’s magnitude and orientation. When the external magnetic field is oriented along the [111] direction, the Zeeman splitting between the two outer ODMR resonances is as follows [21]:
Δ v = 2 γ e B N V
where Δν is the frequency separation between the ODMR dips and BNV is the magnetic field projection along the NV axis. Thus, the local field can be obtained straightforwardly as follows:
B N V = Δ v 2 γ e
System sensitivity (~1.6 μT/√Hz) is established by fitting the ODMR spectrum under typical conditions. Accurate temperature calibration is achieved by tracking the zero-field splitting parameter D as a function of temperature. In our experiments, multiple reference point measurements showed that variations in D remained within 0.1 MHz, corresponding to a temperature drift rate below 1.5 K/h. This demonstrates excellent thermal stability of the system, with reference point control ensuring thermal uniformity throughout all measurements. All experimental measurements—both static and dynamic—are synchronized through integrated hardware and software control.
This highly integrated system enables quantitative measurement of static and dynamic magnetic properties of Tm3Fe5O12 thin films over a wide temperature range, enabling detailed investigations of magnetic phase transitions and local magnetic phenomena at the microscale.

3. Results

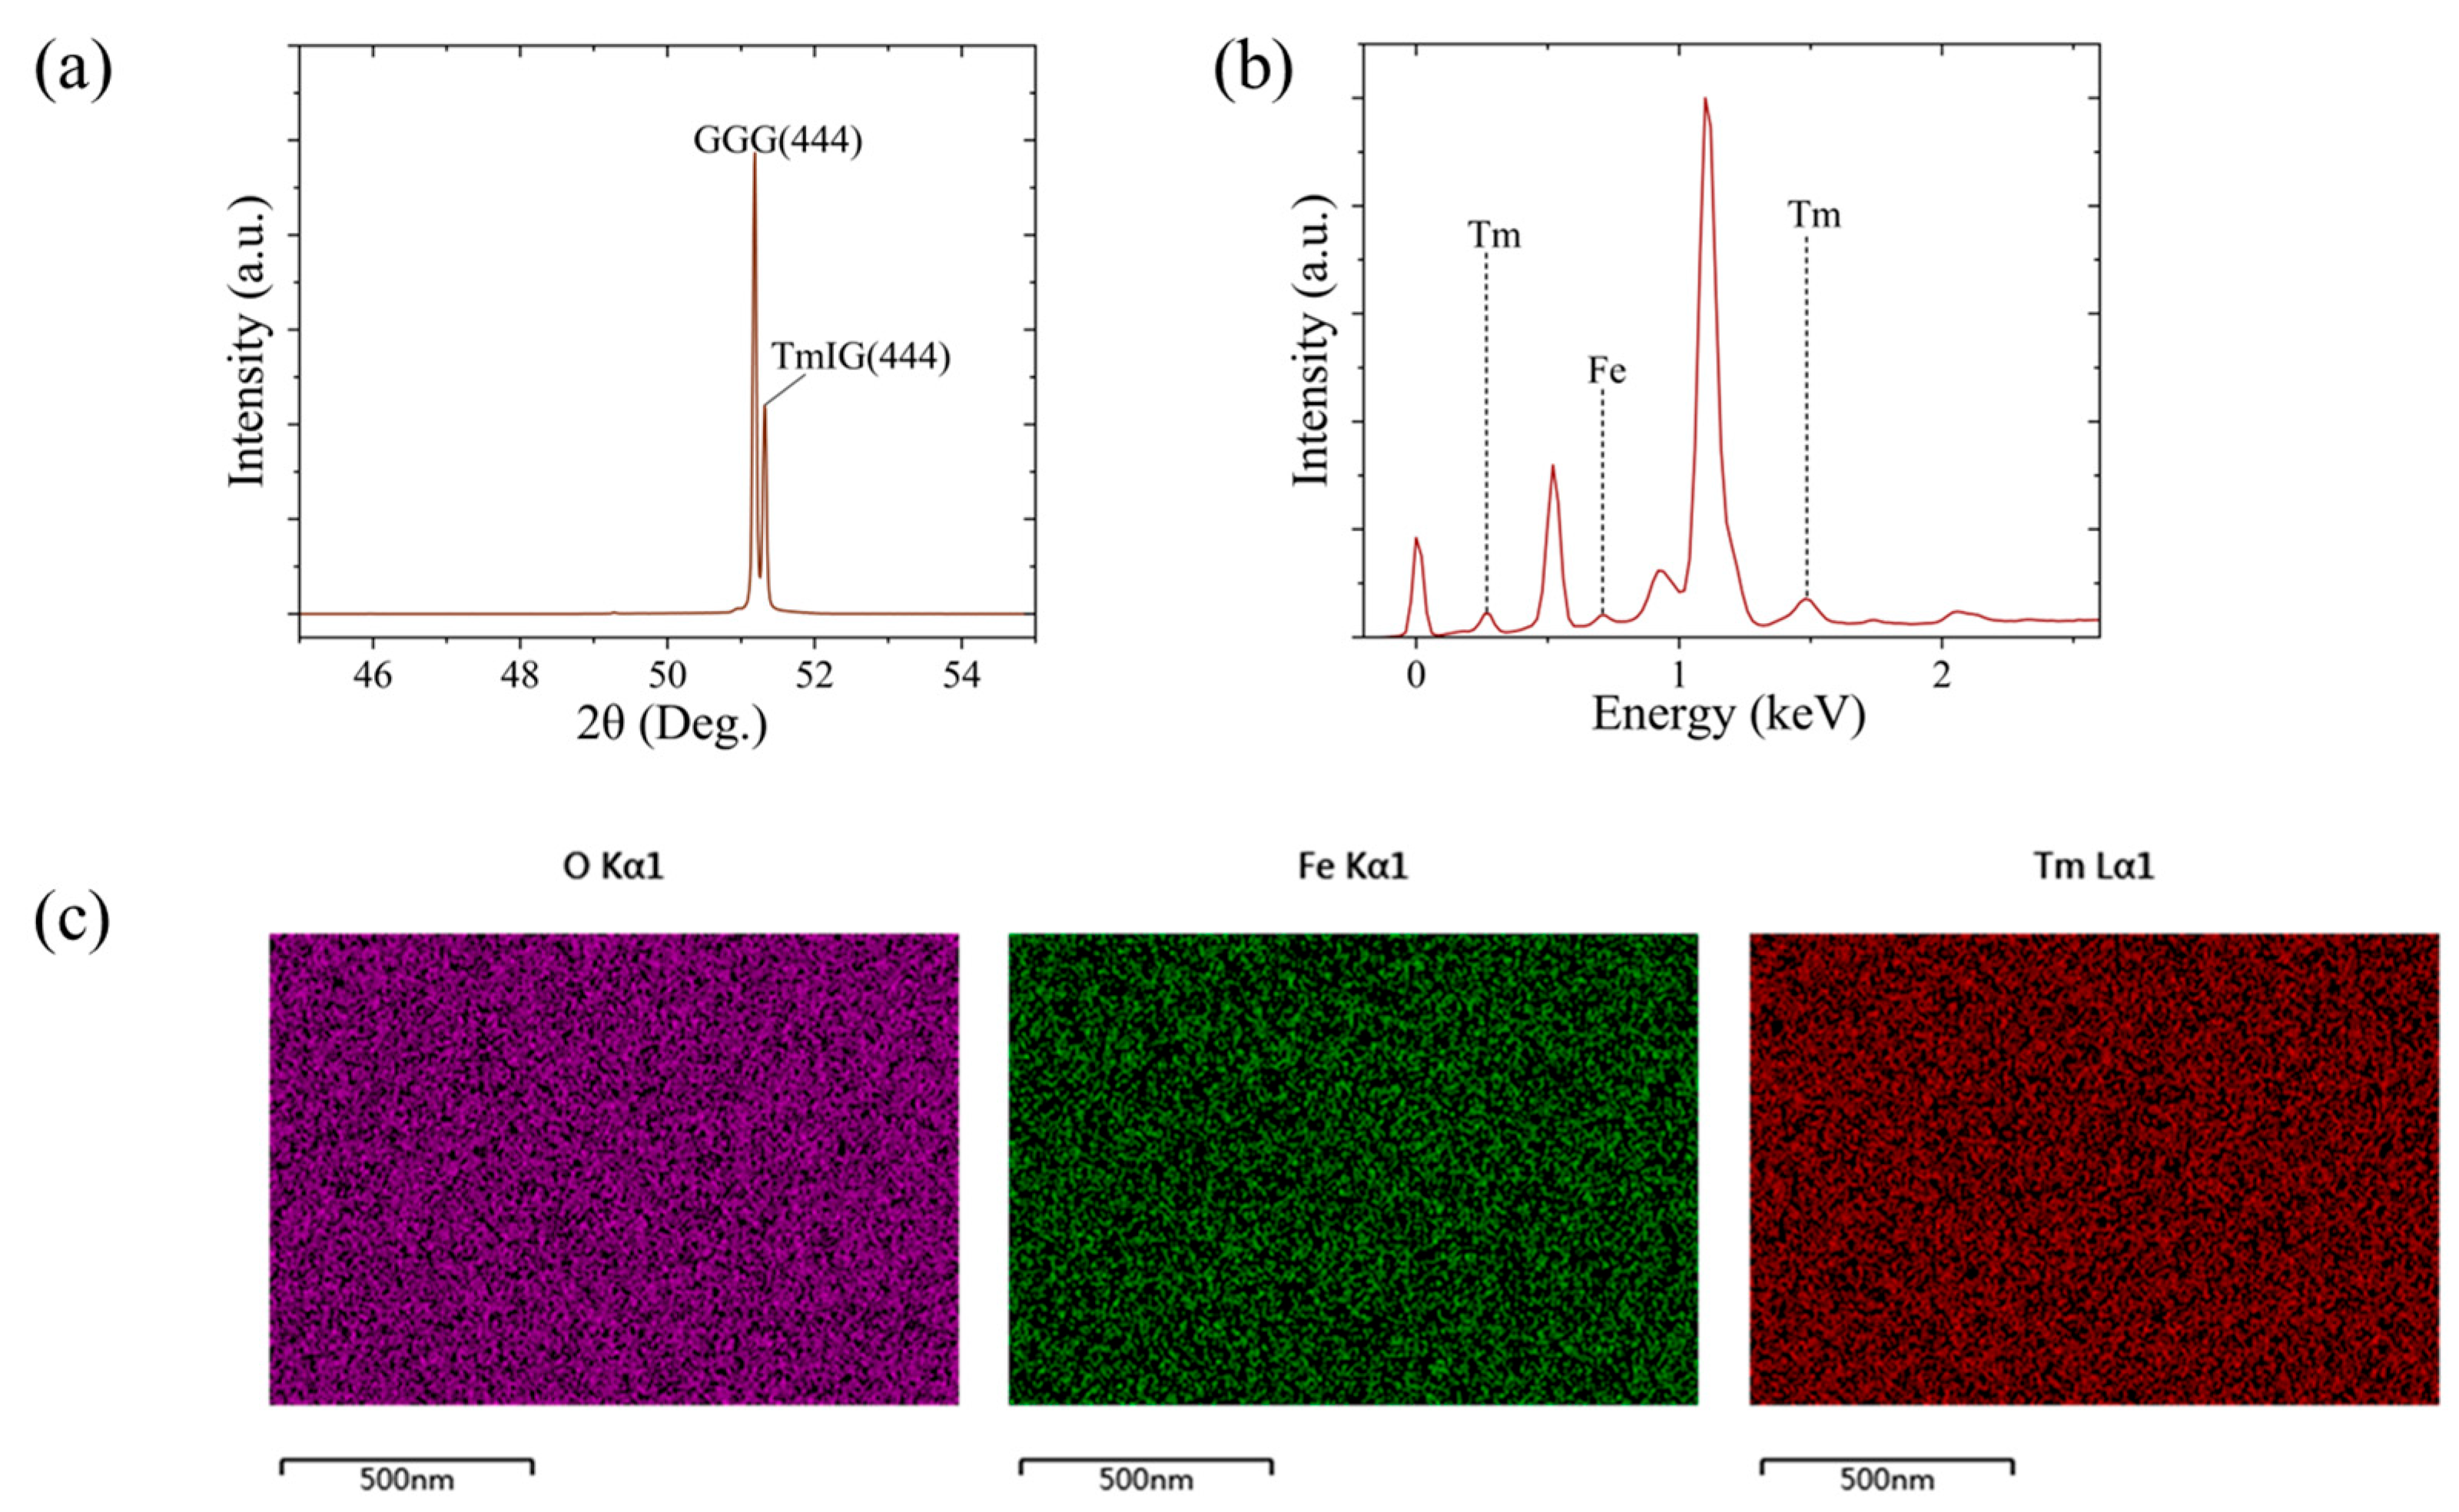
3.1. Structural and Compositional Characterization of TmIG Films

Tm3Fe5O12 is a garnet-type oxide with a cubic lattice structure in which the magnetism arises primarily from the ordered arrangement of Fe3⁺ ions and their interaction with rare-earth Tm3⁺ ions [22,23]. Figure 2 presents the structural and compositional characterization of TmIG films grown on Gd3Ga5O12 (111) substrates. The X-ray diffraction (XRD) 2θ–ω scan shown in Figure 2a reveals distinct, sharp peaks exclusively from TmIG and the GGG substrate, with no impurity phases detected, confirming high phase purity and crystalline quality. Notably, the TmIG (444) peak centers at 51.32°, exhibiting an FWHM less than 0.05°, indicating the high crystalline quality of the film. Lattice parameters derived from peak positions are 12.33 Å for the film and 12.35 Å for the substrate, yielding a minor in-plane lattice mismatch of −0.16%. Figure 2b displays the energy-dispersive X-ray spectroscopy (EDS) results, revealing that the measured elemental ratios are consistent with the stoichiometric composition, with deviations less than 2%. The scanning electron microscopy–energy dispersive X-ray spectroscopy (SEM-EDS) elemental mapping in Figure 2c demonstrates a uniform spatial distribution of Tm, Fe, and O throughout the film and substrate, with no observable aggregation or deficiency. These findings establish the high structural integrity and chemical uniformity of our TmIG films, ensuring a solid base for ensuing magnetic and NV sensing investigations.

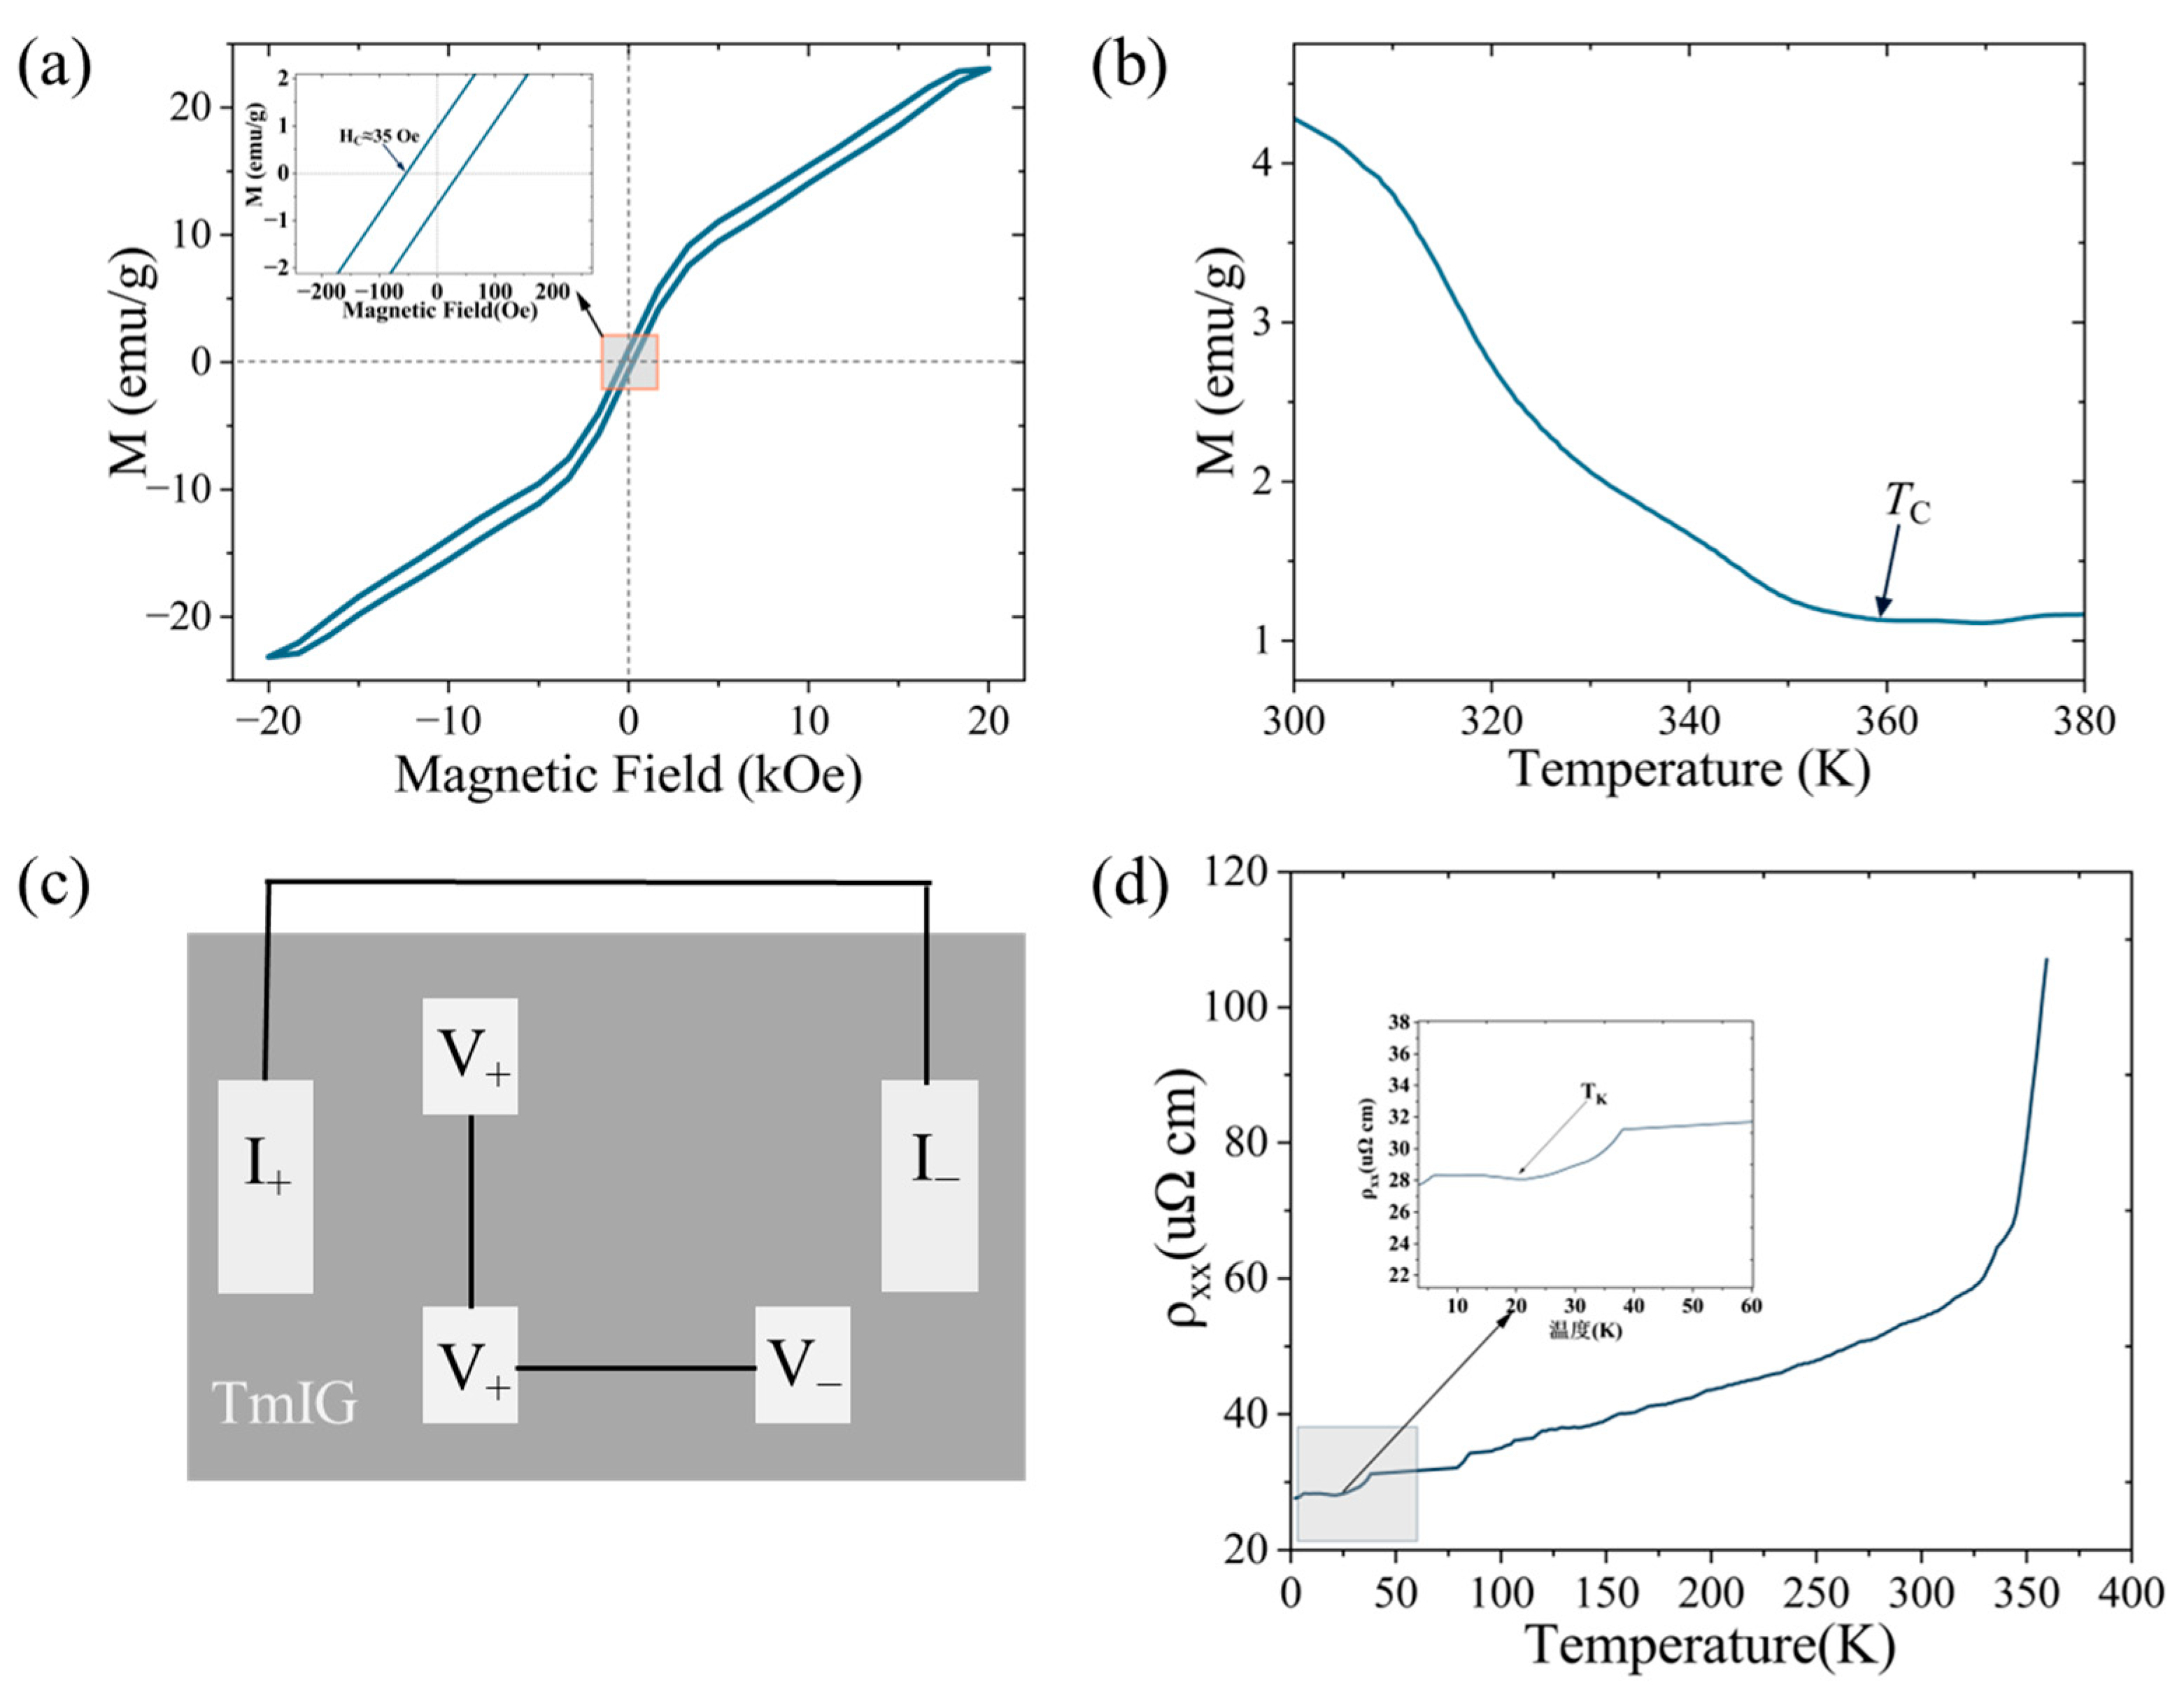
3.2. Basic Properties of Magnetism and Electricity in TmIG Films

After confirming the high structural quality and compositional uniformity of the TmIG thin films, we systematically investigated their key magnetic and electrical transport properties. As shown in Figure 3a, the M-H loop measured at 300 K displays a hysteresis loop, with a coercivity of 35 Oe. These features demonstrate robust ferromagnetism and strong perpendicular magnetic anisotropy, which are both attributable to the optimized fabrication process and a uniform magnetic domain structure with minimal pinning.
Figure 3b presents the M-T curve, which demonstrates a smooth second-order ferromagnetic–paramagnetic transition near 360 K, in good agreement with theoretical expectations and with the requirements for spintronic and quantum sensing applications.
The electrical transport properties are shown in Figure 3c,d, where the device exhibits quasi-metallic resistivity behavior between 50 and 300 K, clear Kondo scattering at low temperatures (~20 K), and a prominent resistivity upturn near the Curie temperature (TC) due to enhanced magnetic fluctuations [24]. These comprehensive magnetic and transport assessments provide a strong foundation for the subsequent NV-center-based local phase transition studies.
Overall, TmIG thin films exhibit excellent ferromagnetic and tunable electrical properties, together with evident magnetic fluctuation features near the Curie point, thus serving as an ideal platform for subsequent NV-center-based local magnetic phase transition investigations.

3.3. Local Magnetic Detection Result by Diamond NV Centers

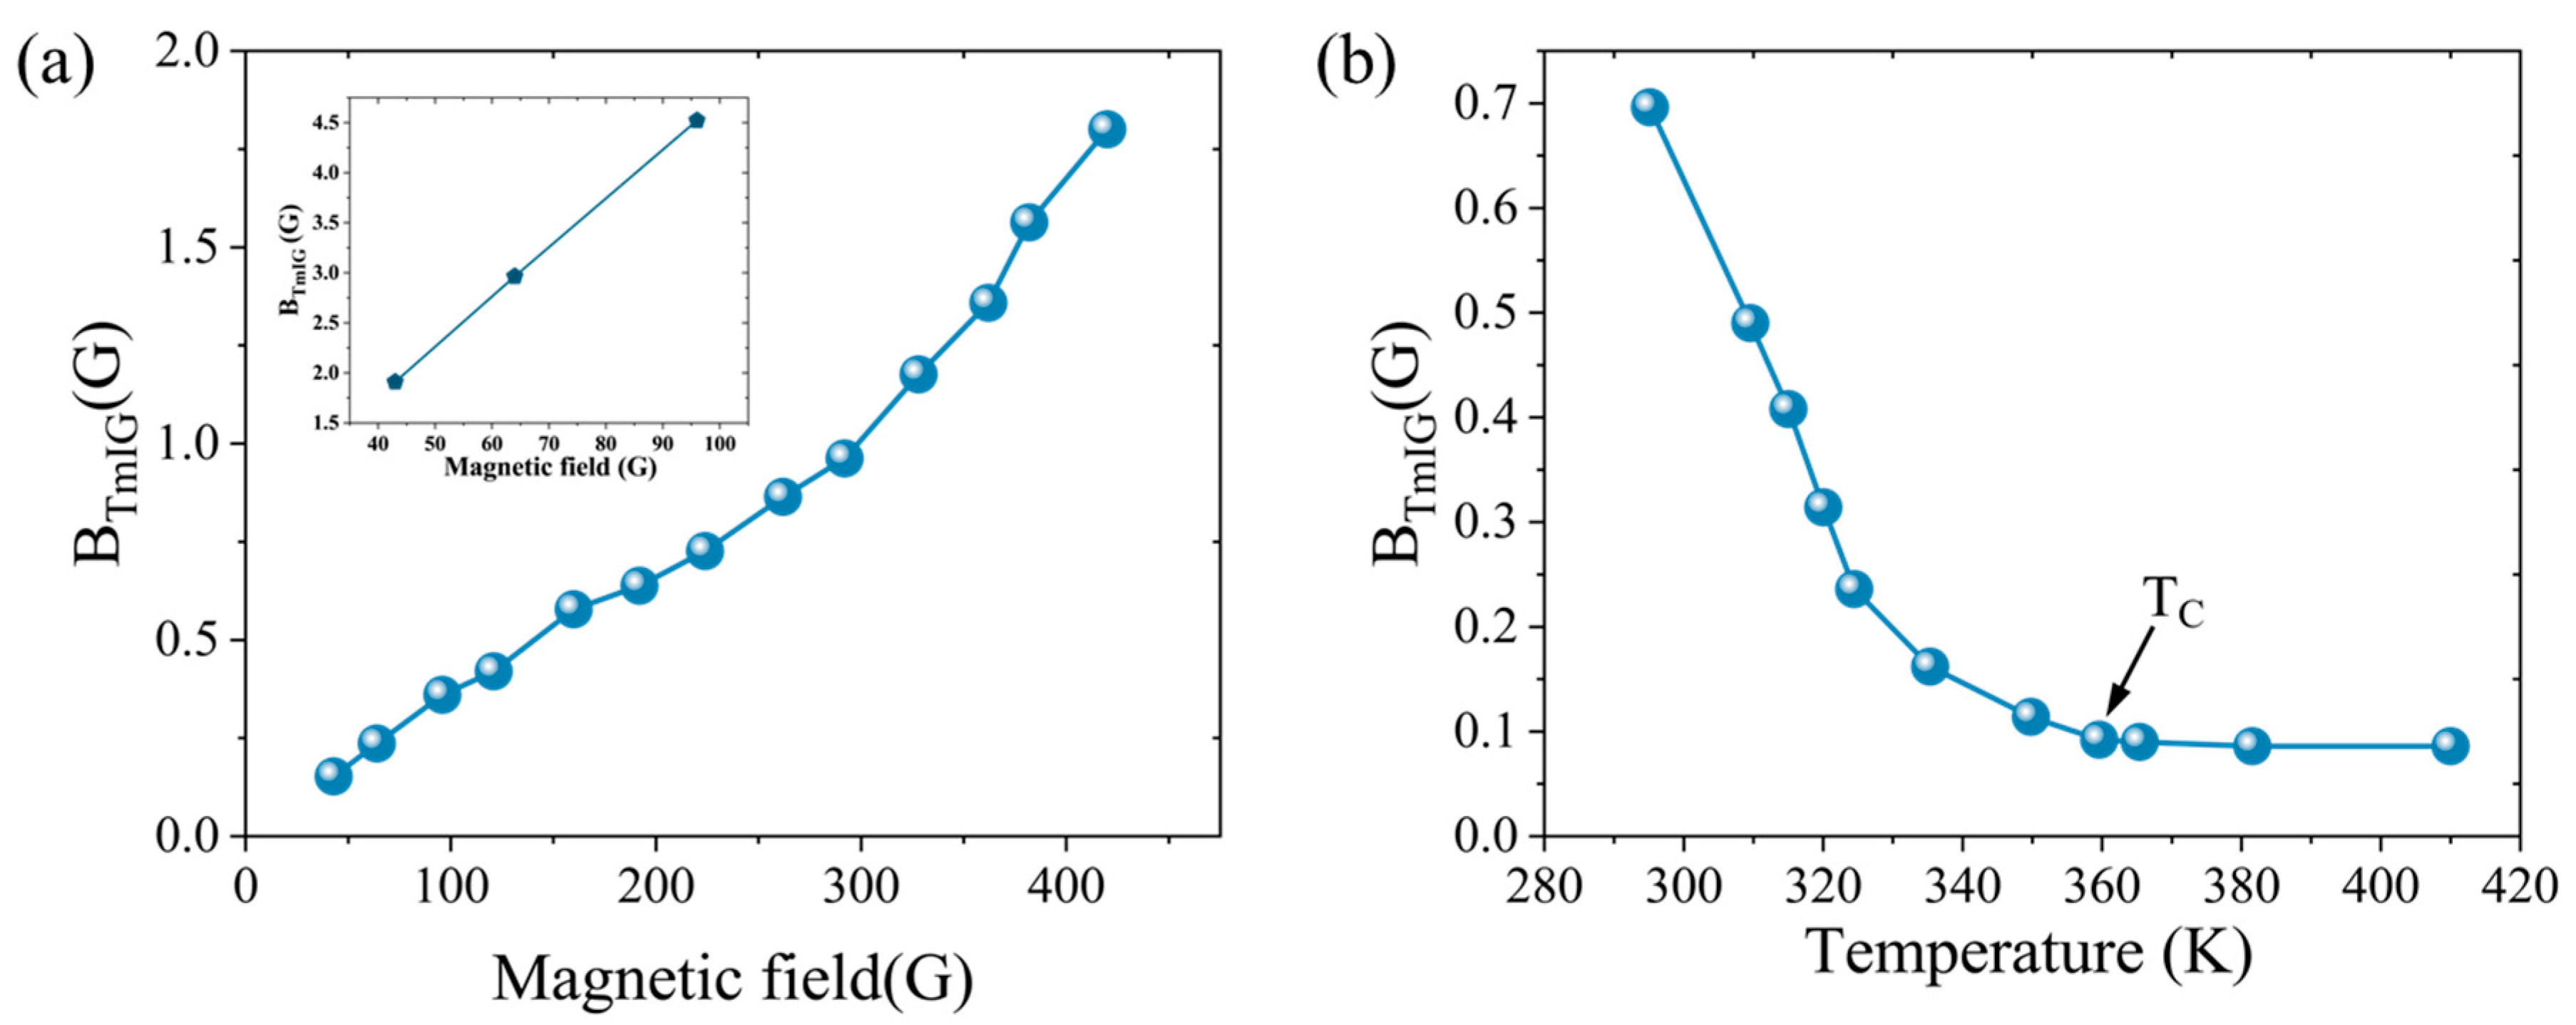
3.3.1. Local Static Magnetization Measurement via Diamond NV Centers

In this section, high-resolution local out-of-plane static magnetic field measurements of Tm3Fe5O12 thin films were performed using diamond NV center quantum probes. First, at room temperature, the local magnetic field distribution was recorded under various external magnetic fields, as shown in Figure 4a. As Btot increased, the out-of-plane magnetic field BTmIG monotonically increased, and exhibited a clear linear response in the weak field regime (Btot < 100 G), with the inset near zero field further emphasizing this linearity. These results confirm the capability of NV-based sensing for precise local magnetic field measurements in TmIG films.
Subsequently, under a fixed external field of Btot ≈ 250 G, the temperature dependence of the local magnetic field was measured, as shown in Figure 4b. With the temperature increasing from room temperature to around 360 K, the out-of-plane field dropped sharply from 0.7 G to about 0.05 G, indicating the ferromagnetic–paramagnetic transition. Above the Curie temperature, the residual local field remained at roughly 0.05 G. The measured data clearly captured the temperature evolution of local magnetization, laying a foundation for subsequent analysis of phase transition dynamics and fluctuation mechanisms.

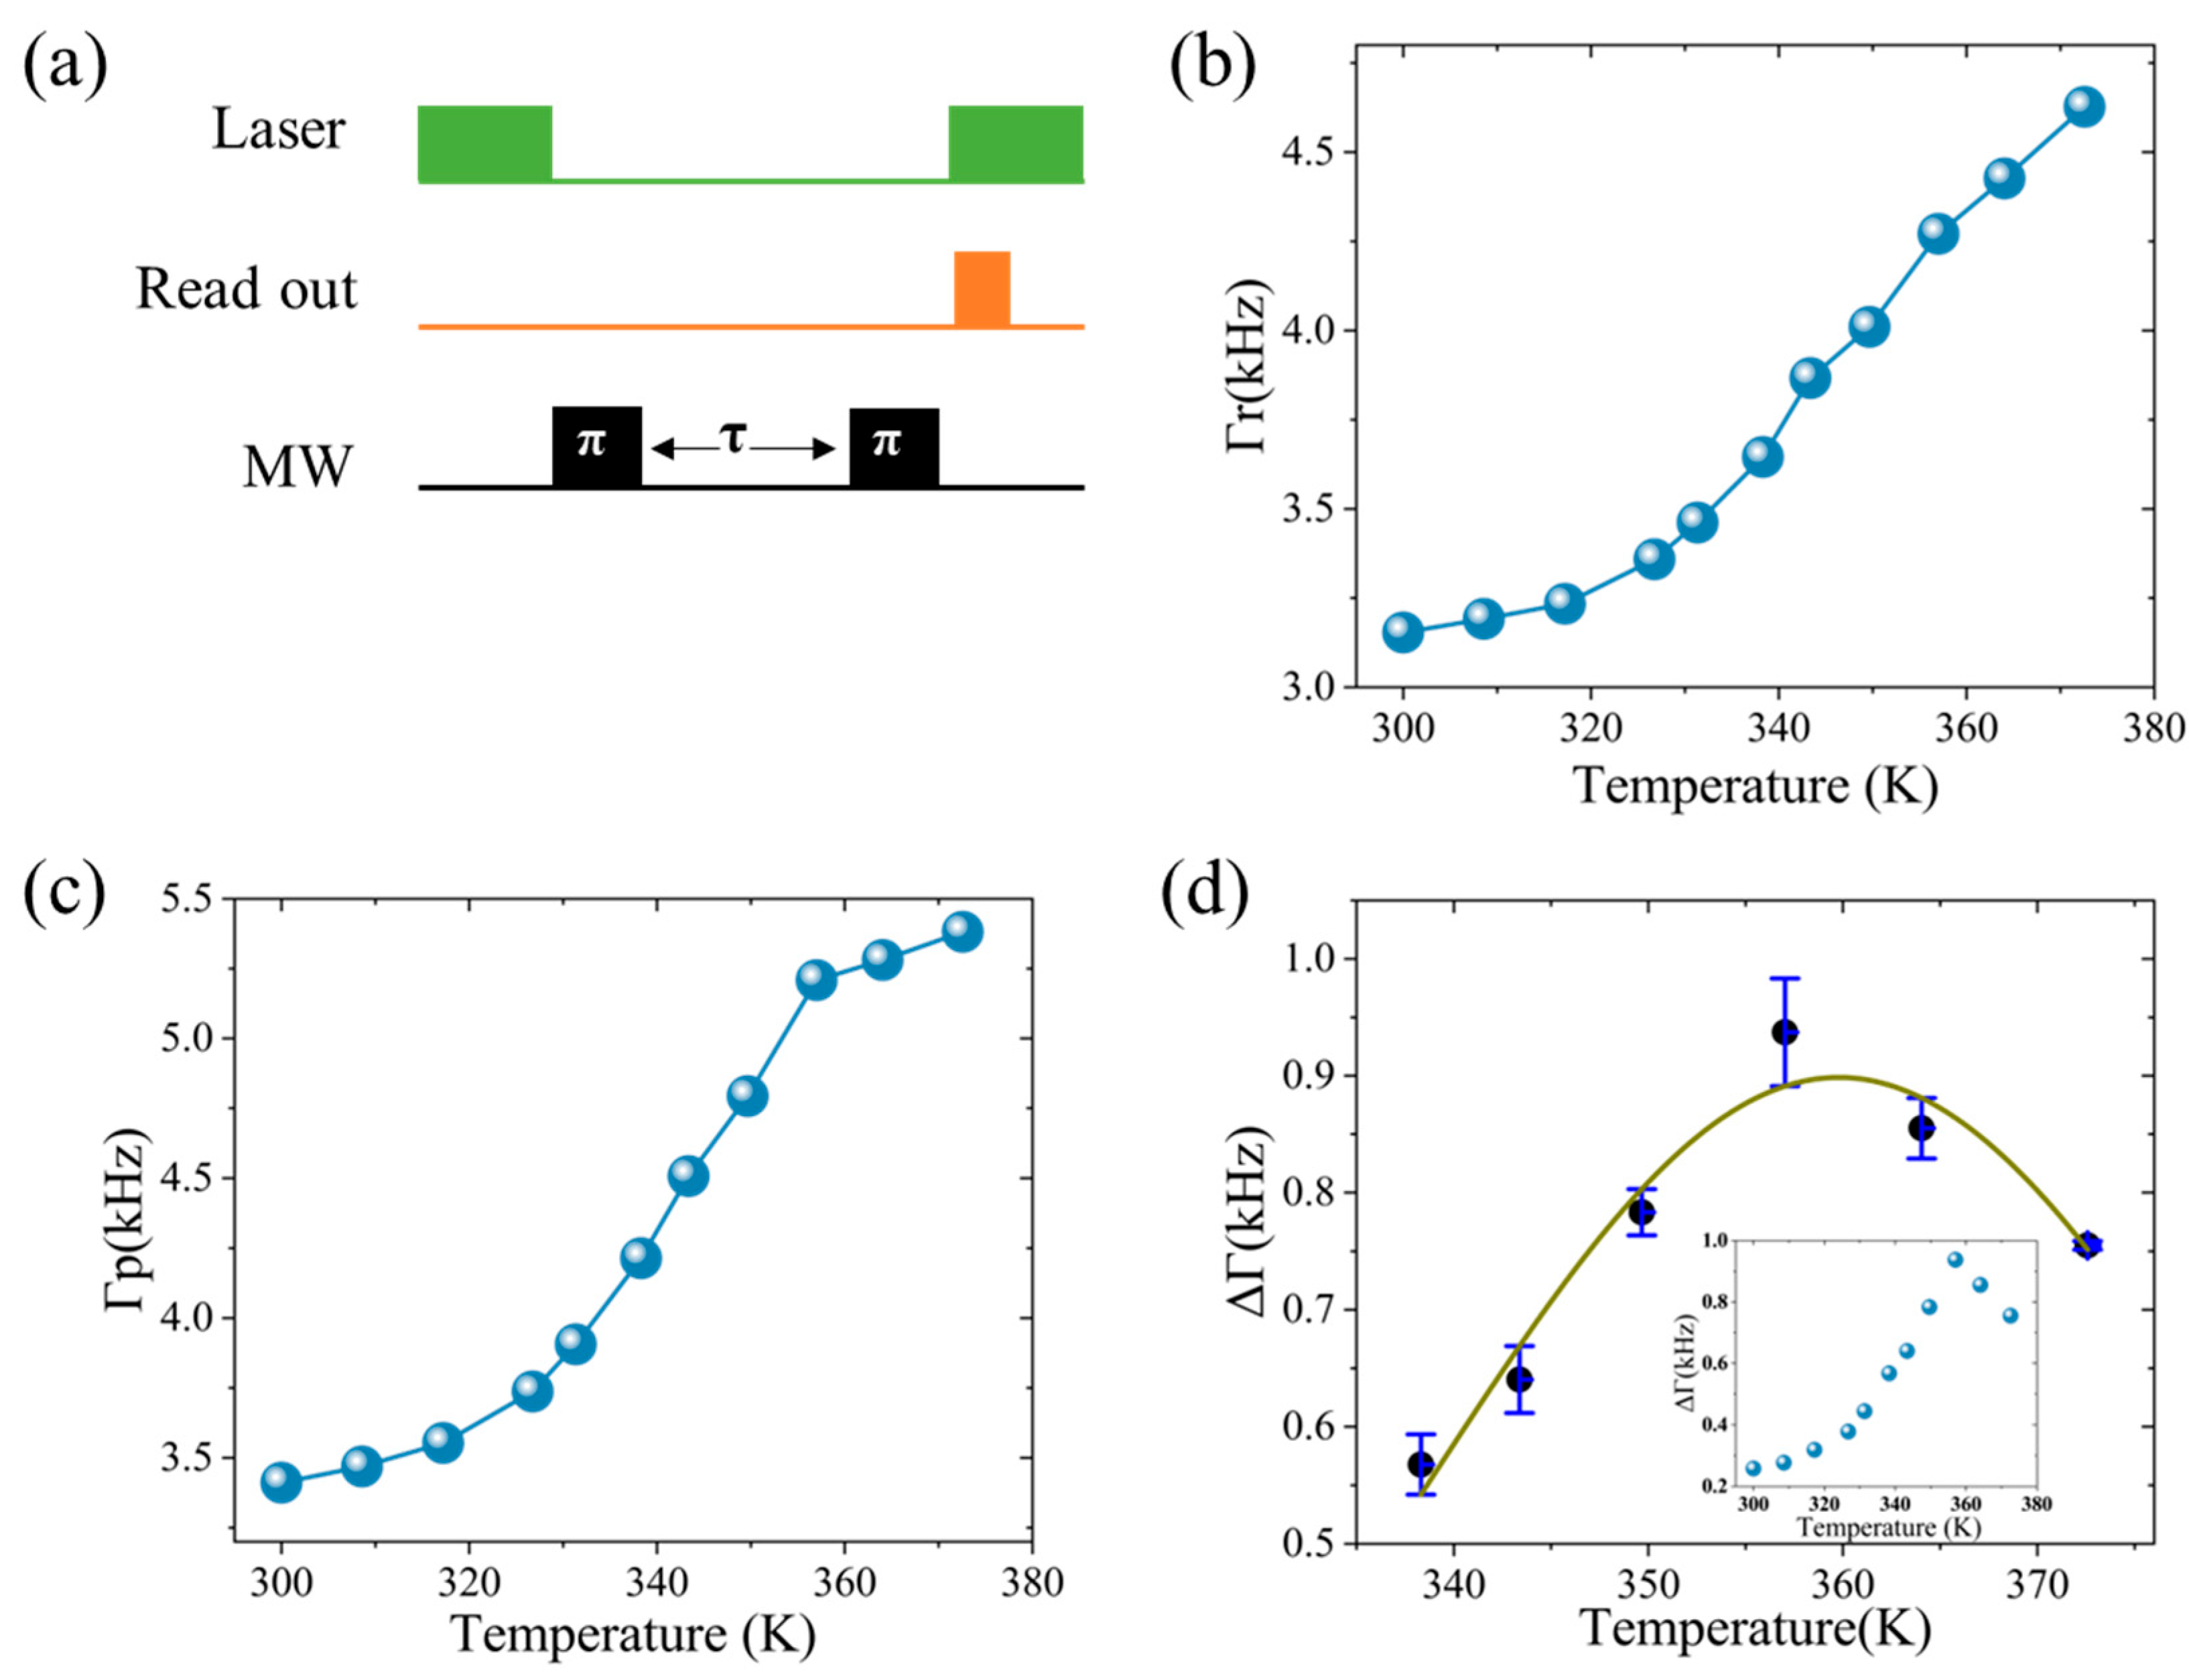
3.3.2. Detection of Critical Magnetic Fluctuations via NV Spin Relaxation

To investigate dynamic magnetic fluctuations, we employed NV-center-based T1 relaxometry based on T1 relaxation, which is exquisitely sensitive to low-frequency magnetic noise generated by fluctuating spins near the phase transition.
Figure 5a illustrates the employed T1 pulse sequence. We measured relaxation at both a probe location adjacent to the TmIG surface and at a remote reference under a constant external magnetic field. As shown in Figure 5b,c, the relaxation rate at the reference site (ΔΓr) increases moderately with temperature, consistent with phonon-mediated relaxation. At the probe site (ΔΓp), however, a pronounced peak appears near the Curie temperature (~360 K), significantly surpassing the reference values.
By subtracting the relaxation rate measured at the remote reference site (Γᵣ) from that near the TmIG sample surface (Γp), we obtained the net relaxation rate ΔΓ = Γr − Γp, isolating local magnetic fluctuations originating specifically from the TmIG film. Within the 300–340 K temperature range, ΔΓ varies modestly by about 0.3 kHz (see inset of Figure 5d for the full temperature span), indicating that magnetic fluctuations remain in a quasi-static equilibrium state. We focus on the critical region near the Curie temperature (340–375 K), where the finely resolved ΔΓ data in Figure 5d exhibit a pronounced peak.
This peak, occurring between 355 K and 365 K with a maximum near 360 K, closely aligns with the Curie temperature independently determined by MPMS measurements. The sharp increase in ΔΓ in this range signals enhanced local magnetic fluctuations, resulting in elevated low-frequency magnetic noise detected by the proximal NV centers and thereby causing a significant enhancement of their T1 spin relaxation.
To quantitatively analyze this behavior, the temperature-dependent net relaxation rate ΔΓ(T) within the critical region was fitted using a Gaussian fluctuation model described as follows:
Δ Γ T = Γ 0 exp T T c 2 σ 2
The fit yields a peak fluctuation rate Γ0 = 0.899 ± 0.026 kHz, a width parameter σ = 21.4 ± 1.9 K, and a critical temperature TC = 359.8 ± 1.1 K, with a goodness-of-fit R2 > 0.99. These results quantitatively confirm that critical magnetic fluctuations near the Curie temperature (TC) dominate the NV spin relaxation process in this temperature range. The uncertainties represent standard errors derived from the covariance matrix of the fit.
This result offers a quantitative probe of the dynamical critical behavior at the nanoscale: below TC, the fluctuations are suppressed due to long-range order; as TC is approached, slow collective spin fluctuations are strongly coupled to the NV centers, enhancing relaxation; and above TC, fluctuations decline with loss of magnetic order. Our findings provide compelling experimental evidence for local critical dynamics, with significant implications for fundamental studies and future device applications based on quantum magnetic sensing.

3.3.3. Measurement Reliability and Error Analysis

The primary source of uncertainty in static field measurements arises from the NV sensor’s magnetic field resolution (approximately ±0.3 μT), improved by repeated averaging. Temperature stability is ensured by tracking the zero-field splitting, with a measured thermal drift of less than 1.5 K/h and spatial localization errors below 0.5 μm. For NV spin relaxometry, repeated signal accumulation and background subtraction yield standard errors within 5–8%. The main sources of systematic error include laser and microwave intensity fluctuations, thermal gradient, and nanometer-scale inhomogeneity between the NV probe and sample interface. Nevertheless, the experimental uncertainty remains well below the magnitude of the observed magnetic signals, supporting the validity and reliability of the results.

4. Discussion

This work systematically applies noninvasive NV center-based quantum sensing to probe local static and dynamic magnetic properties of Tm3Fe5O12 thin films around their Curie temperature. The marked reduction in NV spin relaxation time (T1) observed in the critical region directly reflects enhanced spin fluctuations, consistent with established theories of diverging correlation lengths near second-order phase transitions [25,26]. By fitting the temperature-dependent relaxation rate with a Gaussian profile, we quantitatively demonstrate NV centers’ capability to detect locally amplified magnetic noise inherent to critical dynamics—offering microscopic insight into phase transition kinetics.
Electrical transport measurements reveal a pronounced resistivity upturn near 340 K, attributable to increased spin-disorder scattering, which is corroborated by magnetization and NV sensing results. This interplay highlights the intrinsic coupling between electron conduction and localized spin fluctuations [27,28]. Such findings extend our understanding of magneto-transport phenomena modulated by critical spin dynamics in high Curie temperature garnet films.
Compared to conventional bulk magnetometry (e.g., MPMS) or Hall effect measurements that provide volume-averaged or limited spatial information, NV magnetometry affords submicron spatial resolution (~360 nm) and dynamic sensitivity (~1.6 μT/√Hz), enabling direct visualization of local critical phenomena inaccessible to conventional techniques. We also note that magnetic force microscopy (MFM) is a widely used technique capable of nanoscale magnetic imaging with spatial resolution down to tens of nanometers [29,30]. However, MFM typically lacks quantitative field sensitivity and can be invasive to delicate magnetic samples, whereas NV magnetometry offers noninvasive, quantitative, and dynamic measurements under ambient conditions.
However, we acknowledge that our current configuration does not permit wide-field imaging or systematic spatial mapping of local magnetic fields, either laterally across the film or as a function of probe depth. Such advanced capabilities—achievable in wide-field or scanning-probe NV platforms—provide even clearer demonstrations of spatial resolution and magnetic field gradients [31,32]. Despite these limitations, our confocal NV approach allows for high-sensitivity, site-specific measurements with spatial detail several orders of magnitude finer than traditional volume-averaged methods. Future integration of advanced NV-based imaging modalities may enable real-time 2D/3D mapping of local magnetic textures and further clarify nanoscale magnetic phase phenomena.
Below is a comparison of the multidimensional performance parameters of different magnetic characterization techniques (see Table 1). The table details the detection dimensions, spatial resolution, response times, and technical advantages of MPMS, Hall effect, and NV center methods. This comparison helps readers gain a clearer understanding of the applicable scenarios and limitations of each technique.
The integration of nanoscale quantum sensing with macroscopic characterization methods opens new avenues for probing complex magnetic heterostructures. As NV sensor technology advances, future studies can further explore spin dynamics, topological magnetism, and quantum materials under diverse conditions.

5. Conclusions

In conclusion, this work demonstrates that diamond nitrogen-vacancy (NV) center quantum sensing offers a highly precise and sensitive platform for investigating local dynamic magnetic fluctuations in Tm3Fe5O12 thin films near their Curie temperature. By combining NV-based quantum magnetometry with conventional bulk techniques such as MPMS and Hall effect measurements, we reveal microscopic magnetic phase transition mechanisms typically hidden in bulk-averaged characterizations, advancing our understanding of nanoscale ferromagnetic dynamics. This study paves the way for employing quantum sensing in exploring complex magnetic heterostructures and optimizing spintronic device architectures. Future improvements in NV sensor technology and multimodal measurement integration will further enhance sensitivity, spatial resolution, and the scope of applications within condensed matter physics.

Author Contributions

Methodology, validation, data curation, visualization, writing—original draft, Y.Z.; Investigation, data curation, M.C.; Methodology, Q.Z.; Investigation, P.W.; Methodology, Y.Y.; Methodology, J.Z.; supervision, project administration, W.Z.; writing—review and editing, supervision, project administration, G.W. All authors have read and agreed to the published version of the manuscript.

Funding

This research was funded by the National Natural Science Foundation of China (Grant Nos. 11374280 and 50772110).

Data Availability Statement

The original contributions presented in this study are included in the article; further inquiries can be directed to the corresponding author.

Acknowledgments

This work was partially carried out at the USTC Center for Micro and Nanoscale Research and Fabrication.

Conflicts of Interest

The authors declare no conflicts of interest.

Abbreviations

The following abbreviations are used in this manuscript:
SQUIDSuperconducting Quantum Interference Device
MFMMagnetic force microscopy
MPMSMagnetic Property Measurement System

References

  1. Gao, F.; Peng, Y.G.; Xiang, X.; Ni, X.; Zheng, C.; Yves, S.; Zhu, X.-F.; Alù, A. Acoustic higher-order topological insulators induced by orbital interactions. Adv. Mater. 2024, 36, 2312421. [Google Scholar] [CrossRef] [PubMed]
  2. Gao, C.; Chen, P.H.; Alaniva, N.; Björgvinsdóttir, S.; Pagonakis, I.; Däpp, A.; Urban, M.; Gunzenhauser, R.; Barnes, A. 23 Tesla high temperature superconducting pocket magnet. Supercond. Sci. Technol. 2024, 37, 065018. [Google Scholar] [CrossRef]
  3. Jia, Y.; Liang, Z.; Pan, H.; Wang, Q.; Lv, Q.; Yan, Y.; Jin, F.; Hou, D.; Wang, L.; Wu, W. Bismuth doping enhanced tunability of strain-controlled magnetic anisotropy in epitaxial Y3Fe5O12 (111) films. Chin. Phys. B 2023, 32, 027501. [Google Scholar] [CrossRef]
  4. Li, X.; Zhu, M.; Wang, Y.; Zheng, F.; Dong, J.; Zhou, Y.; You, L.; Zhang, J. Tremendous tunneling magnetoresistance effects based on van der Waals room-temperature ferromagnet Fe3GaTe2 with highly spin-polarized Fermi surfaces. Appl. Phys. Lett. 2023, 122, 082408. [Google Scholar] [CrossRef]
  5. Kiechle, M.; Papp, A.; Mendisch, S.; Ahrens, V.; Golibrzuch, M.; Bernstein, G.H.; Porod, W.; Csaba, G.; Becherer, M. Spin-wave optics in YIG realized by ion-beam irradiation. Small 2023, 19, 2207293. [Google Scholar] [CrossRef]
  6. Guo, S.; Russell, D.; Lanier, J.; Da, H.; Hammel, P.C.; Yang, F. Strong on-chip microwave photon–magnon coupling using ultralow-damping epitaxial Y3Fe5O12 films at 2 K. Nano Lett. 2023, 23, 5055–5060. [Google Scholar] [CrossRef]
  7. Ding, J.; Liu, C.; Zhang, Y.; Erugu, U.; Quan, Z.; Yu, R.; McCollum, E.; Mo, S.; Yang, S.; Ding, H.; et al. Nanometer-thick yttrium iron garnet films with perpendicular anisotropy and low damping. Phys. Rev. Appl. 2020, 14, 014017. [Google Scholar] [CrossRef]
  8. Liang, Z.; Lu, J.; Yang, S.; Fang, Z.; Yan, Y.; Wang, Q.; Li, P.; Fan, M.; Wang, L. Enhancement of perpendicular magnetic anisotropy in Tm3Fe5O12 (111) epitaxial films via synergistic stoichiometry and strain engineering. Adv. Funct. Mater. 2024, 34, 2315147. [Google Scholar] [CrossRef]
  9. Balasubramanian, G.; Chan, I.Y.; Kolesov, R.; Al-Hmoud, M.; Tisler, J.; Shin, C.; Kim, C.; Wojcik, A.; Hemmer, P.R.; Krueger, A.; et al. Nanoscale imaging magnetometry with diamond spins under ambient conditions. Nature 2008, 455, 648–651. [Google Scholar] [CrossRef]
  10. Irfan, M.; Dogan, N.; Bingolbali, A.; Aliew, F. Synthesis and characterization of NiFe2O4 magnetic nanoparticles with different coating materials for magnetic particle imaging (MPI). J. Magn. Magn. Mater. 2021, 537, 168150. [Google Scholar] [CrossRef]
  11. Childress, L.; Gurudev Dutt, M.V.; Taylor, J.M.; Zibrov, A.S.; Jelezko, F.; Wrachtrup, J.; Hemmer, P.R.; Lukin, M.D. Coherent dynamics of coupled electron and nuclear spin qubits in diamond. Science 2006, 314, 281–285. [Google Scholar] [CrossRef] [PubMed]
  12. Hurt, D.; Li, S.; Amann, A. Versatile SQUID susceptometer with multiple measurement modes. IEEE Trans. Magn. 2013, 49, 3541–3544. [Google Scholar] [CrossRef]
  13. Monge, R.; Delord, T.; Proscia, N.V.; Shotan, Z.; Jayakumar, H.; Henshaw, J.; Zangara, P.R.; Lozovoi, A.; Pagliero, D.; Esquinazi, P.D.; et al. Spin dynamics of a solid-state qubit in proximity to a superconductor. Nano Lett. 2023, 23, 422–428. [Google Scholar] [CrossRef]
  14. Zhou, J.; Lu, H.; Chen, D.; Huang, M.; Yan, G.Q.; Al-matouq, F.; Chang, J.; Djugba, D.; Jiang, Z.; Wang, H.; et al. Sensing spin wave excitations by spin defects in few-layer-thick hexagonal boron nitride. Sci. Adv. 2024, 10, eadk8495. [Google Scholar] [CrossRef]
  15. Wang, J.F.; Liu, L.; Liu, X.D.; Li, Q.; Cui, J.-M.; Zhou, D.-F.; Zhou, J.-Y.; Wei, Y.; Xu, H.-A.; Xu, W.; et al. Magnetic detection under high pressures using designed silicon vacancy centres in silicon carbide. Nat. Mater. 2023, 22, 489–494. [Google Scholar] [CrossRef]
  16. Delnour, N.; Bissonnette, A.; Eleuch, H.; MacKenzie, R.; Hilke, M. Scanning qubit probe of edge states in a topological insulator. Phys. Lett. A 2023, 466, 128716. [Google Scholar] [CrossRef]
  17. Mathes, N.; Comas, M.; Bleul, R.; Everaert, K.; Hermle, T.; Wiekhorst, F.; Knittel, P.; Sperling, R.A.; Vidal, X. Nitrogen-vacancy center magnetic imaging of Fe3O4 nanoparticles inside the gastrointestinal tract of Drosophila melanogaster. Nanoscale Adv. 2024, 6, 247–255. [Google Scholar] [CrossRef]
  18. Carmiggelt, J.J.; Bertelli, I.; Mulder, R.W.; Teepe, A.; Elyasi, M.; Simon, B.G.; Bauer, G.E.W.; Blanter, Y.M.; van der Sar, T. Broadband microwave detection using electron spins in a hybrid diamond-magnet sensor chip. Nat. Commun. 2023, 14, 490. [Google Scholar] [CrossRef]
  19. Yu, R.; Cao, J.; Liu, H.; Zhu, F.; Meng, X.; Long, Z.; Li, J.; Wang, Y. Pure Spin Transport in YIG Films with Amorphous-to-Crystalline Transformation. Adv. Phys. Res. 2024, 3, 2300147. [Google Scholar] [CrossRef]
  20. Doherty, M.W.; Manson, N.B.; Delaney, P.; Jelezko, F.; Wrachtrup, J.; Hollenberg, L.C.L. The nitrogen-vacancy colour centre in diamond. Phys. Rep. 2013, 528, 1–45. [Google Scholar] [CrossRef]
  21. Abe, E.; Sasaki, K. Tutorial: Magnetic resonance with nitrogen-vacancy centers in diamond—Microwave engineering, materials science, and magnetometry. J. Appl. Phys. 2018, 123, 161101. [Google Scholar] [CrossRef]
  22. Ganose, A.M.; Jain, A. Robocrystallographer: Automated crystal structure text descriptions and analysis. MRS Commun. 2019, 9, 874–881. [Google Scholar] [CrossRef]
  23. Vilela, G.; Chi, H.; Stephen, G.; Settens, C.; Zhou, P.; Ou, Y.; Suri, D.; Heiman, D.; Moodera, J.S. Strain-tuned magnetic anisotropy in sputtered thulium iron garnet ultrathin films and TIG/Au/TIG valve structures. J. Appl. Phys. 2020, 127, 115302. [Google Scholar] [CrossRef]
  24. Lehmann-Szweykowska, A.; Wojciechowski, R.; Pust, L.; Wigen, P.E.; Batra, S. Compensating holes in Ca2⁺-doped yttrium iron garnet and their influence on magnetic properties of the system. Phys. Rev. B 1991, 43, 3500–3509. [Google Scholar] [CrossRef]
  25. Huang, M.; Sun, Z.; Yan, G.; Xie, H.; Agarwal, N.; Ye, G.; Sung, S.H.; Lu, H.; Zhou, J.; Yan, S.; et al. Revealing intrinsic domains and fluctuations of moiré magnetism by a wide-field quantum microscope. Nat. Commun. 2023, 14, 5259. [Google Scholar] [CrossRef]
  26. Wang, H.; Zhang, S.; McLaughlin, N.J.; Flebus, B.; Huang, M.; Xiao, Y.; Liu, C.; Wu, M.; Fullerton, E.E.; Tserkovnyak, Y.; et al. Noninvasive measurements of spin transport properties of an antiferromagnetic insulator. Sci. Adv. 2022, 8, eabg8562. [Google Scholar] [CrossRef]
  27. Liu, Q.B.; Meng, K.K.; Xu, Z.D.; Zhu, T.; Xu, X.G.; Miao, J.; Jiang, Y. Unusual anomalous Hall effect in perpendicularly magnetized YIG films with a small Gilbert damping constant. Phys. Rev. B 2020, 101, 174431. [Google Scholar] [CrossRef]
  28. Novák, V.; Olejník, K.; Wunderlich, J.; Cukr, M.; Výborný, K.; Rushforth, A.W.; Edmonds, K.W.; Campion, R.P.; Gallagher, B.L.; Sinova, J.; et al. Curie point singularity in the temperature derivative of resistivity in (Ga, Mn) As. Phys. Rev. Lett. 2008, 101, 077201. [Google Scholar] [CrossRef]
  29. Ramaswamy, S.; Rajan, G.K.; Gopalakrishnan, C.; Ponnavaikko, M. Study of magnetization reversal of uniaxial Ni nanodots by magnetic force microscopy and vibrating sample magnetometer. J. Appl. Phys. 2010, 107, 09A331. [Google Scholar] [CrossRef]
  30. Li, X.; Lu, W.; Song, Y.; Wang, Y.; Chen, A.; Yan, B.; Yoshimura, S.; Saito, H. Quantitatively probing the magnetic behavior of individual nanoparticles by an AC field-modulated magnetic force microscopy. Sci. Rep. 2017, 7, 22467. [Google Scholar] [CrossRef]
  31. Maletinsky, P.; Hong, S.; Grinolds, M.S.; Hausmann, B.; Lukin, M.D.; Walsworth, R.L.; Loncar, M.; Yacoby, A. A robust scanning diamond sensor for nanoscale imaging with single nitrogen-vacancy centres. Nat. Nanotechnol. 2012, 7, 320–324. [Google Scholar] [CrossRef]
  32. Rondin, L.; Tetienne, J.-P.; Hingant, T.; Roch, J.-F.; Maletinsky, P.; Jacques, V. Magnetometry with nitrogen-vacancy defects in diamond. Rep. Prog. Phys. 2014, 77, 056503. [Google Scholar] [CrossRef]
Figure 1. Schematic of the experimental setup and diamond NV level structure. (a) A diamond with NV centers is placed on a thulium iron garnet (Tm3Fe5O12, thickness: 20 nm) thin film. A 532 nm green laser with a power of 0.8 mW is used, and red fluorescence is collected through the same objective. Microwave (MW) radiation is generated through a microwave line, and a neodymium iron boron permanent magnet provides the external magnetic field. Inset: atomic structure of the NV centers in the diamond; (b) initialization and readout of the NV spin are achieved through green laser excitation and red photoluminescence (PL) detection. There are two pathways for returning from the excited state to the ground state: one is direct radiative fluorescence to the ground state, and the other is returning to the ground state through an intermediate state without radiating fluorescence. The electronic spin ground state of the NV center is a triplet with spin quantum numbers ms = 0 and ms = ±1.
Micromachines 16 00643 g001
Figure 2. Structural and compositional characterization of Tm3Fe5O12/Gd3Ga5O12(111) thin films. (a) XRD 2θ–ω scan; (b) EDS elemental composition analysis; and (c) SEM-EDS elemental mapping.
Micromachines 16 00643 g002
Figure 3. Magnetic and electrical transport properties of Tm3Fe5O12. (a) M-H curve at 300 K. The inset shows an enlarged view around the coercive field. The arrow in the inset indicates the intercept on the horizontal axis, corresponding to the coercivity (Hc) of 35 Oe; (b) the M-T curve at 5000 Oe. The arrow indicates the position of the estimated Curie temperature (TC). Note: The difference in absolute magnetization values between M-H and M-T measurements is due to variations in sample mounting and experimental procedure, as detailed in Section 2.2; (c) schematic diagram of the Tm3Fe5O12 Hall bar device; and (d) longitudinal resistivity versus temperature for the Tm3Fe5O12 Hall bar device, where TK represents the Kondo temperature.
Micromachines 16 00643 g003
Figure 4. Field and temperature dependence of Tm3Fe5O12 magnetization detected by NV centers. (a) Variation in BTmIG with external magnetic field strength (inset shows a magnified view near zero fields); (b) dependence of BTmIG on temperature. The arrow indicates the position of the Curie temperature (TC).
Micromachines 16 00643 g004
Figure 5. Detection of magnetic spin fluctuations in Tm3Fe5O12 using spin relaxation. (a) Schematic of T1 spin relaxation pulse sequence used for probing magnetic fluctuations (MW: microwave); (b) temperature-dependent relaxation rate measured at a reference location away from the sample; (c) relaxation rate at the NV probe site adjacent to the TmIG film; and (d) net relaxation rate with Gaussian fit in the critical region (inset: variation in the net relaxation rate over the full temperature range).
Micromachines 16 00643 g005
Table 1. Comparison of multidimensional performance parameters of magnetic characterization techniques.
TechniqueMPMSHall EffectNV CentersMFM
Detection dimensionEntire volumePoint-to-point electrodeSurface localSurface local
Spatial resolutionMillimeter scaleMicrometer scale~360 nm<10 nm
Response timeStaticStaticDynamicStatic
Information typeAverage magnetizationOut-of-plane magnetizationMagnetic noise/imagingSurface magnetic structure
AdvantagesMature, reliable, high-sensitivityDirect electrical signalNon-contact, high spatial resolution, and dynamicUltra-high spatial resolution, surface mapping
Disclaimer/Publisher’s Note: The statements, opinions and data contained in all publications are solely those of the individual author(s) and contributor(s) and not of MDPI and/or the editor(s). MDPI and/or the editor(s) disclaim responsibility for any injury to people or property resulting from any ideas, methods, instructions or products referred to in the content.

